


Features
- 5 Unique slides
- Fully editable and easy to edit in Microsoft Powerpoint, Keynote and Google Slides
- 16:9 widescreen layout
- Clean and professional designs
- Export to JPG, PDF or send by email


Do you have any questions?
Recommend


5 slides
Safety Compliance Overview Presentation
Keep your organization protected and compliant with this modern and visual presentation design. Ideal for outlining safety protocols, training programs, and regulatory standards, it helps simplify complex processes into clear, engaging visuals. Fully customizable and compatible with PowerPoint, Keynote, and Google Slides for professional and polished presentations.


5 slides
Big Data Infrastructure Planning Presentation
Build your big data strategy step-by-step with this clean and visual planning template. Designed to map out the key gears of infrastructure—from hardware to storage and cloud integration—it’s a powerful tool for IT leaders and tech teams. Fully editable and works with PowerPoint, Keynote, and Google Slides.


6 slides
Europe Education Map Infographics
Explore our versatile Europe Education Map infographic template, a valuable resource for visualizing the educational landscape across the continent of Europe. This template is fully compatible with popular presentation software such as PowerPoint, Keynote, and Google Slides, allowing you to effortlessly customize it to meet your specific needs. The Europe Education Map infographic template provides a solid foundation for illustrating data related to educational institutions, literacy rates, and academic trends throughout Europe. Whether you're an educator, researcher, or interested in European education, this template offers a user-friendly platform to create informative presentations and educational materials. Impress your audience with this SEO-optimized Europe Education Map infographic template, designed for clarity and ease of use. Customize it to showcase educational opportunities, achievements, and regional insights, making it a valuable asset for your projects and presentations. Begin crafting your personalized infographic today!


21 slides
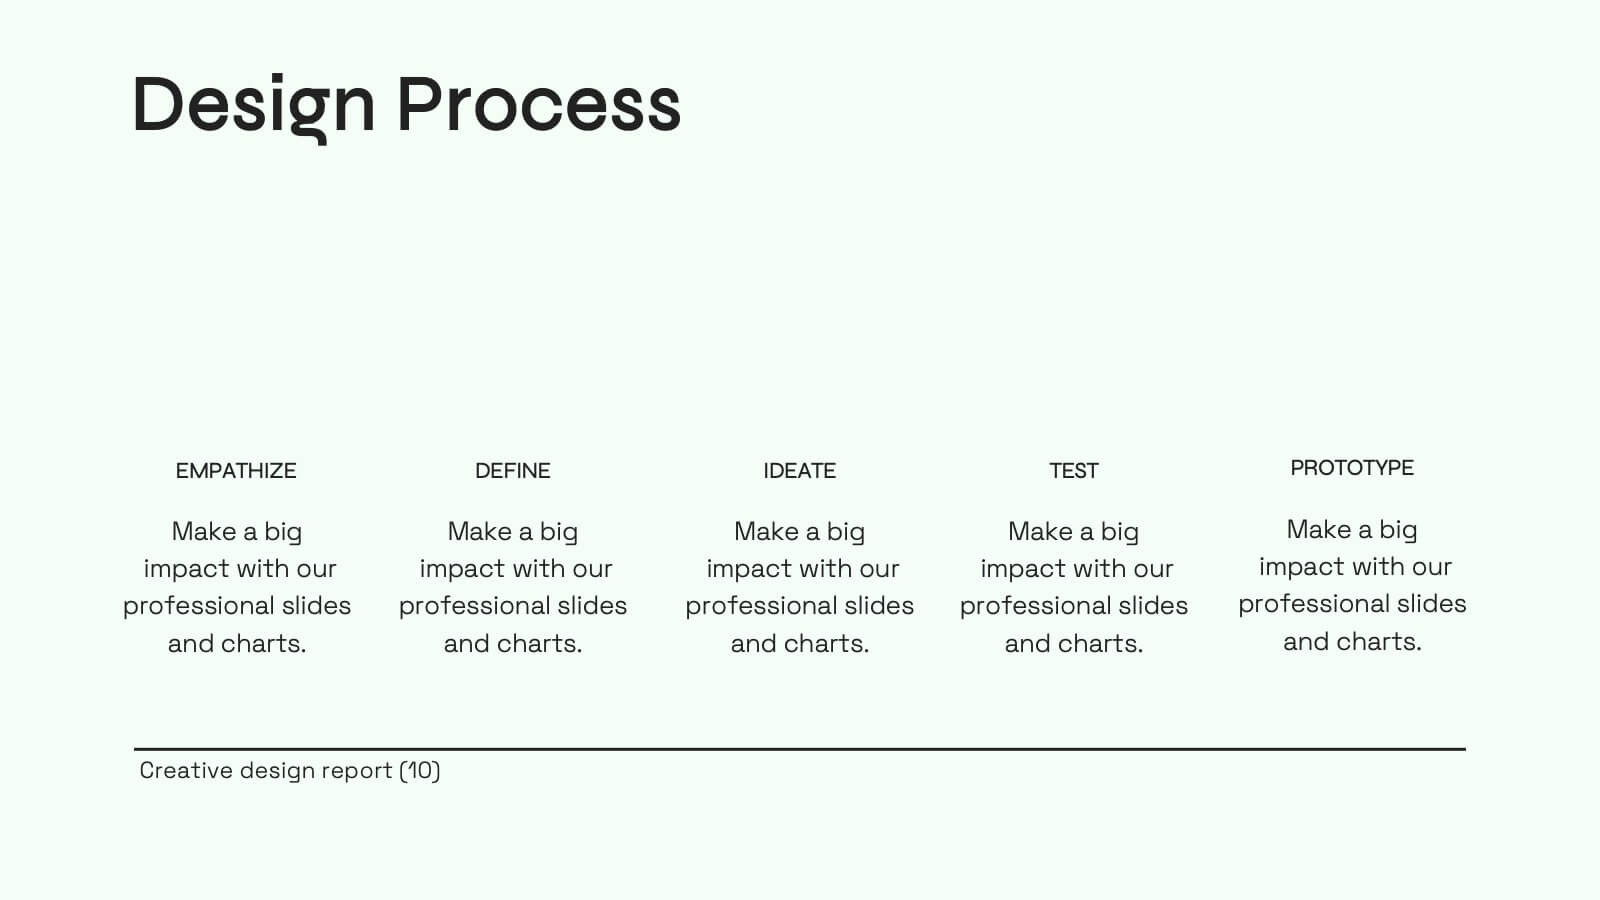
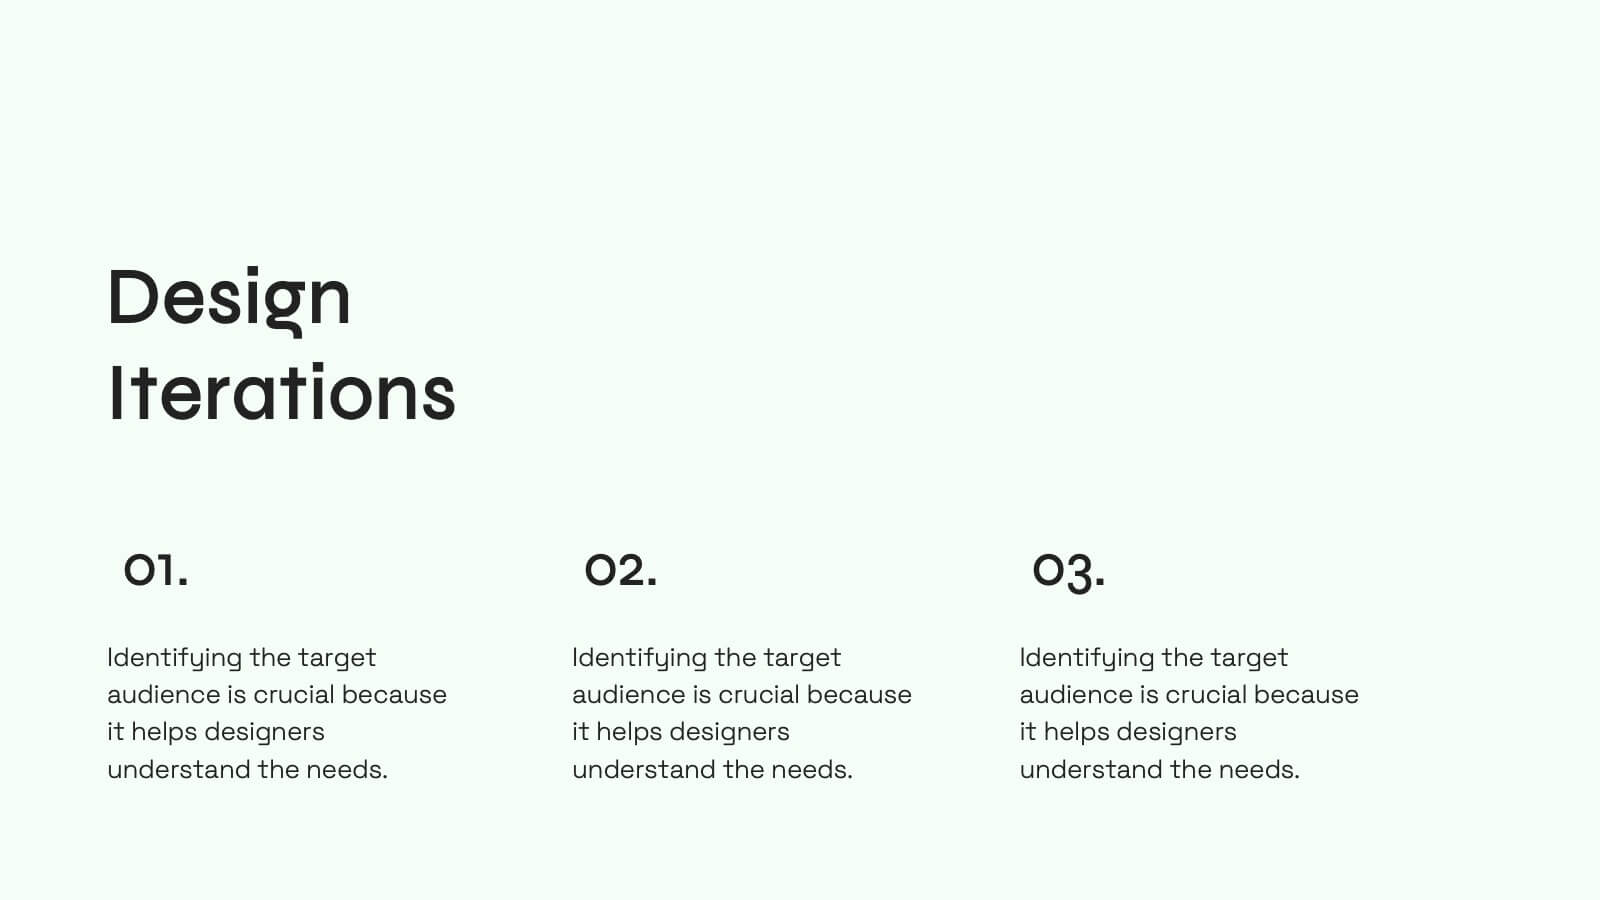
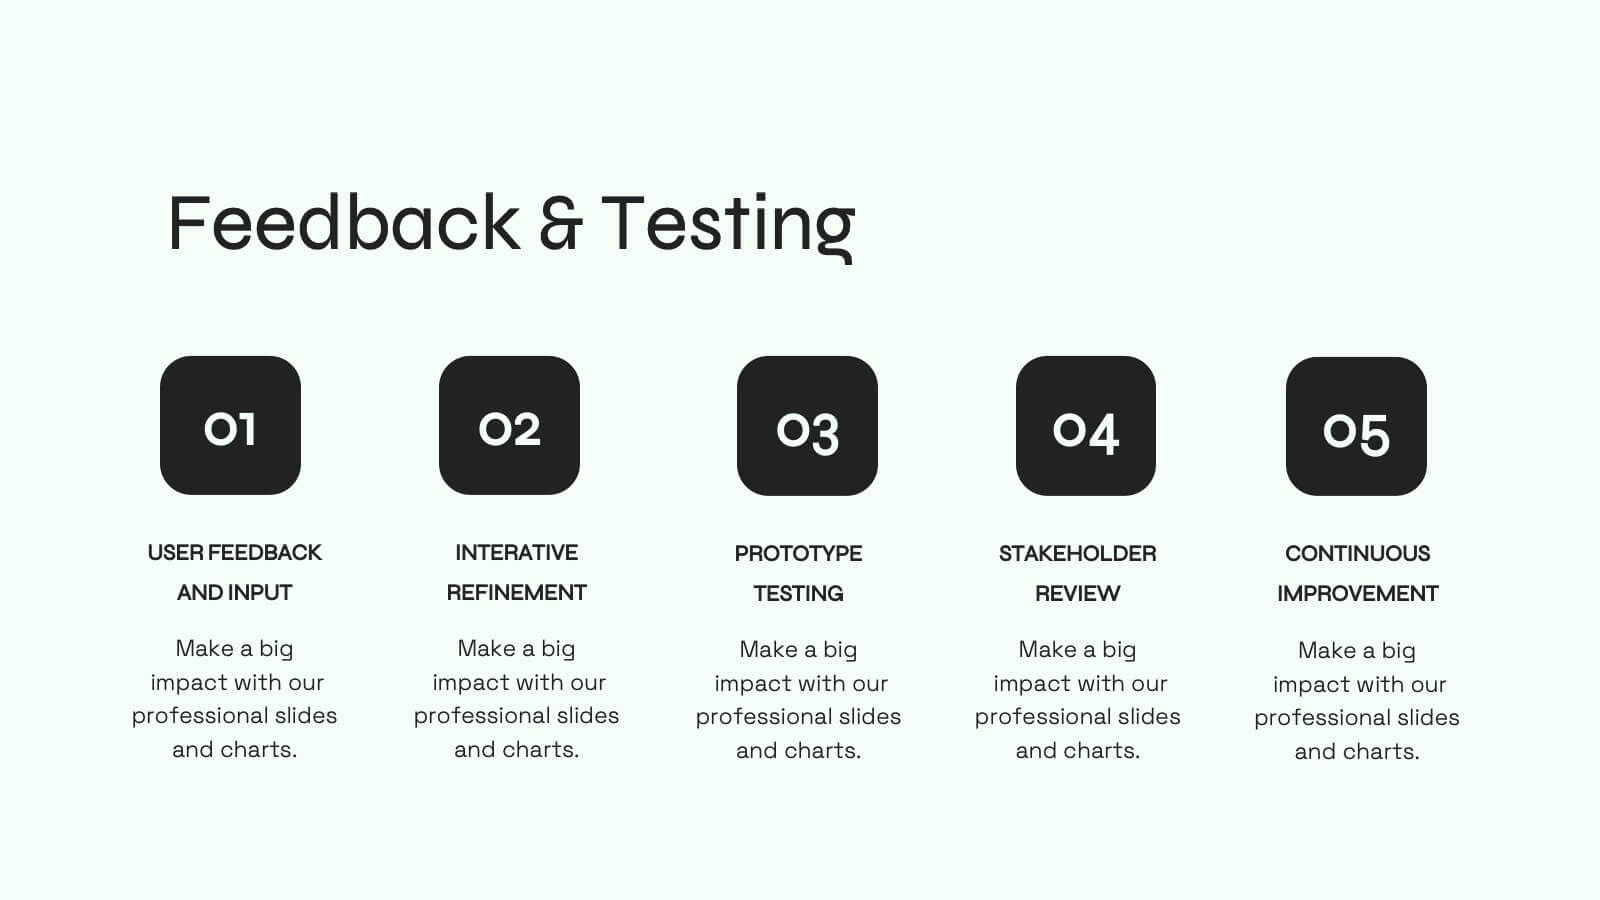
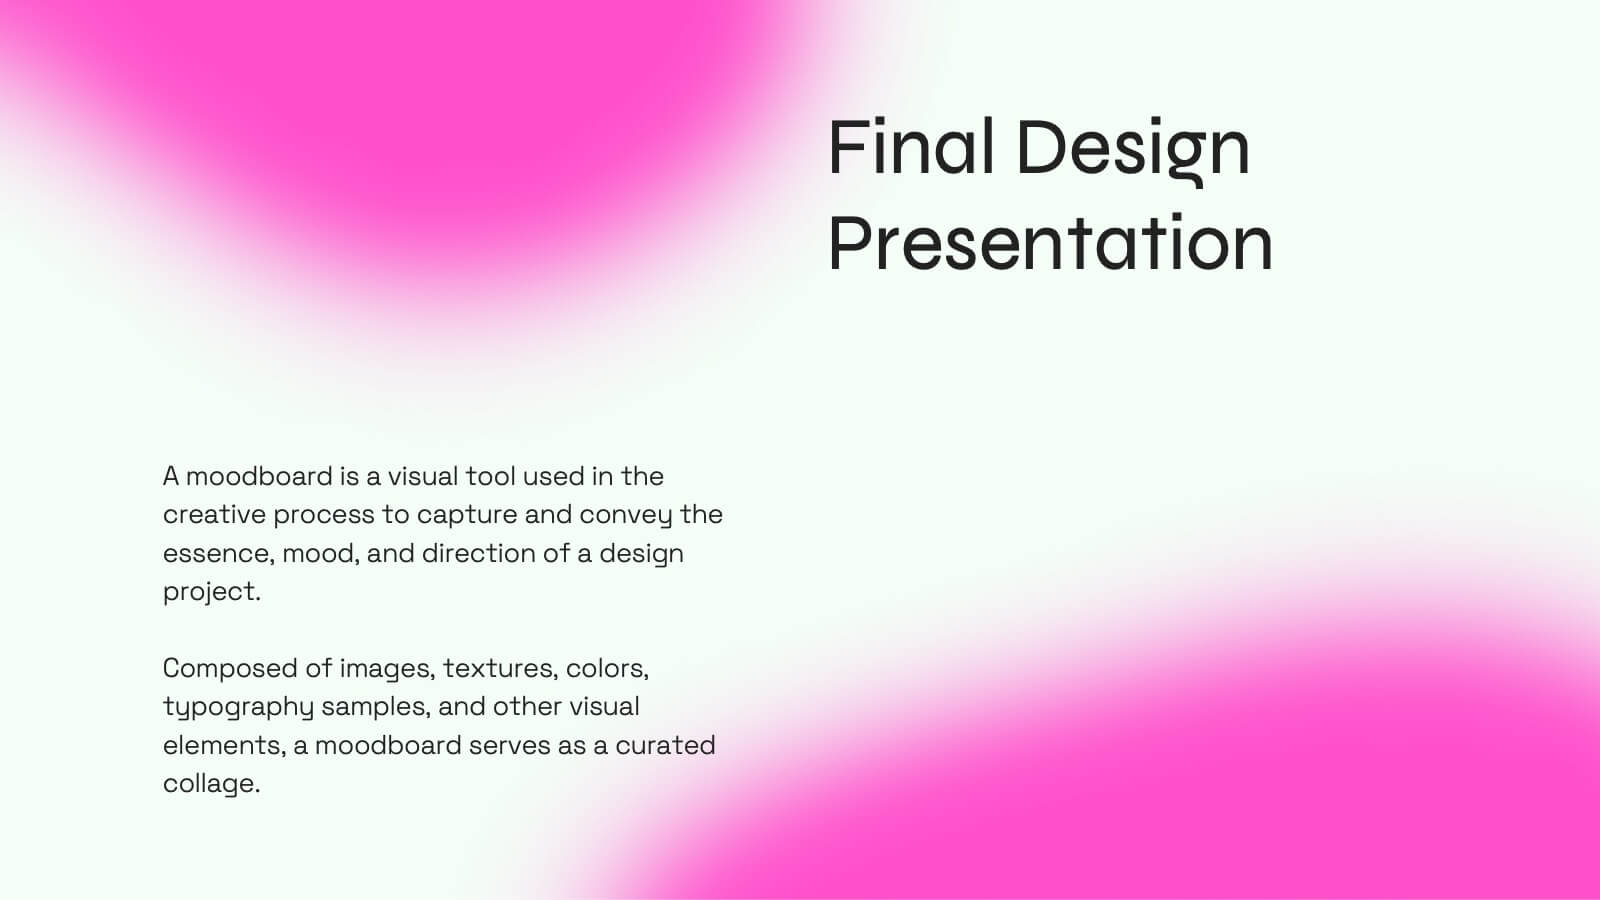
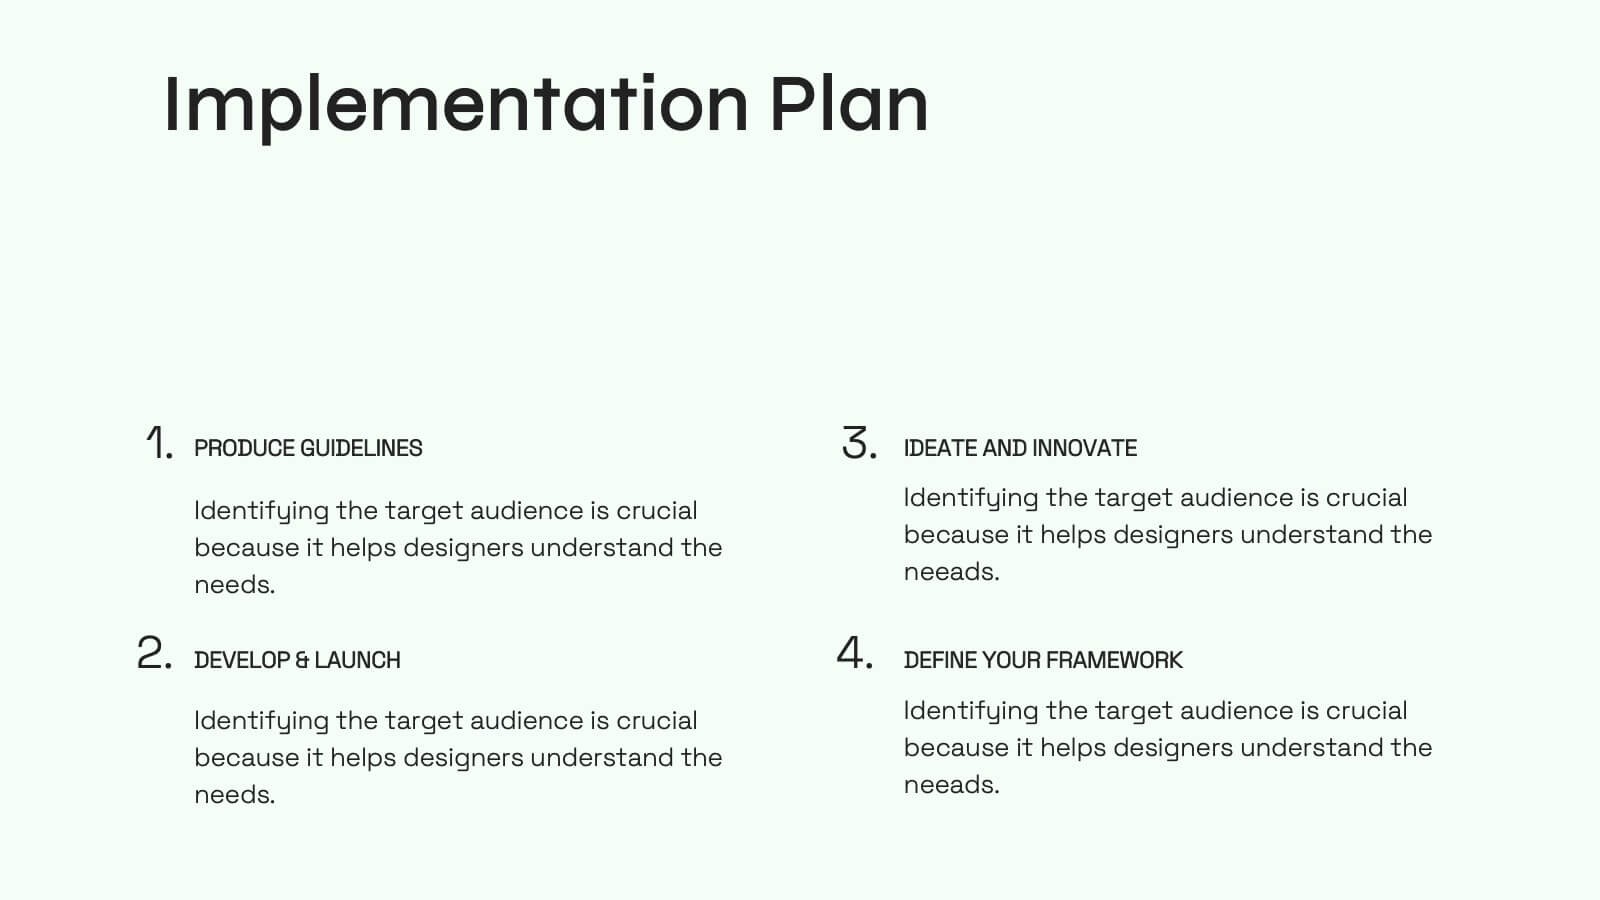
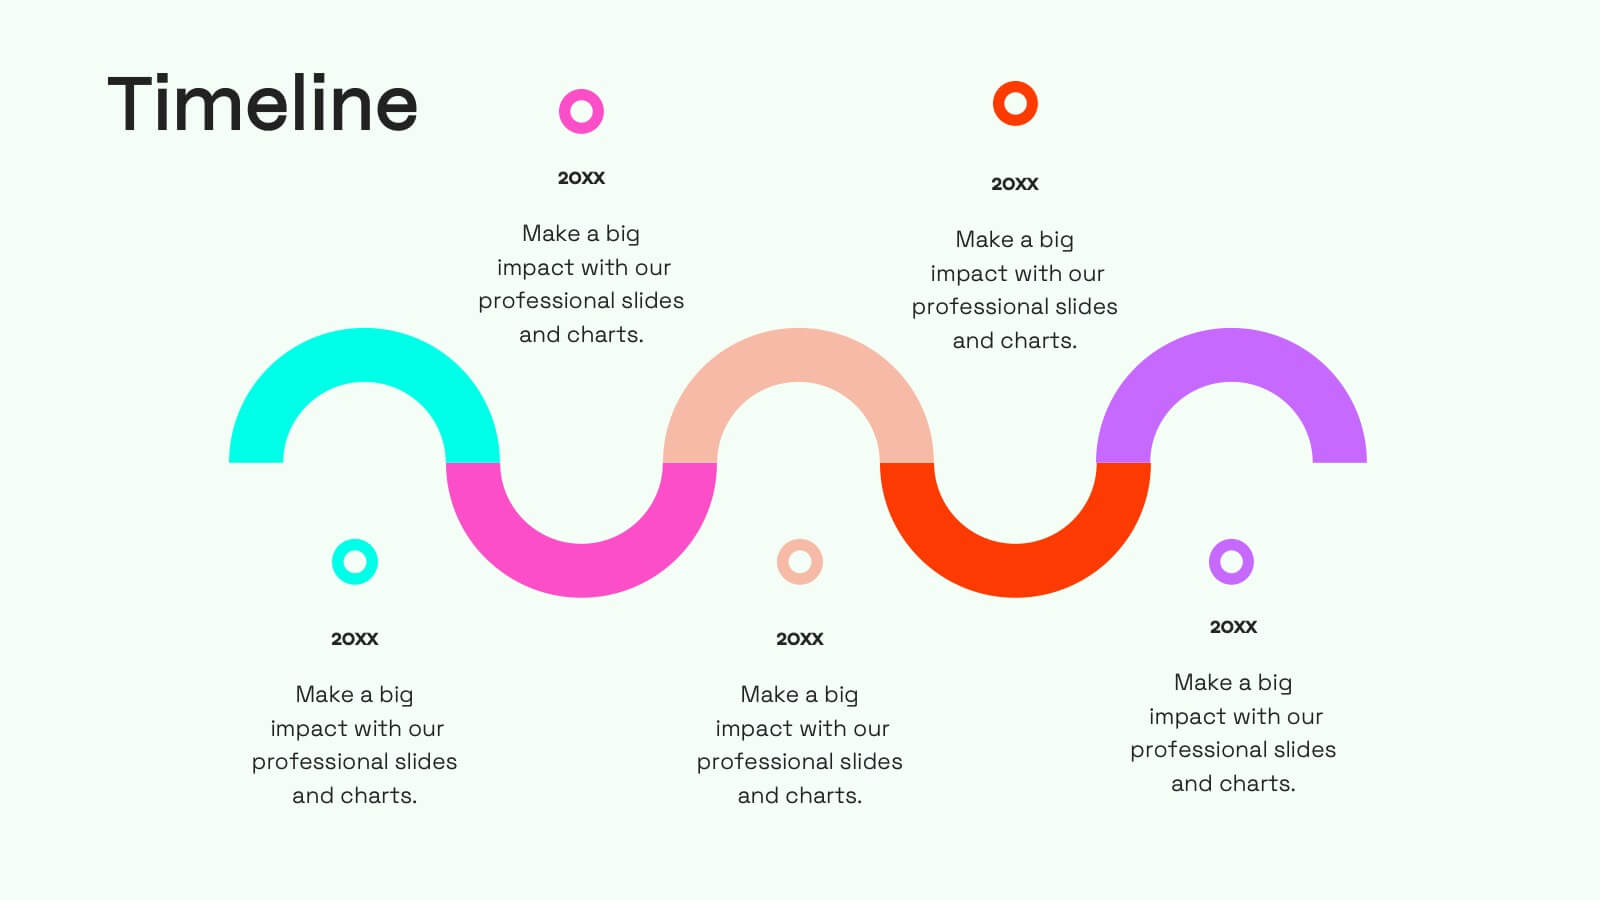
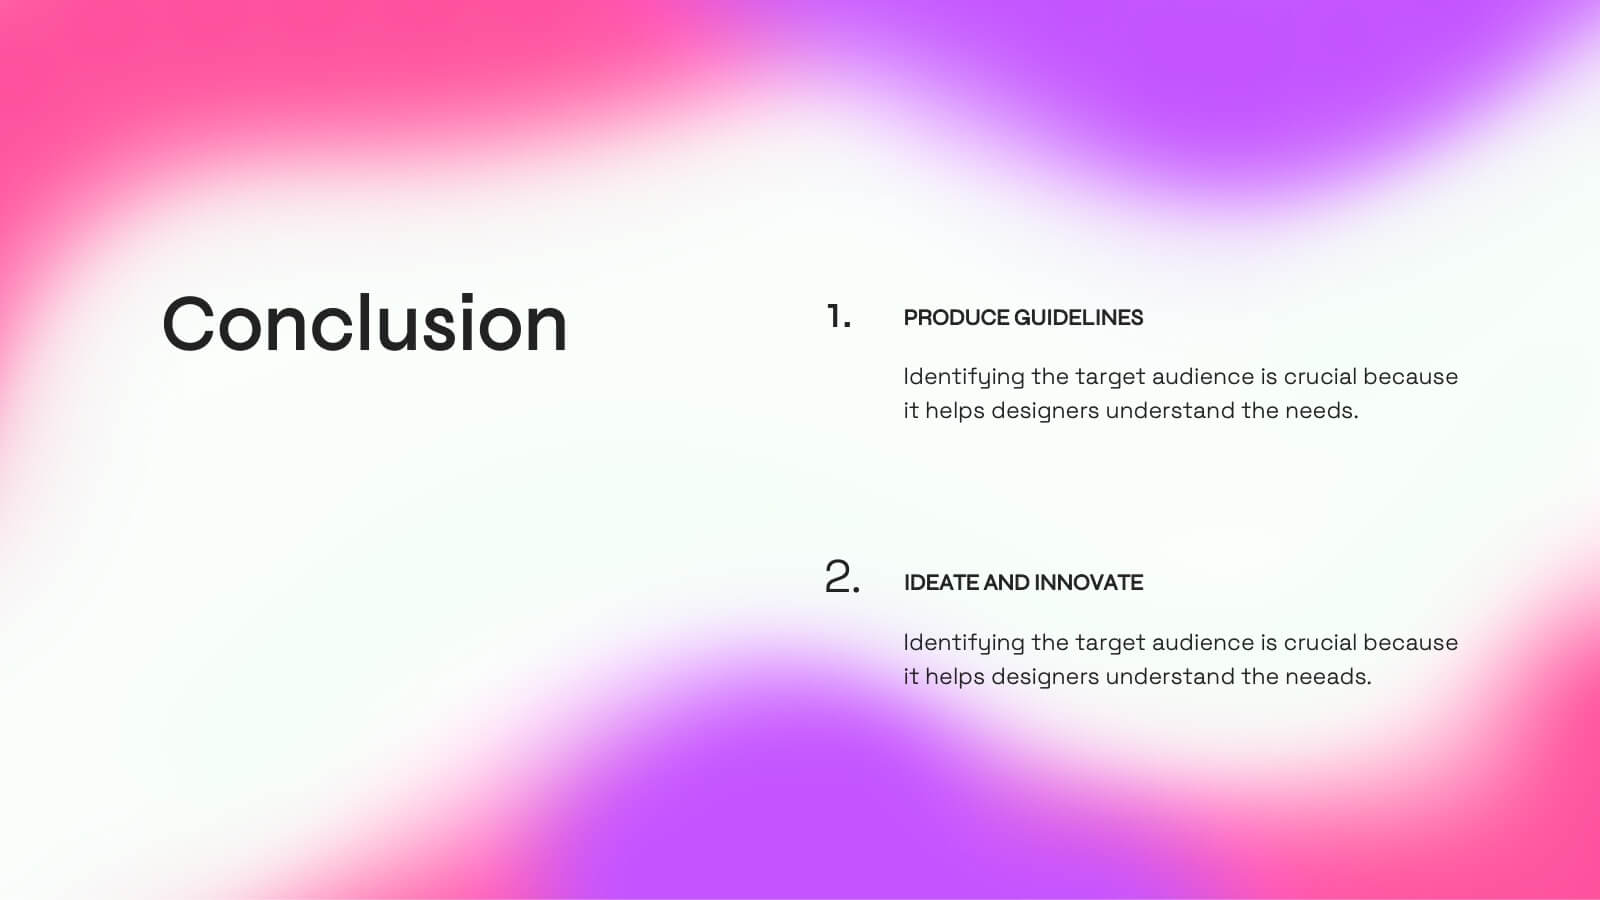
Jade Creative Design Report Presentation
Transform your design report into a captivating visual experience with this elegant jade-themed presentation template! Ideal for showcasing your creative projects, it effectively highlights key concepts, methodologies, and outcomes in a polished format. With its striking design, your work will impress clients and stakeholders alike. Compatible with PowerPoint, Keynote, and Google Slides.


5 slides
Management Framework Structure Presentation
Bring your ideas to life with a dynamic slide that maps out clear stages of leadership, planning, and execution. This layout helps you break down complex management structures into simple, visual steps that any audience can follow. Fully editable and easy to customize in PowerPoint, Keynote, and Google Slides.


20 slides
Novelix Graphic Design Project Plan Presentation
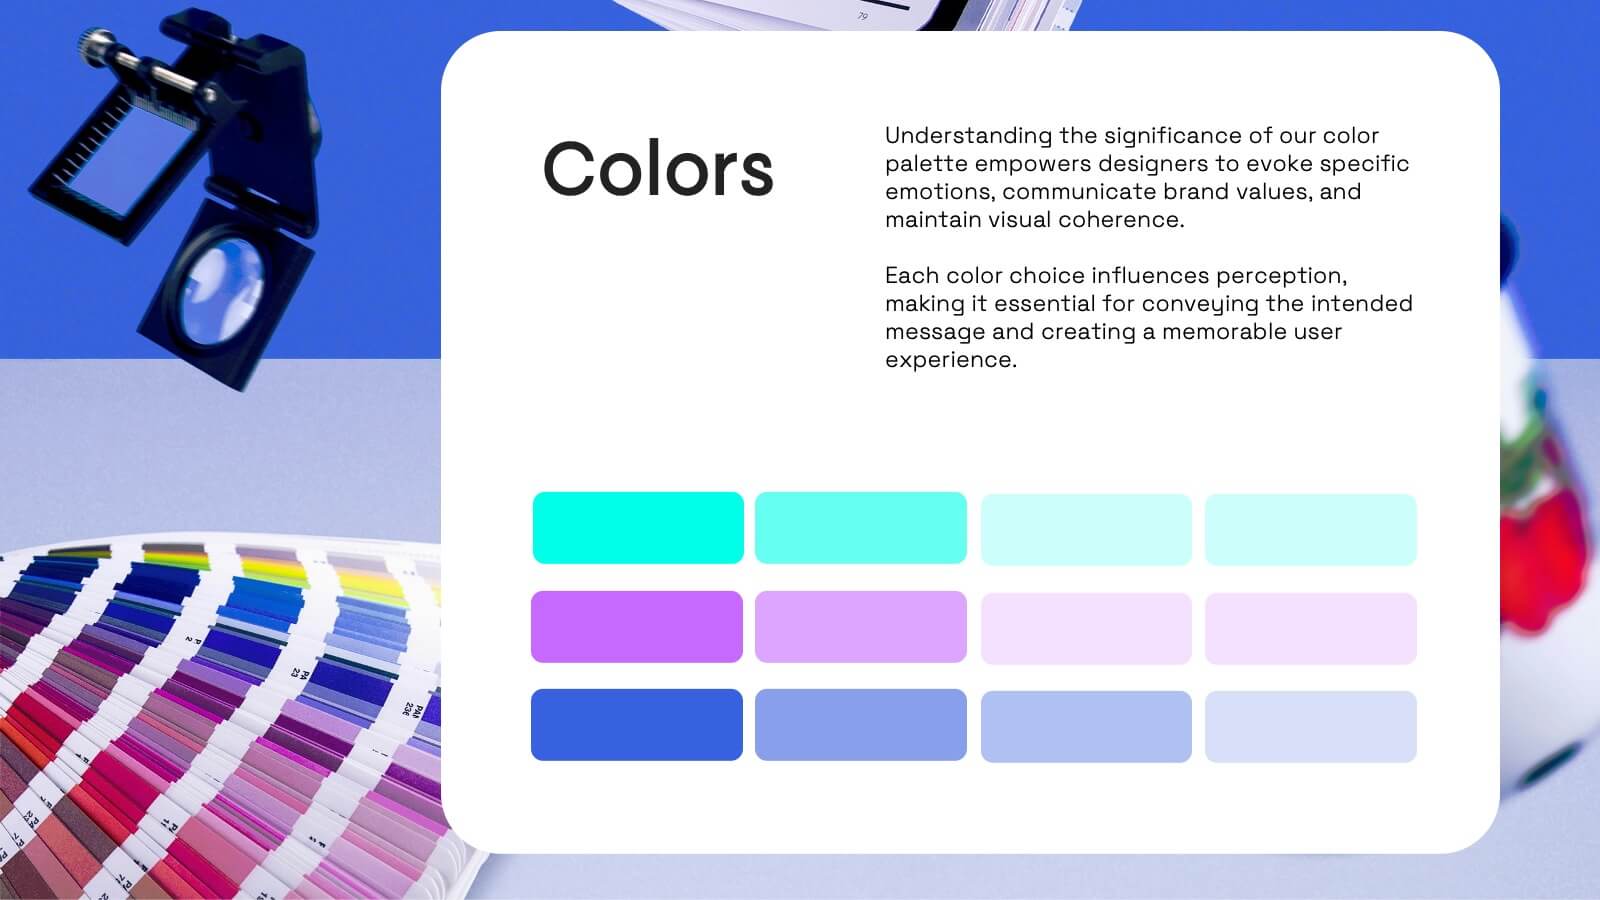
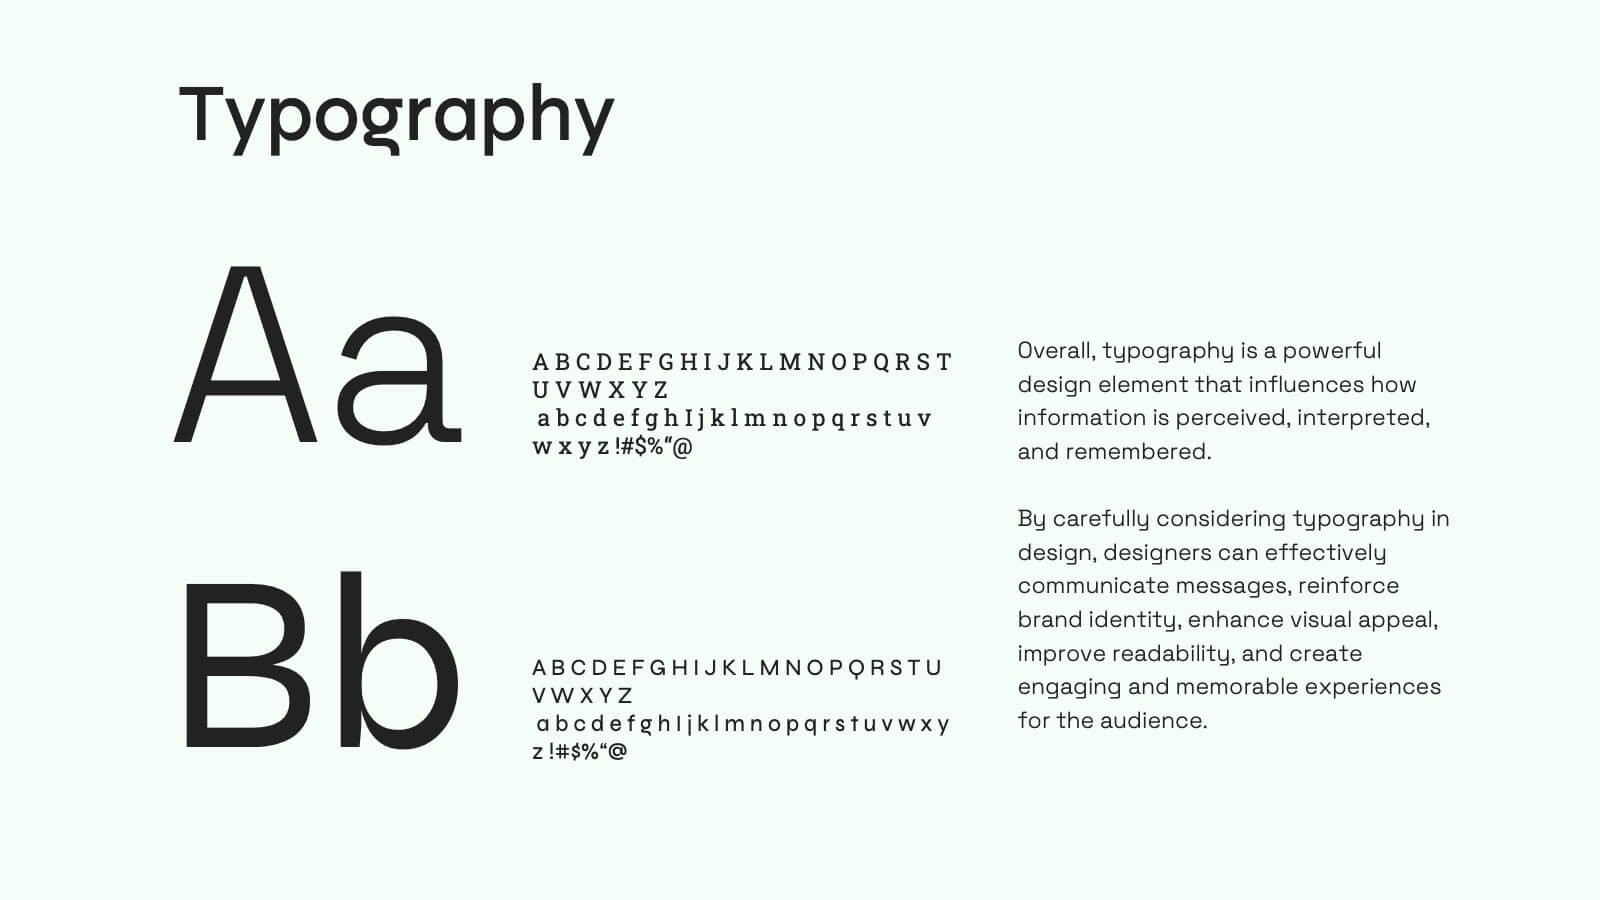
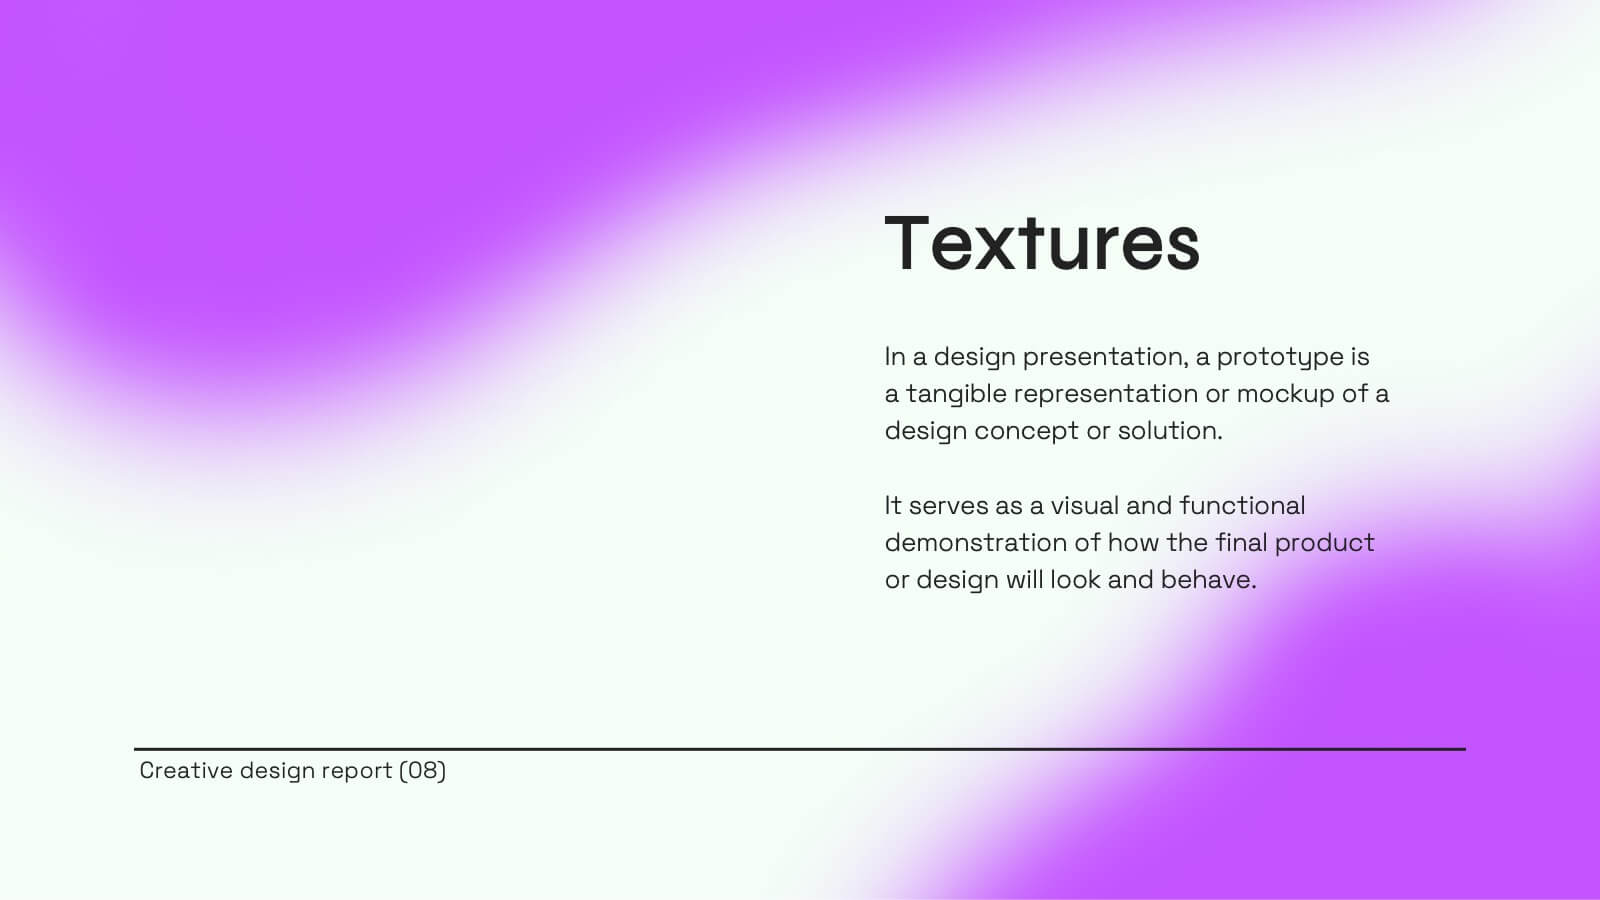
Elevate your design projects with this modern and stylish presentation template. Covering key areas such as concept development, design elements, prototypes, and project timelines, it provides a structured approach to presenting creative work. Perfect for designers and agencies alike. Compatible with PowerPoint, Keynote, and Google Slides for effortless customization.


5 slides
Operational Process Logic Map
Visualize how every function interconnects with the Operational Process Logic Map Presentation. This template uses a radial node structure to break down workflows, responsibilities, or systems into logical clusters, showing how different units or steps interact within an operational framework. Each node is color-coded and icon-marked for clarity, ideal for explaining process flows, department roles, or system dependencies. Fully editable in PowerPoint, Keynote, and Google Slides.


8 slides
Card Services Comparison Layout Presentation
Highlight key differences in financial products with this Card Services Comparison Layout Presentation. Featuring a sleek smartphone-centered design, this template allows you to clearly compare up to three card types or financial service features. Perfect for fintech presentations, banking pitches, or product feature breakdowns. Fully customizable in PowerPoint, Keynote, and Google Slides.


5 slides
Strategic Matrix Grid Analysis Presentation
Clarify your strategic insights with the Strategic Matrix Grid Analysis Presentation. This layout uses a 2x2 quadrant design to showcase four key categories or scenarios—ideal for SWOT, risk vs. reward, product positioning, or capability mapping. Clean labels, icons, and text areas help break down each quadrant’s significance. Fully editable in PowerPoint, Google Slides, Keynote, and Canva.


22 slides
Quantum Scientific Research Presentation
Present your scientific research with this comprehensive and professional template! Perfect for detailing research objectives, methodology, and key findings. Ideal for researchers and academics aiming to share their work clearly and effectively. Compatible with PowerPoint, Keynote, and Google Slides, this template ensures your scientific presentations are thorough, engaging, and visually appealing.


8 slides
Credit Card Comparison Presentation
The "Credit Card Comparison" presentation template visualizes the differences between credit and debit card options in a straightforward and engaging way. Featuring side-by-side comparisons, the template allows for easy insertion of key points such as fees, benefits, and suitability for different user profiles, making it an excellent tool for financial educators, advisors, and banking professionals. The template’s design ensures that the content is accessible and relatable, making complex financial concepts easier to grasp for the audience. This makes it ideal for presentations aimed at educating consumers about financial choices or for internal training within financial institutions.


6 slides
United States Coronavirus Map
A United States Coronavirus Map is a graphical representation that displays the spread of the coronavirus (COVID-19) across the United States. This infographic template may use different colors, shades, or symbols to indicate the severity of COVID-19 cases in different areas. Darker colors may represent higher case numbers, while lighter colors may represent lower case numbers. These maps are valuable tools to track the progression of the virus, identify hotspots, and make informed decisions related to public health. This can also help raise awareness about the importance of preventive measures and promote data-driven strategies to control the spread.


6 slides
PESTEL Framework Business
Simplify your strategic analysis with this clean and colorful PESTEL presentation. Perfect for breaking down Political, Economic, Sociocultural, Technological, Environmental, and Legal factors. Each segment uses bold icons and color coding to guide your audience through external influences. Easily customizable in PowerPoint, Keynote, and Google Slides.


5 slides
Customer Profile and Persona Insights Presentation
Showcase your target audience with style using this modern persona insights deck. Highlight demographics, traits, and behaviors through visual cards and editable text placeholders. Perfect for marketing strategy, user research, or campaign planning. Fully customizable in PowerPoint, Keynote, and Google Slides to align with your branding and presentation needs.


8 slides
Concept Mapping with Bubble Map Presentation
Create a visually engaging Concept Mapping with Bubble Map presentation to organize ideas, processes, or strategies effectively. This customizable template enhances clarity in brainstorming sessions, strategic planning, and educational content. Compatible with PowerPoint, Keynote, and Google Slides.


7 slides
30 60 90 Day Plan Diagram Presentation
The 30-60-90 day plan is a document that outlines an individual's goals and objectives for the first 90 days of a new job. This template allows you the ability to set goals, review progress and analyze the results of your work. This infographic template is a multipurpose design that can be used for business, personal, and educational projects. It includes descriptive text and images to help you put together your presentation plan. It's easy to use and has been designed to be compatible with Powerpoint, Keynote, and Google Slides just add your own information and start presenting!


8 slides
Green Business Sustainability Strategy Presentation
Promote eco-friendly business strategies with the Green Business Sustainability Strategy infographic. Featuring a circular flow diagram, this template highlights key sustainable initiatives, resource management, and environmental impact strategies. Fully editable and compatible with PowerPoint, Keynote, and Google Slides.