


Features
- 4 Unique slides
- Fully editable and easy to edit in Microsoft Powerpoint, Keynote and Google Slides
- 16:9 widescreen layout
- Clean and professional designs
- Export to JPG, PDF or send by email


Do you have any questions?
Recommend


6 slides
Employee Feedback Survey Results Presentation
Showcase Employee Feedback Survey Results with a data-driven and professional layout designed for clear visualization and analysis. This PowerPoint, Keynote, and Google Slides-compatible template features stacked bar charts for easy trend comparison, helping you present workplace insights effectively. Fully customizable with editable text, colors, and labels, this template ensures a seamless and engaging presentation of employee feedback metrics.


6 slides
Above and Below Surface Iceberg Strategy
Reveal both the visible and hidden layers of your business approach with the Above and Below Surface Iceberg Strategy Presentation. Ideal for leadership meetings, transformation plans, or behavioral analysis, this diagram helps clarify surface-level actions vs. deeper root drivers. Compatible with PowerPoint, Keynote, and Google Slides for easy customization.


21 slides
Mercurion Project Status Report Presentation
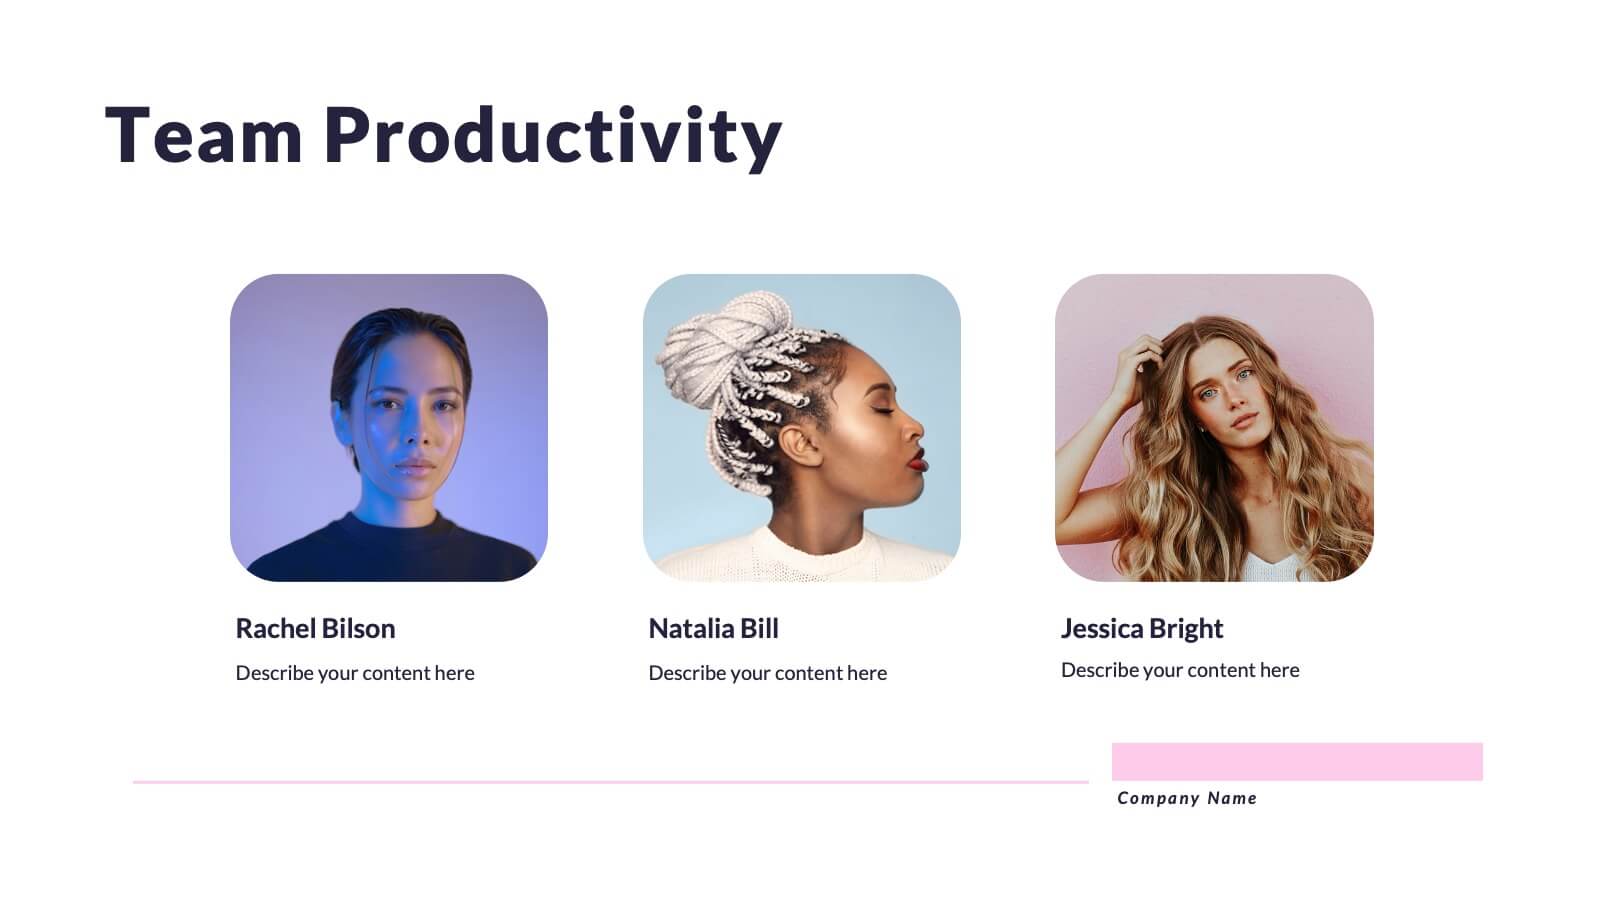
Stay on top of your project's progress with this structured and visually engaging presentation template. Covering key highlights, performance metrics, financial summaries, team productivity, and future priorities, this template helps you communicate project updates effectively. Whether for stakeholders, management, or team meetings, it provides clear insights and actionable recommendations. Fully customizable and compatible with PowerPoint, Keynote, and Google Slides.


5 slides
Harvey Ball Rating System Overview Presentation
Visualize performance ratings or feature comparisons with the Harvey Ball Rating System Overview Presentation. This template uses vertical bar visuals combined with Harvey ball icons to communicate progress, satisfaction, or status across four key areas. Clean, intuitive, and ideal for executive summaries or status dashboards. Fully editable and compatible with PowerPoint, Keynote, and Google Slides.


4 slides
Business Operations Office Theme Presentation
Make your workflow feel effortless with this sleek, illustrated office layout designed to simplify complex business operations. Ideal for presenting processes, responsibilities, or resource planning, the clean visuals and structured format help communicate your message clearly. Fully editable and compatible with PowerPoint, Keynote, and Google Slides for seamless customization.


4 slides
Current Project Health and Status Report Presentation
Track progress with clarity using the Current Project Health and Status Report presentation slide. Featuring a modern clipboard layout with checkboxes and project tools like a pencil, magnifier, and ruler, this slide is perfect for highlighting task completion, pending issues, and project milestones. Ideal for weekly updates, stakeholder reviews, or status dashboards. Fully editable in PowerPoint, Keynote, and Google Slides.


6 slides
Budget and Expense Breakdown Presentation
Kickstart your financial story with a clean, energetic visual that makes every cost and category instantly understandable. This presentation helps you break down spending, compare expenses, and highlight key budget insights using a simple, structured layout. Perfect for reports and planning meetings. Fully compatible with PowerPoint, Keynote, and Google Slides.


6 slides
Concept Web with Spider Diagram Layout Presentation
Map out complex ideas with clarity using the Concept Web with Spider Diagram Layout Presentation. This dynamic radial format is perfect for showing interrelated components, skills analysis, or performance metrics at a glance. Ideal for brainstorming, strategy, or education—fully editable in Canva, PowerPoint, Keynote, and Google Slides.


5 slides
Strategic Planning with Concentric Circles Presentation
Visualize Your Strategy with Clarity using this Strategic Planning with Concentric Circles Presentation template. Designed to illustrate layered processes, decision-making frameworks, and business growth strategies, this concentric model helps communicate core ideas with structured, expanding details. Fully customizable and compatible with PowerPoint, Keynote, and Google Slides, this template is perfect for business leaders, strategists, and consultants aiming for clear and impactful presentations.


8 slides
Economic Improvement in South America Map Presentation
Highlight regional performance with this South America economic growth map. Featuring 3D bar charts and country-specific markers, it’s ideal for visualizing financial progress, investments, or development trends. Fully editable in PowerPoint, Google Slides, and Keynote, this layout is perfect for reports, forecasts, and business reviews with a geographic focus.


5 slides
Key Data and Performance Numbers Slide
Visualize data with impact using the Key Data and Performance Numbers Slide Presentation. This infographic-style layout features a central pie chart and five bold percentage callouts, making it ideal for presenting insights, progress, or KPIs. Easily customize the colors, titles, and text in PowerPoint, Keynote, or Google Slides.


5 slides
Climate Change Impacts Infographics
Climate Change refers to long-term shifts in temperature, precipitation patterns, wind patterns, and other aspects of the Earth's climate system. These infographic templates are perfect to educate and raise awareness about the impacts of climate change on our planet. These templates are suitable for environmental organizations, educators, or anyone seeking to convey the urgency and significance of addressing climate change. The compelling visuals, data-driven content, and clear messaging, in these templates aims to educate and inspire individuals to contribute to global efforts to address climate change and protect our planet's future.


4 slides
Colorful Workflow Process Chart Presentation
Bring your workflow to life with a vibrant, easy-to-follow layout that makes every stage feel connected and purposeful. This presentation helps you map processes, explain team roles, and simplify complex steps using a clean, visual flow. Fully compatible with PowerPoint, Keynote, and Google Slides.


22 slides
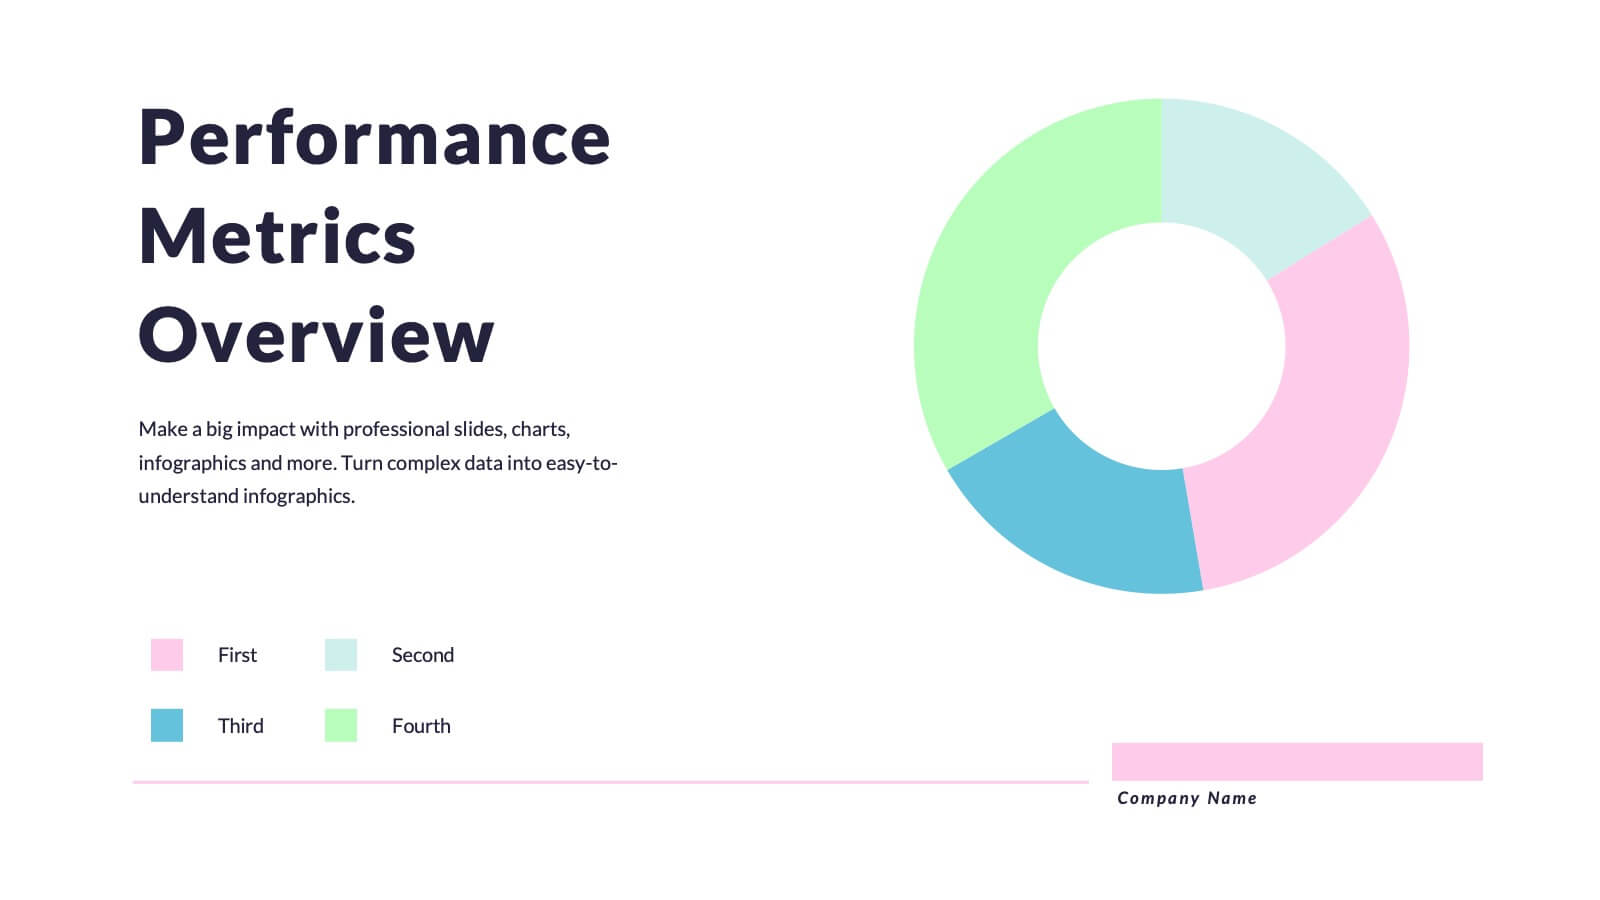
Quantum Research Findings Report Presentation
Discover insights like never before with this vibrant presentation template! Perfect for showcasing research findings, it includes slides for key findings, performance metrics, and market trends. Clearly present data and engage your audience with visually appealing graphics. Compatible with PowerPoint, Keynote, and Google Slides, making it easy to use on any platform.


6 slides
Corporate Team Management Presentation
Highlight the interconnected roles of your corporate team with this sleek Corporate Team Management slide. The circular flow design emphasizes collaboration, leadership, and operational structure—making it ideal for showcasing team roles, department functions, or workflow cycles. Each of the six editable segments includes a title and description area with clean iconography. Fully compatible with PowerPoint, Keynote, and Google Slides.


7 slides
Alphabet Letters Infographic
An alphabet infographic is a visual representation or graphic that presents information related to the alphabet, often used for educational purposes or to convey information in a creative and engaging manner. Get ready to embark on a joyful journey through the wonderland of letters and words with our alphabet letters infographic. This infographic template includes various elements like letters, words, examples, pronunciation guides, or related images. This is more than just an infographic—it's a vibrant celebration of language, learning, and pure happiness. Dive into the kaleidoscope of alphabets and spread the cheer!


7 slides
Digital Marketing Course Infographic
Dive into the dynamic realm of digital marketing with our Digital Marketing Course Infographic. Bathed in a clean white canvas, accentuated with the depth of blue, the optimism of yellow, and the innovation of green, our template captures the multifaceted nature of online marketing. Equipped with sharp infographics, relevant icons, and customizable image placeholders, it provides a comprehensive overview of digital marketing modules and strategies. Perfectly tailored for Powerpoint, Keynote, or Google Slides. An invaluable resource for marketing trainers, course instructors, students, or any organization aiming to upskill in the digital domain.