


Features
- 7 Unique slides
- Fully editable and easy to edit in Microsoft Powerpoint, Keynote and Google Slides
- 16:9 widescreen layout
- Clean and professional designs
- Export to JPG, PDF or send by email.


Do you have any questions?
Recommend


3 slides
Future of Aviation Technologies Presentation
Soar into the future of flight with this sleek, data-driven layout that visualizes progress and innovation in aviation. Perfect for showcasing new technologies, sustainability efforts, or industry growth trends, it balances clarity and impact. Fully customizable and compatible with PowerPoint, Keynote, and Google Slides for effortless presentation design.

22 slides
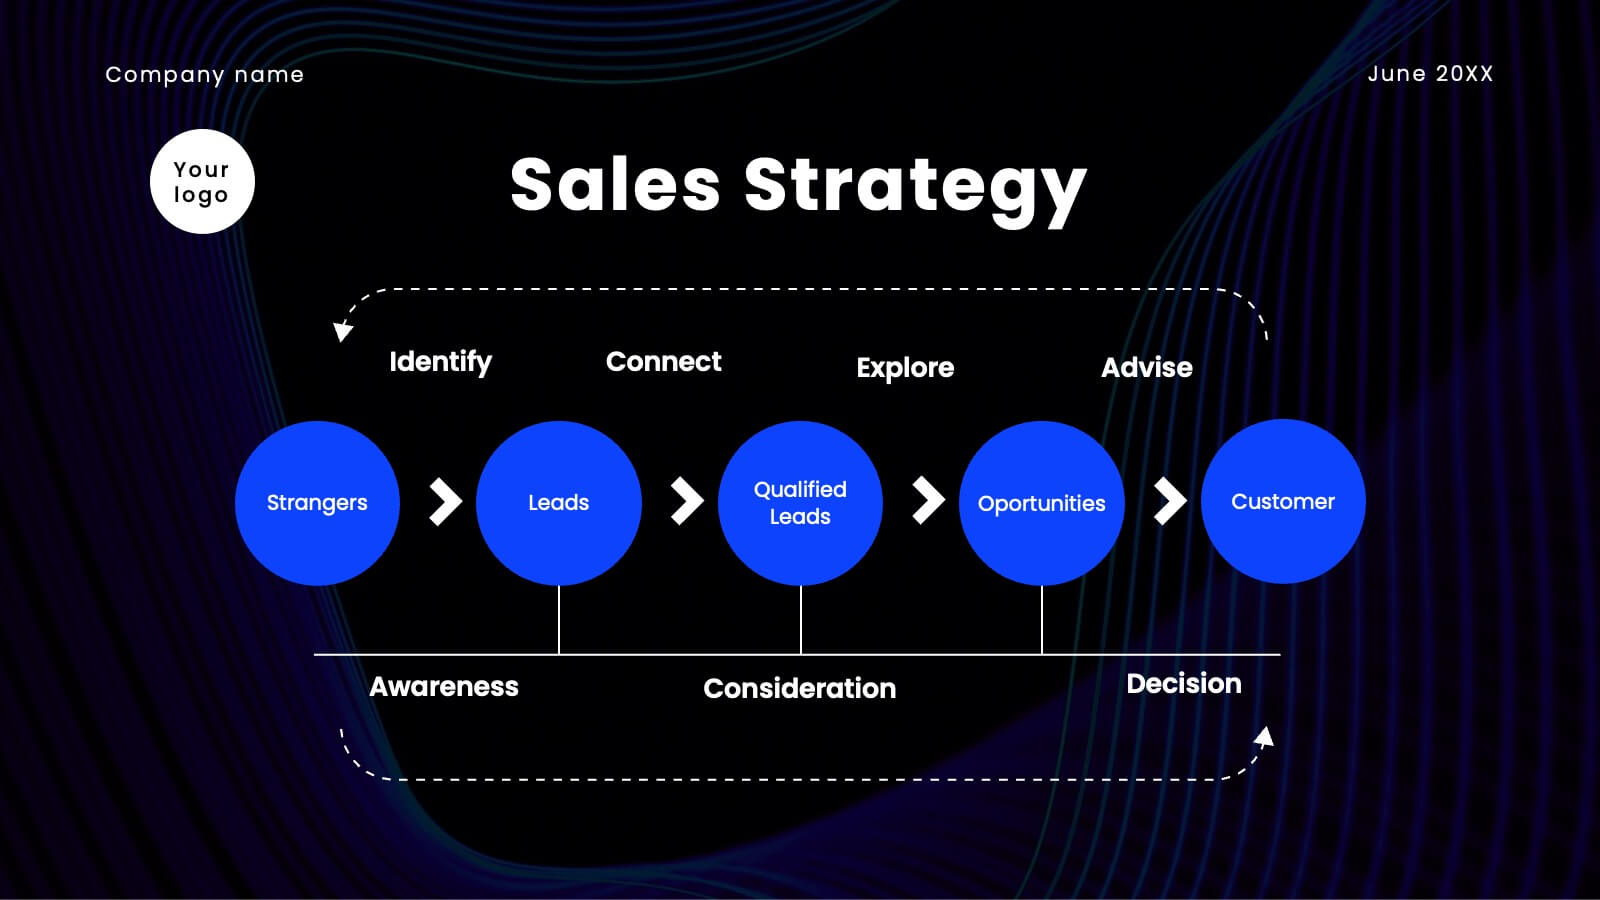
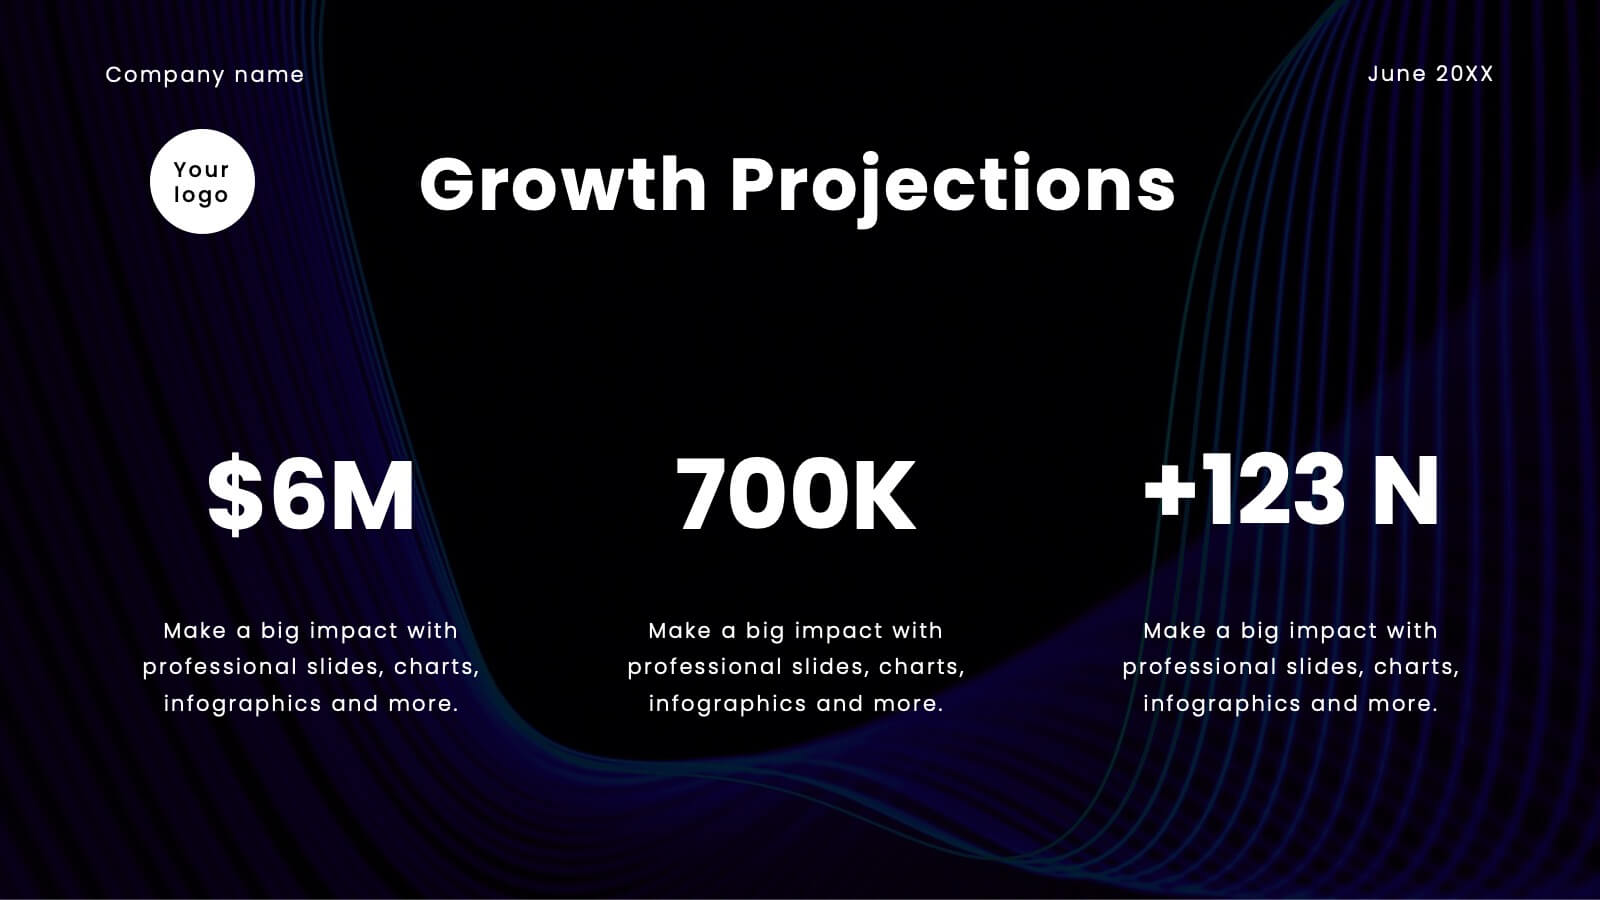
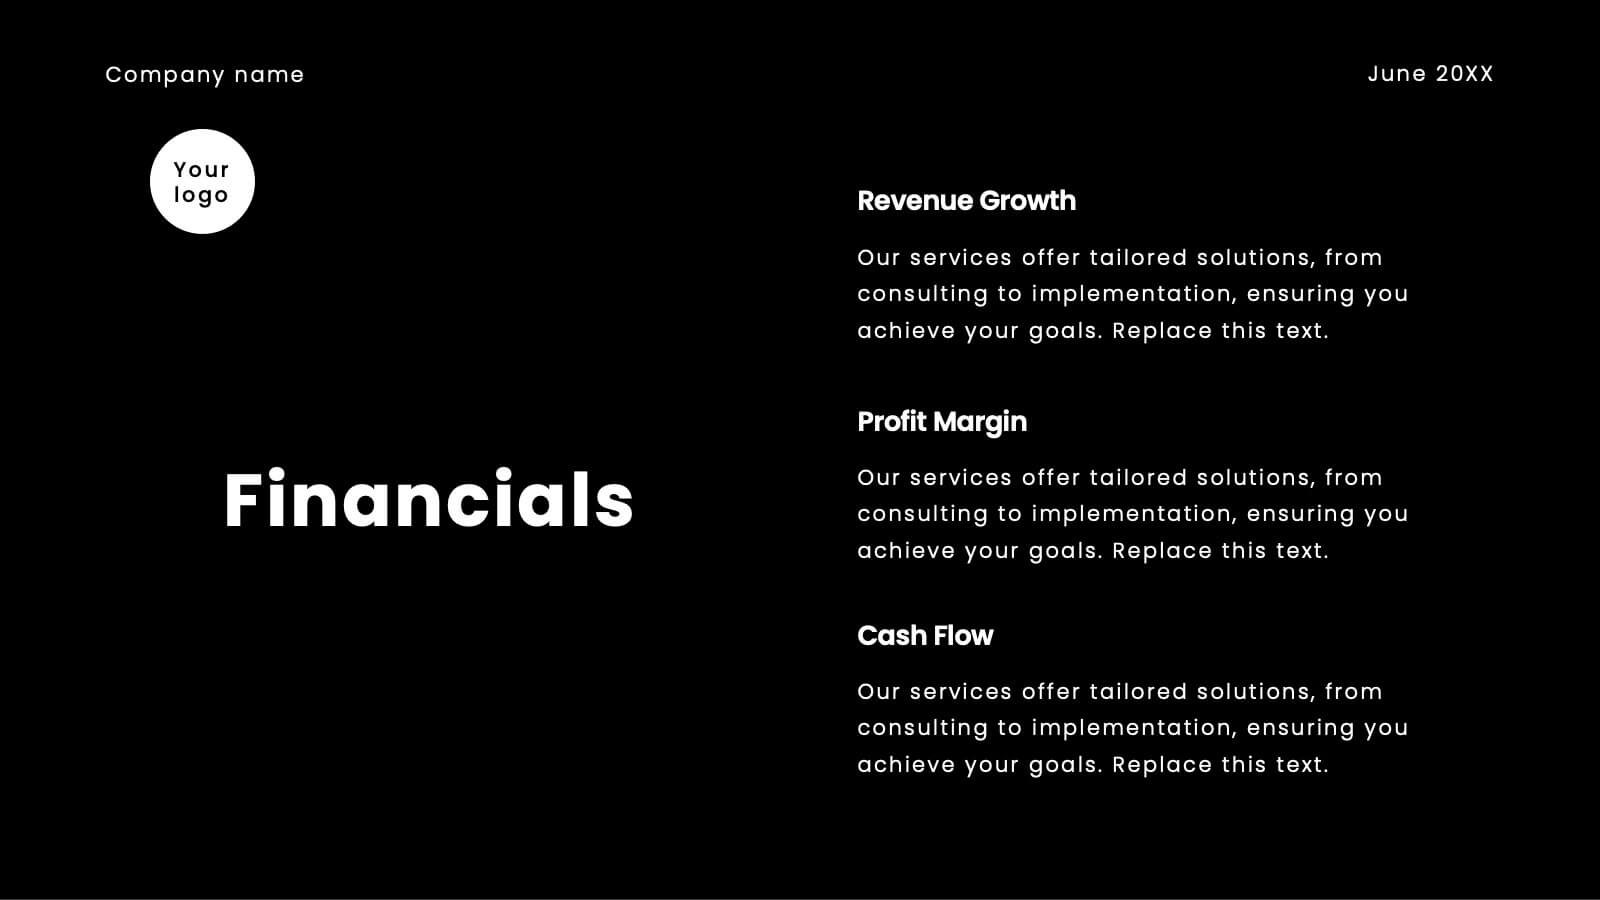
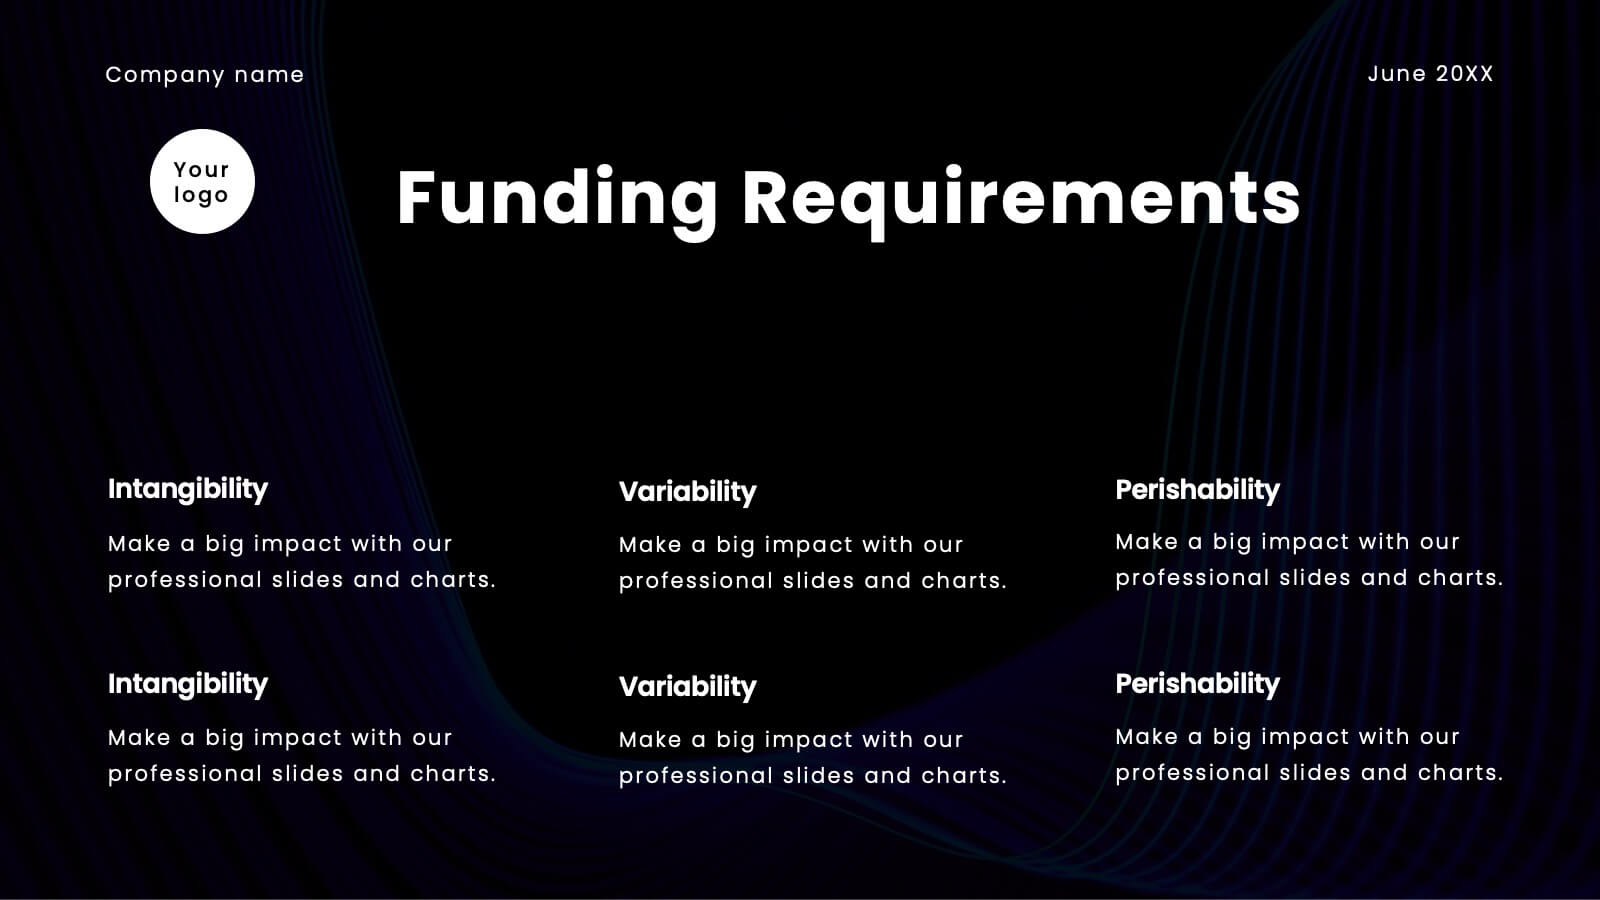
Jolt Business Idea Pitch Deck Presentation
Prepare to electrify your audience with a pitch deck that’s nothing short of spectacular! This high-impact template is designed to captivate, engage, and persuade your stakeholders with every slide. It’s more than just a presentation; it’s your gateway to showcasing your company’s unique value proposition, innovative solutions, and future growth potential in a way that’s visually stunning and incredibly compelling. From the moment you unveil your company overview to the final slide on financials and funding requirements, this template ensures your pitch is memorable, powerful, and impossible to ignore. The sleek, modern design highlights your strategic vision, competitive advantages, and market opportunities, making a bold statement that you’re ready to lead the future. Compatible with PowerPoint, Keynote, and Google Slides, this pitch deck template is your ultimate tool for turning heads and securing buy-in from investors, partners, and clients alike!


24 slides
Blazewind User Experience Proposal Presentation
This UX Strategy Plan Presentation Template is a comprehensive and visually engaging solution for presenting user experience design strategies. Covering key elements such as research, wireframing, prototyping, user testing, and design principles, it ensures a structured approach to showcasing your UX process. Ideal for UX/UI designers, agencies, and businesses looking to communicate their design strategies effectively. Fully compatible with PowerPoint, Keynote, and Google Slides for seamless customization.


20 slides
Sphene Sales Proposal Presentation
Take your sales pitch to the next level with this elegant and structured presentation template! Featuring sections on sales objectives, process, pricing strategies, and performance metrics, this template is ideal for impressing potential clients and closing deals. It’s easy to customize and works seamlessly with PowerPoint, Keynote, and Google Slides for hassle-free presentation creation.


4 slides
Minimal Title Page Variations Presentation
Highlight key ideas with style using the Minimal Title Page Variations Presentation. These clean and colorful layouts feature bold numbers, pastel text boxes, and abstract 3D artwork to instantly draw attention. Perfect for agendas, summaries, or content previews. Includes multiple layout options and is fully editable in PowerPoint, Keynote, and Google Slides.


4 slides
Company Welcome and Overview Presentation
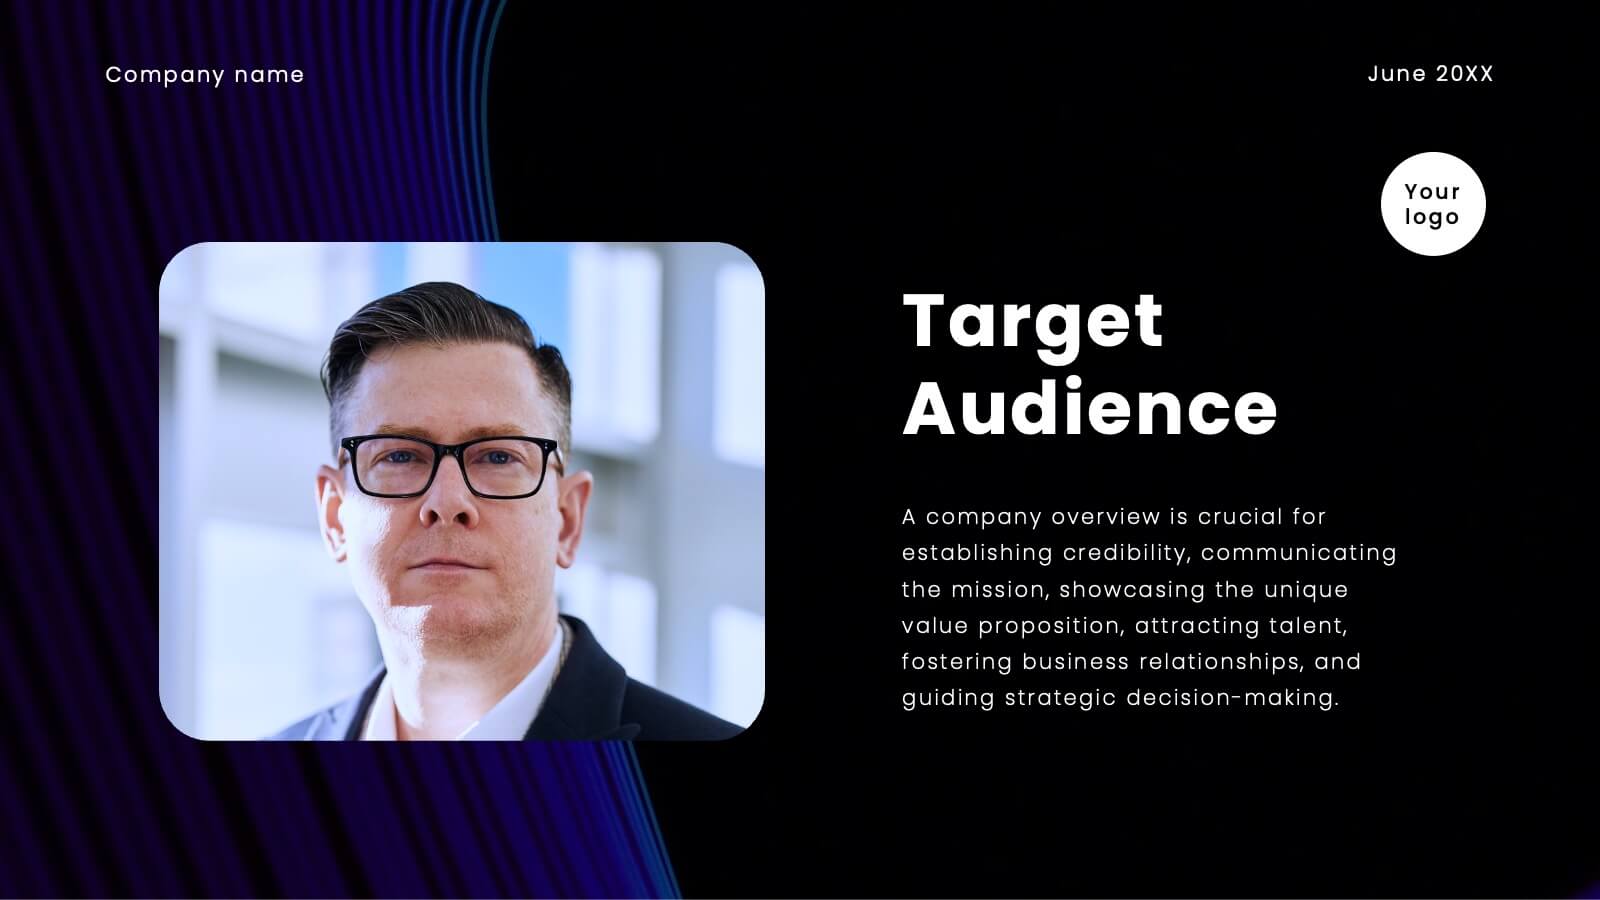
Set the tone for your business presentation with this professional welcome slide. Designed to introduce your company, services, or mission, it includes a customizable photo and clear text sections. Ideal for onboarding, team meetings, or proposals—fully editable in Canva, PowerPoint, or Google Slides for a polished first impression.


5 slides
Product Marketing Slide Presentation
Spark interest instantly with a bold, circular layout that transforms product insights into a clean, memorable story. This presentation helps you explain features, audience needs, and value propositions in an organized, visual flow that keeps attention on what matters most. Fully customizable for PowerPoint, Keynote, and Google Slides.


4 slides
Employee and Team Performance Analysis
Visualize individual and team contributions with this clear and structured performance analysis template. Showcase key metrics, employee growth, and team achievements using easy-to-read layouts and progress indicators. Ideal for HR reports, performance reviews, and team evaluations. Fully editable in PowerPoint, Keynote, and Google Slides.


5 slides
Porter's Five Forces Competitive Analysis Presentation
Illustrate market dynamics and industry competitiveness using Porter’s Five Forces. This template covers New Entrants, Buyer Power, Supplier Power, Substitutes, and Customer Power in a clean, letter-coded format. Fully editable in PowerPoint, Keynote, and Google Slides, it's perfect for strategic analysis and investor presentations. Clear, structured, and easy to customize.


10 slides
Risk Management Plan Presentation
The "Risk Management Plan Presentation" template is designed to outline strategic steps for identifying, assessing, managing, and monitoring business risks. Each segment of the plan is clearly labeled and represented on a segmented wheel, with A identifying risks, B assessing them, C managing responses, and D monitoring and reporting outcomes. The clean and straightforward design ensures key risk management strategies are communicated effectively to stakeholders. This visual tool is perfect for business meetings or training sessions, helping teams understand their roles in mitigating risks and ensuring that the business maintains a proactive approach to challenges.


8 slides
Modern Pricing Table Design Presentation
Turn heads and highlight value with this sleek, modern layout that makes pricing clear and compelling. Perfect for showcasing service tiers or subscription plans, this clean design uses bold icons and structured comparisons to guide decisions. Fully compatible with PowerPoint, Keynote, and Google Slides for easy customization and professional pricing presentations.


6 slides
Onboarding 30-60-90 Day Roadmap Presentation
Get your team excited from day one with this colorful, easy-to-follow visual layout! This presentation template helps clearly map out onboarding goals and key activities across 30, 60, and 90 days. Perfect for HR professionals and team leads, it's fully editable and works with PowerPoint, Keynote, and Google Slides.


26 slides
Ethical Business Practices Presentation
Promote integrity with our Ethical Business Practices presentation template, suitable for PowerPoint, Keynote, and Google Slides. This essential tool is crafted for business leaders, compliance officers, and educators who aim to reinforce the importance of ethics in the corporate environment. Our template facilitates a clear understanding of ethical standards in business operations. It includes slides on ethical decision-making, corporate governance, social responsibility, and the long-term benefits of maintaining high ethical standards. With customizable layouts, you can present real-world scenarios, ethical frameworks, and company policies that illustrate your commitment to ethical conduct. This SEO-optimized template is key for reaching audiences interested in building trust and credibility through responsible business practices. Use this template to lead discussions on ethics, influence corporate culture positively, and showcase how ethical behavior is not just right but also beneficial for business success.


6 slides
Startup Investors Pitch Deck Presentation
Inspire confidence and spark investor interest with the Startup Investor Pitch Deck Presentation. Featuring a creative visual of a rocket launching from a piggy bank, this slide is ideal for illustrating funding momentum, business growth, or financial milestones. Each section allows space to highlight critical investment points such as traction, market opportunity, financials, and team highlights. Fully customizable in PowerPoint, Keynote, or Google Slides, this pitch-ready layout is perfect for entrepreneurs, startup founders, and innovation teams aiming to deliver a memorable and professional presentation.


4 slides
Performance Gap Analysis Diagram Presentation
Bridge the gap between current and desired performance with this strategic diagram. Featuring a split-path layout and central bridge graphic, this template helps visualize obstacles, goals, and solutions. Ideal for strategy teams, consultants, and analysts. Fully editable in PowerPoint, Keynote, and Google Slides—clear, impactful, and easy to customize.


24 slides
Crest User Experience Proposal Presentation
Present your user experience design proposal with a vibrant and engaging template! This design covers key UX aspects like user research, wireframes, prototyping, and usability guidelines. Ideal for showcasing your process from personas to interaction design, it's fully compatible with PowerPoint, Keynote, and Google Slides for seamless presentations.


4 slides
Income and Expense Highlights Presentation
Enhance learning with the Interactive Digital Learning Experience Presentation. This template mimics a multiple-choice format, making it perfect for quizzes, training modules, or eLearning content. Each slide includes labeled options (A–D) alongside a modern vertical interface, ideal for engaging assessments or lesson recaps. Fully editable in Canva, PowerPoint, Keynote, and Google Slides.