


Features
- 4 Unique slides
- Fully editable and easy to edit in Microsoft Powerpoint, Keynote and Google Slides
- 16:9 widescreen layout
- Clean and professional designs
- Export to JPG, PDF or send by email


Do you have any questions?
Recommend


7 slides
Fishbone Analysis Infographic Presentation
A fishbone Infographic is a technique used to brainstorm the cause of a problem. The unique design helps you understand how one thing can lead to another and is effective at helping you create a solution that reviews all aspects. Start this template off using the head of the fish as a prompt and webbing out from there, draw up to six main causal categories and then sub-categories. Use this infographic to organize your ideas and identify key factors, as well as decide how to prioritize them. This template is compatible and completely editable with Powerpoint, keynote and google slides.


5 slides
Natural Disaster Effects Infographics
Natural Disasters are sudden and extreme events caused by natural forces that result in significant damage, and loss of life. This template is designed to effectively educate your audience about the effects of natural disasters and promote awareness and preparedness for such events. With this template you can present the effects and consequences of various natural disasters. Compatible with Powerpoint, Keynote, and Google Slides. It features a nature design with customizable photo layouts, charts, and infographics that help illustrate the effects. Use these visuals to depict different types of natural disasters, such as earthquakes, floods, and wildfires.


7 slides
Finance Dashboard Infographic
A finance dashboard is a visual representation of financial data and key performance indicators (KPIs) that provides an overview of an organization's financial health and performance. This infographic template is a tool that allows users to monitor and analyze financial data in a clear and concise manner. This offers a comprehensive overview of financial performance, budgeting, and forecasting for individuals or businesses. The template features a clean and modern design with a professional color scheme, easy-to-read fonts, and intuitive layout. The visuals are thoughtfully organized to convey financial information effectively and engage the audience.


4 slides
Audience Demographic Profile Overview
Present audience composition with clarity using the Audience Demographic Profile Overview Presentation. This slide is designed to showcase gender-based or group-specific data through visual figures, percentage markers, and supporting bar charts. Ideal for marketers, analysts, and researchers who need to communicate user distribution and behavior insights. Fully editable in PowerPoint, Keynote, and Google Slides.


8 slides
Corporate Risk Assessment and Planning Presentation
Navigate business uncertainties with the Corporate Risk Assessment and Planning template, offering a vivid and structured layout designed for professionals to meticulously detail and analyze potential risks in various business scenarios. It uses hexagonal and circular elements to emphasize the interconnectedness of various risk factors, supporting clear visualization and effective strategic planning. This template is compatible with PowerPoint, Keynote, and Google Slides, making it a versatile tool for comprehensive risk management presentations.


4 slides
Customer Feedback Report Presentation
Transform audience insights into actionable strategies with this clean, data-focused presentation. Designed to highlight customer satisfaction trends, improvement areas, and feedback analysis, it helps visualize complex information with clarity and flow. Fully customizable and compatible with PowerPoint, Keynote, and Google Slides for a polished, professional, and presentation-ready report.


23 slides
Infinitum Business Plan Presentation
Present your ideas with confidence using this sleek and professional business plan presentation template. Designed for entrepreneurs, startups, and business professionals, this template offers a clear structure to articulate your vision, strategy, and goals effectively. Featuring sections for executive summaries, SWOT analysis, market research, and financial forecasts, this template ensures every detail is covered. Visually engaging charts, graphs, and infographics make data presentation straightforward and compelling. Team profiles, product highlights, and future projections allow you to showcase your competitive edge. Fully editable in PowerPoint, Google Slides, and Keynote, this template is easy to adapt to your branding and business requirements. With its modern design and structured format, it’s perfect for pitching to investors, stakeholders, or clients. Make an impact and leave a lasting impression with this versatile and comprehensive business plan presentation tool.


7 slides
Work From Home Benefits Infographic
The modern digital era has ushered in a revolution: the feasibility of working from home. Our work from home benefits infographic, crafted with a crisp white palette highlighted by shades of red and subtle black touches, dives deep into the multifaceted advantages of remote work. Whether it's the flexibility in hours, reduced commute stress, or the savings made, this template sheds light on every facet. This infographic template is perfect for professionals, team leaders, and organizations keen to adopt this model, its seamlessly compatible with PowerPoint, Keynote, and Google Slides.


20 slides
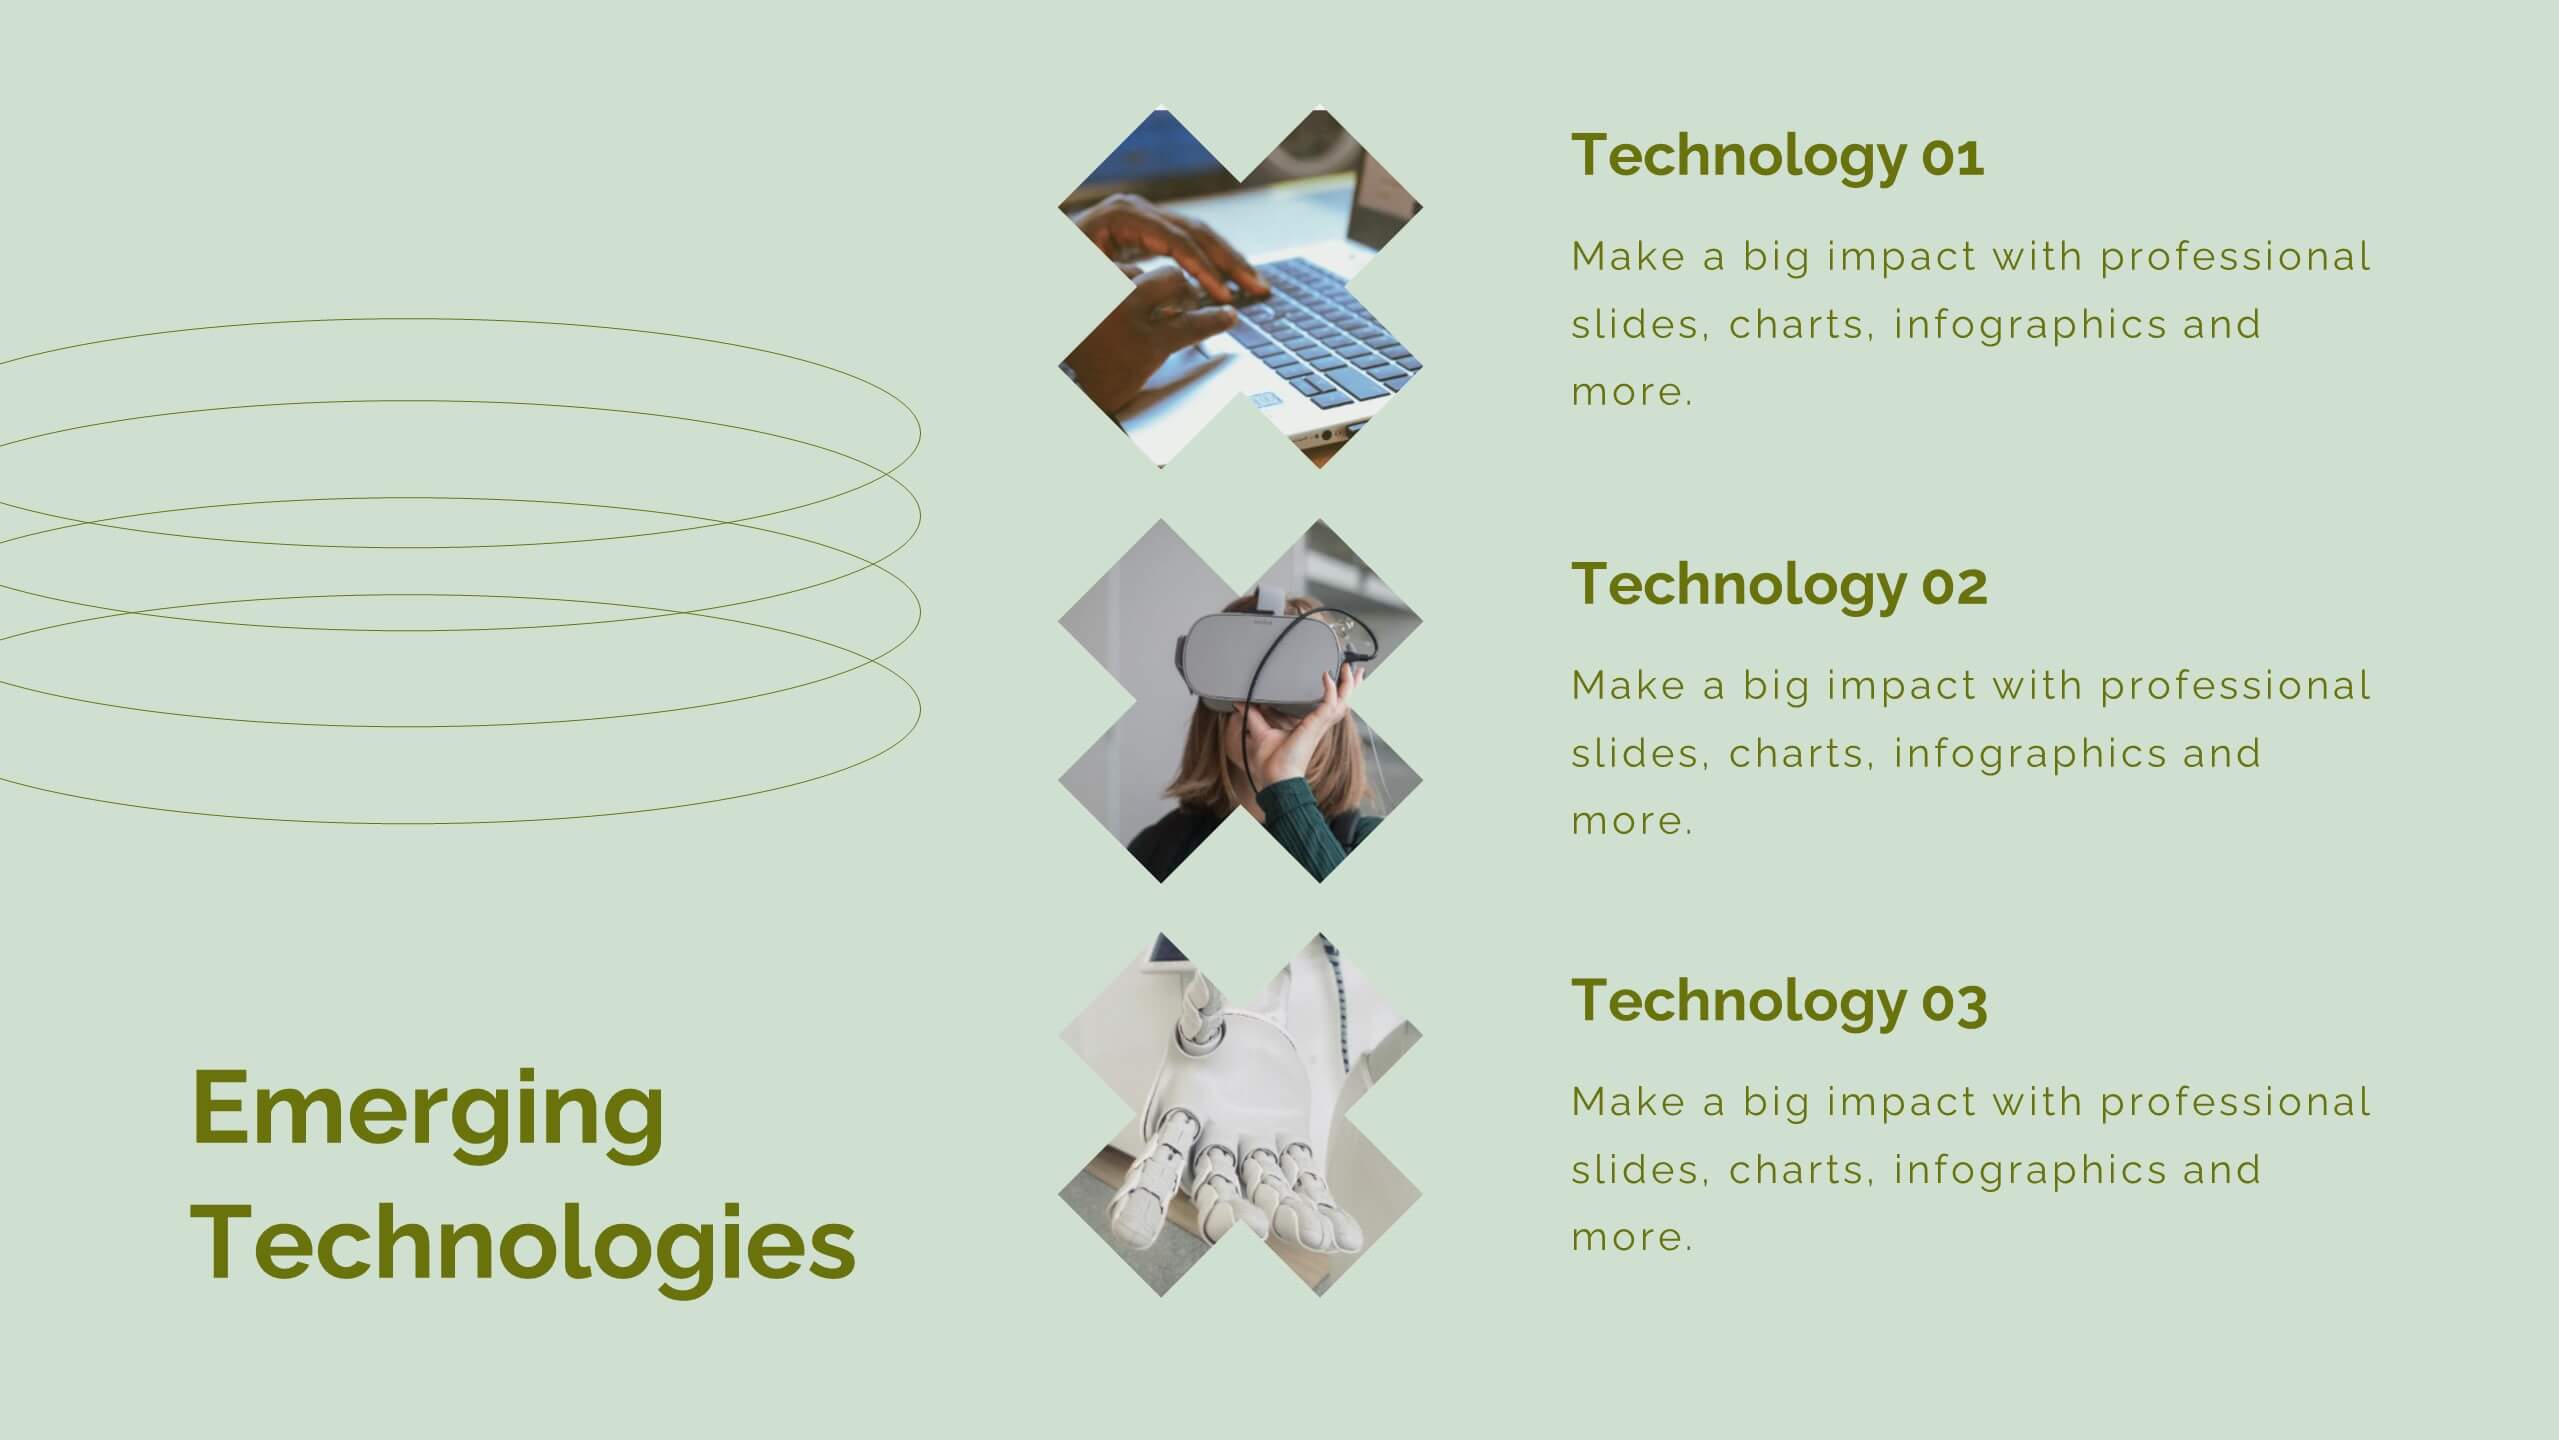
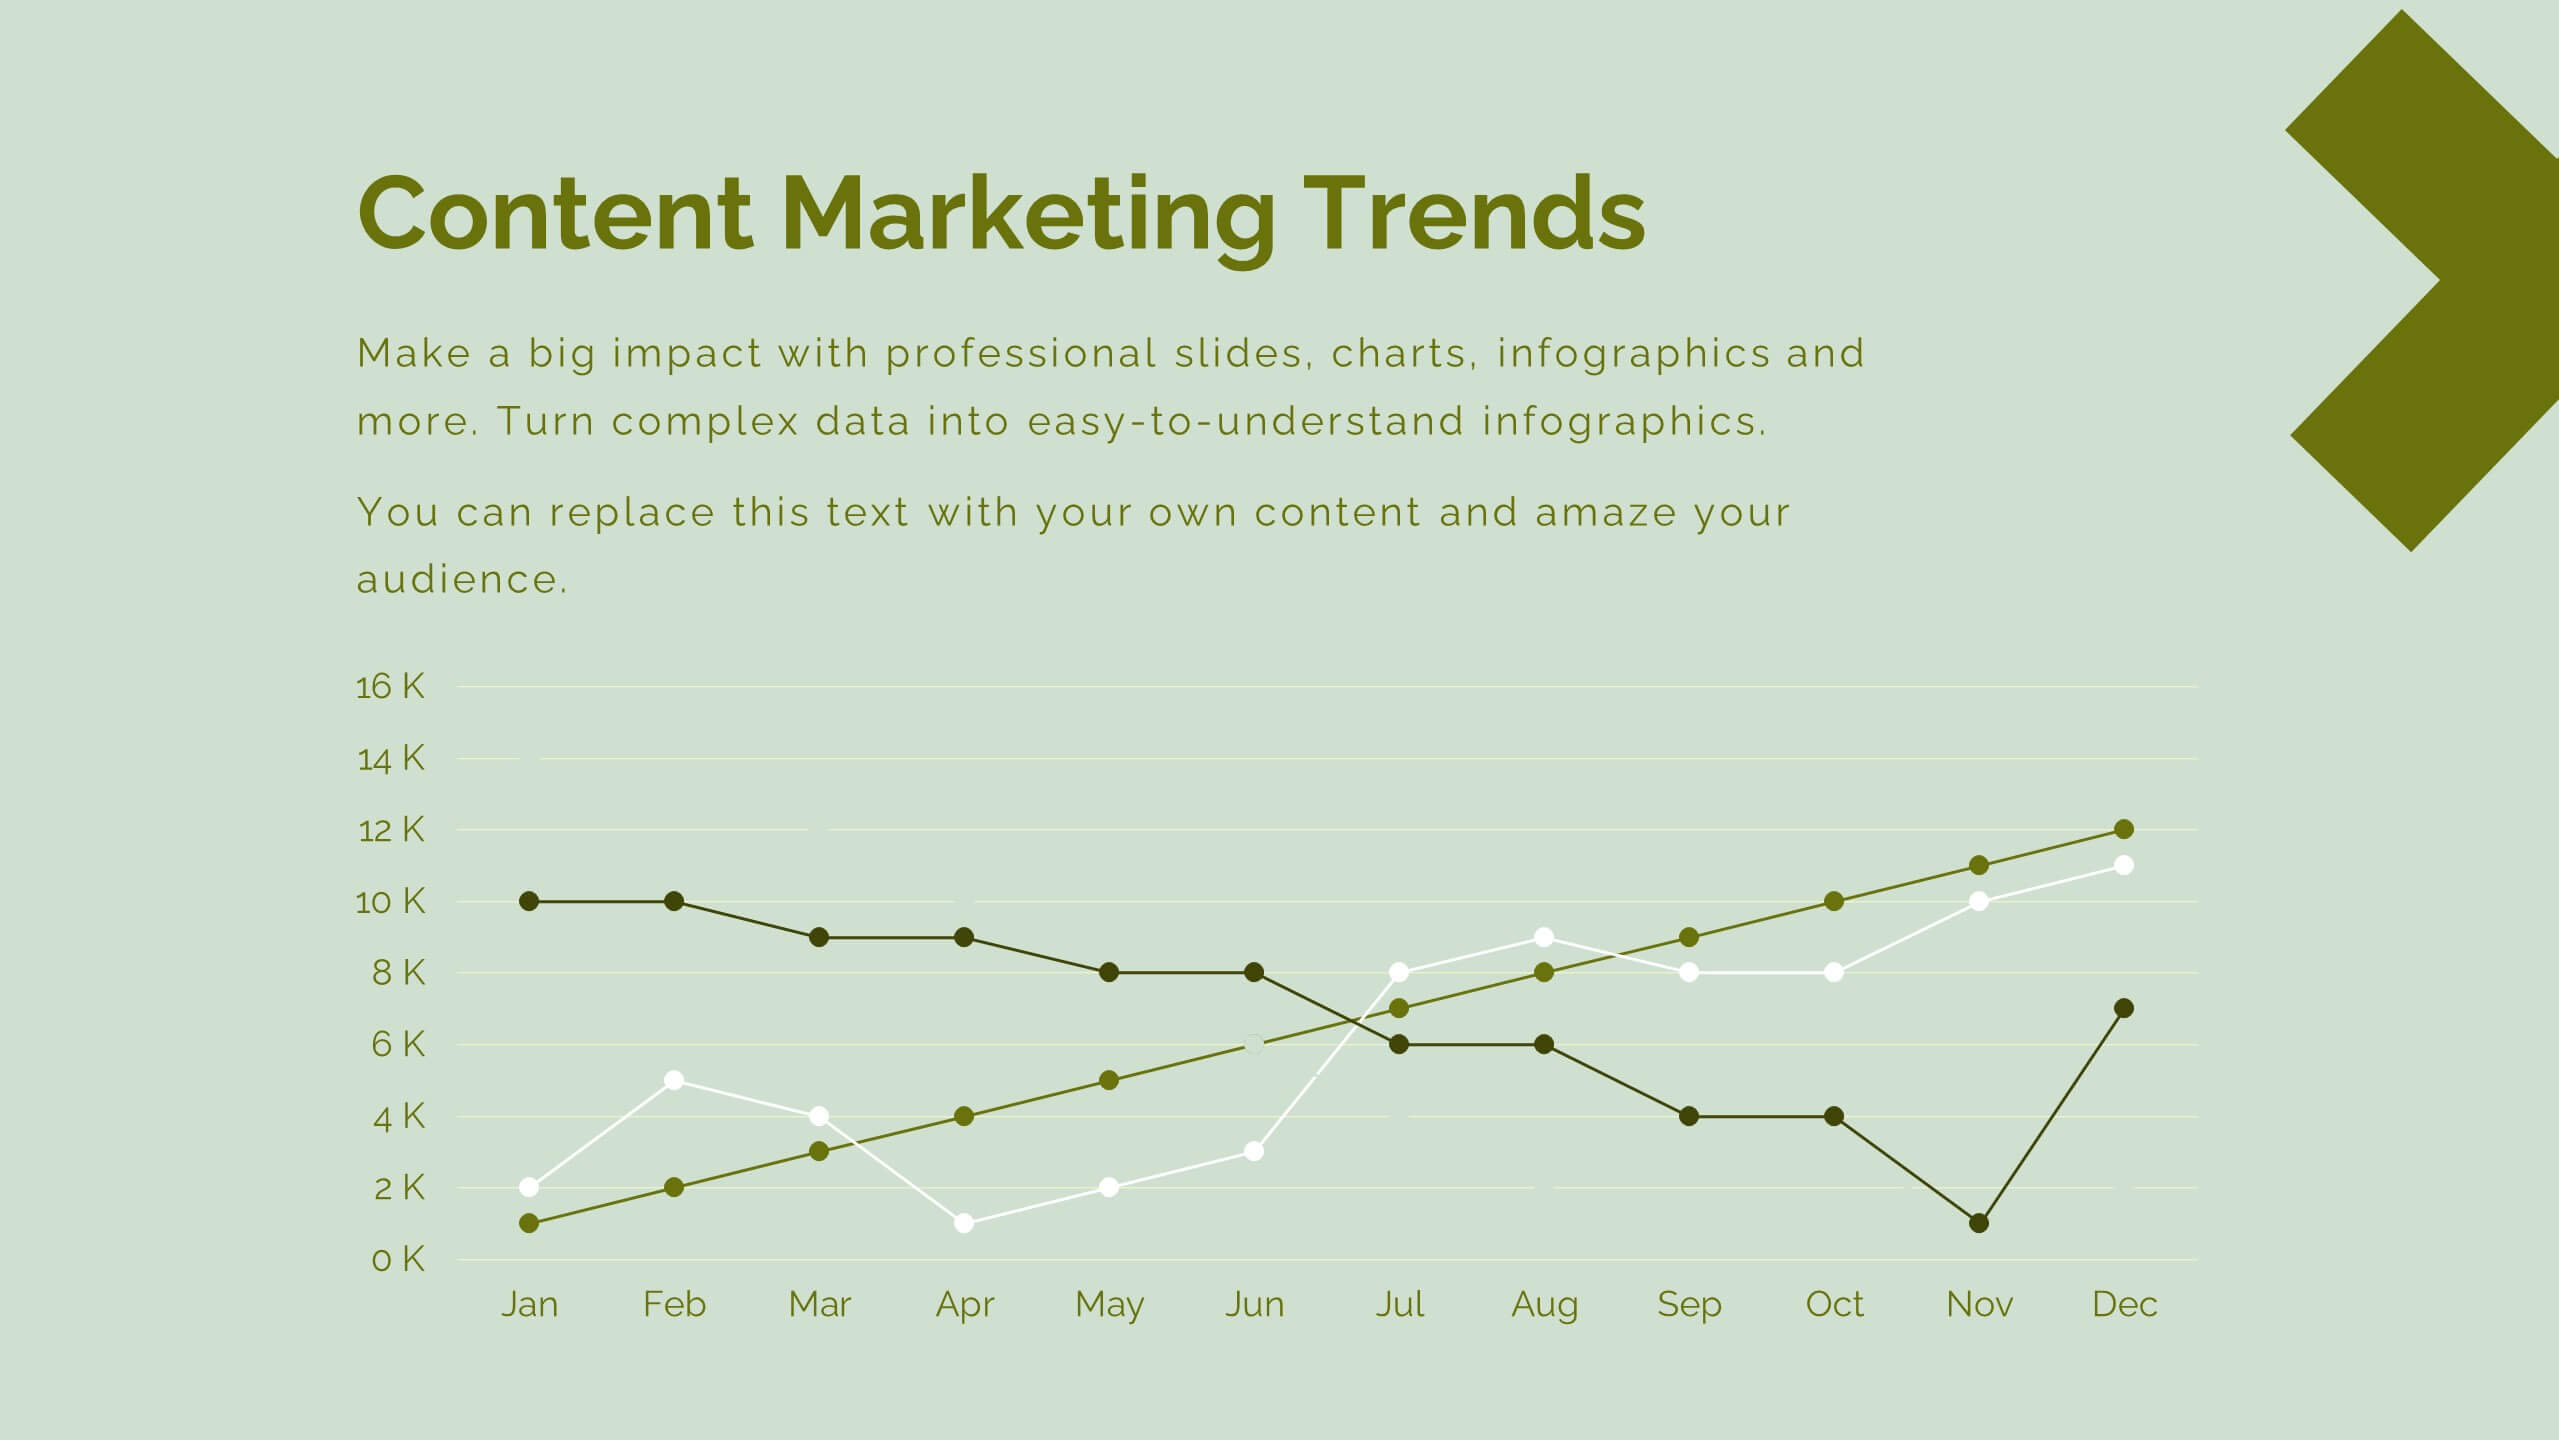
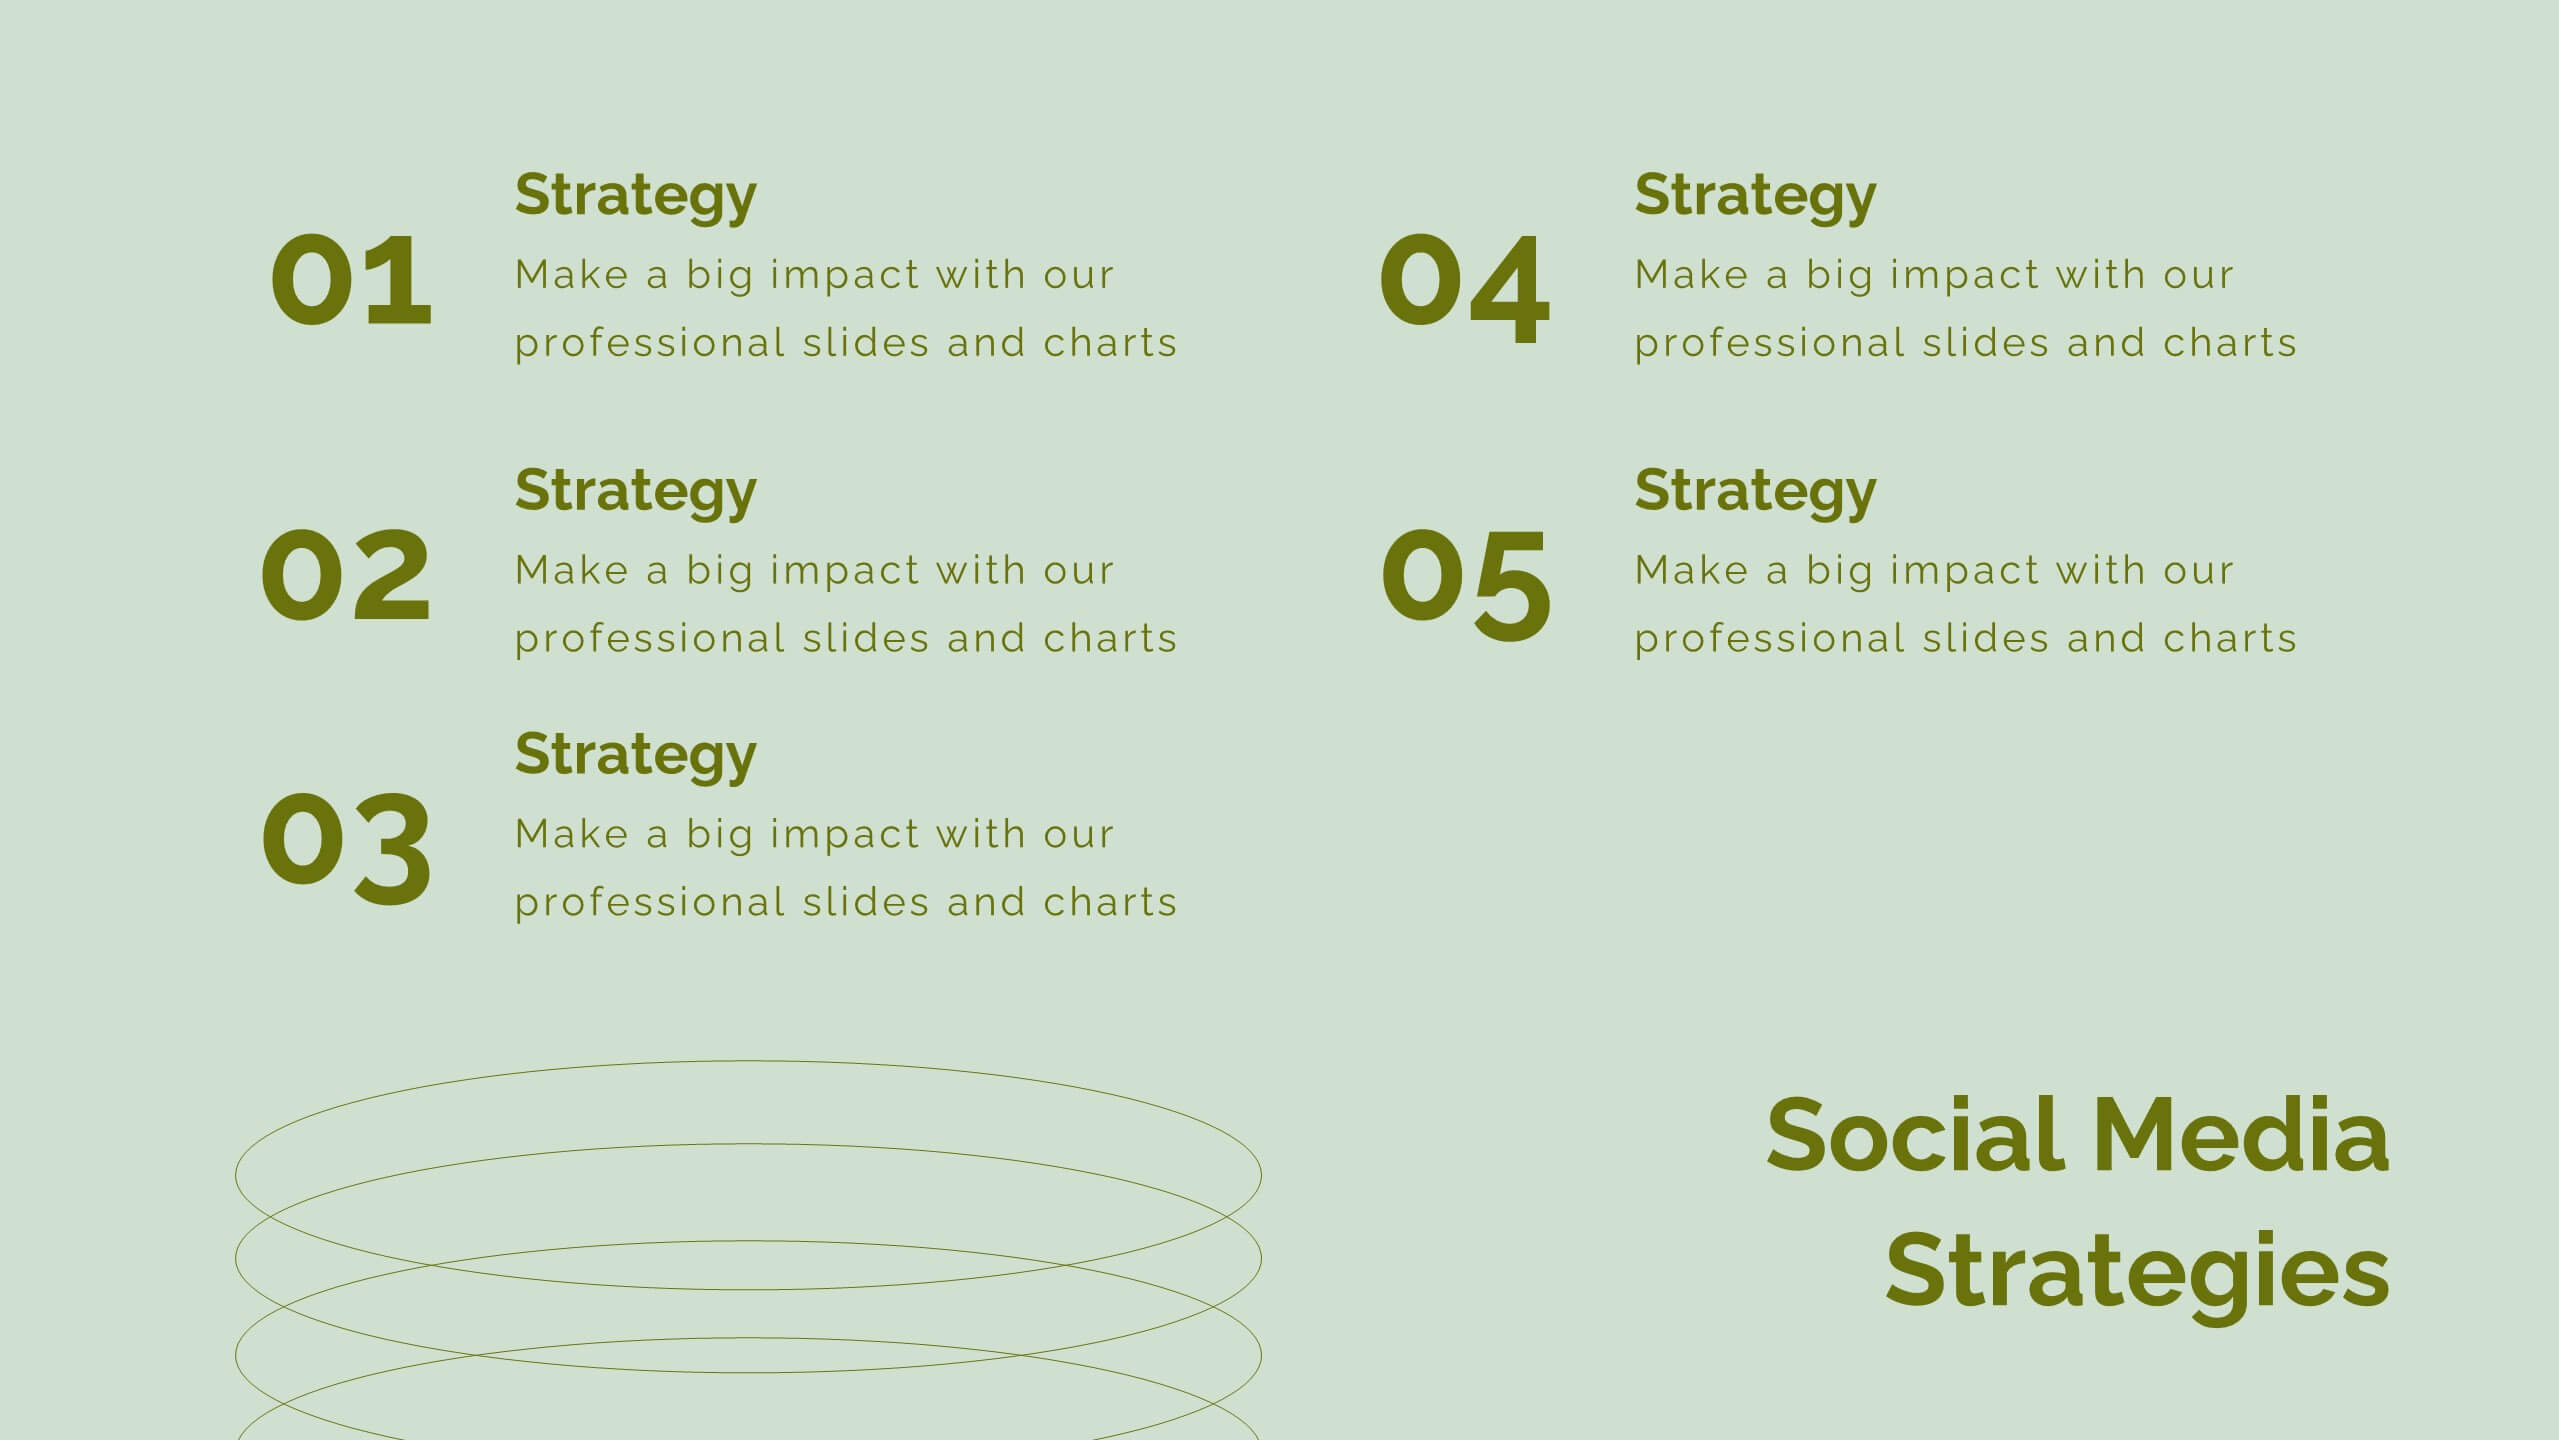
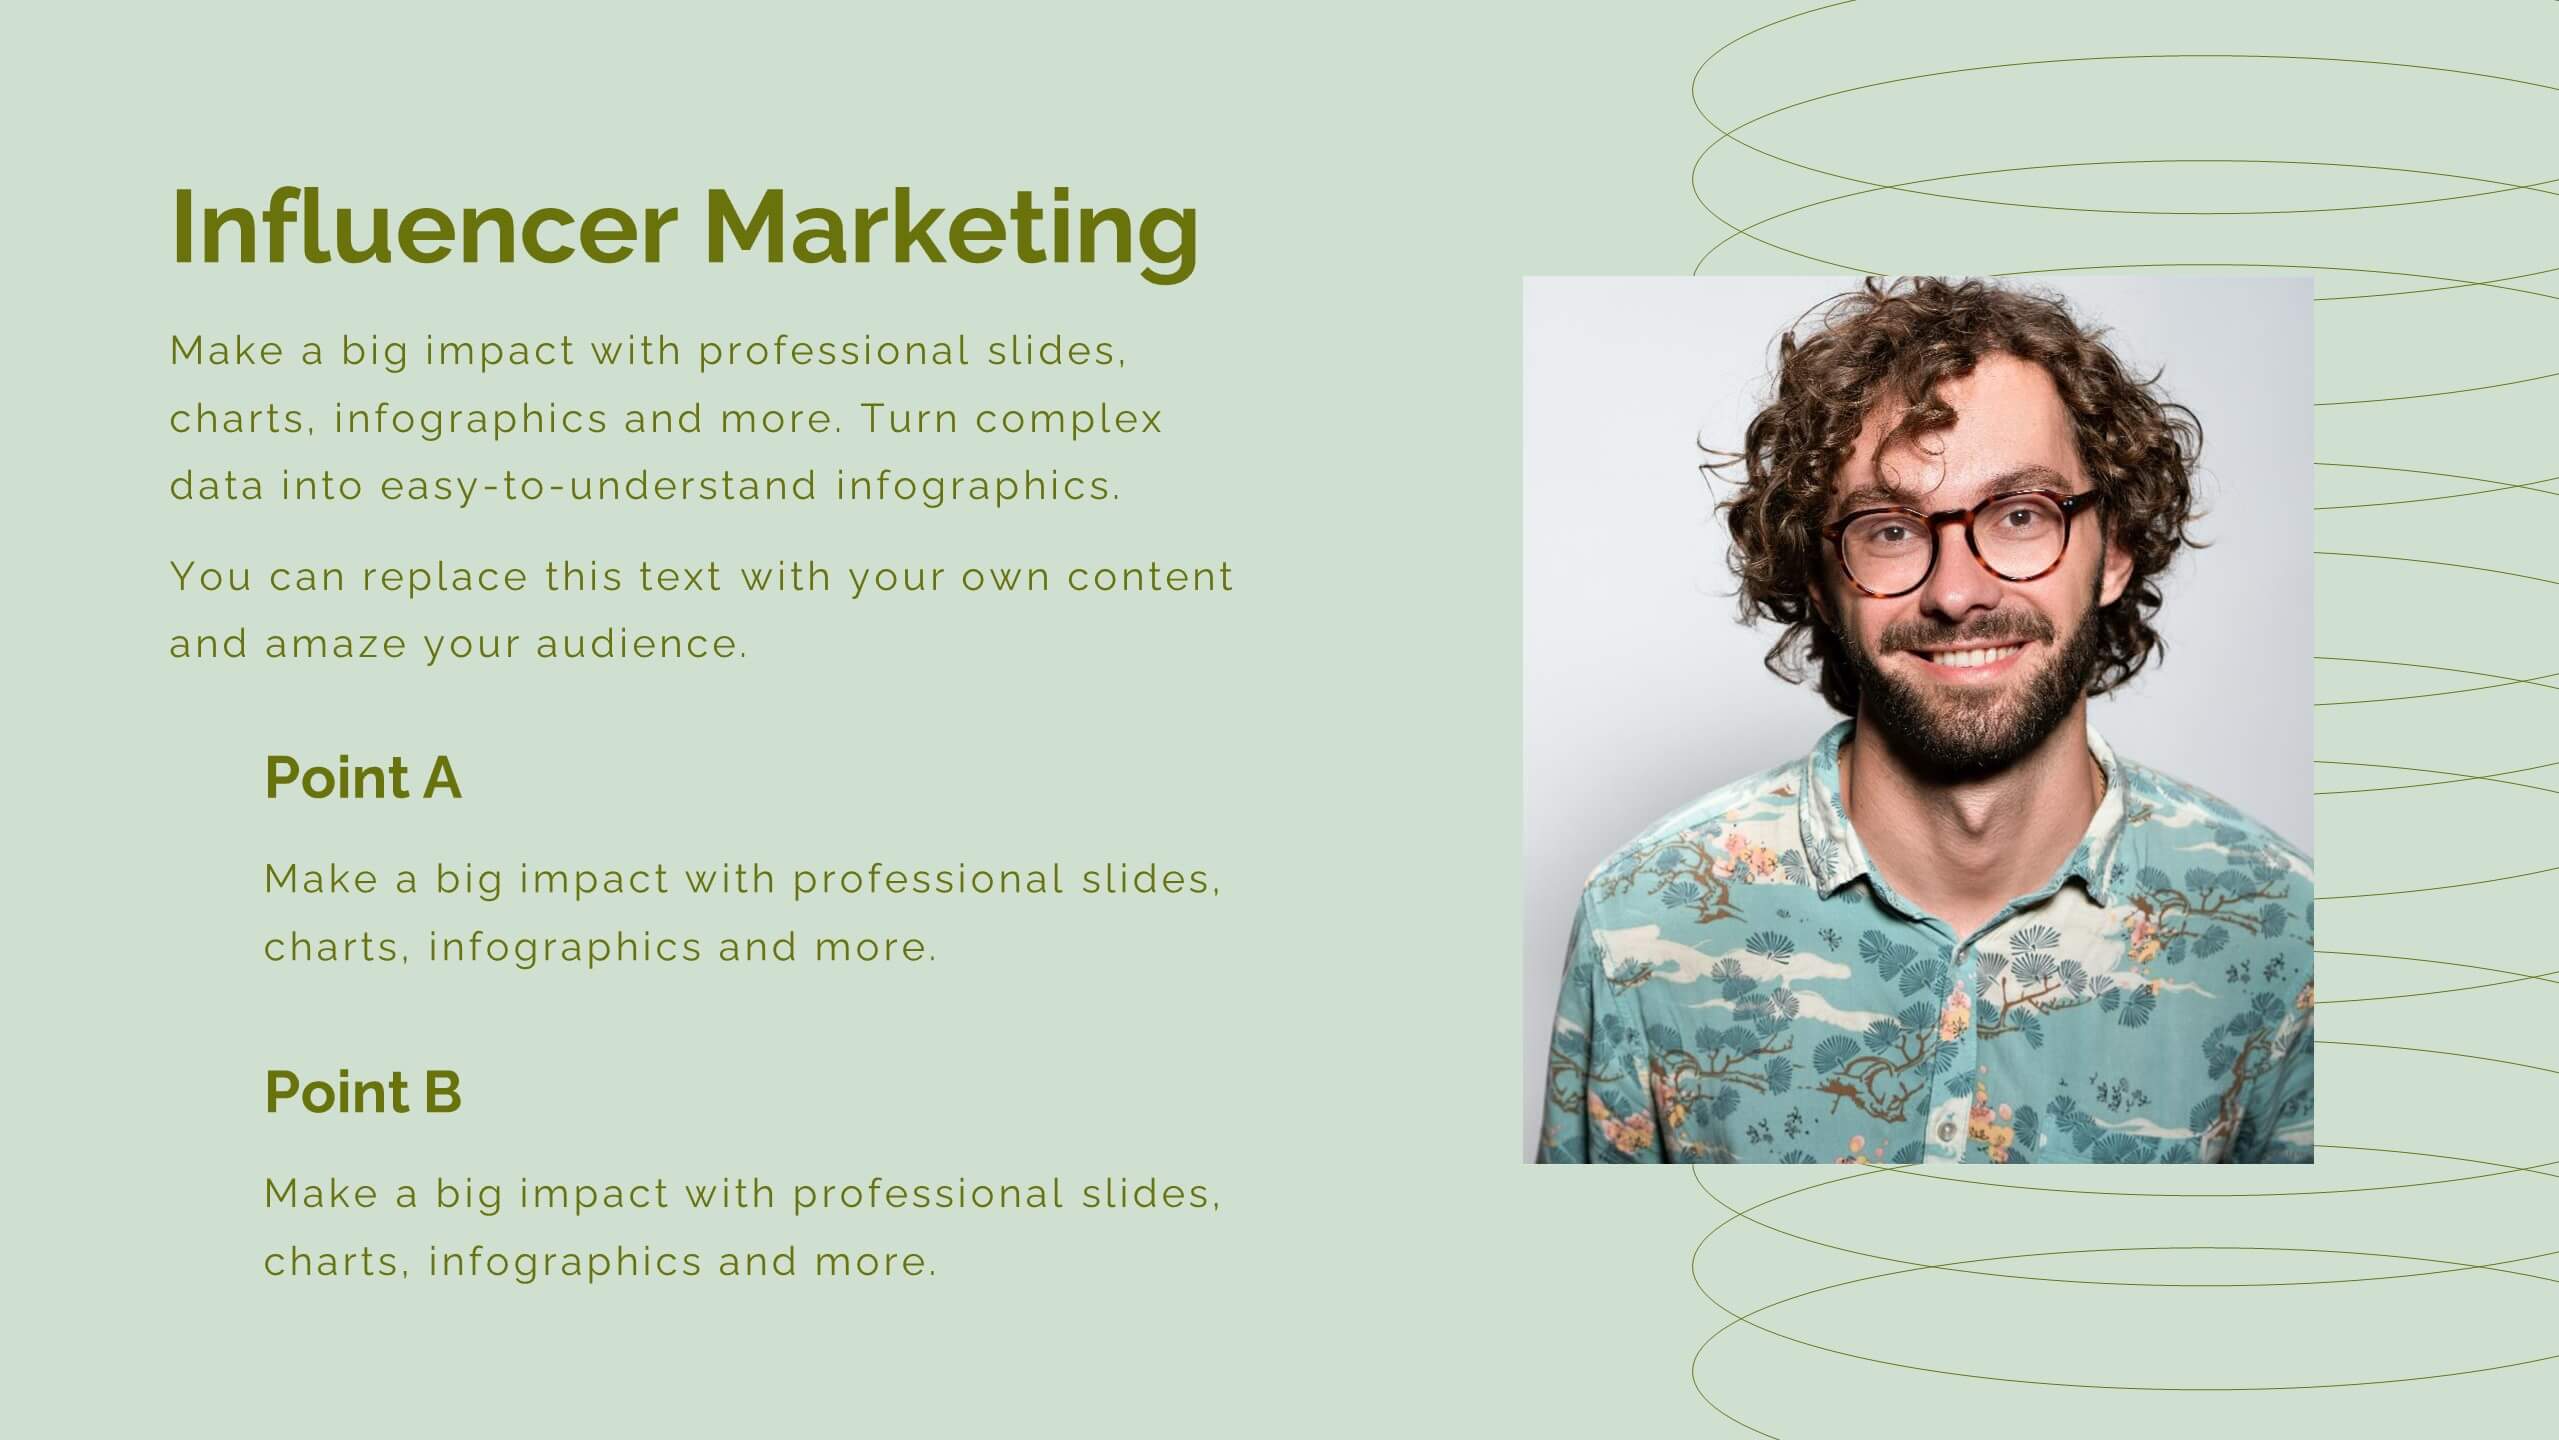
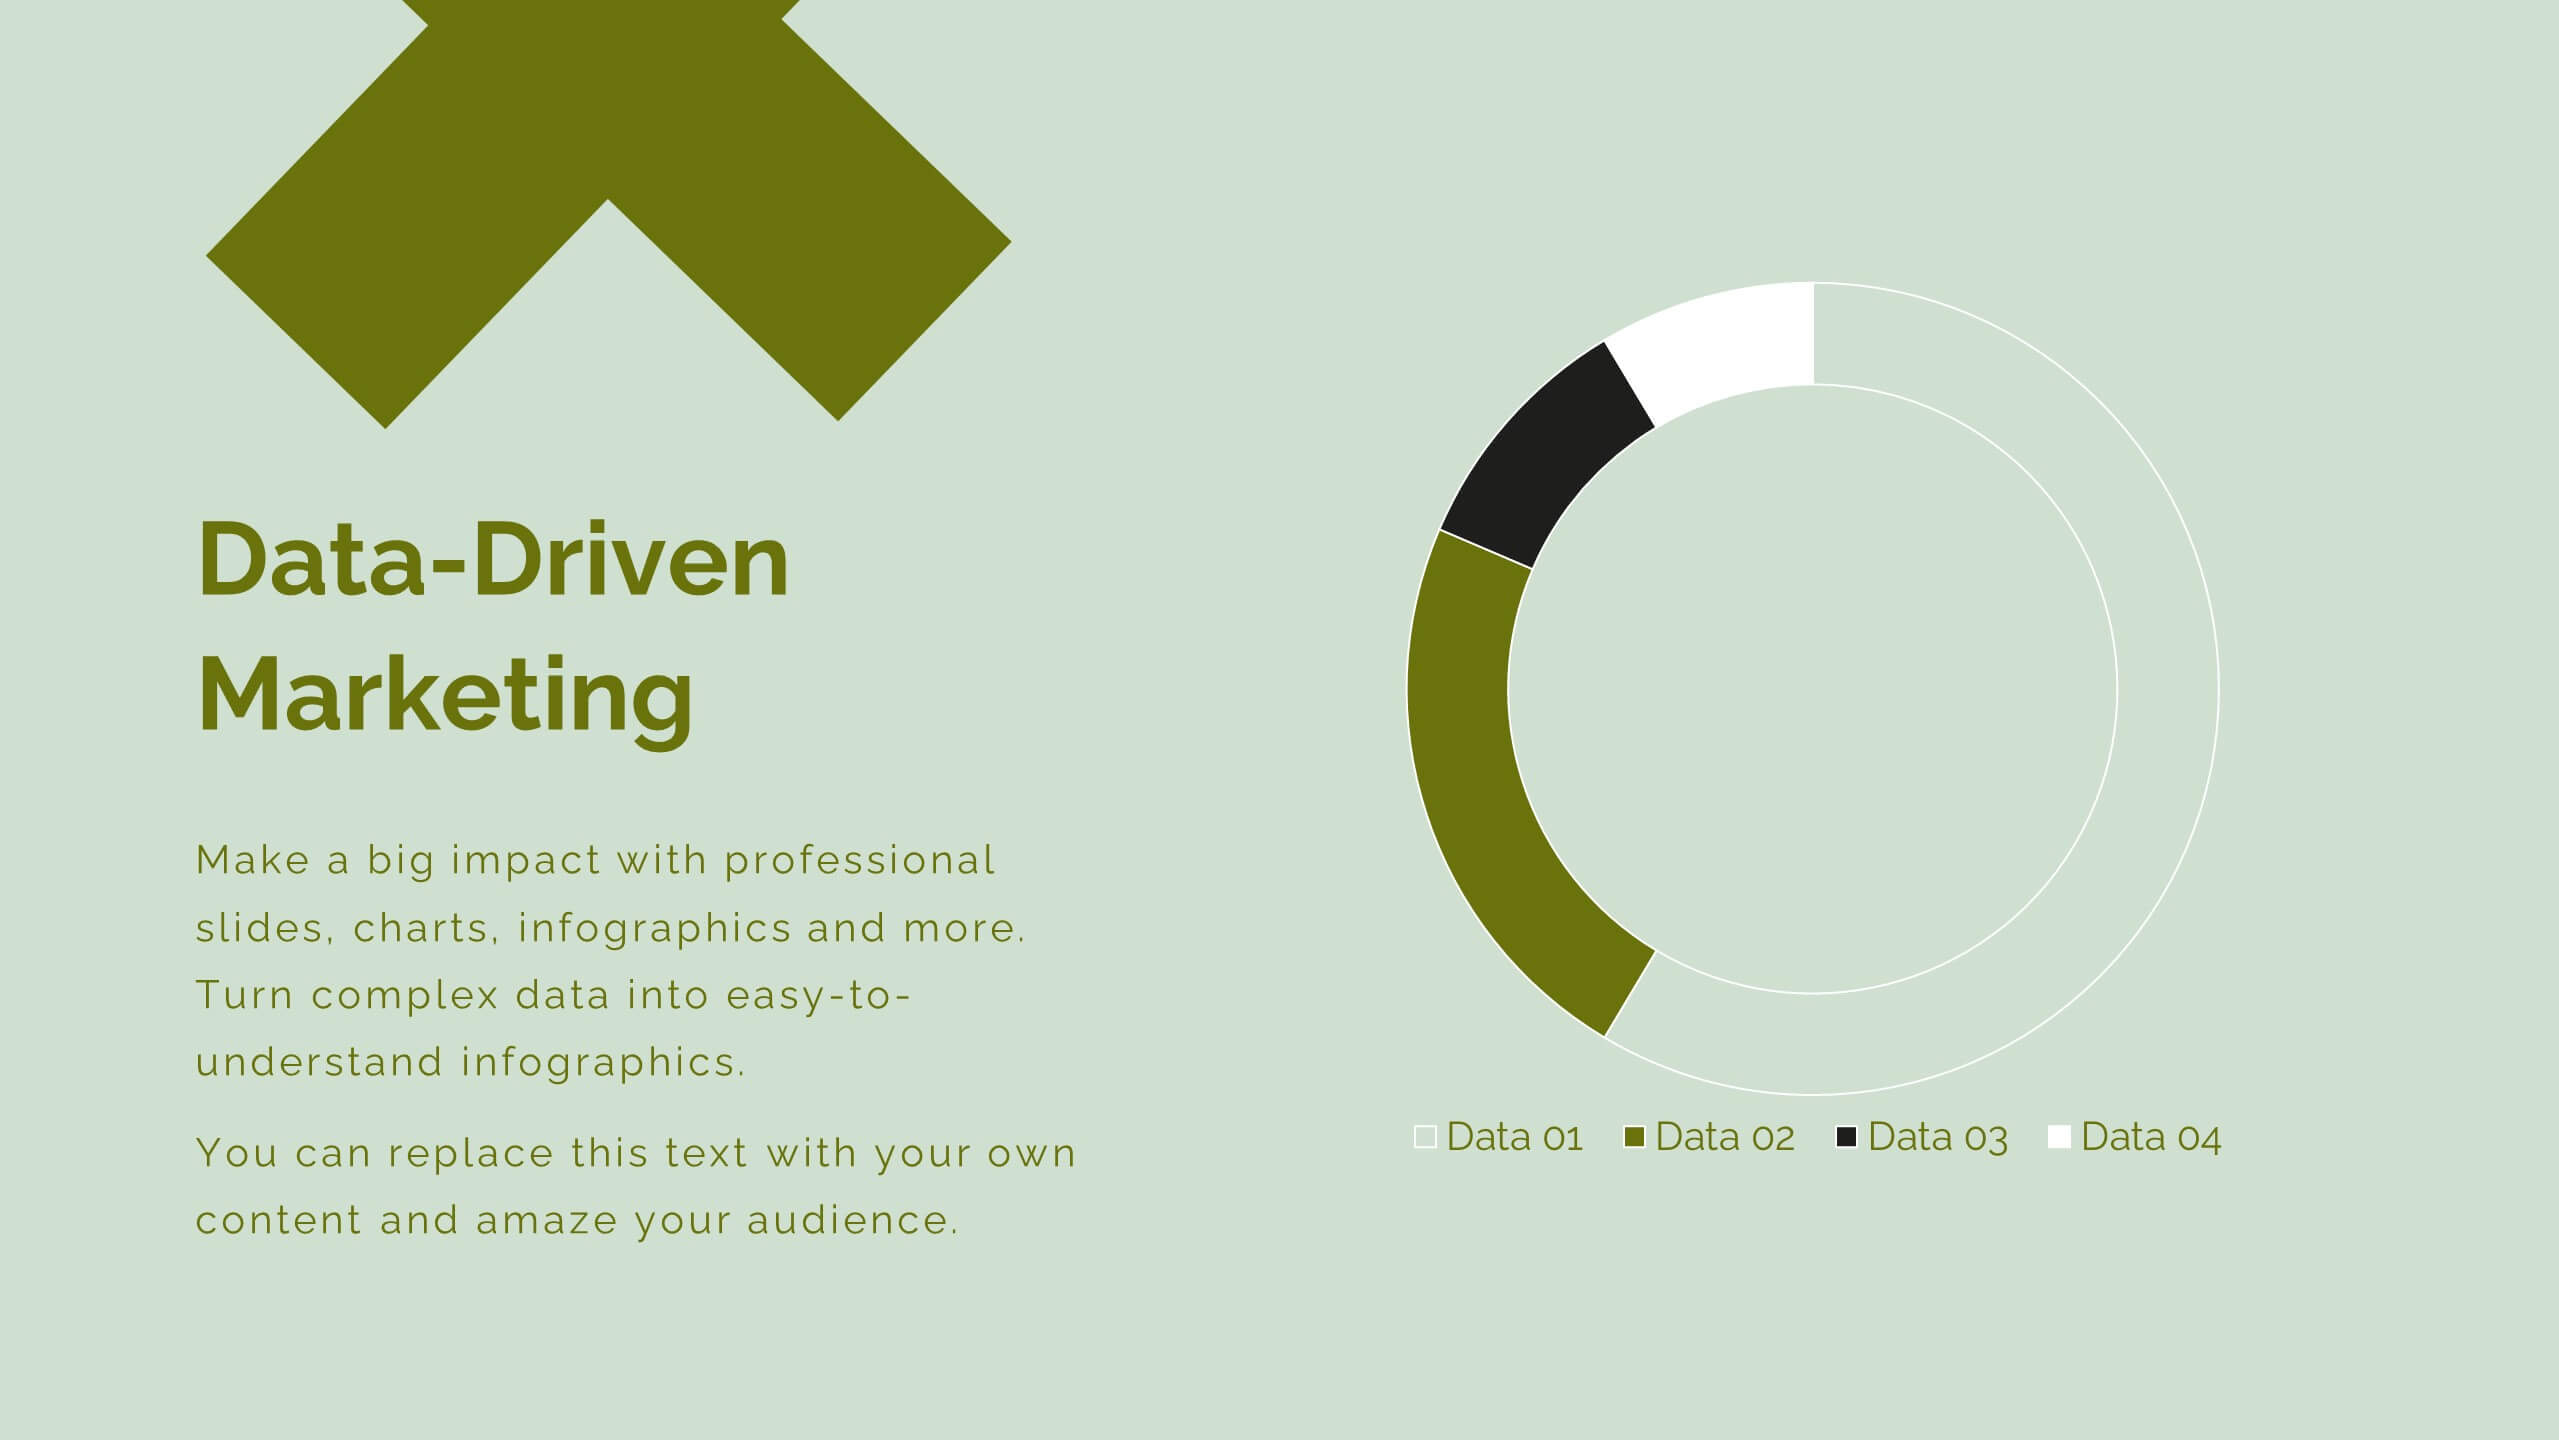
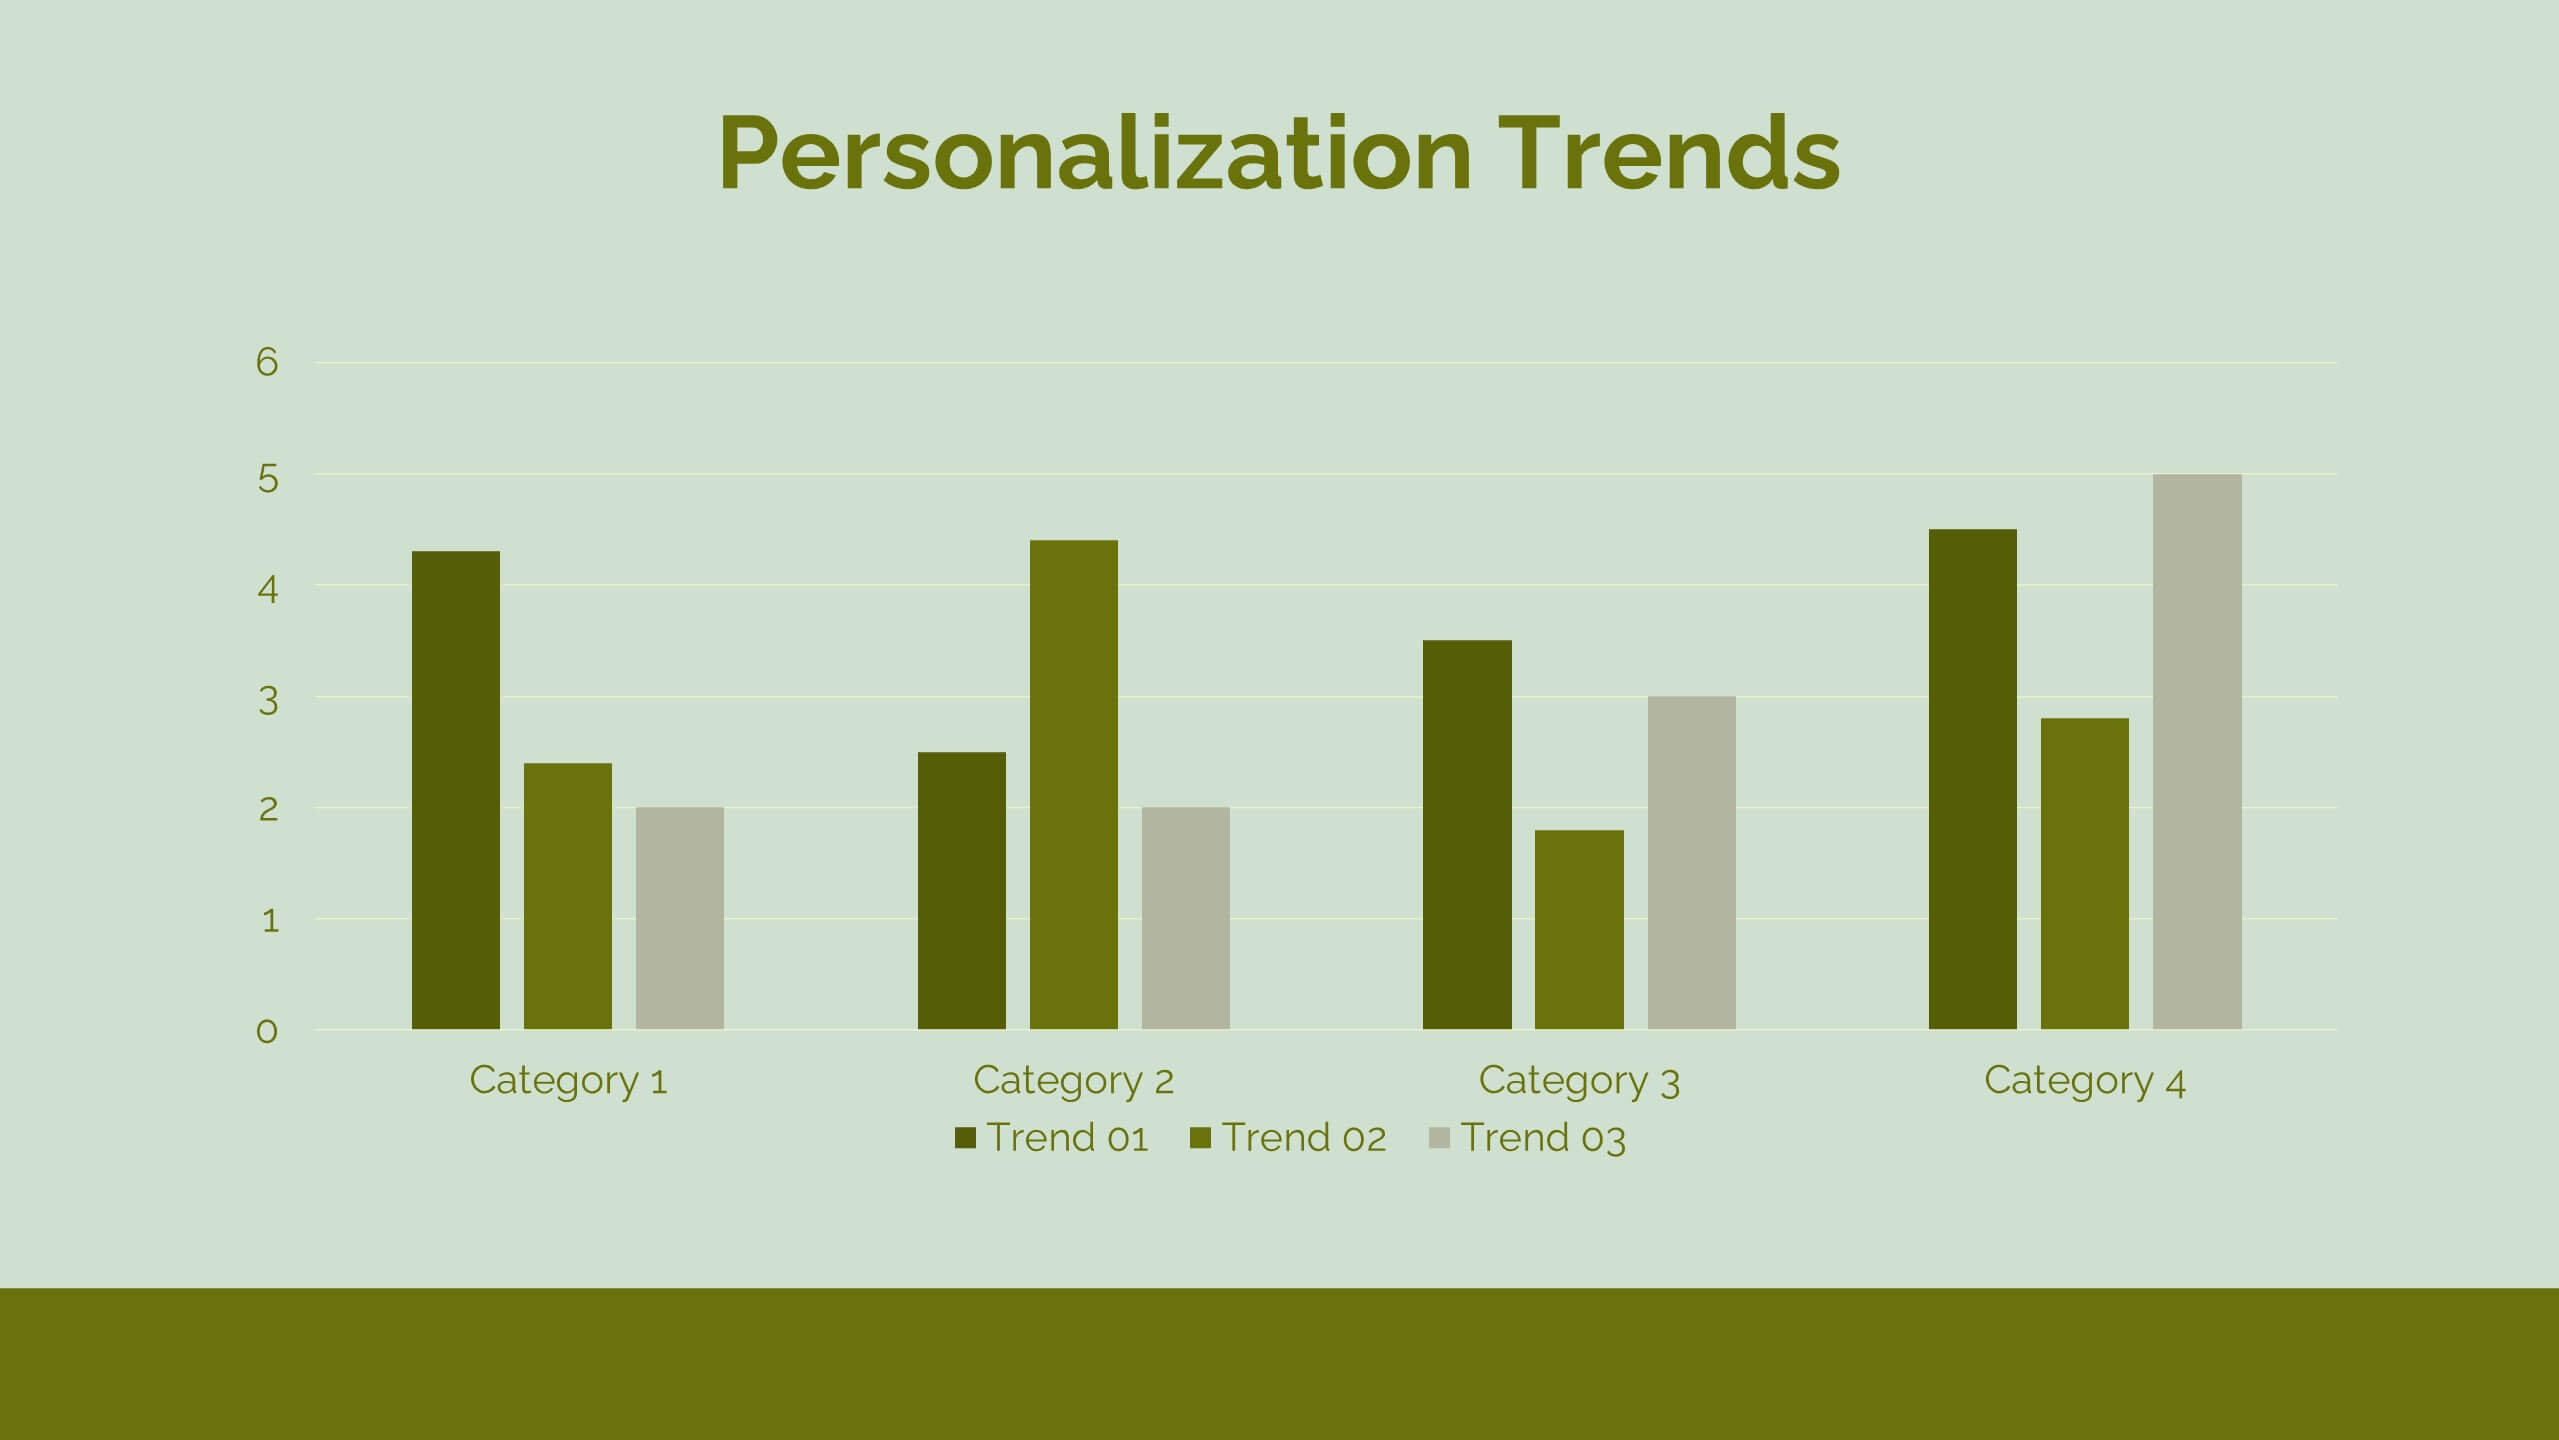
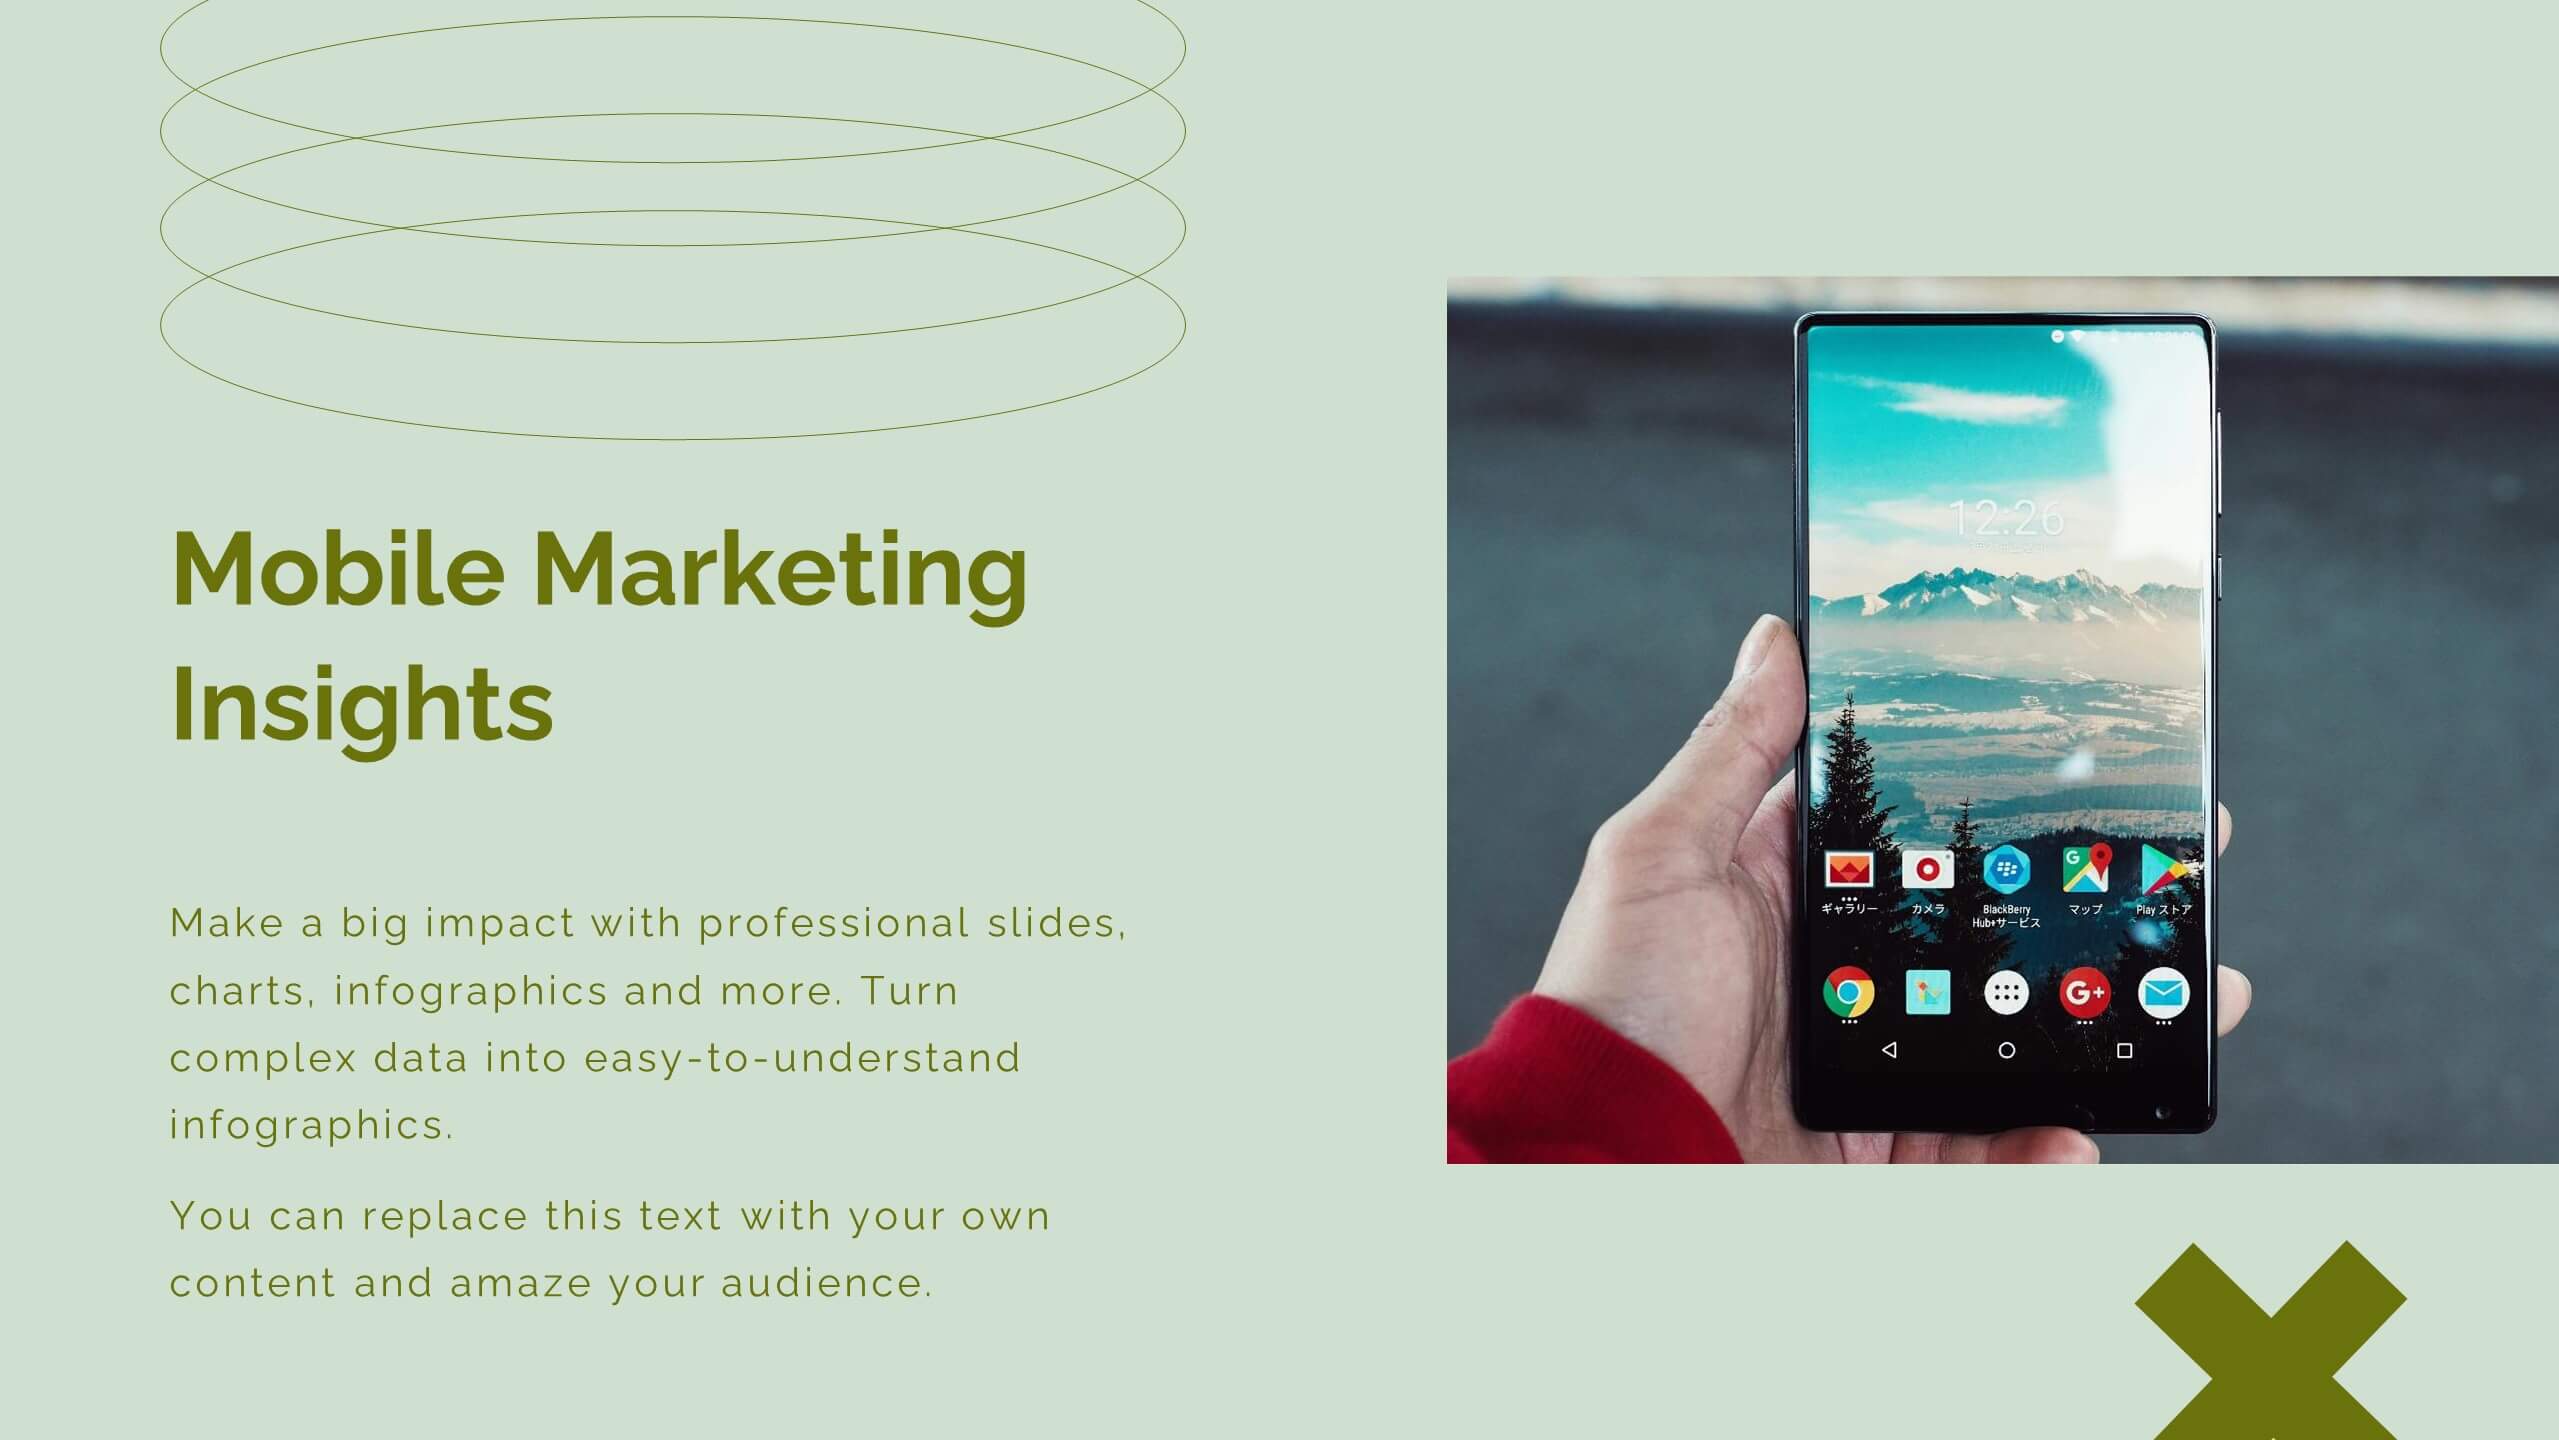
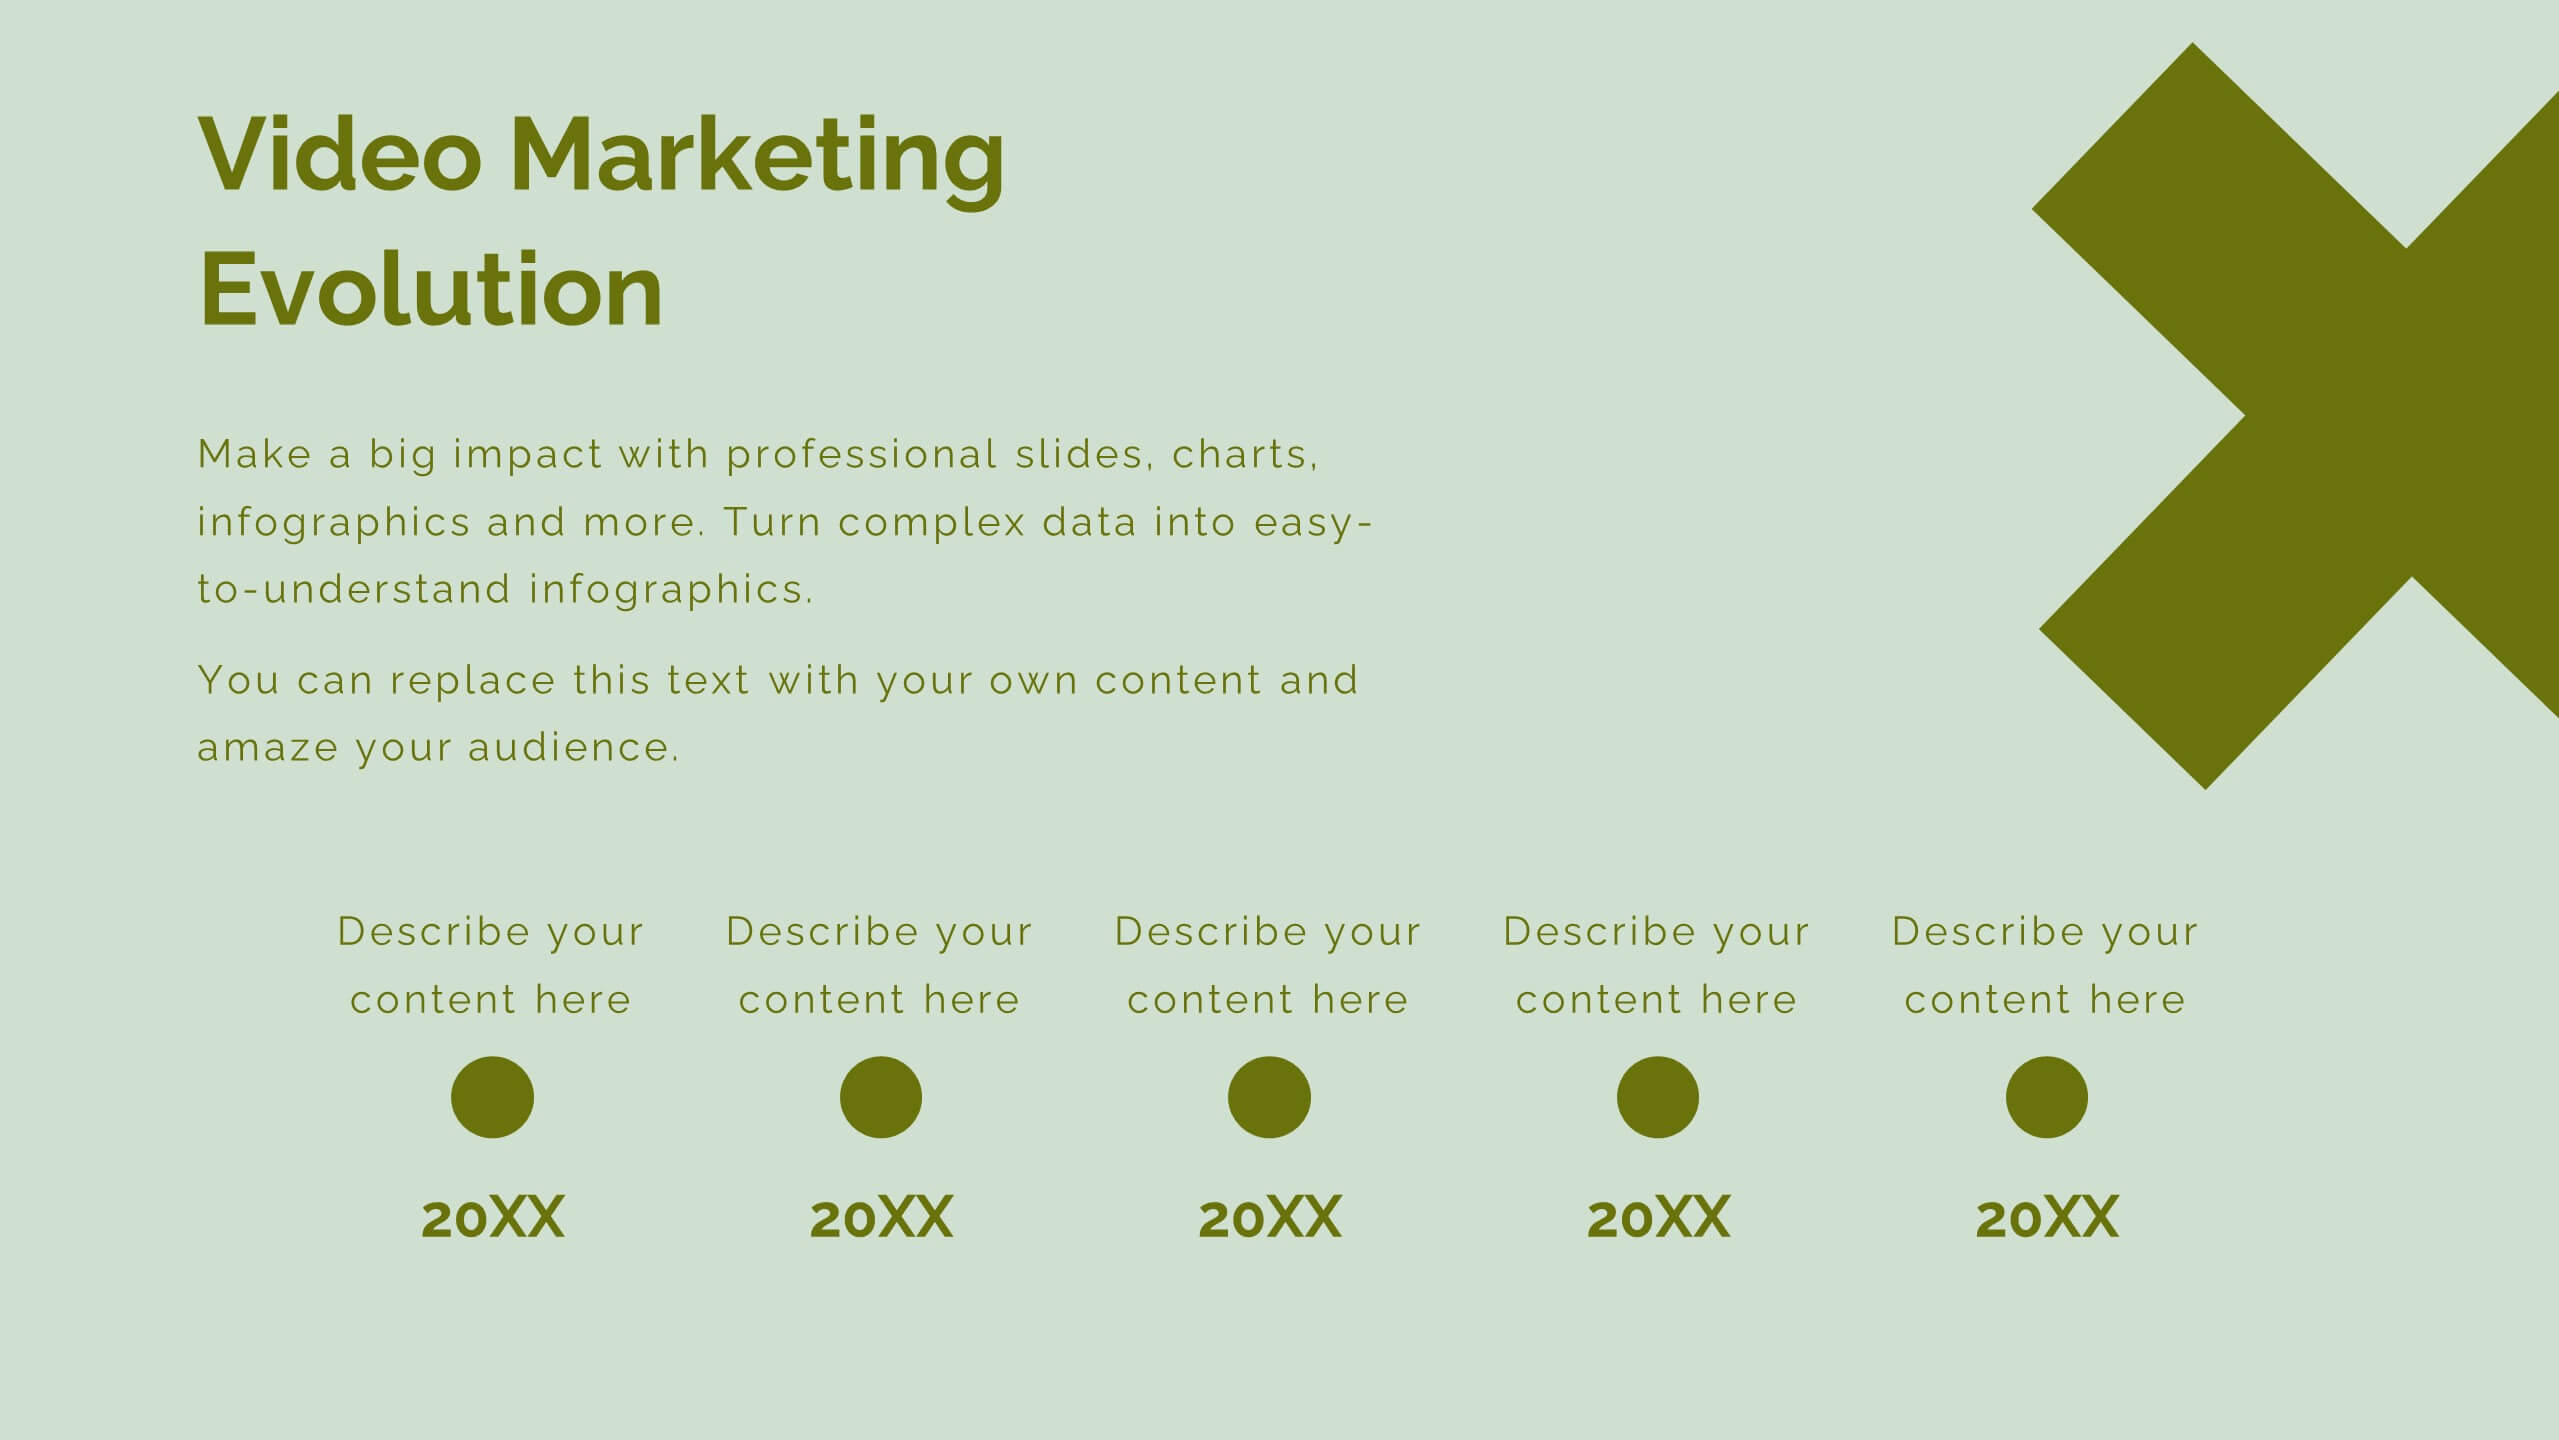
Aura Digital Marketing Strategy Plan Presentation
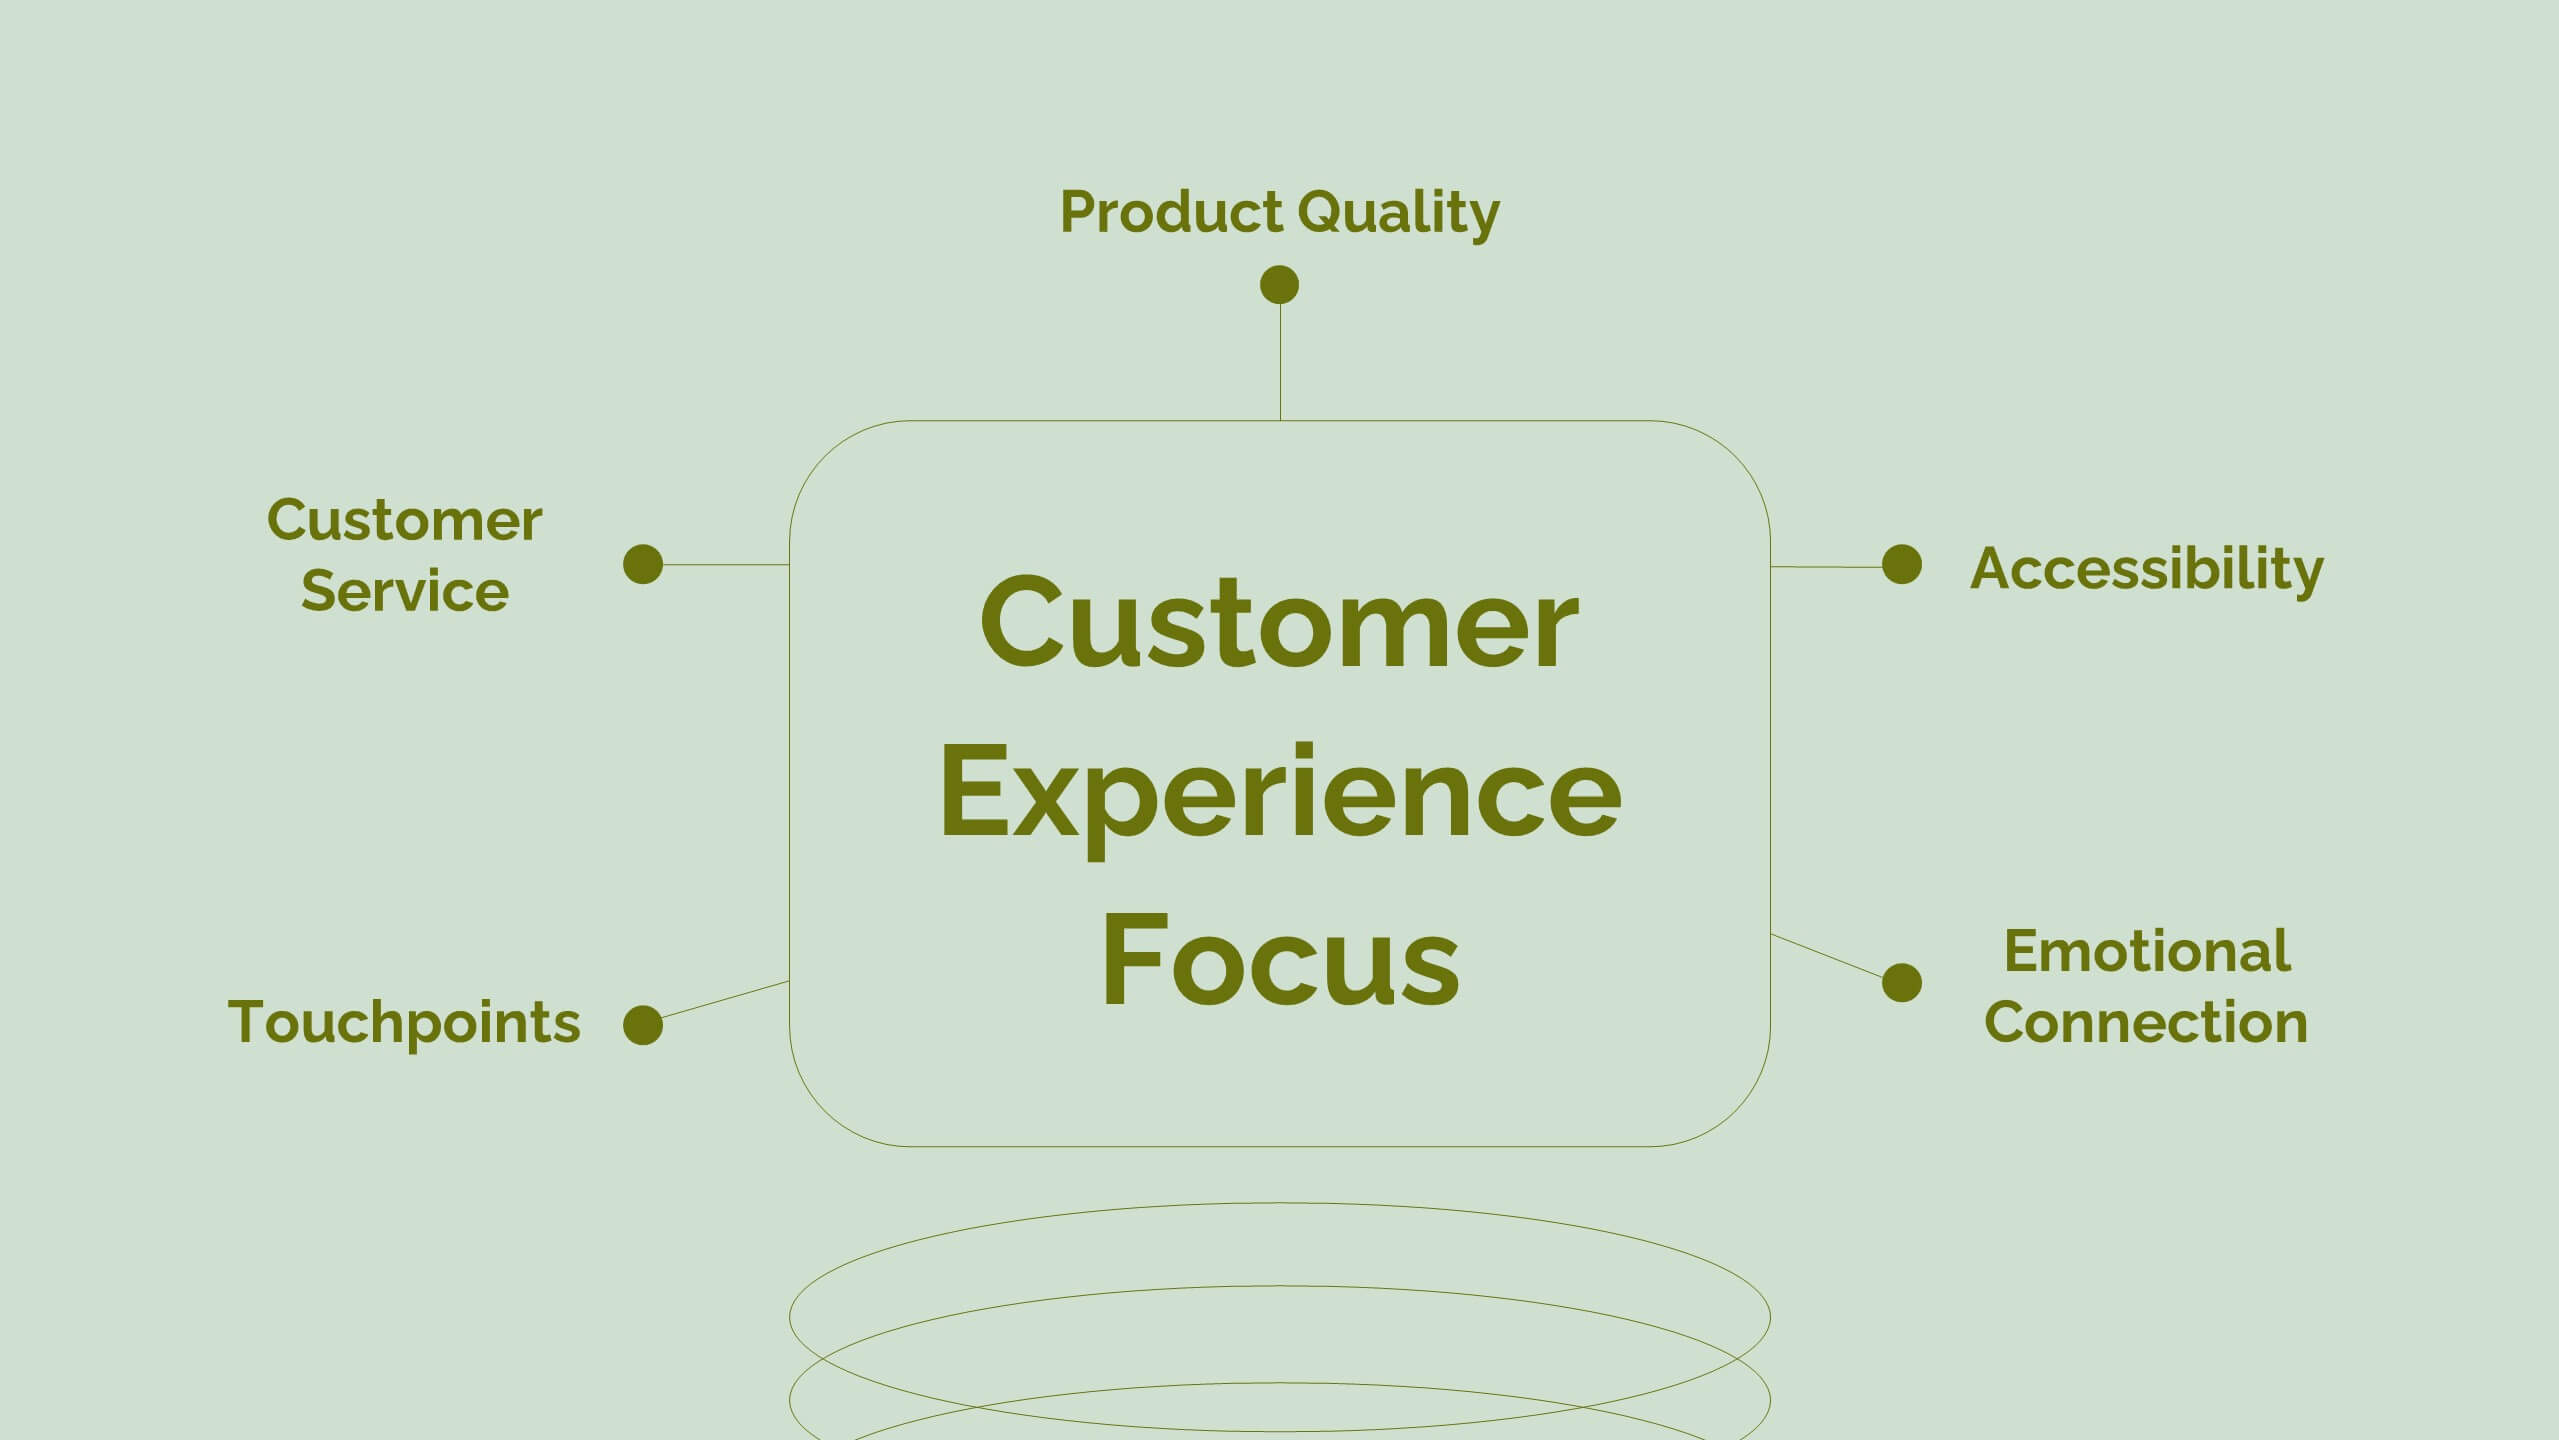
Revamp your digital marketing strategies with this dynamic template! Covering everything from industry overviews and consumer behavior analysis to emerging technologies and social media strategies, this template has it all. Perfect for creating compelling presentations that highlight data-driven marketing and brand storytelling. Compatible with PowerPoint, Keynote, and Google Slides.


5 slides
USA Resources Map Infographics
A USA resources map is a visual representation of the natural resources found in different regions of the United States. This presentation template showcases the diverse natural resources found across the United States. It provides an overview of different types of resources, including minerals, energy sources, agricultural products, and more, allowing viewers to understand the richness and distribution of resources in the country. This can provide valuable information for industries, researchers, and students to understand the distribution and utilization of natural resources across the country.


6 slides
Risk Management in Insurance Presentation
Ensure Stability and Security with this Risk Management in Insurance Presentation template. Featuring a shield-themed layout, this slide effectively communicates key risk assessment strategies, mitigation plans, and compliance measures in the insurance sector. Ideal for insurance professionals, financial risk analysts, and compliance teams, this fully editable template is compatible with PowerPoint, Keynote, and Google Slides, allowing you to tailor the content to your specific risk management needs.


8 slides
Market Research Survey Analysis Presentation
Present your Market Research Survey Analysis with this visually engaging template, designed for clear data visualization and insights presentation. Featuring an intuitive infographic layout, this template allows you to highlight key survey findings, customer insights, and strategic takeaways. Fully customizable in PowerPoint, Keynote, and Google Slides, you can adjust colors, edit text, and modify icons to align with your business needs.


4 slides
IT Security Infrastructure Overview Presentation
Lock in your audience's attention with a clean, modern visual that breaks down tech barriers. This presentation template offers a snapshot of critical IT security components—think firewalls, cloud infrastructure, and data safeguards—making it easier to explain complex systems. Fully editable and compatible with PowerPoint, Keynote, and Google Slides for effortless customization.


6 slides
5-Year Financial Forecast Slide Presentation
Show your long-term growth with a clean, visual touch that makes numbers easy to follow and goals clear to everyone. This modern layout highlights yearly progress using engaging icons and percentage indicators, perfect for financial reports or investor decks. Fully compatible with PowerPoint, Keynote, and Google Slides for seamless editing.


5 slides
Timeline Road Infographics
Timelines are important tools for organizing and presenting information chronologically. This timeline infographic is designed to help ensure that all your tasks are completed on time, and that the project stays on track. This is perfect for identifying potential issues that may arise during a project, so that they can be addressed before they become major problems. This template consists of a road or a horizontal line, with markers or milestones placed at specific intervals. Each marker represents a significant event or achievement, and is accompanied by a short description, date or time frame.


6 slides
Execution Strategy and Action Plan Breakdown Presentation
Clarify your business roadmap with the Execution Strategy and Action Plan Breakdown Presentation. This template helps visualize each strategic step using a clean, linear layout with colorful icons. Perfect for outlining processes, task flows, or operational plans. Easily editable in Canva, PowerPoint, and Google Slides for maximum flexibility.


6 slides
Sports Equipment Infographics
The "Sports Equipment" infographic template is a dynamic and engaging tool, perfectly crafted for PowerPoint, Keynote, and Google Slides. This template is an excellent choice for sports retailers, equipment manufacturers, and fitness enthusiasts who wish to showcase a range of sports gear and its features. The template vividly displays various types of sports equipment, detailing their use, benefits, and technical specifications. It's designed to highlight product features, usage tips, and maintenance advice, making it highly useful for product demonstrations, sales presentations, and customer education. With a vibrant and energetic design, the color scheme of the template is tailored to capture the spirit of sports and fitness. This not only makes the presentation visually striking but also aligns with the themes of activity, energy, and health. Whether used in a retail setting, a trade show, or a fitness workshop, this template ensures that the diverse range of sports equipment is presented in a visually appealing, organized, and informative manner.