


Features
- 5 Unique slides
- Fully editable and easy to edit in Microsoft Powerpoint, Keynote and Google Slides
- 16:9 widescreen layout
- Clean and professional designs
- Export to JPG, PDF or send by email


Do you have any questions?
Recommend


5 slides
Real-Time Data Dashboard Presentation
Bring your data to life with a dynamic layout that tracks key metrics as they shift by the moment. This presentation helps you present trends, performance indicators, and live insights with clarity and impact, ideal for fast-moving teams. Fully compatible with PowerPoint, Keynote, and Google Slides.


22 slides
Simple Pitch Deck Presentation
Streamline your pitch process with this no-frills Pitch Deck template, designed for clear communication and powerful impact. From the get-go, the cover slide clearly announces your purpose, inviting audiences into your business narrative. The template smoothly transitions from one slide to the next, each one a stepping stone in building your case — from problem to solution. It includes a neatly organized table of contents, thought-provoking mission and vision statements, and data-rich slides for a deep dive into your business metrics. Each section, marked with bold, numbered headers, keeps your presentation on track and your audience engaged. A final 'Thank You' slide adds a touch of professionalism, and the credits section ensures that your sources are transparently acknowledged. This pitch deck is ideal for startups and businesses looking to capture attention and convey their story succinctly.


5 slides
Eco-Friendly Practices Implementation Presentation
Brighten your message with a clean, circular design that maps out every green initiative step-by-step. This visual template illustrates key eco-conscious actions, helping you present sustainable practices with ease. Perfect for environmental reports, team strategies, or policy pitches. Fully compatible with PowerPoint, Keynote, and Google Slides for flexible editing.


5 slides
Business SWOT Infographics
Dive deep into organizational analysis with our business SWOT infographics. Crafted in engaging shades of blue and pink, this collection is an essential tool for businesses aiming to uncover their strengths, weaknesses, and threats. This template, brimming with creative graphics and icons, is specifically designed for business strategists, educational instructors, and company executives who are keen to present SWOT analysis with clarity. Compatible with Powerpoint, keynote, and Google Slides. Its vertical, creative styling makes complex information digestible, fostering understanding and strategic thinking in your business planning sessions.


10 slides
Real Estate Market Trends Presentation
Stay ahead of Real Estate Market Trends with this data-driven presentation template. Designed for agents, investors, and analysts, this template visually highlights housing trends, market insights, and investment opportunities with engaging layouts. Fully customizable and available for PowerPoint, Keynote, and Google Slides, ensuring a professional and compelling presentation.


7 slides
Customer Loyalty Program Infographic Presentation
Introducing our new customer loyalty program infographics template, the perfect tool for any business looking to boost customer engagement and loyalty! It's easy for you to create an engaging and effective presentation with these Infographics. With our template, you can add a touch of creativity to your presentation with a fun color scheme and infographic visuals with editable text. Whether you're presenting customer rewards or loyalty program benefits, our template will help you communicate your ideas in a clear and engaging way. So why wait? Start boosting your customer engagement and loyalty today with our amazing template!


6 slides
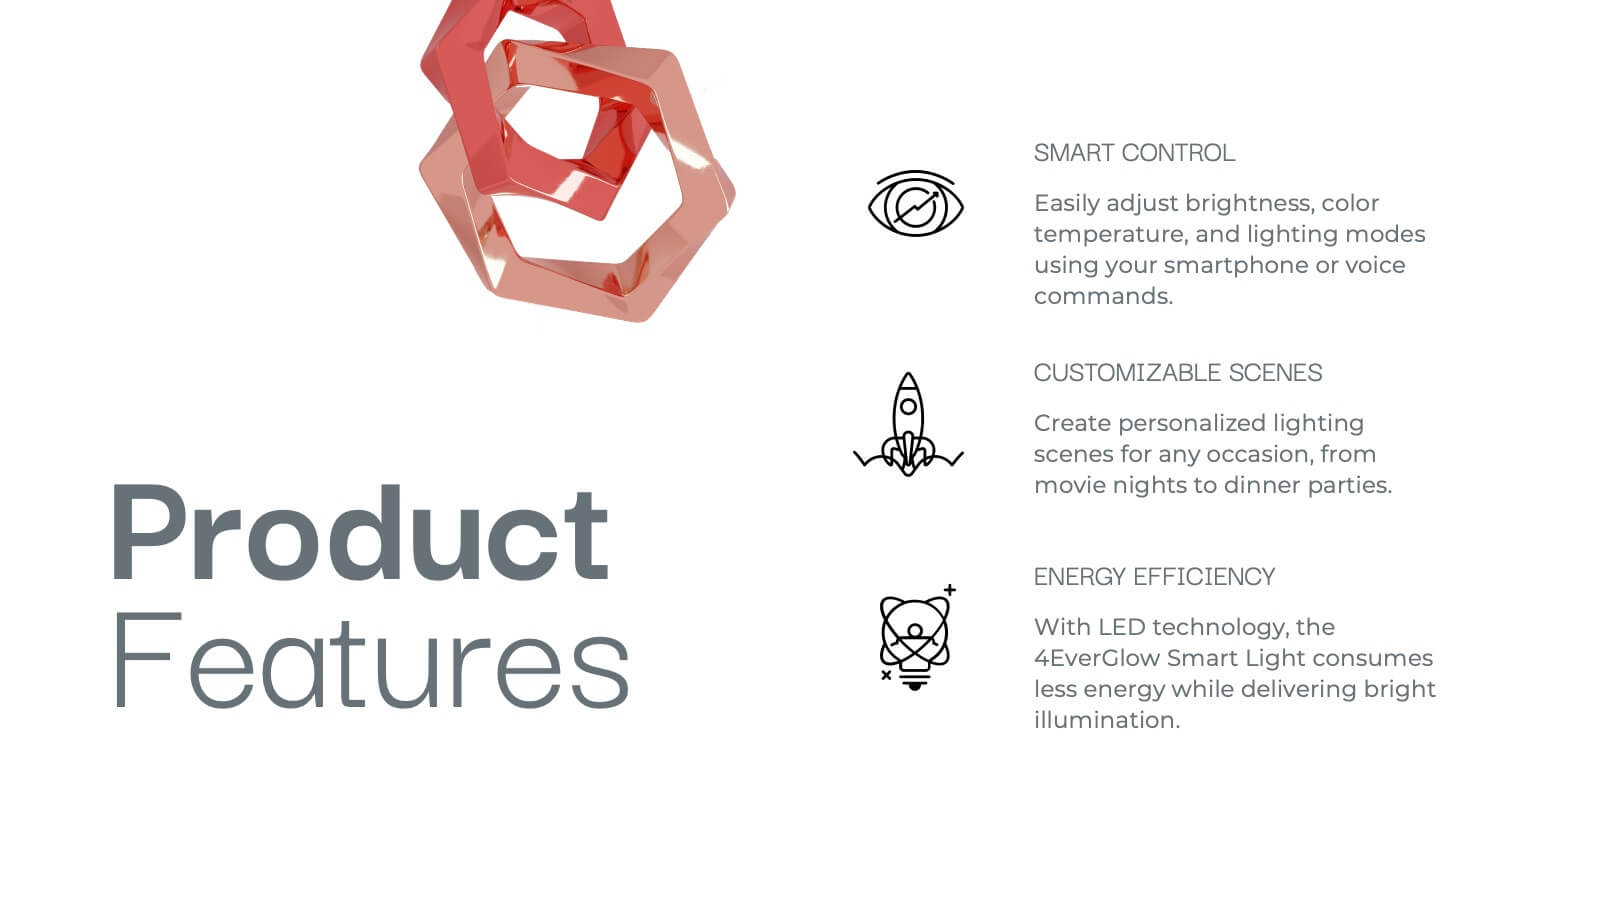
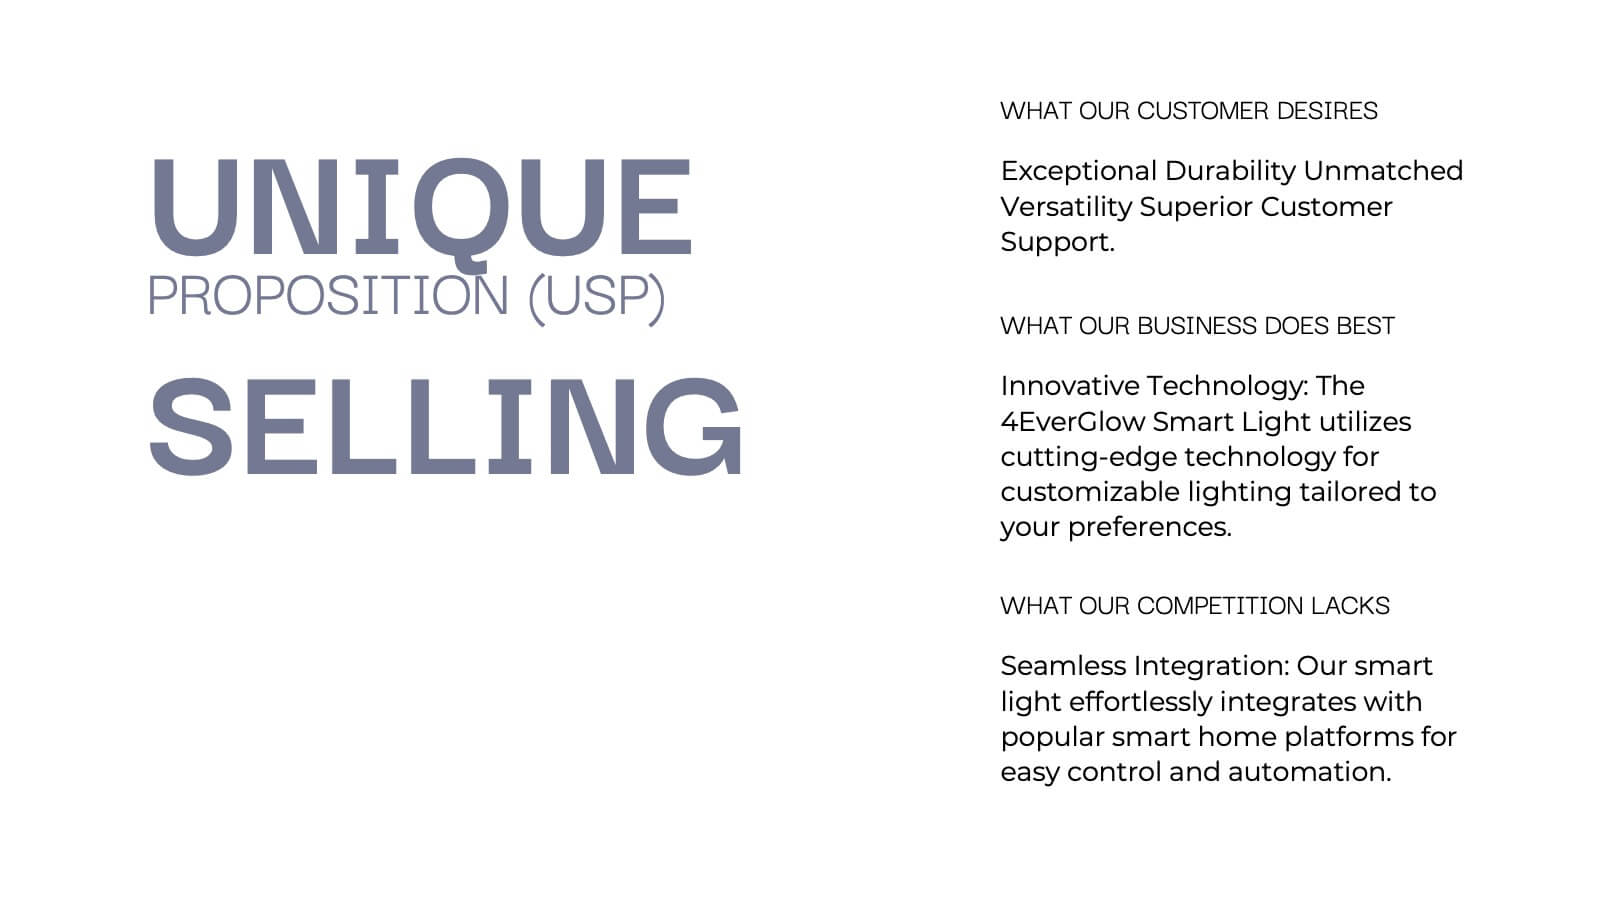
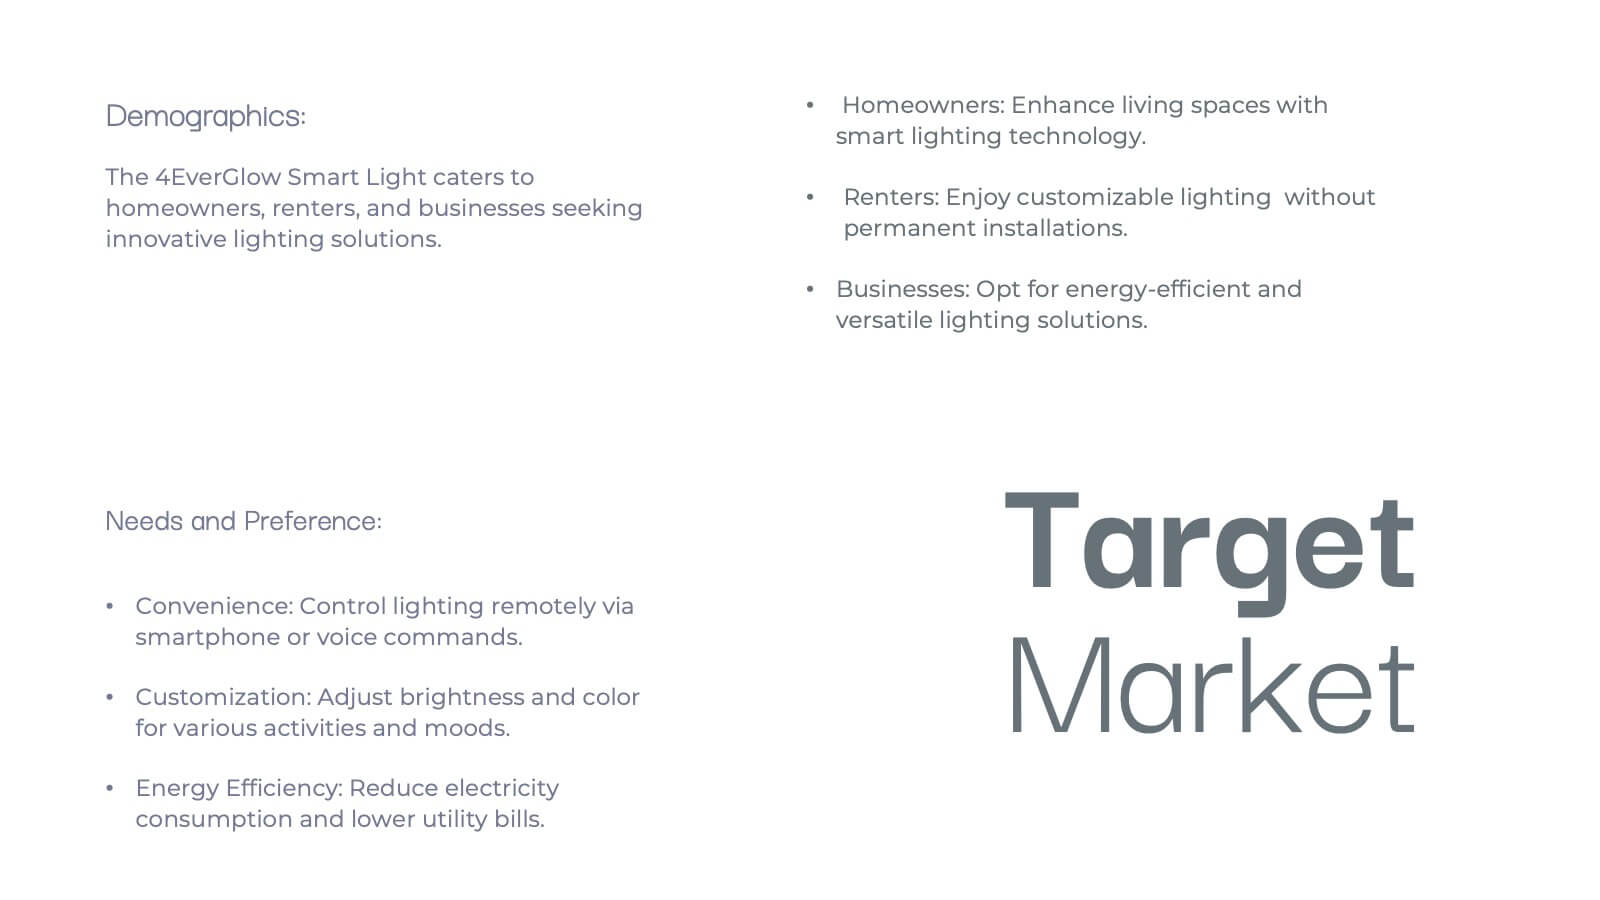
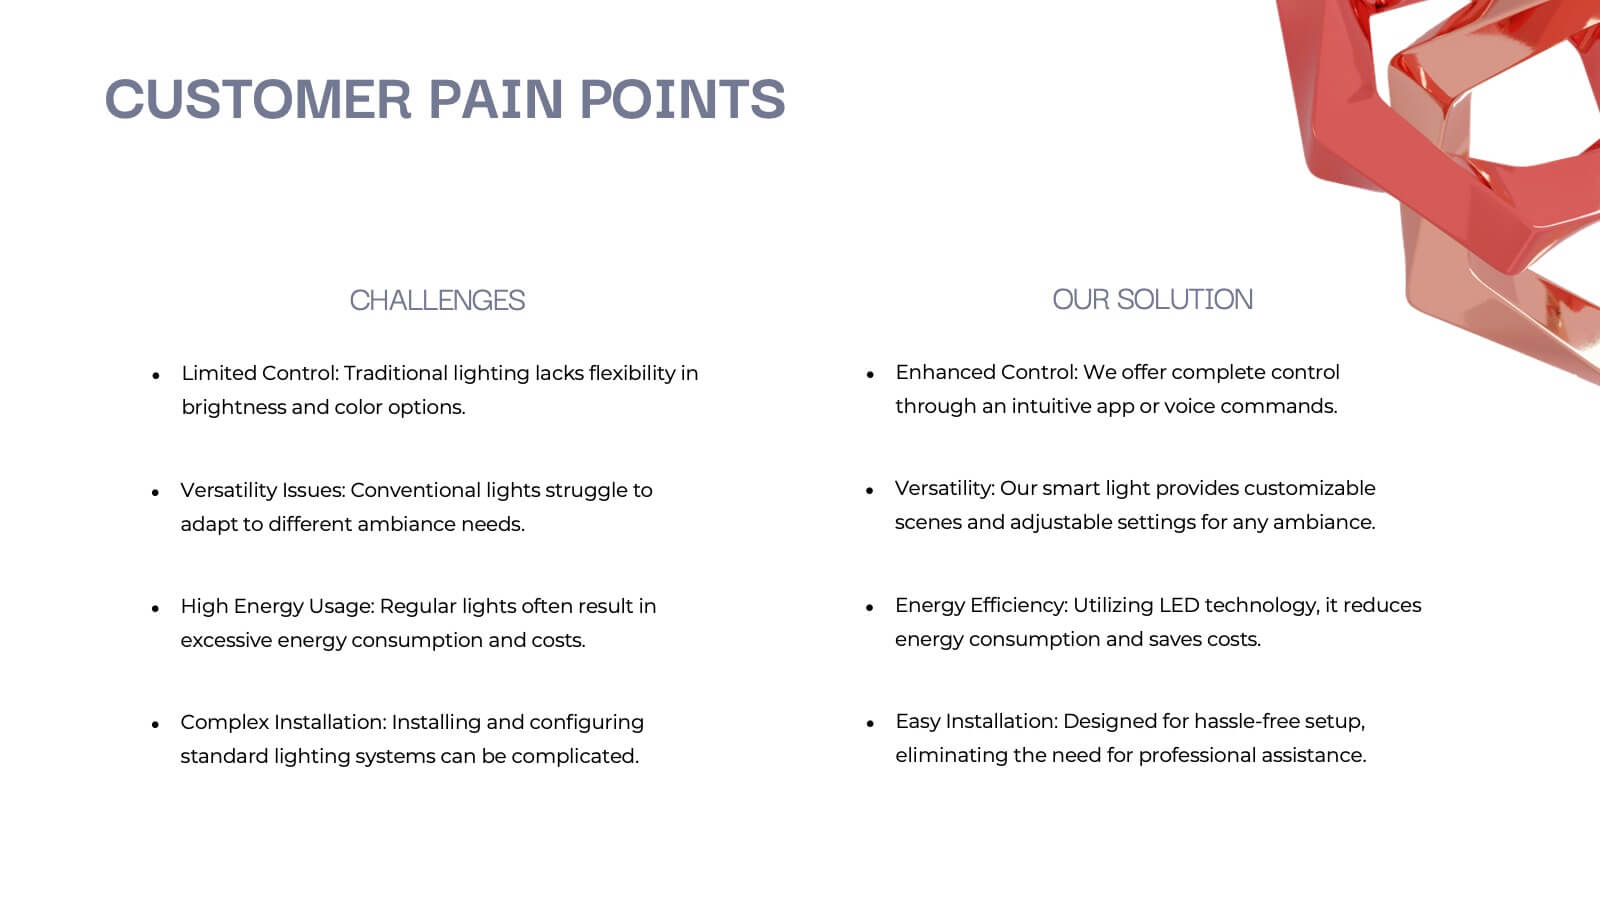
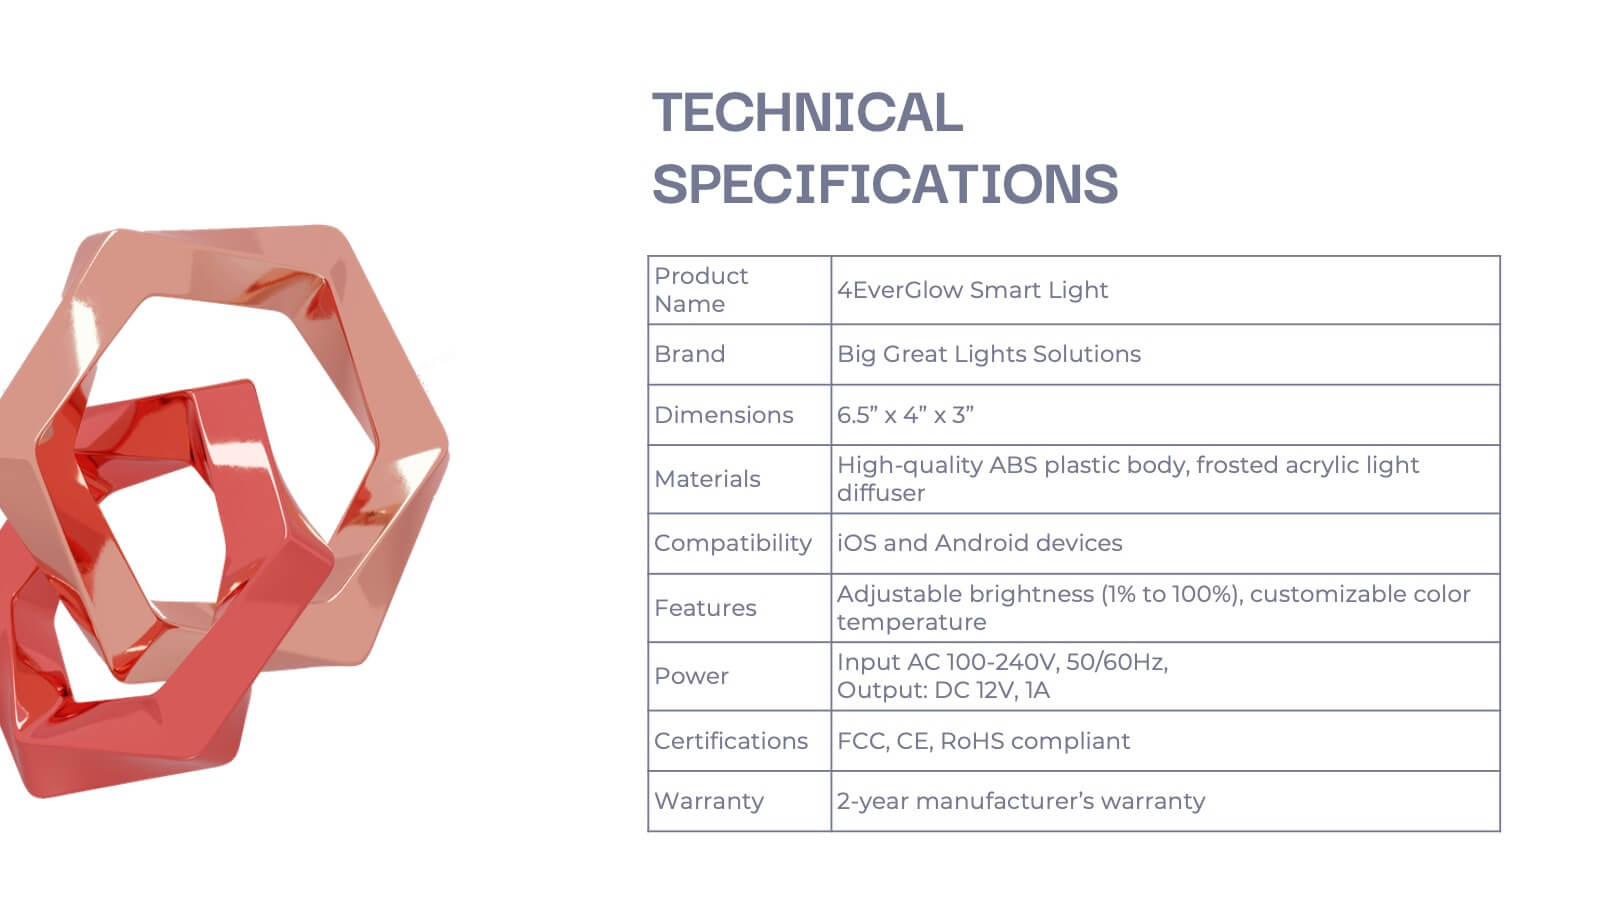
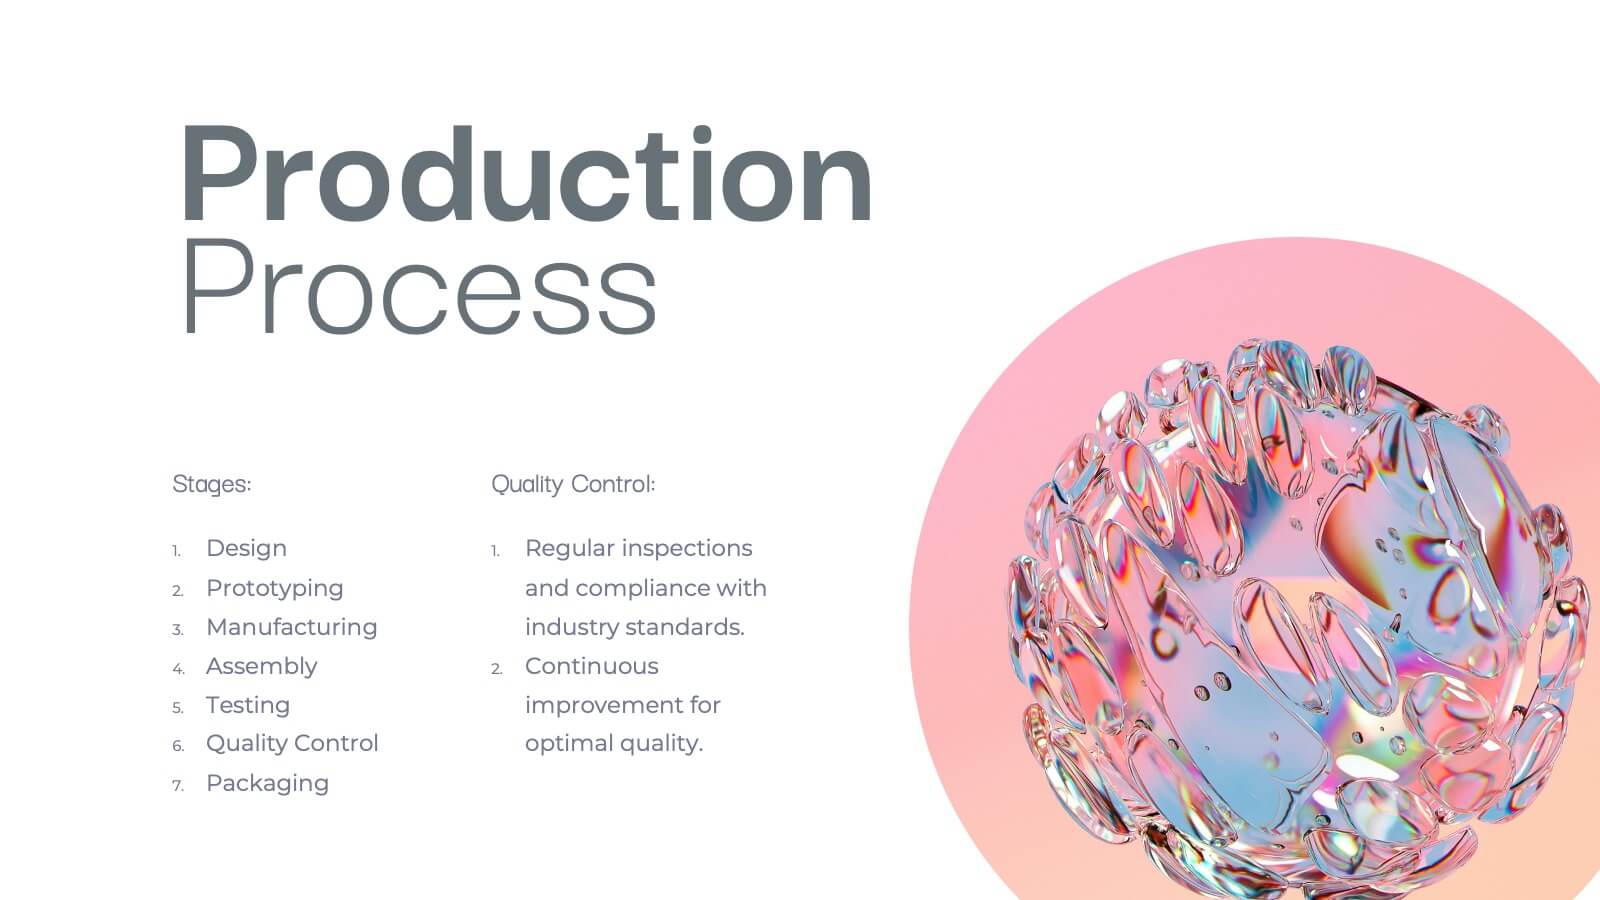
Product Introduction Infographic
Showcase your new products with our series of slide templates designed for impactful product introductions. Each template is crafted to highlight the unique features and benefits of your products, making them ideal for launch presentations, marketing meetings, and stakeholder briefings. Featuring a clean and modern design, these slides are structured to guide the audience through a compelling narrative about your product, from its conception to its market entry. The use of vivid imagery, alongside detailed text descriptions, ensures that each aspect of the product is clearly communicated and visually engaging. Customizable to suit your specific needs, these templates can be adapted to feature your product’s specifications, advantages, and potential impact. They serve as a crucial tool for organizations looking to generate excitement and support for new offerings, providing a professional and persuasive presentation format.


5 slides
Business Issue Root Cause Identification
Pinpoint the real reasons behind business challenges with this clear and visual layout. This root cause identification template breaks down effects and traces them back to their sources, making it easier to align your team and propose actionable solutions. Fully customizable in PowerPoint, Keynote, and Google Slides.


21 slides
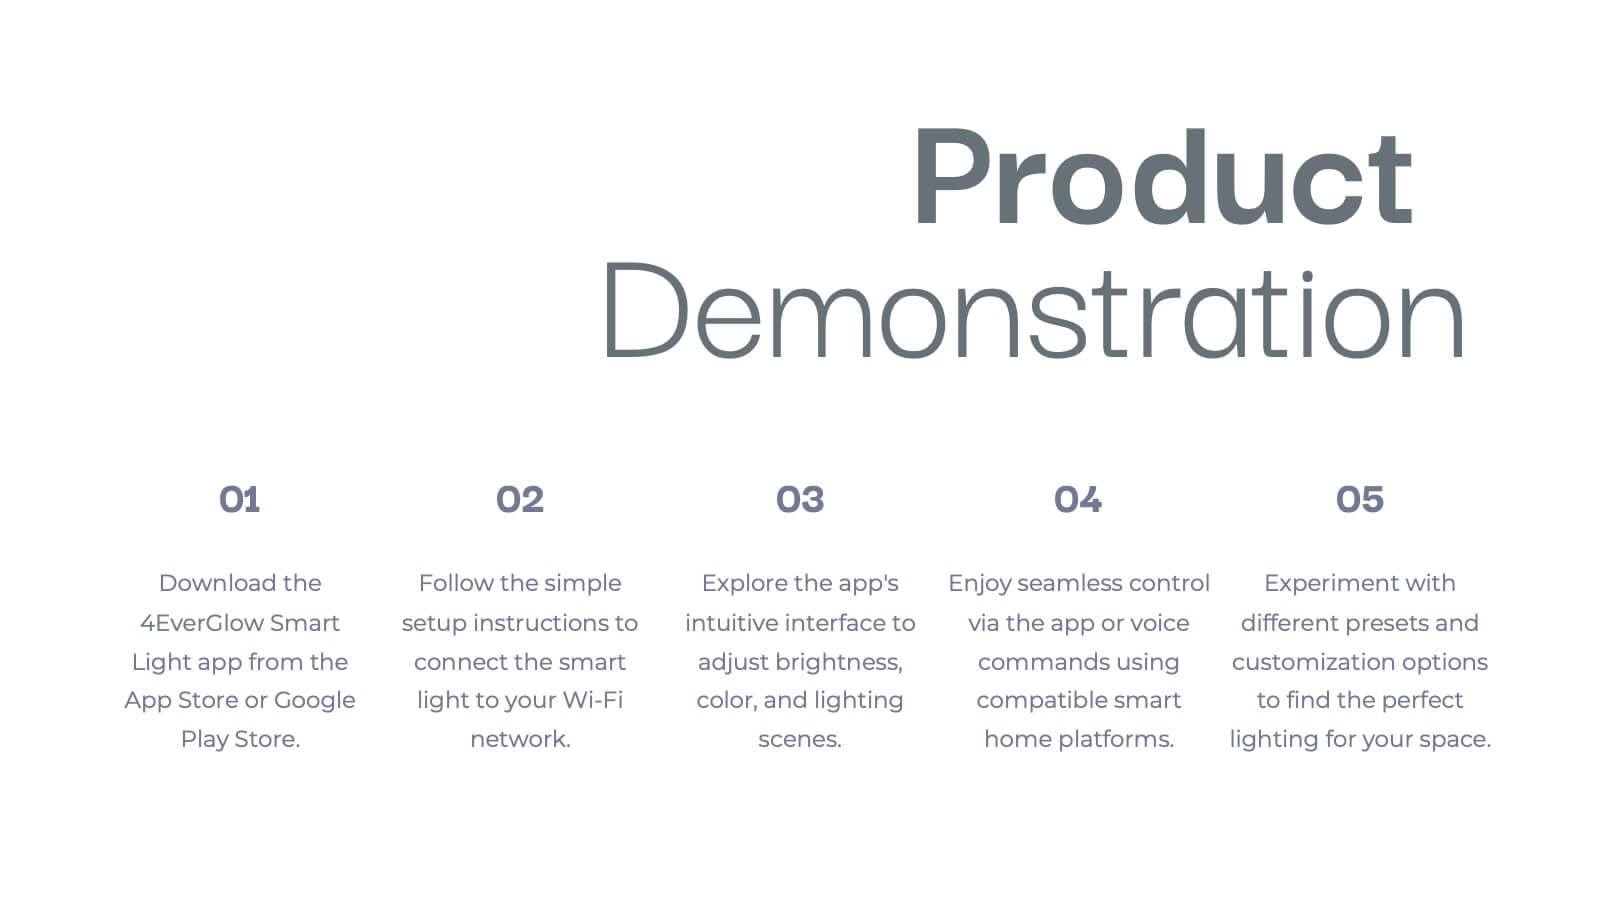
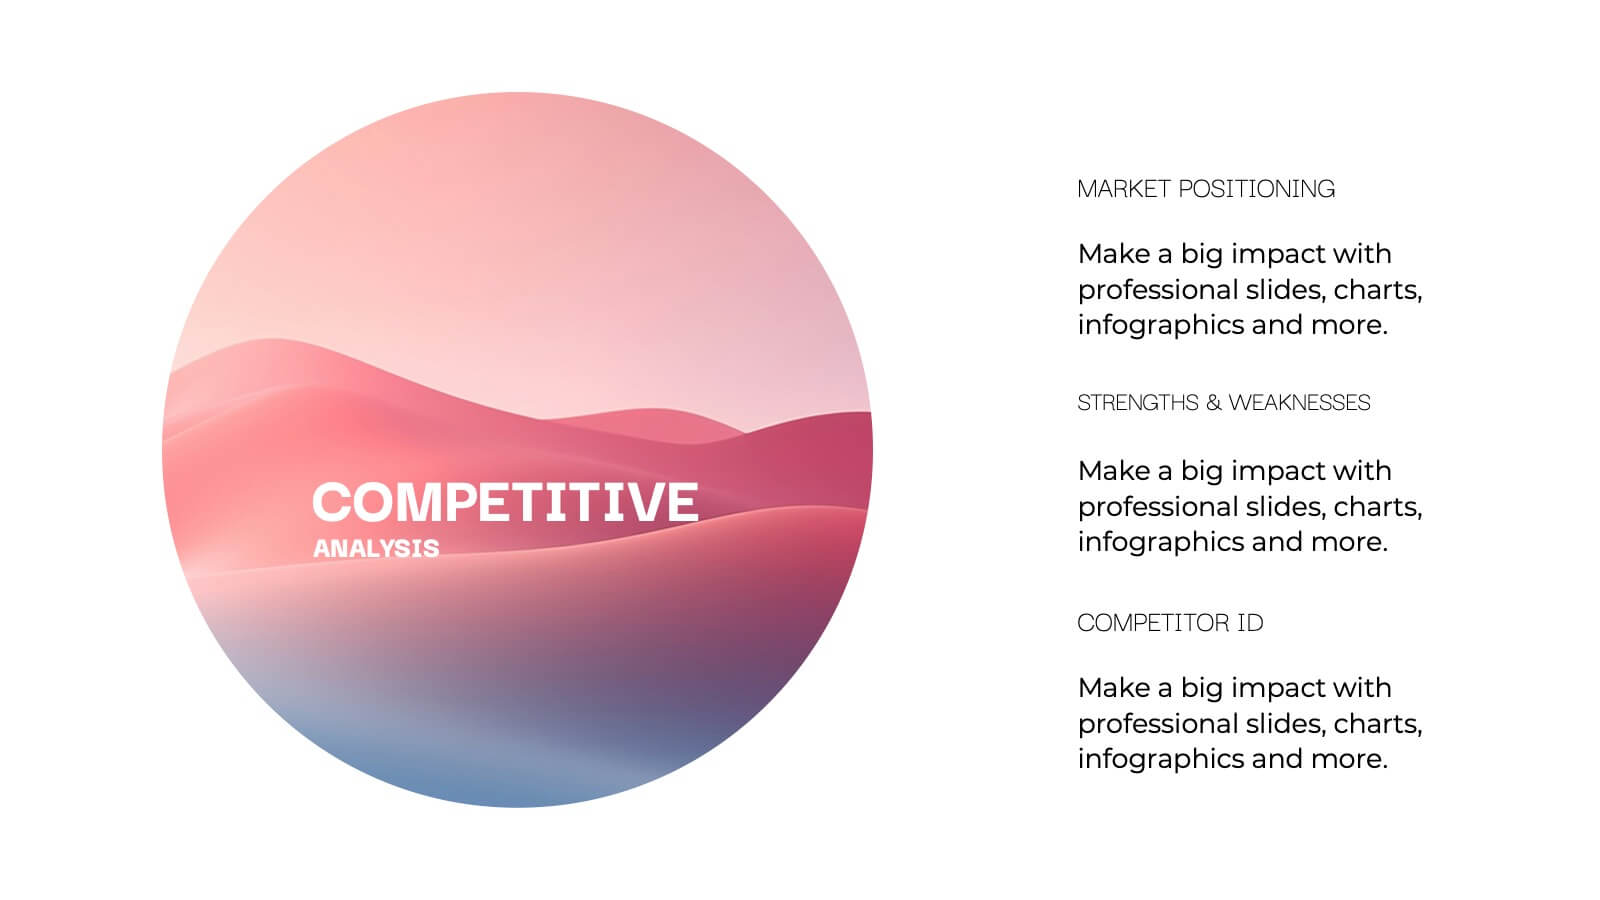
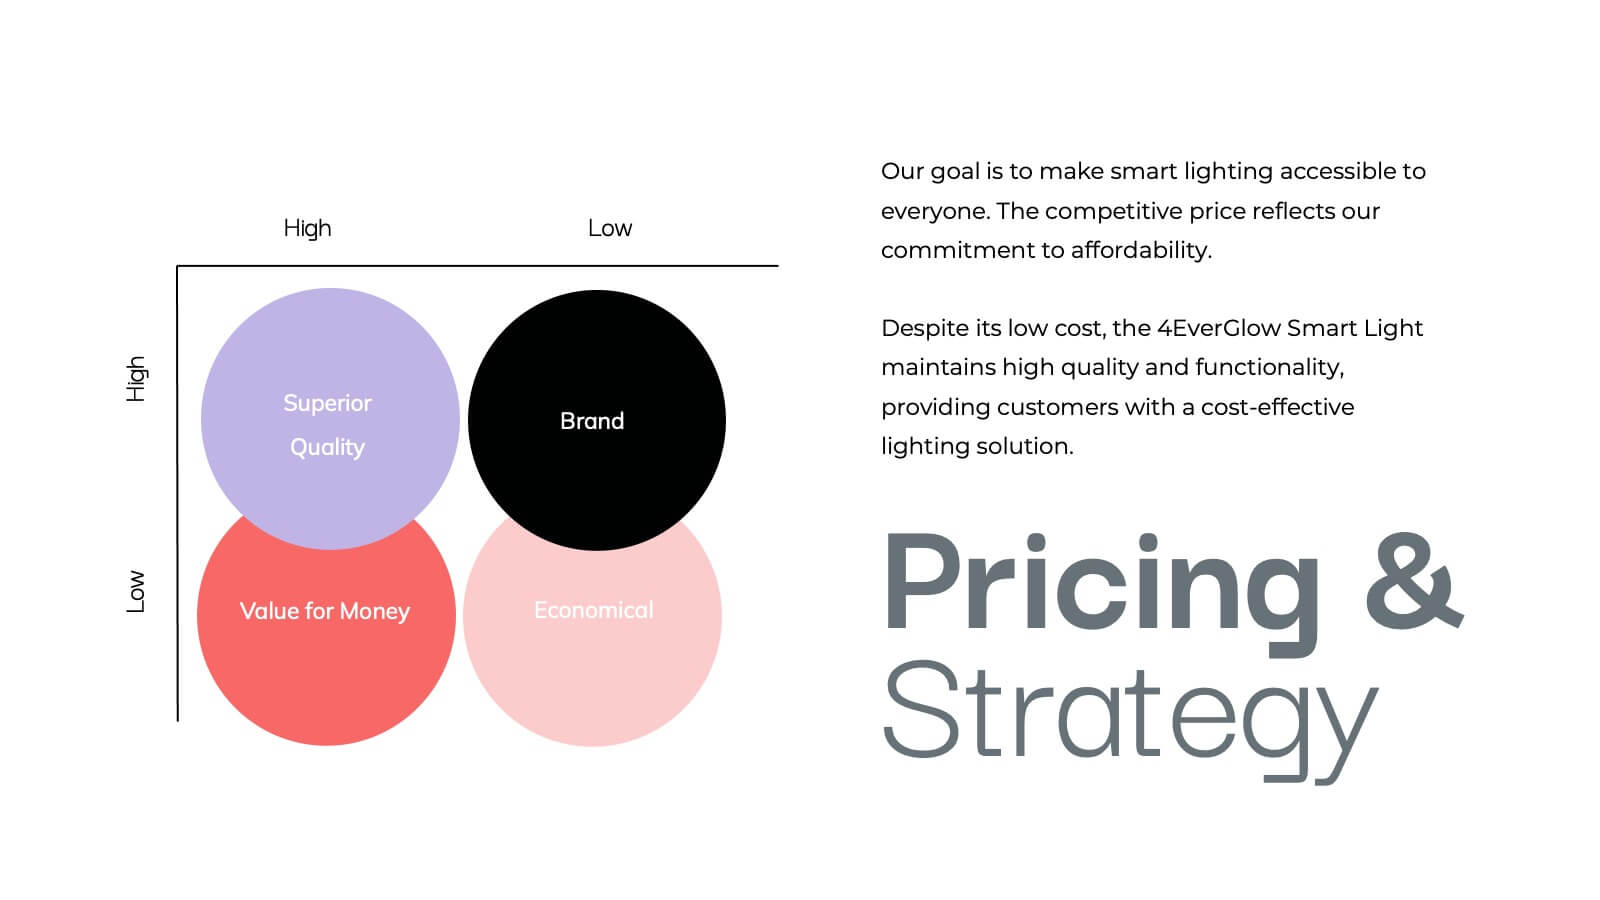
Vulcan New Product Proposal Presentation
Launch your next product with confidence using this comprehensive presentation template! Covering everything from product features and target market to pricing strategy and customer pain points, this template ensures a smooth and engaging flow for your audience. It’s ideal for product proposals, demonstrations, and marketing strategies. Compatible with PowerPoint, Keynote, and Google Slides for seamless presentations.


5 slides
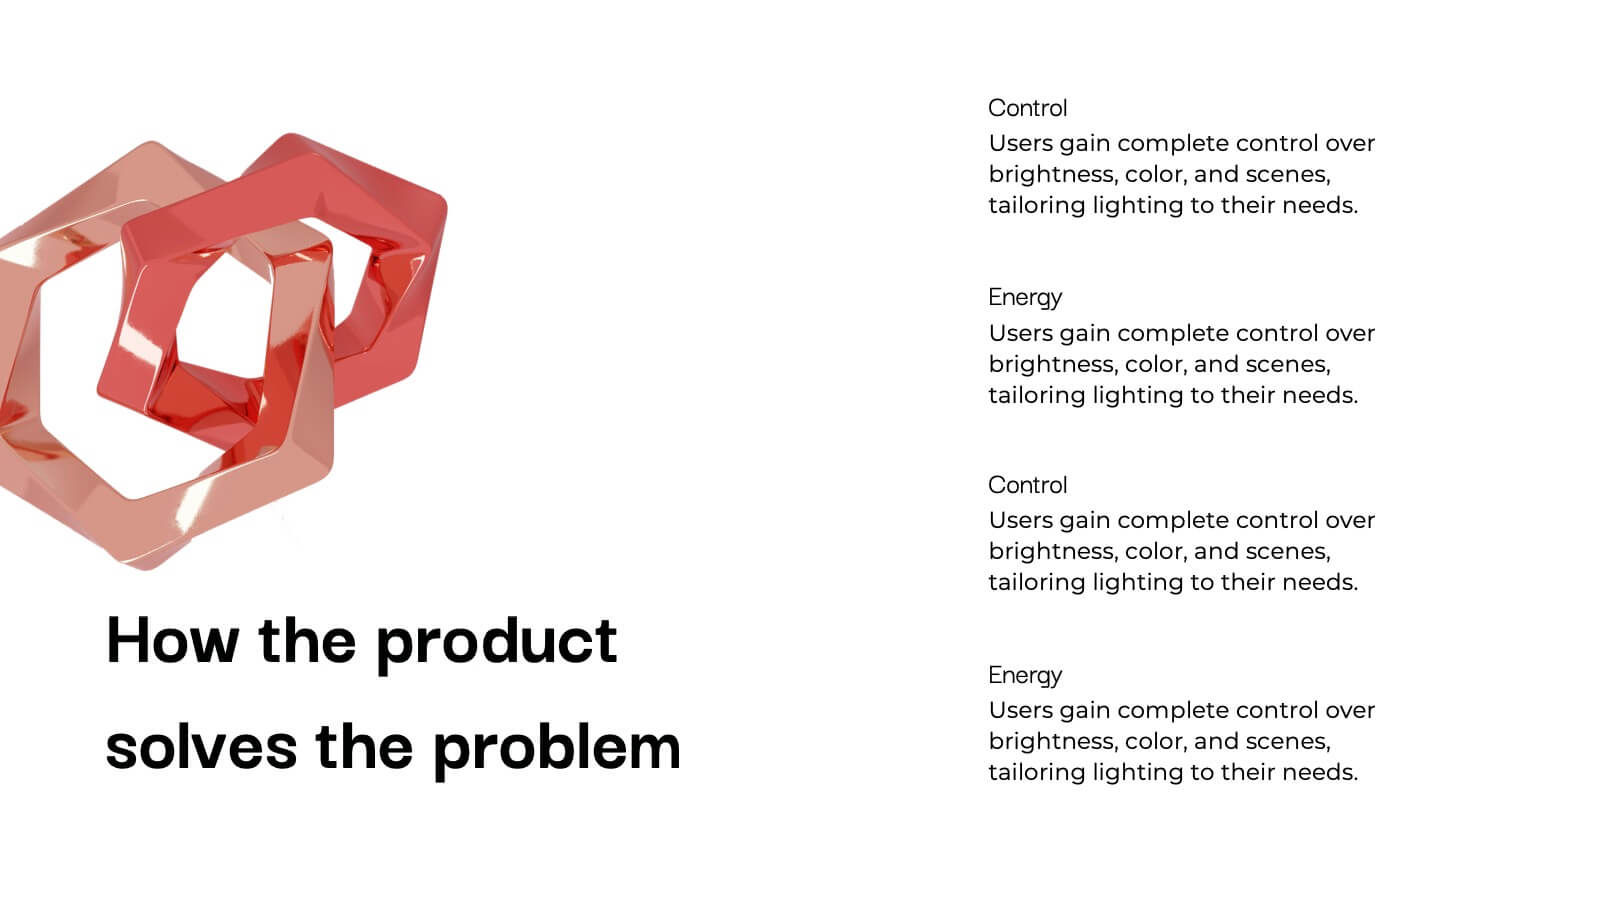
Problem-Solving and Challenge Resolution Presentation
Solve problems efficiently with a structured approach using this Problem-Solving and Challenge Resolution template. Featuring a unique visual of connecting solutions like a plug and socket, this slide helps break down problems, present solutions, and demonstrate effective decision-making strategies. Ideal for brainstorming sessions, business strategy meetings, and risk management discussions, this template is fully customizable and compatible with PowerPoint, Keynote, and Google Slides.


6 slides
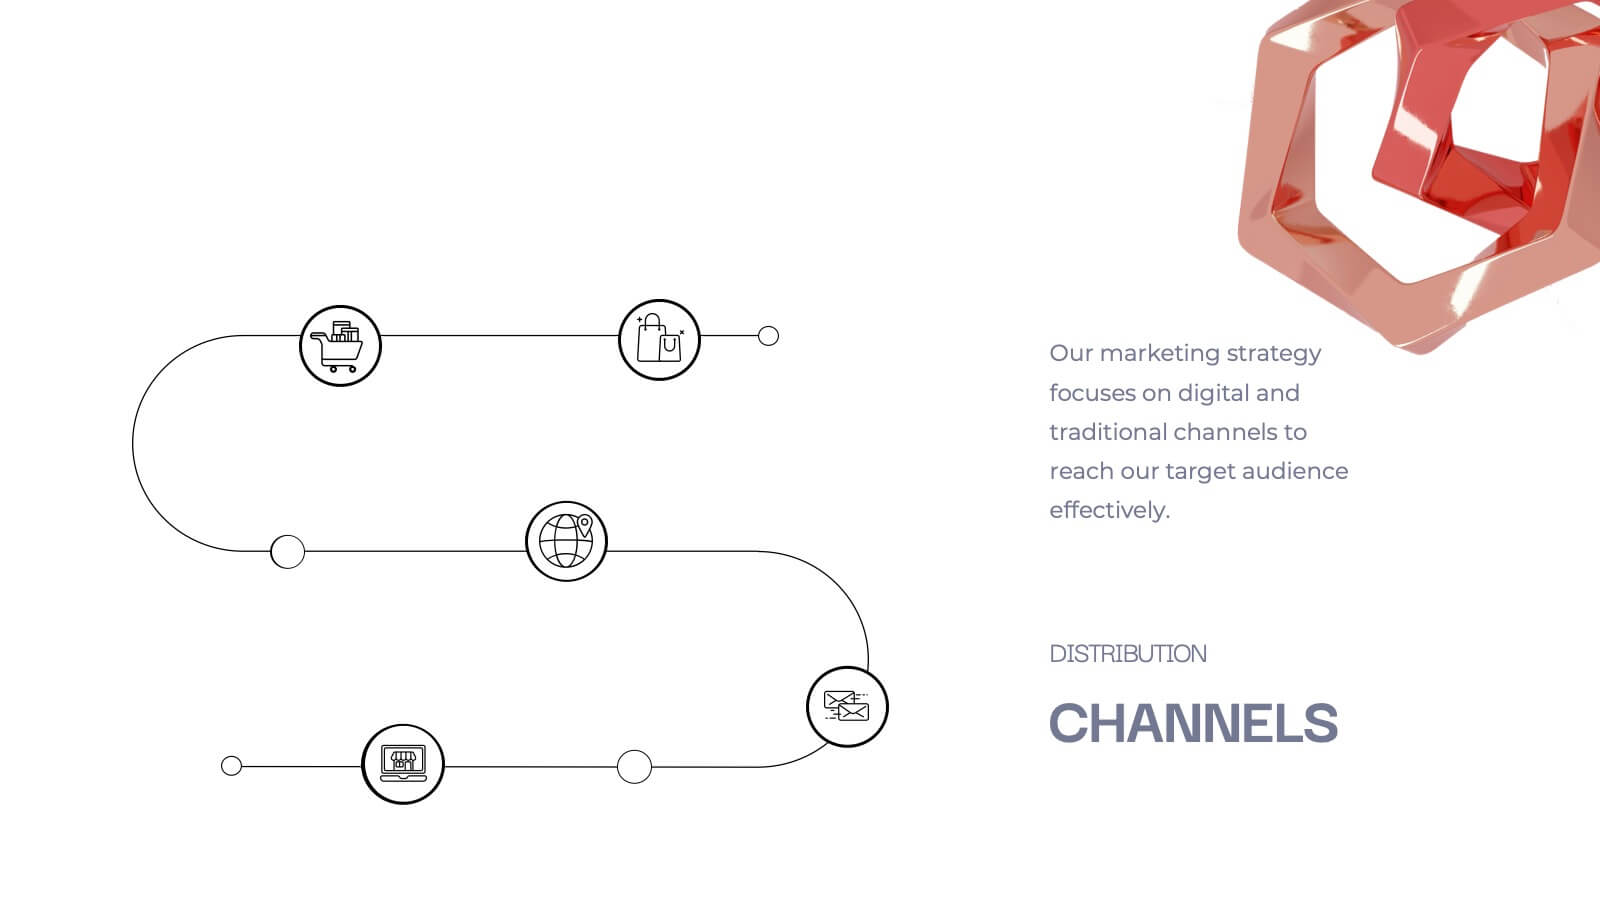
Supply Chain Management Strategy Presentation
Enhance your logistics planning with the Supply Chain Management Strategy template. This visually structured design simplifies key supply chain components, from procurement to distribution, making it ideal for analysts and operations teams. Fully customizable and compatible with PowerPoint, Keynote, and Google Slides for a seamless and professional presentation experience.


21 slides
Frost Design Proposal Presentation
Present your design proposal with sophistication and clarity using this elegant template! Perfect for outlining your project summary, objectives, and proposed solutions, this template covers everything from scope of work and budget breakdowns to deliverables and team expertise. Fully compatible with PowerPoint, Keynote, and Google Slides, it's designed for seamless, professional presentations.


10 slides
Business Growth through Target Market Analysis Presentation
Showcase how strategic insights drive expansion with this step-by-step infographic. Designed with layered growth icons and space for titles and text, this layout helps illustrate the phases of market targeting, consumer profiling, and sales development. Perfect for marketing strategies, business development roadmaps, and client presentations. Fully customizable in PowerPoint, Keynote, and Google Slides


21 slides
Cerberus Project Timeline Presentation
Bring your project vision to life with a well-structured plan that flows effortlessly. This presentation covers everything from objectives and timelines to budget breakdowns, team introductions, and next steps, helping you communicate key details with clarity. Perfect for internal or client presentations, and fully compatible with PowerPoint, Keynote, and Google Slides.


5 slides
Annual Achievements and Highlights Presentation
Celebrate your progress with the Annual Achievements and Highlights Presentation. This timeline-style layout guides viewers along a visual path of milestones year by year. Each pin represents a key accomplishment, backed by icons and editable text for context. Perfect for end-of-year reviews or company retrospectives. Compatible with PowerPoint, Google Slides, and Canva.


5 slides
Colorful Circular Flow Chart Presentation
Bring your ideas full circle with a vibrant, energetic flow that instantly grabs attention and makes complex processes feel effortless to follow. This presentation is perfect for illustrating cycles, workflows, or interconnected stages in a clear, dynamic way. Fully compatible with PowerPoint, Keynote, and Google Slides.


6 slides
Organizational Structure Infographic
Organizational structure refers to the way in which an organization is structured and how its roles, responsibilities, and functions are defined and coordinated. This infographic template provides a framework for how individuals and teams work together to achieve the organization's goals. This infographic visually represents the hierarchy, roles, and relationships within an organization. This template allows you to provides a clear overview of how different departments, teams, and individuals are organized and how they interact with each other. Fully customizable and compatible with Powerpoint, Keynote, and Google Slides.