


Features
- 6 Unique slides
- Fully editable and easy to edit in Microsoft Powerpoint, Keynote and Google Slides
- 16:9 widescreen layout
- Clean and professional designs
- Export to JPG, PDF or send by email


Do you have any questions?
Recommend


20 slides
Pegasus Sales Forecast Presentation
This bold sales forecast template combines powerful visuals with a sleek design to highlight key performance metrics, competitive analysis, and pricing strategy. With sections for service overview, testimonials, promotions, and next steps, it’s ideal for impactful presentations. Compatible with PowerPoint, Keynote, and Google Slides, delivering your message has never been easier.


5 slides
Business Figures and Key Numbers Overview Presentation
Present your data with clarity using this key-themed slide layout. Ideal for outlining five important metrics, business highlights, or strategic figures. The bold numerical format and clean design make your content easy to follow. Fully customizable in Canva, perfect for professional reports, pitches, and data-driven presentations.


6 slides
Framework Version Infographic
A framework infographic is a visual representation that outlines a structured approach, model, or framework for understanding a concept, solving a problem, or making decisions. This infographic template involves visually presenting different versions of a software or system framework along with their features and benefits. Summarize the improvements and benefits introduced by each framework version. This template provides a clear overview of the evolution of the framework and how each version brought value to users. By using icons, graphics, and concise descriptions, you can make the information easily digestible and engaging for your audience.


6 slides
Resource Allocation and PM Strategy Deck Presentation
Break down project resources and team strategies using this dynamic visual dashboard. Track allocation, effort levels, or progress across roles in a clean, easy-to-follow layout. Fully editable in PowerPoint, Keynote, and Google Slides, this template helps project managers communicate priorities and responsibilities with clarity and impact.


5 slides
Coffee Brewing Methods Infographics
Coffee brewing methods refer to the various techniques and processes used to extract flavor and aroma from coffee beans. These infographic templates are a visually appealing and informative presentation tool designed to showcase various methods of brewing coffee. Whether you're a coffee enthusiast, a barista, or someone interested in learning more about coffee preparation, this template provides an engaging way to explore different brewing techniques and their unique characteristics. These allows you to showcase and educate others about various coffee brewing techniques. Fully customizable and compatible with Powerpoint, Keynote, and Google Notes.


26 slides
Understanding the Stock Market Presentation
Step into the exciting world of finance with our dynamic and sleek presentation template, perfect for understanding the stock market! This comprehensive guide simplifies complex financial concepts, making it an ideal resource for beginners, students, and professionals. Featuring a sophisticated collection of slides, this template covers key topics such as market trends, investment strategies, and financial analysis. The design integrates bold colors, sharp graphics, and well-organized layouts to keep your audience engaged and informed. Infographics and charts break down intricate data, while mockups offer realistic previews of stock market tools. Fully customizable and versatile, this template can be adapted to suit various presentation needs and styles. It is compatible with PowerPoint, Keynote, and Google Slides, ensuring smooth and professional presentations across different platforms. Perfect for financial workshops, educational seminars, or anyone looking to deepen their understanding of the stock market.


6 slides
Artificial Intelligence Stocks Infographics
Our "Artificial Intelligence Stocks" infographic template, ideal for PowerPoint, Keynote, and Google Slides, is tailored for financial analysts, investors, and tech enthusiasts. This template seamlessly blends technology and finance, focusing on AI stocks and investment trends. This futuristic design includes elements such as AI technology trends, stock market performance, and investment opportunities. It’s an invaluable tool for presenting complex financial and technological data in a clear and visually appealing manner. The template is perfect for conveying intricate investment strategies and market insights related to the burgeoning AI sector. The template features a cutting-edge design with a color scheme that blends shades of blue and gray, symbolizing innovation and financial growth. It’s designed to make your presentation not only informative but also visually engaging. Whether used in investor meetings, tech conferences, or educational seminars, this template ensures your insights on AI stocks are presented with clarity and sophistication.


5 slides
New Product Innovation Plan Presentation
Bring your ideas to market with confidence using this clear and engaging presentation. Designed to showcase every stage of product development, it helps visualize innovation steps, research insights, and launch strategies with impact. Fully editable and compatible with PowerPoint, Keynote, and Google Slides for effortless customization and professional results.


6 slides
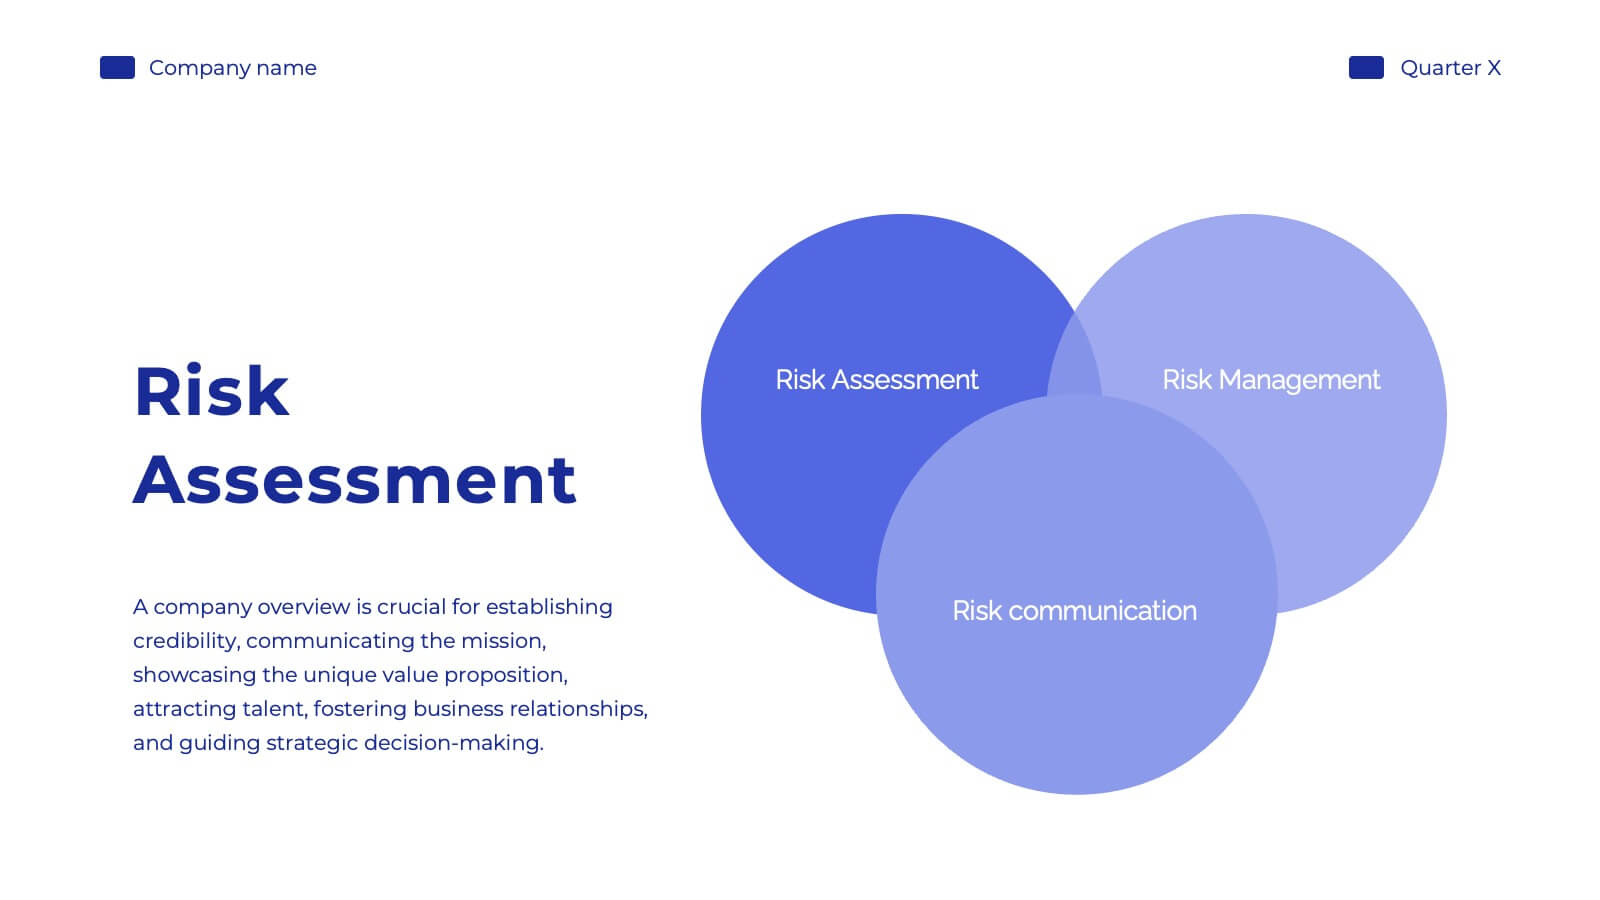
Three-Part Comparative Venn Layout Presentation
Showcase relationships, overlaps, and distinctions across three core elements with this elegant petal-style Venn layout. Perfect for comparing strategies, audiences, or product features. Each section includes customizable labels and icons. Fully editable in PowerPoint, Keynote, and Google Slides—ideal for business analysis, educational presentations, and marketing plans.


24 slides
Djinn Brand Identity Presentation
Unleash the power of your brand with this sleek and modern presentation template! From brand identity components to target audience personas, this template covers everything you need to craft a cohesive and compelling brand strategy. Whether showcasing brand guidelines or success stories, it’s designed for maximum clarity and impact. Compatible with PowerPoint, Keynote, and Google Slides for effortless presentations.


22 slides
Frost Financial Report Presentation
Transform your brand with this comprehensive rebranding project template! Perfect for presenting brand identity, market analysis, and strategic positioning, it includes slides for logos, color palettes, and brand guidelines. Engage your audience with visually striking designs and detailed content. Compatible with PowerPoint, Keynote, and Google Slides for easy, professional presentations on any platform.


31 slides
Astralis Brand Strategy Report Presentation
Present your brand strategy effectively with this well-structured presentation template. This comprehensive design covers all essential aspects, including vision and positioning, identity components, brand guidelines, and touchpoints. It is perfect for showcasing how your brand stands out, communicates, and connects with its audience. Highlight your unique selling points, ensure visual consistency with color palettes, and emphasize your brand's voice through tailored sections. This template is easy to customize and works seamlessly across PowerPoint, Google Slides, and Keynote, ensuring accessibility for all. Empower your brand strategy discussions with a professional and polished design.


7 slides
Asia Map Geography Infographic
Explore the diverse landscapes and key data of Asia with our collection of Asia Map Infographics. These templates are expertly designed to illustrate various geographical and demographic insights across the continent, making them ideal for educational purposes, business presentations, or travel-related projects. Each infographic is crafted with a clean, clear layout that highlights different countries, regions, and significant data points such as population density, economic indicators, or cultural statistics. The use of color coding and spatial markers ensures that information is easily understandable and visually appealing. Fully customizable, these templates allow you to adjust the data points, colors, and text to suit specific presentation needs or to focus on particular areas of interest. Whether you're a teacher, a business analyst, or a traveler preparing a presentation, these slides offer a valuable resource for conveying complex geographical data in a straightforward and engaging manner.


5 slides
Scrum Workflow Roles & Sprints Presentation
Simplify your agile presentations with this Scrum Workflow Roles & Sprints Template. Designed to visualize sprint cycles, team roles, and process flow, this layout makes Scrum methodology easy to grasp. Ideal for product managers and agile teams. Fully editable in PowerPoint, Keynote, and Google Slides for seamless customization.


21 slides
Cupid Sales Proposal Presentation
Elevate your next proposal with this sleek and professional presentation template! Ideal for outlining project goals, scope of work, and timelines, this template ensures that every detail is presented with clarity and impact. It includes sections for budget breakdowns, team expertise, and risk management strategies. Compatible with PowerPoint, Keynote, and Google Slides, it’s designed for flexibility and success.


4 slides
Strategic Business Objectives Framework
Showcase your company's top strategic goals with this clean and professional slide. Each briefcase icon represents a key business objective, perfect for planning, reporting, or investor updates. Fully customizable in PowerPoint, Keynote, and Google Slides.


21 slides
Stellar Content Marketing Pitch Deck Presentation
The Stellar Marketing Pitch Deck template is designed to make your marketing strategies shine like never before! This template is perfect for showcasing your business's potential and engaging your audience with sleek, modern designs that capture attention. Start with a powerful introduction, leading into an in-depth industry overview that highlights key trends and consumer behaviors. With dedicated sections for emerging technologies, content marketing trends, and data-driven marketing, you'll have everything you need to present your innovative approach. The template also includes slides for social media strategies, influencer marketing, and SEO trends, ensuring you're covering all the bases. Personalization trends and video marketing evolution are featured to show your forward-thinking approach, while the customer experience focus slide emphasizes your commitment to quality. Finish strong with insights into e-commerce trends, brand storytelling, and sustainability in marketing. This template is fully compatible with PowerPoint, Keynote, and Google Slides, making it versatile and easy to use for any marketing presentation.