


Features
- 7 Unique slides
- Fully editable and easy to edit in Microsoft Powerpoint, Keynote and Google Slides
- 16:9 widescreen layout
- Clean and professional designs
- Export to JPG, PDF or send by email


Do you have any questions?
Recommend


2 slides
End Slide with Contact and Gratitude Message Presentation
Say goodbye with impact and leave a lasting impression! This clean, modern slide is perfect for ending presentations with a clear contact section and a heartfelt thank-you message. Ideal for client decks, proposals, or reports. Fully compatible with PowerPoint, Keynote, and Google Slides for easy editing and customization.


6 slides
Agenda Network Infographic
Elevate your networking events with our sophisticated collection of agenda slide templates. These slides are crafted to structure and present the flow of activities at networking events, making them essential for coordinators who aim to foster professional connections among attendees. Each template is designed with clarity and style, featuring clean lines and modern graphics to outline key segments of your event, such as welcome remarks, networking sessions, panel discussions, and closing statements. The thoughtful layout includes designated spaces for time slots, session titles, and speaker details, ensuring that participants can easily follow the event's progression and plan their participation accordingly. These slides are fully customizable, allowing you to match the visual design with your event’s theme or corporate branding. The adaptable format makes it simple to insert or remove sections based on the specific needs of your event. Ideal for business conferences, industry meet-ups, or any professional gathering, these agenda slides help you manage and execute a seamless networking experience.


21 slides
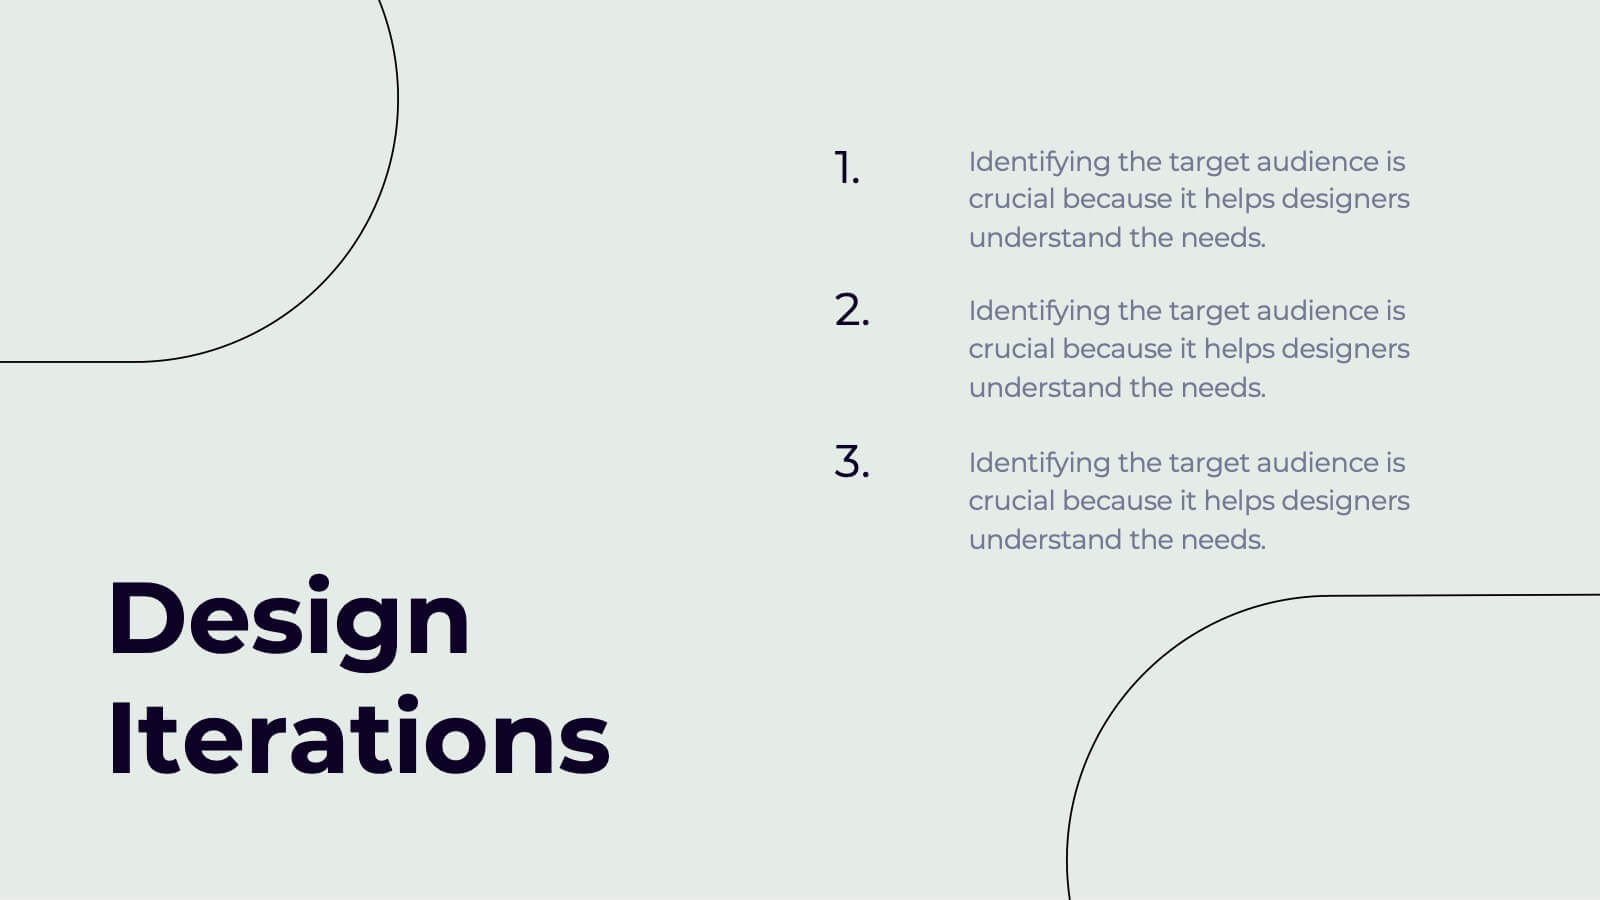
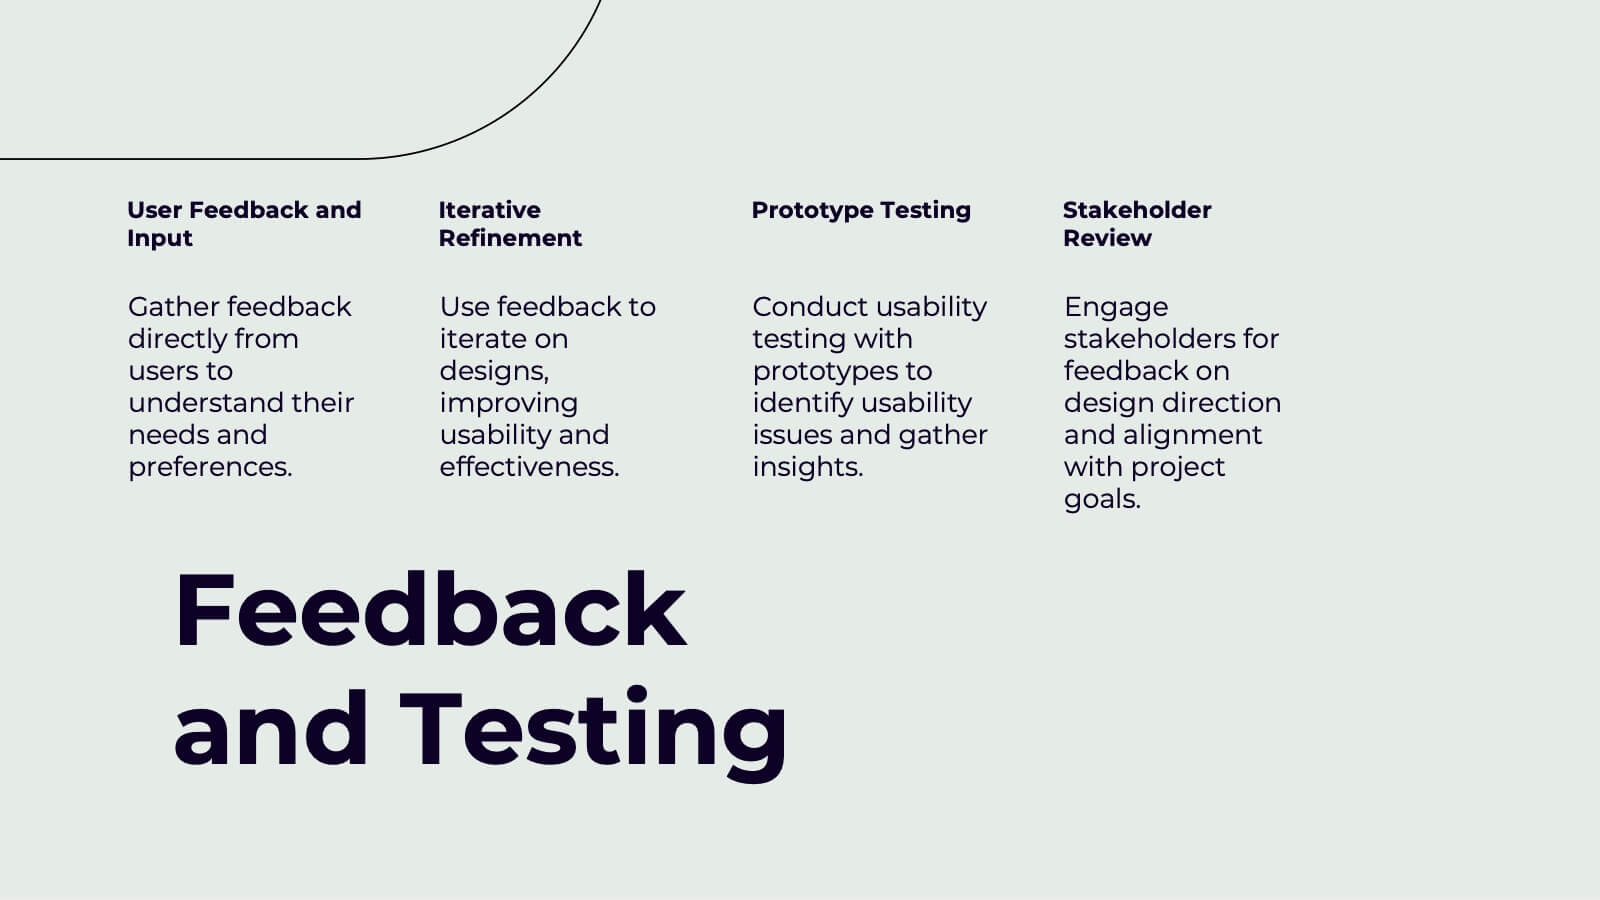
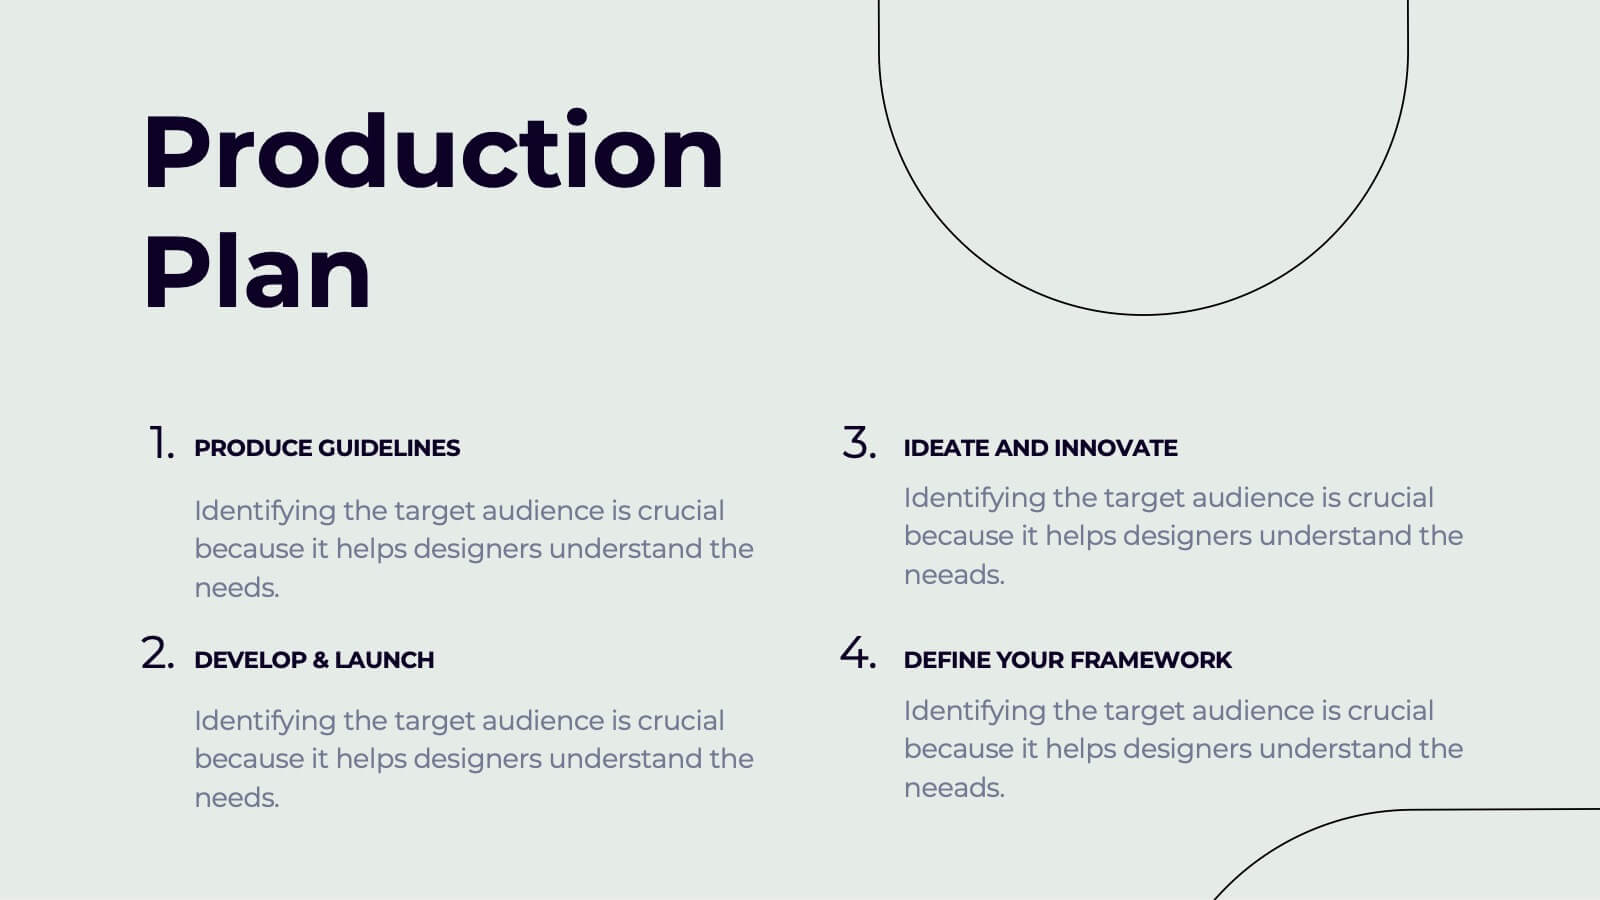
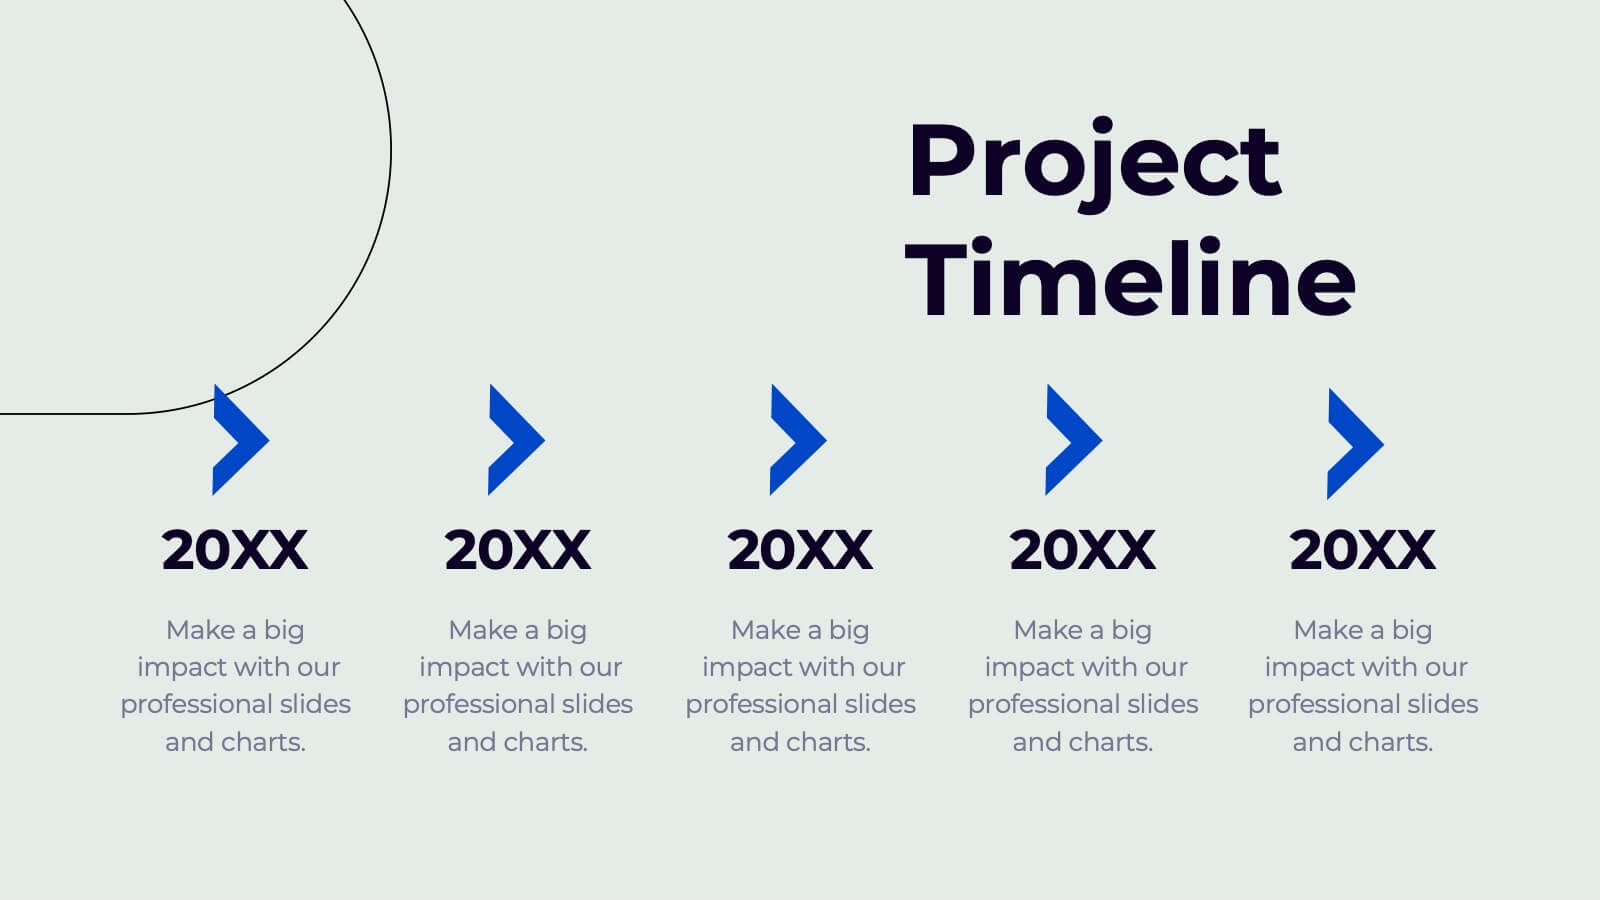
Yeti Creative Design Report Presentation
This modern design report template covers everything from concept development to design iterations and feedback testing. It’s visually striking, with sections for color schemes, typography, textures, and production plans. Ideal for showcasing creative projects and delivering professional presentations. Compatible with PowerPoint, Keynote, and Google Slides for ease of use.


6 slides
Business Performance Pie Chart
Visualize your key metrics clearly with this pie chart-style performance layout. Designed for business reviews and strategic updates, it breaks down five data categories into easy-to-read segments. Ideal for quarterly performance slides, team dashboards, and KPI tracking. Fully editable in PowerPoint, Keynote, and Google Slides.


6 slides
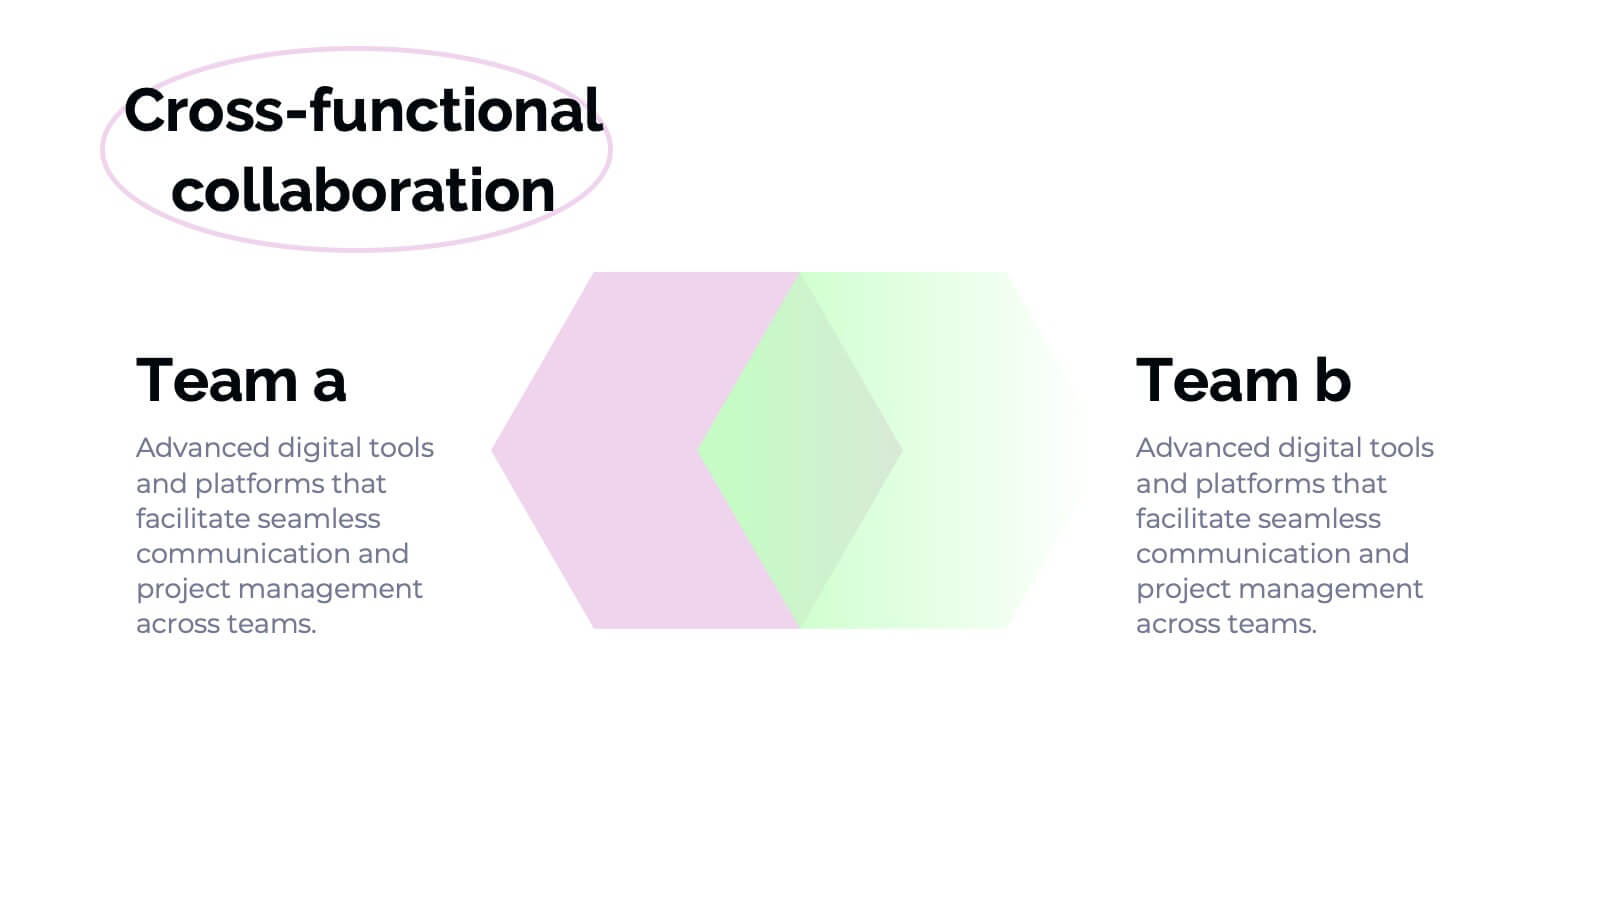
Three-Part Comparative Venn Layout Presentation
Showcase relationships, overlaps, and distinctions across three core elements with this elegant petal-style Venn layout. Perfect for comparing strategies, audiences, or product features. Each section includes customizable labels and icons. Fully editable in PowerPoint, Keynote, and Google Slides—ideal for business analysis, educational presentations, and marketing plans.


3 slides
Profitability and Cost Analysis Presentation
Evaluate financial efficiency with this profitability and cost analysis template. Designed for business strategists and financial planners, it helps compare costs against revenue to determine profit potential. The visual balance scale enhances clarity, making complex data easier to digest. Fully customizable and compatible with PowerPoint, Keynote, and Google Slides for seamless editing.


4 slides
Regional Economic Analysis of Europe Map Presentation
Explore Europe's economy with the Regional Economic Analysis of Europe Map template, a streamlined presentation designed to showcase economic data and trends across the continent. Designed for clarity, it includes a customizable map and data bars for financial statistics. Ideal for PowerPoint presentations, it helps professionals highlight economic trends and investment opportunities in different European regions effectively.


6 slides
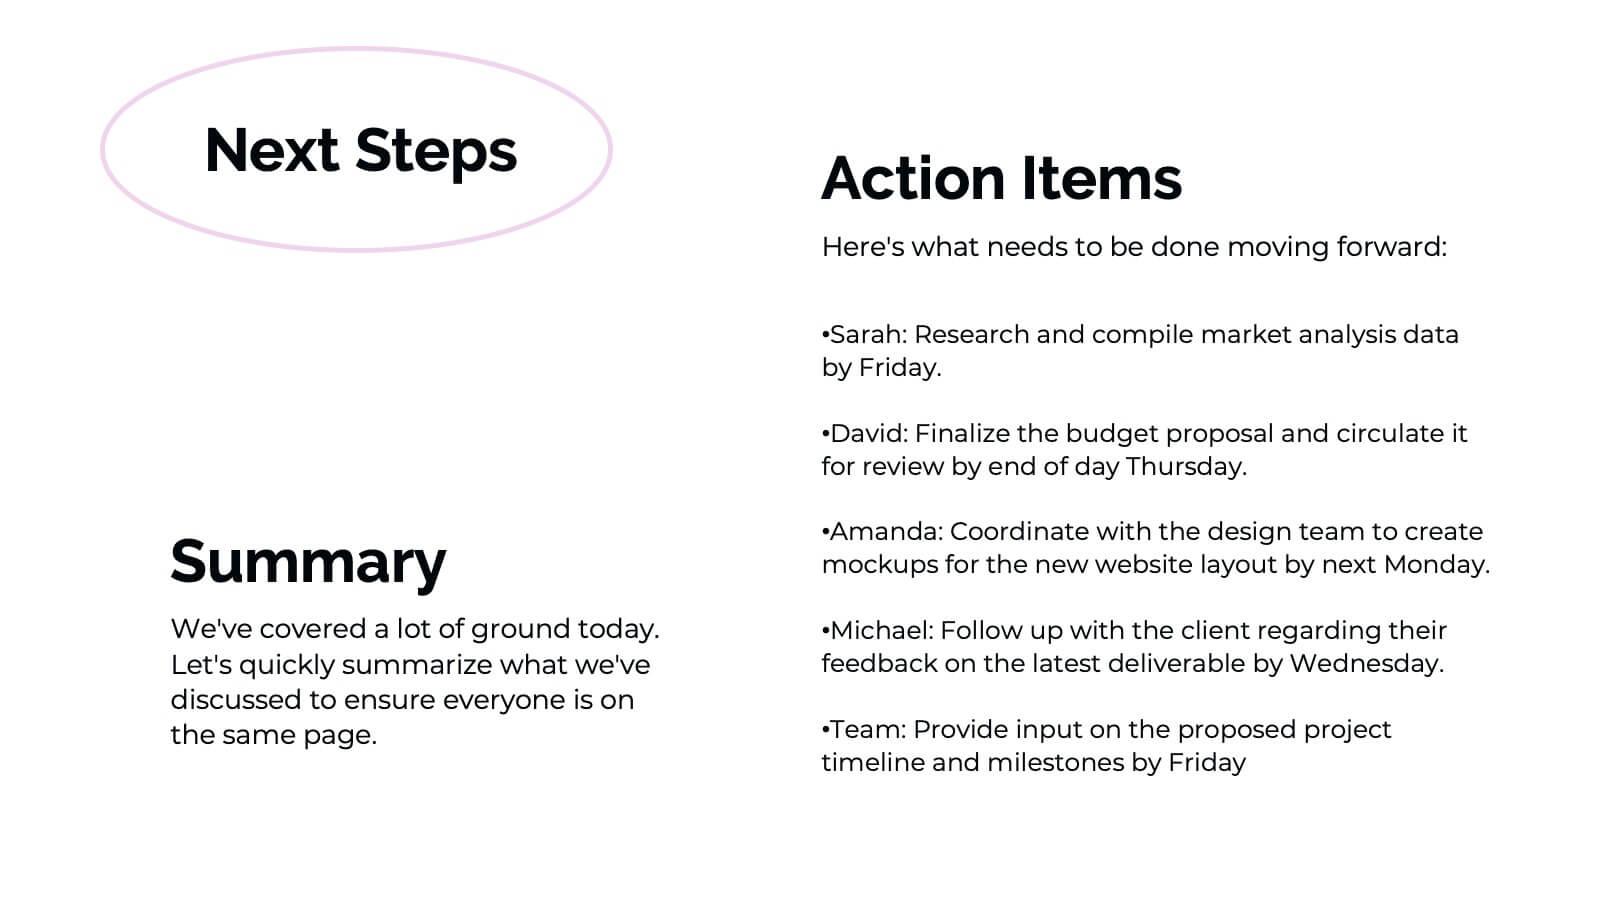
Business Plan Next Steps Presentation
Map out your strategy with the Business Plan Next Steps Presentation template. This visually structured layout helps outline key actions, milestones, and priorities for business growth and execution. Ideal for entrepreneurs, executives, and project managers, this slide ensures clarity and alignment on upcoming initiatives. Fully customizable in PowerPoint, Keynote, and Google Slides for easy integration into your planning process.

24 slides
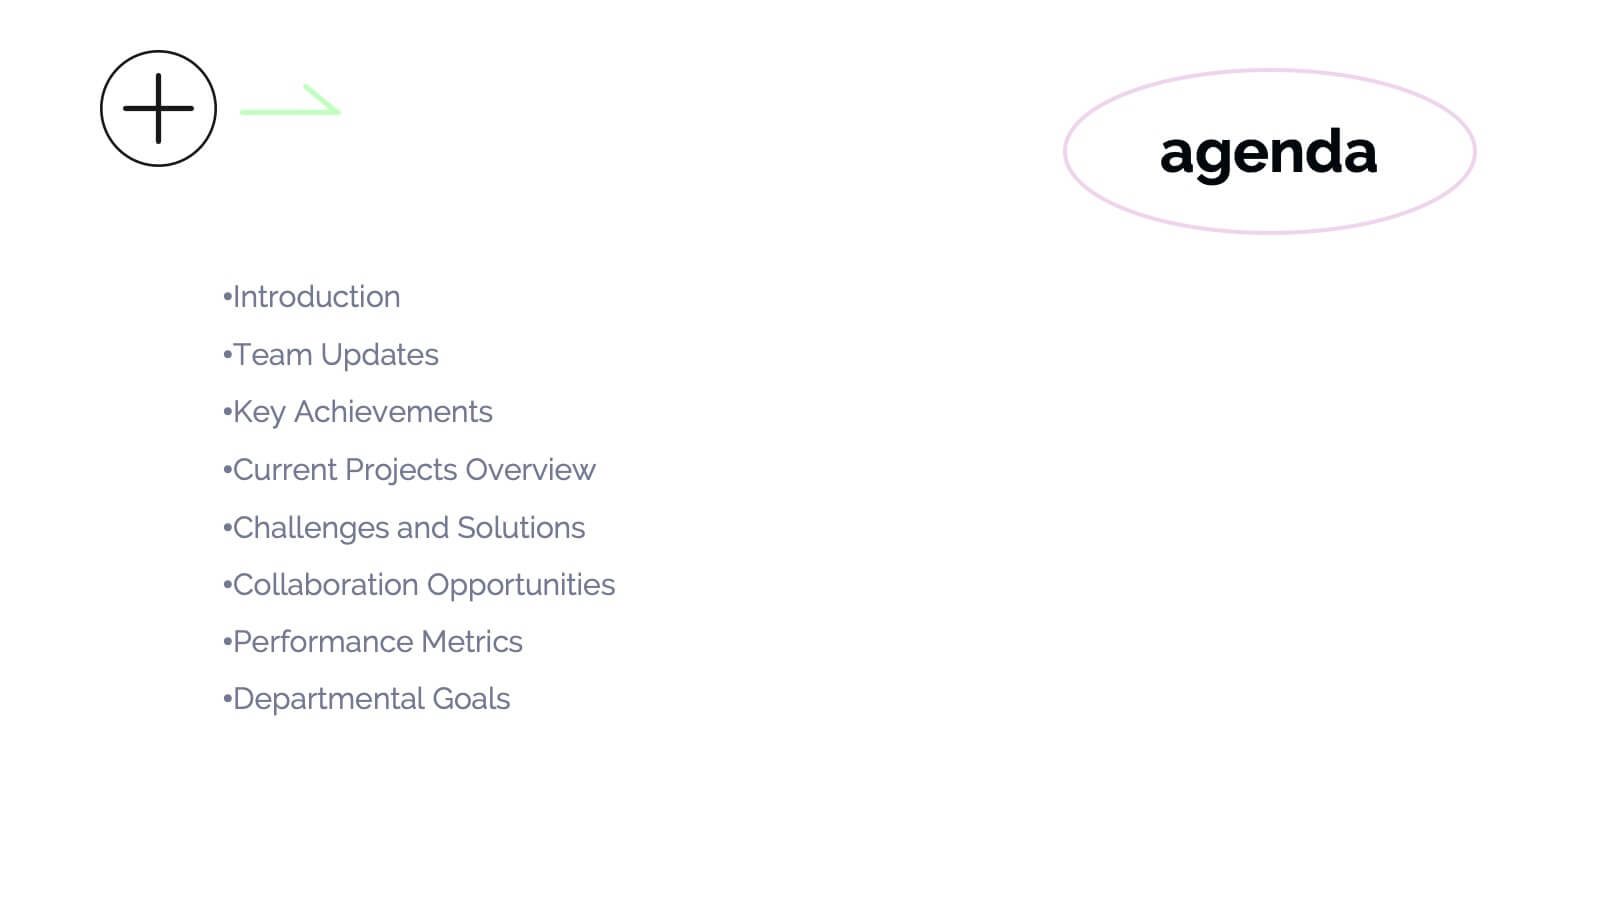
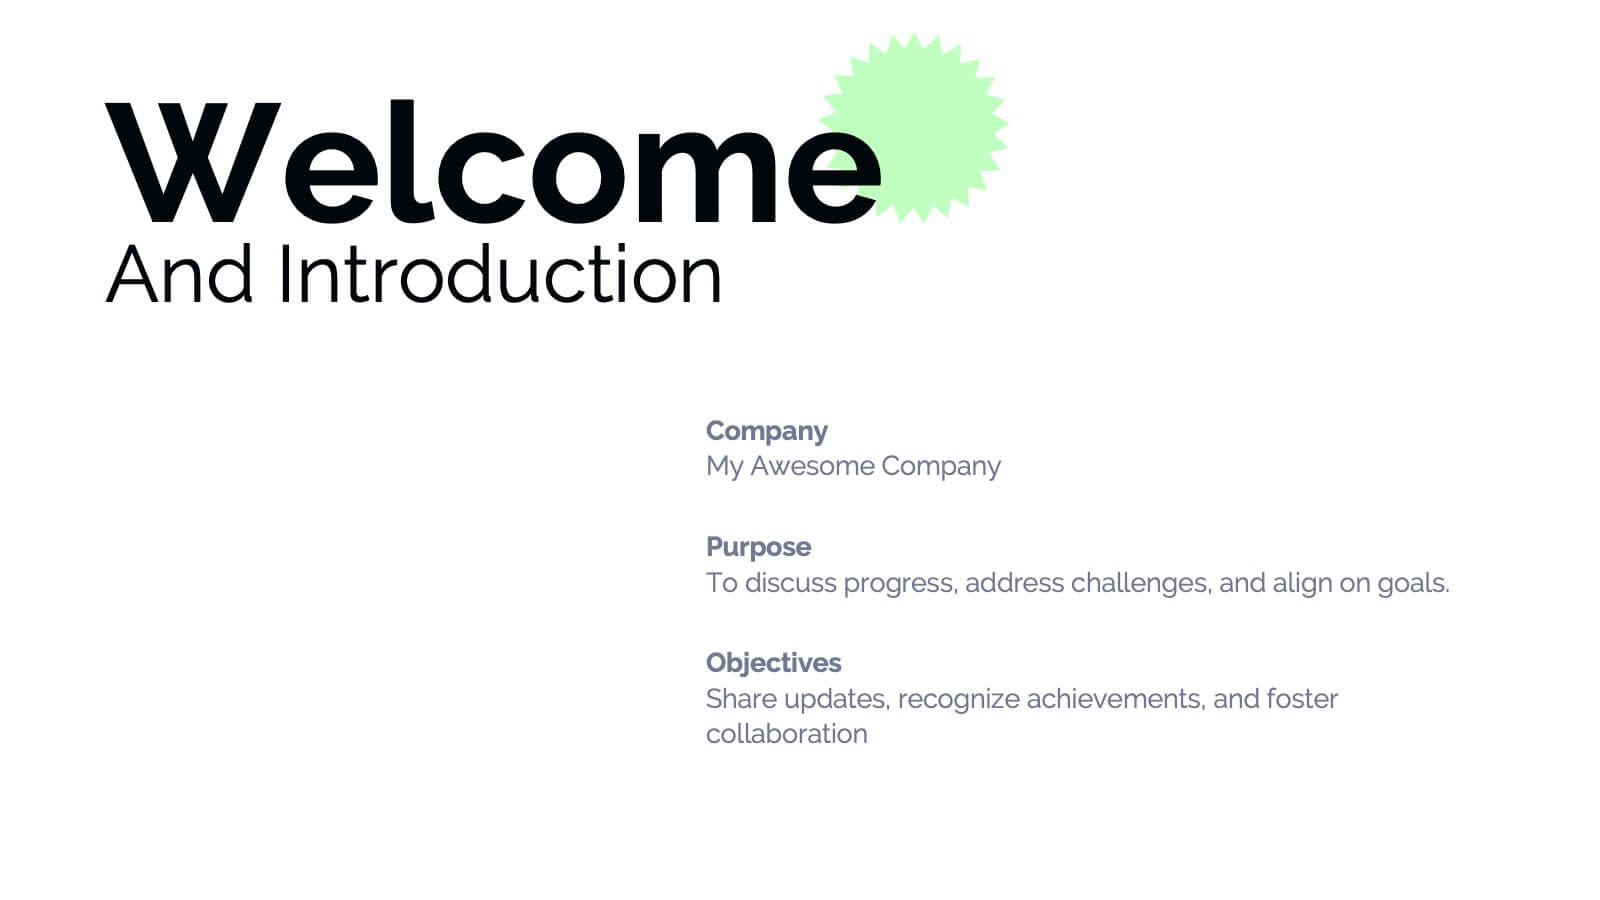
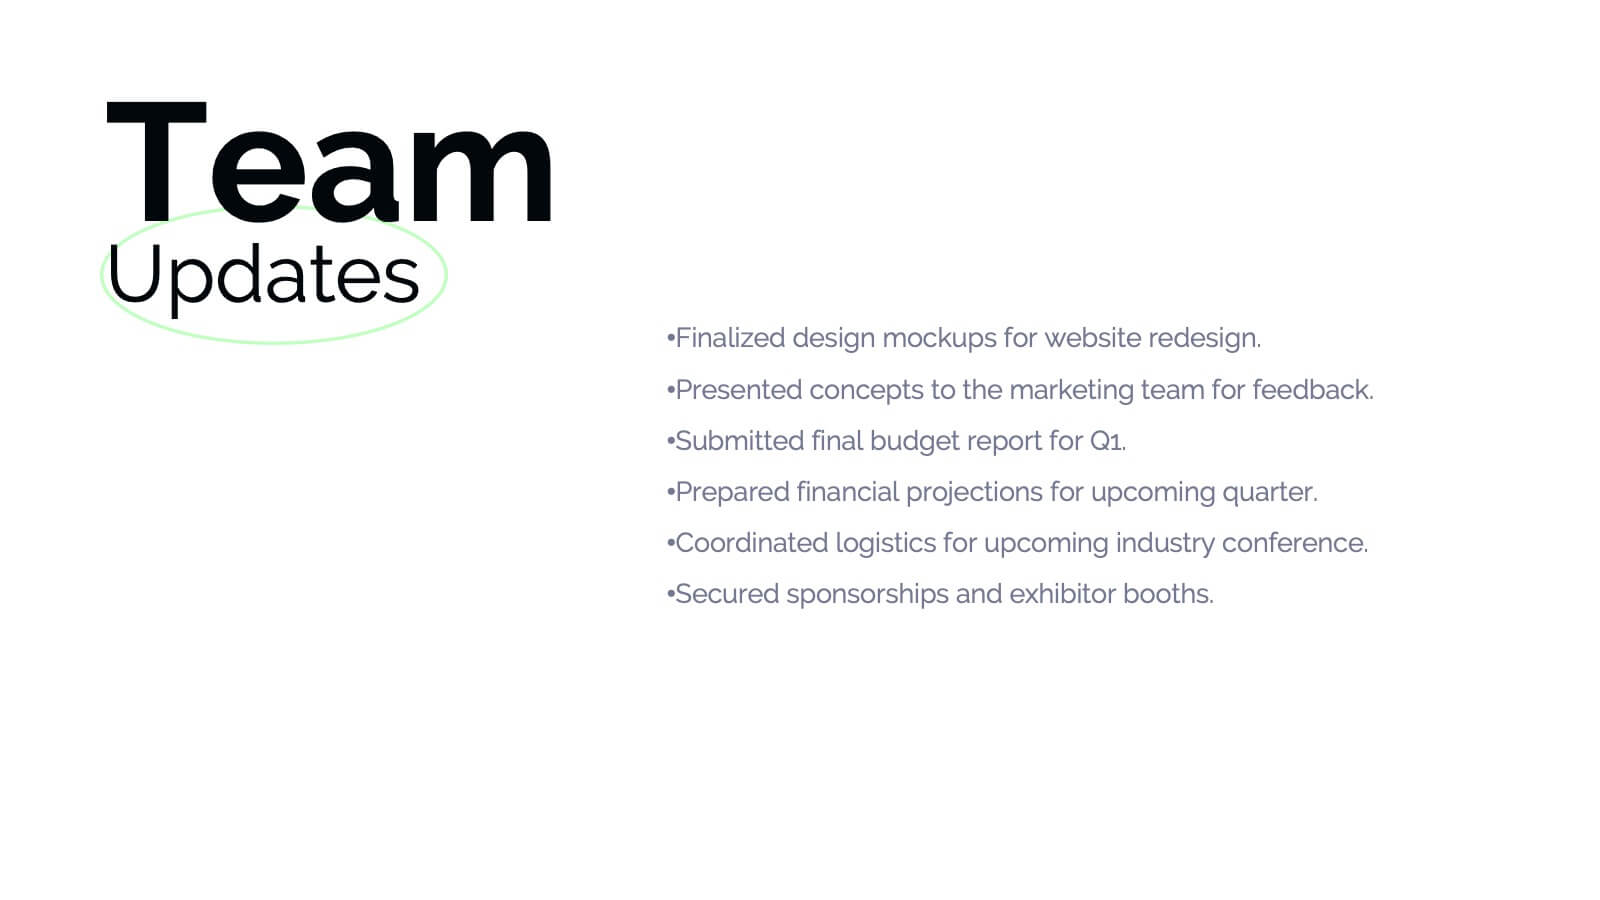
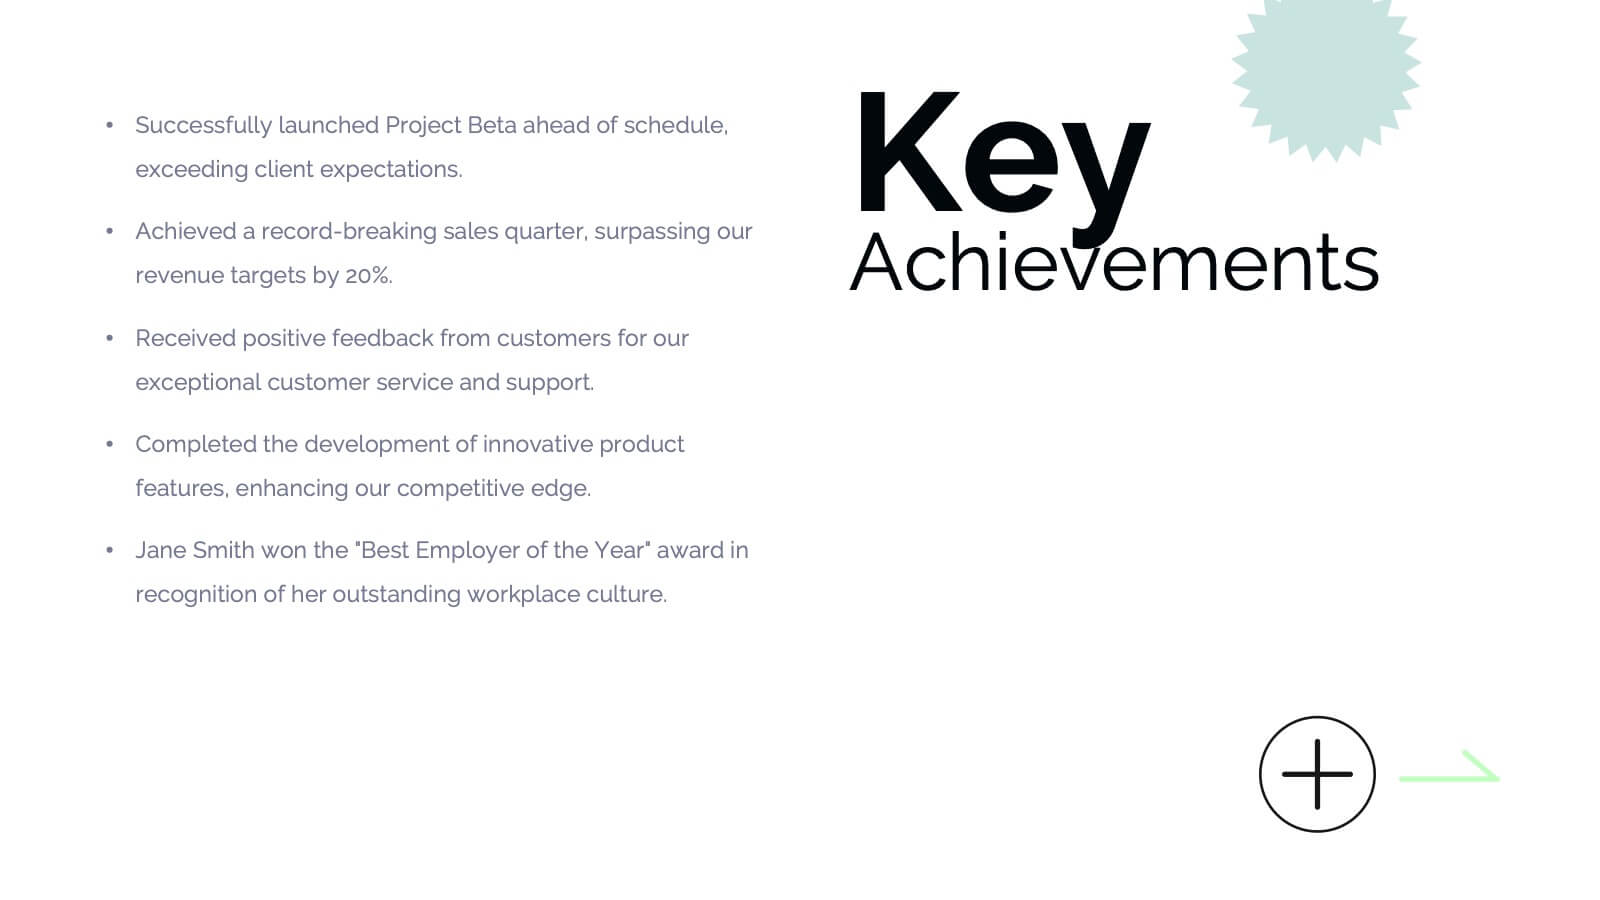
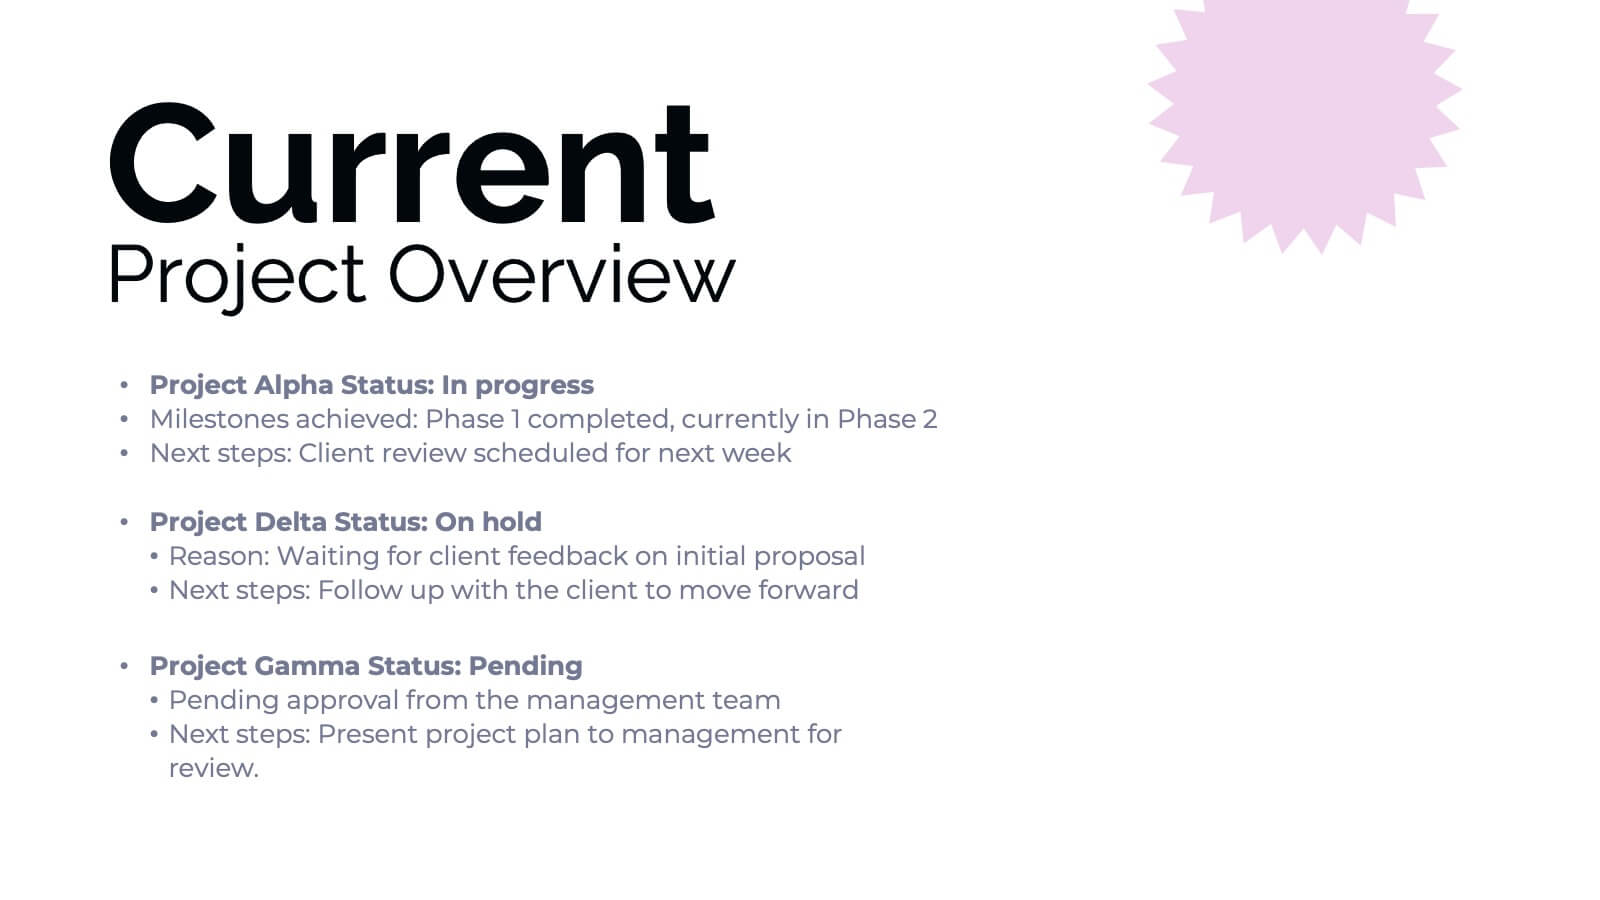
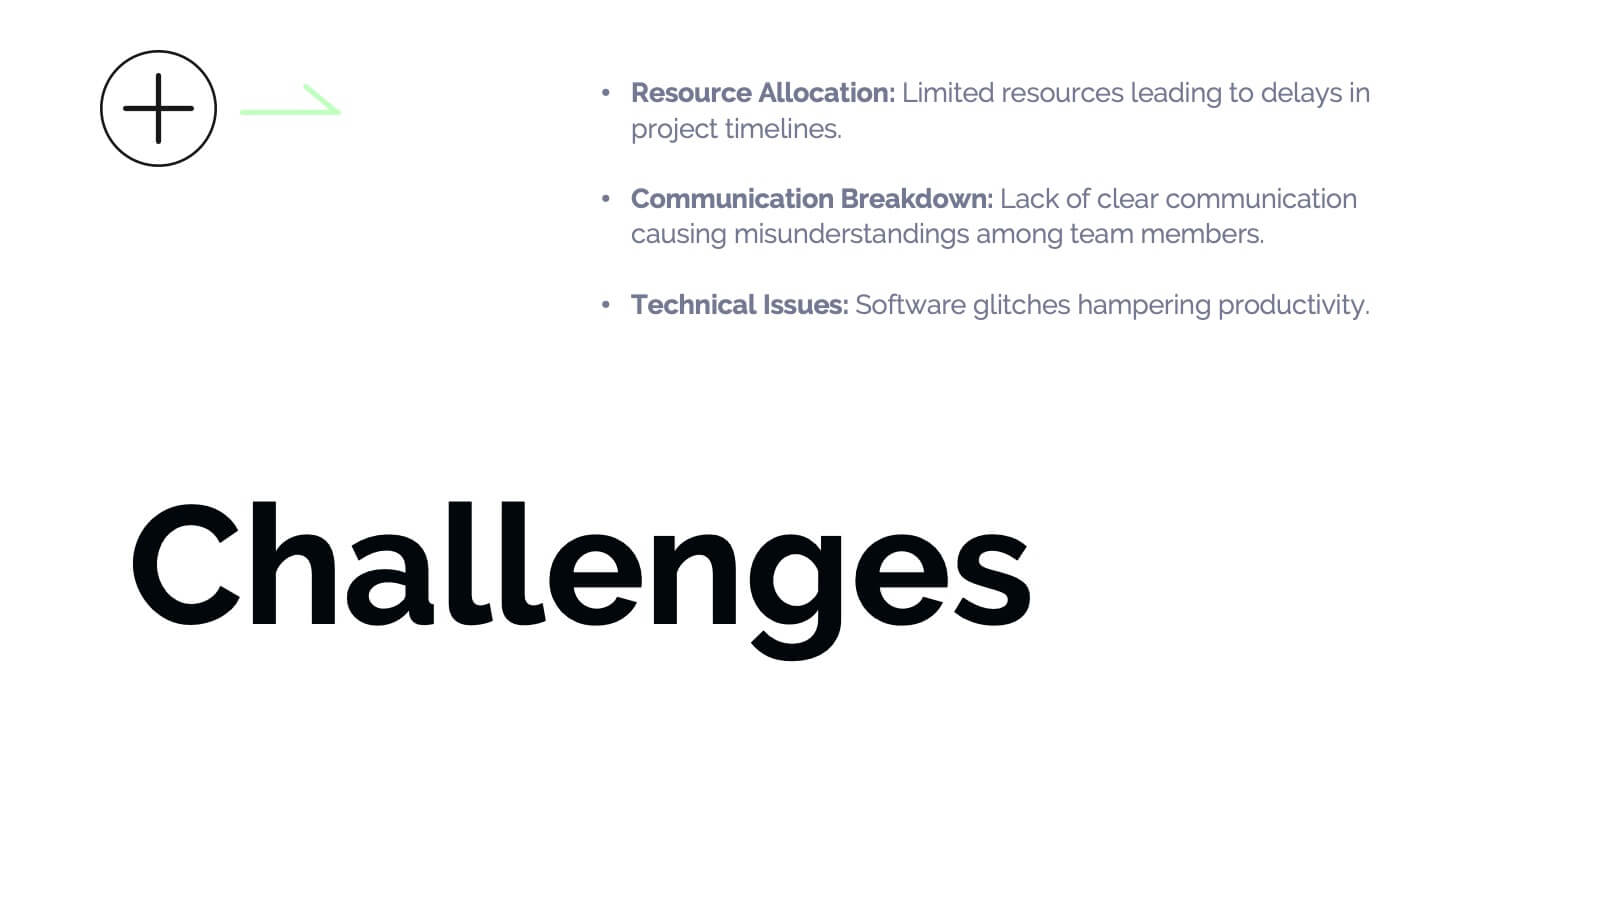
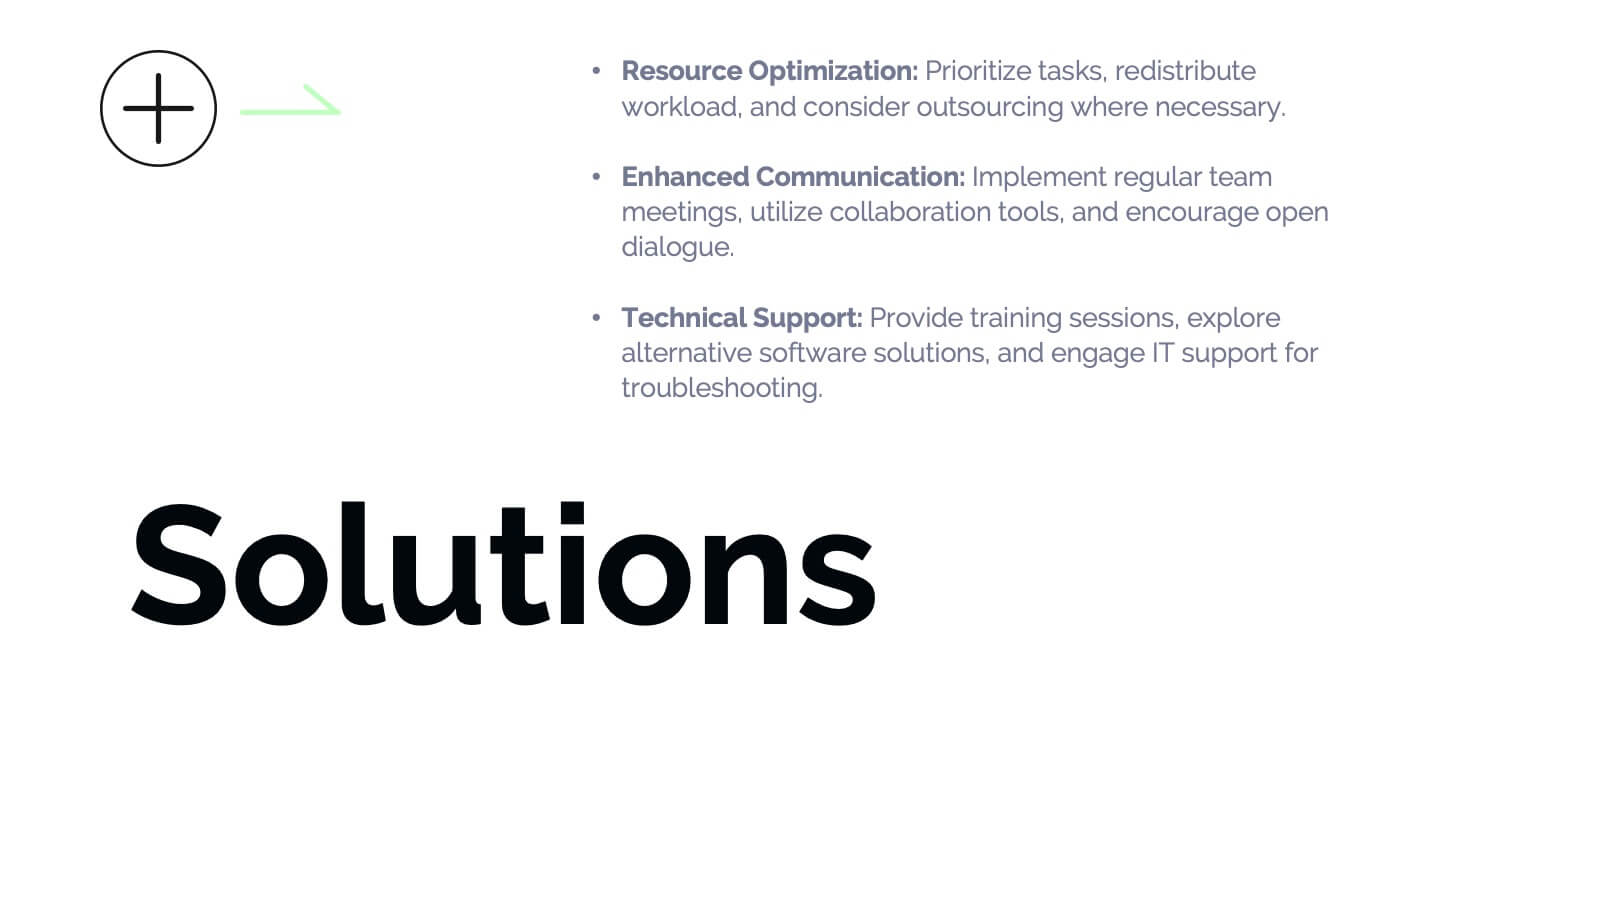
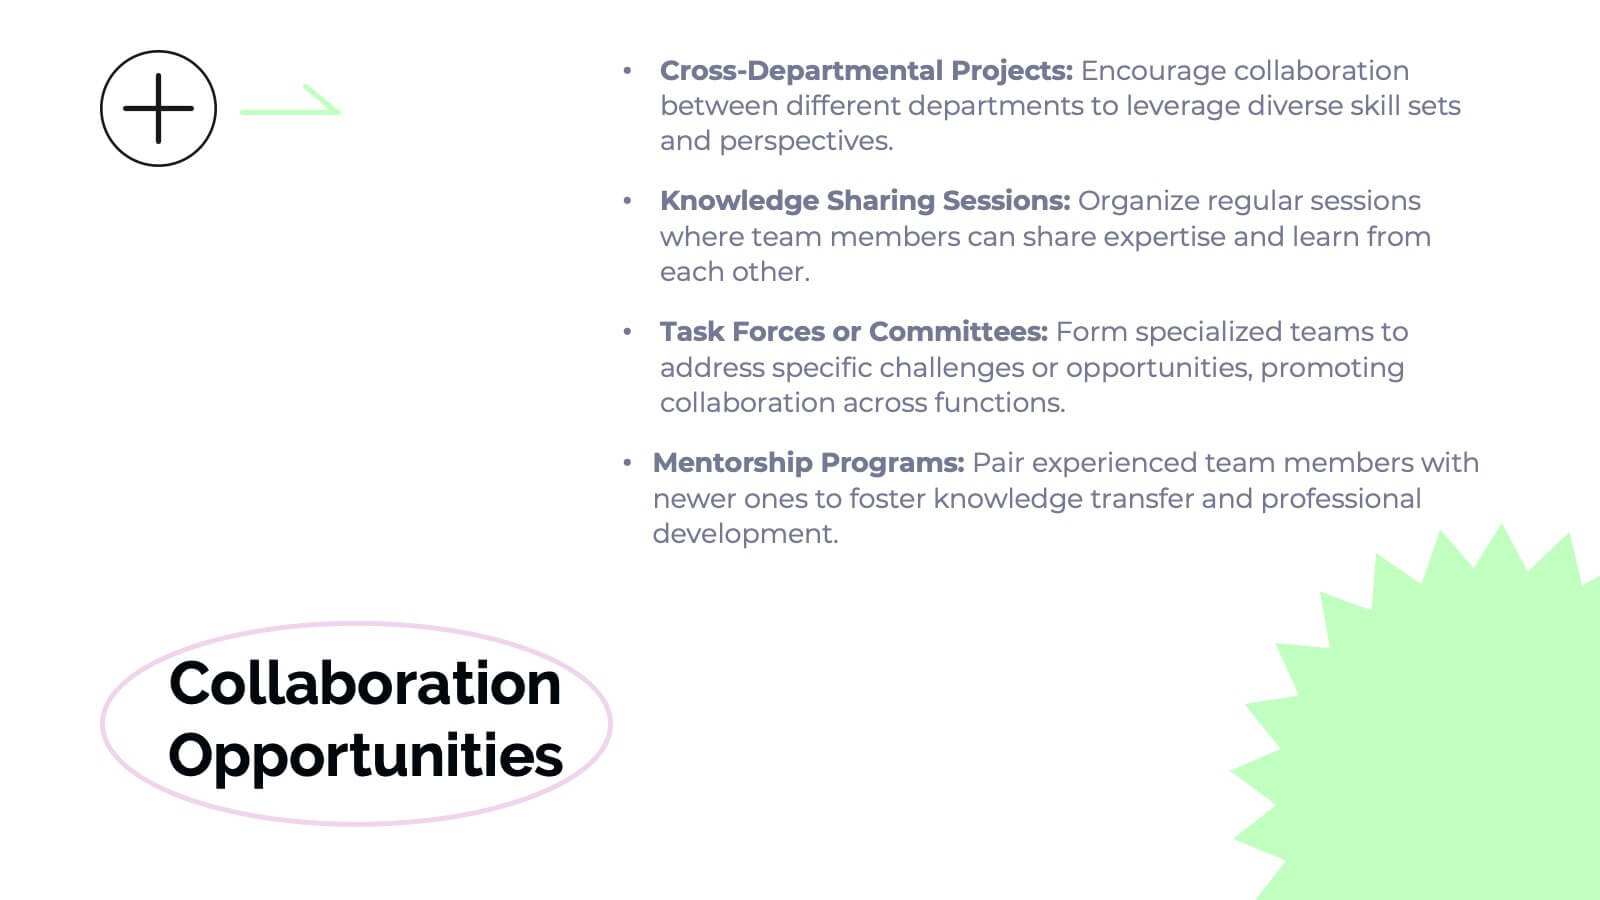
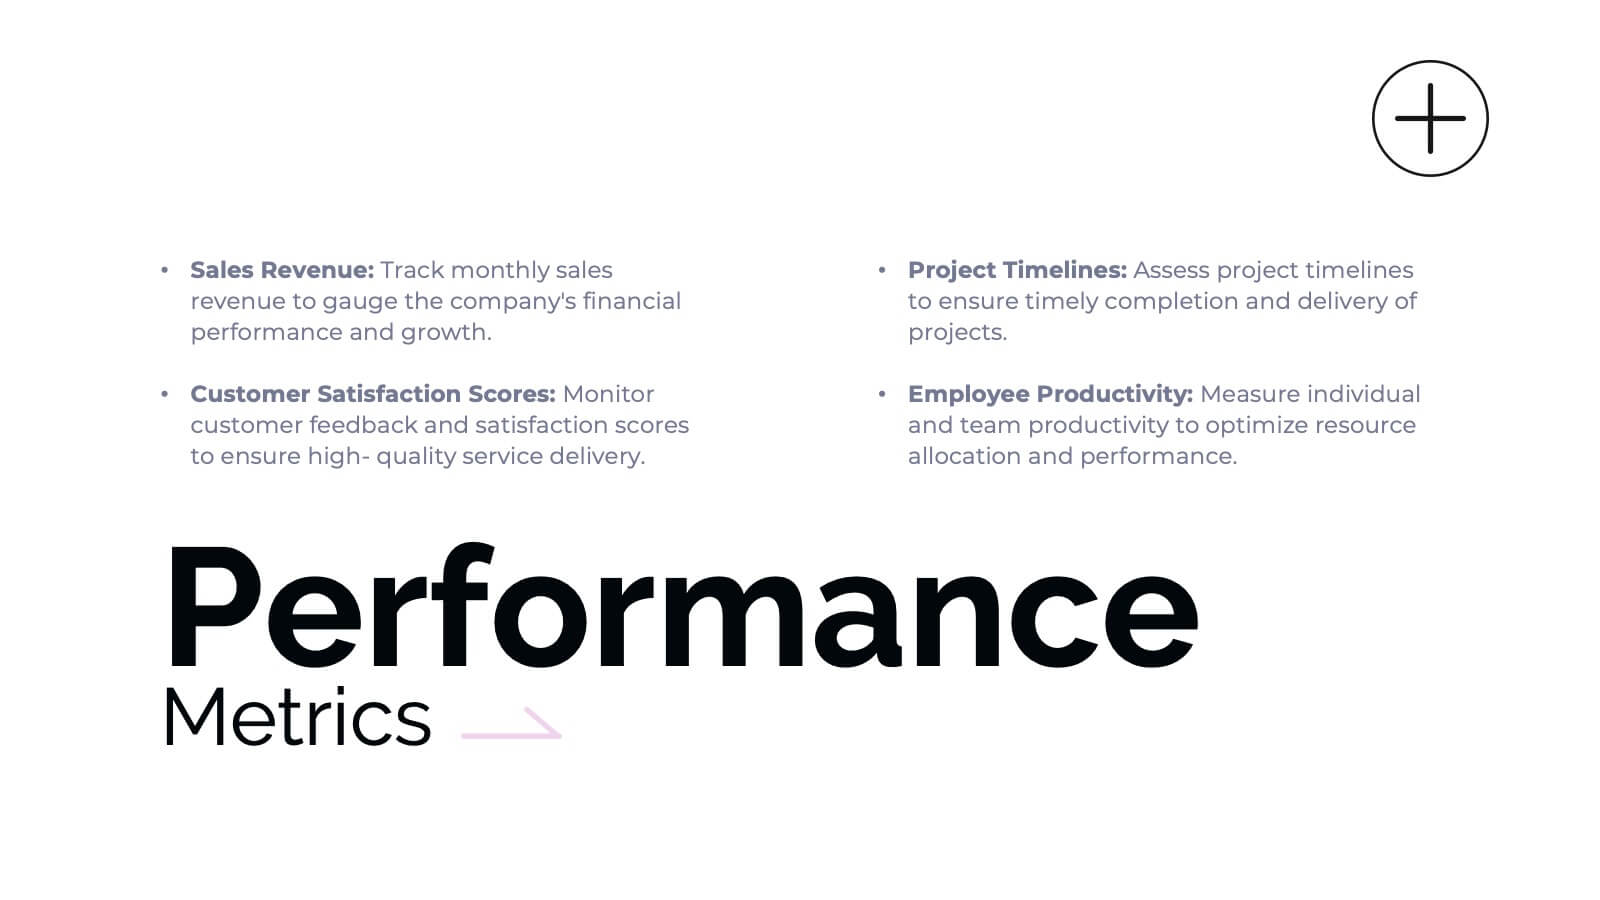
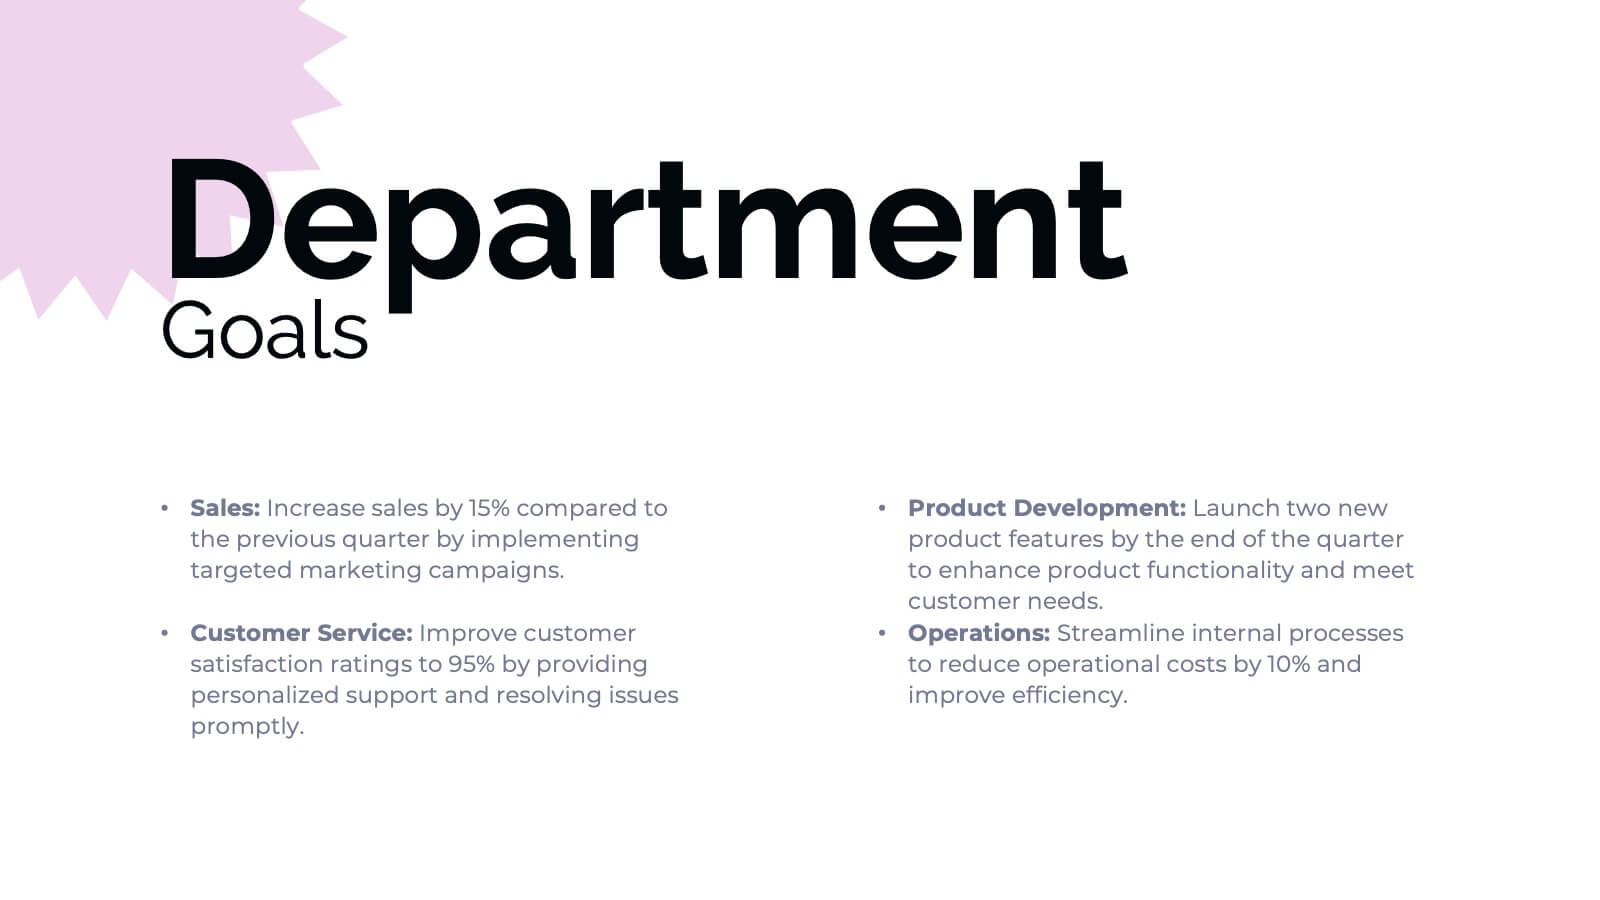
Banshee Business Operations Plan Presentation
Streamline your business operations with this comprehensive presentation template! From team updates and key achievements to challenges and solutions, every aspect of your business plan is covered. Ideal for tracking performance metrics, resource allocation, and upcoming events, this design keeps your operations organized and efficient. Compatible with PowerPoint, Keynote, and Google Slides for seamless integration.


5 slides
Business Innovations Strategy Presentation
Bring your next big idea to life with this modern, visually engaging presentation. Perfect for showcasing creative strategies, innovation frameworks, and growth opportunities, it helps you present your concepts with clarity and flow. Fully customizable and compatible with PowerPoint, Keynote, and Google Slides for a smooth professional experience.


7 slides
Value Chain Analysis Infographic
Streamline your business processes with our Value Chain Analysis Infographic, an essential tool for business analysts, management consultants, and strategic planners. This infographic provides a visual breakdown of the primary and supporting activities that create value for your customers. Our Value Chain Analysis Infographic illustrates how each segment of your business contributes to the overall product or service delivery. It's designed to help you identify opportunities for improvement, cost savings, and competitive advantage. The infographic is customizable, allowing you to detail activities such as inbound logistics, operations, outbound logistics, marketing, sales, and service. This SEO-optimized tool ensures that your strategic analysis is accessible for professionals seeking to enhance operational efficiency and value creation. Employ this infographic to dissect and understand your business operations, fostering informed decision-making and optimizing the value delivered to your customers.


4 slides
Environmental Sustainability Best Practices Presentation
Promote eco-friendly initiatives with the Environmental Sustainability Best Practices Presentation template. This clean and modern slide deck is designed to highlight sustainable business strategies, green initiatives, and environmental impact assessments. Featuring an intuitive layout with clearly defined sections, this fully editable design is ideal for corporate sustainability leaders, educators, and environmental advocates. Compatible with PowerPoint, Keynote, and Google Slides for seamless customization and presentation.


5 slides
Productivity and Time Optimization Presentation
Visualize time-saving strategies and workflow efficiency with this hourglass-themed productivity template. Ideal for illustrating phased progress, deadlines, or time distribution, this design breaks your message into four clear sections with engaging visuals. Fully editable in PowerPoint, Keynote, and Google Slides.


5 slides
Business Pillars for Success Presentation
Present your organization's core values or strategic foundations with this column-style infographic. Each pillar represents a distinct success factor, ideal for visualizing business frameworks, goals, or leadership principles. Fully editable in PowerPoint, Keynote, or Google Slides to match your brand and message.


5 slides
Building Strong Business Relationships
Create lasting partnerships with this structured business relationship infographic. Ideal for outlining trust-building strategies, collaboration frameworks, and stakeholder engagement plans. Fully editable in PowerPoint, Keynote, and Google Slides, making it simple to align the design with your company’s branding and professional goals.


5 slides
Mission and Values Alignment
Align your purpose with progress using this clean, directional layout that maps your mission, core values, and strategic focus in a unified flow. Perfect for internal briefings or culture decks, this slide visually connects each value to your organizational journey. Fully compatible with PowerPoint, Keynote, and Google Slides.


21 slides
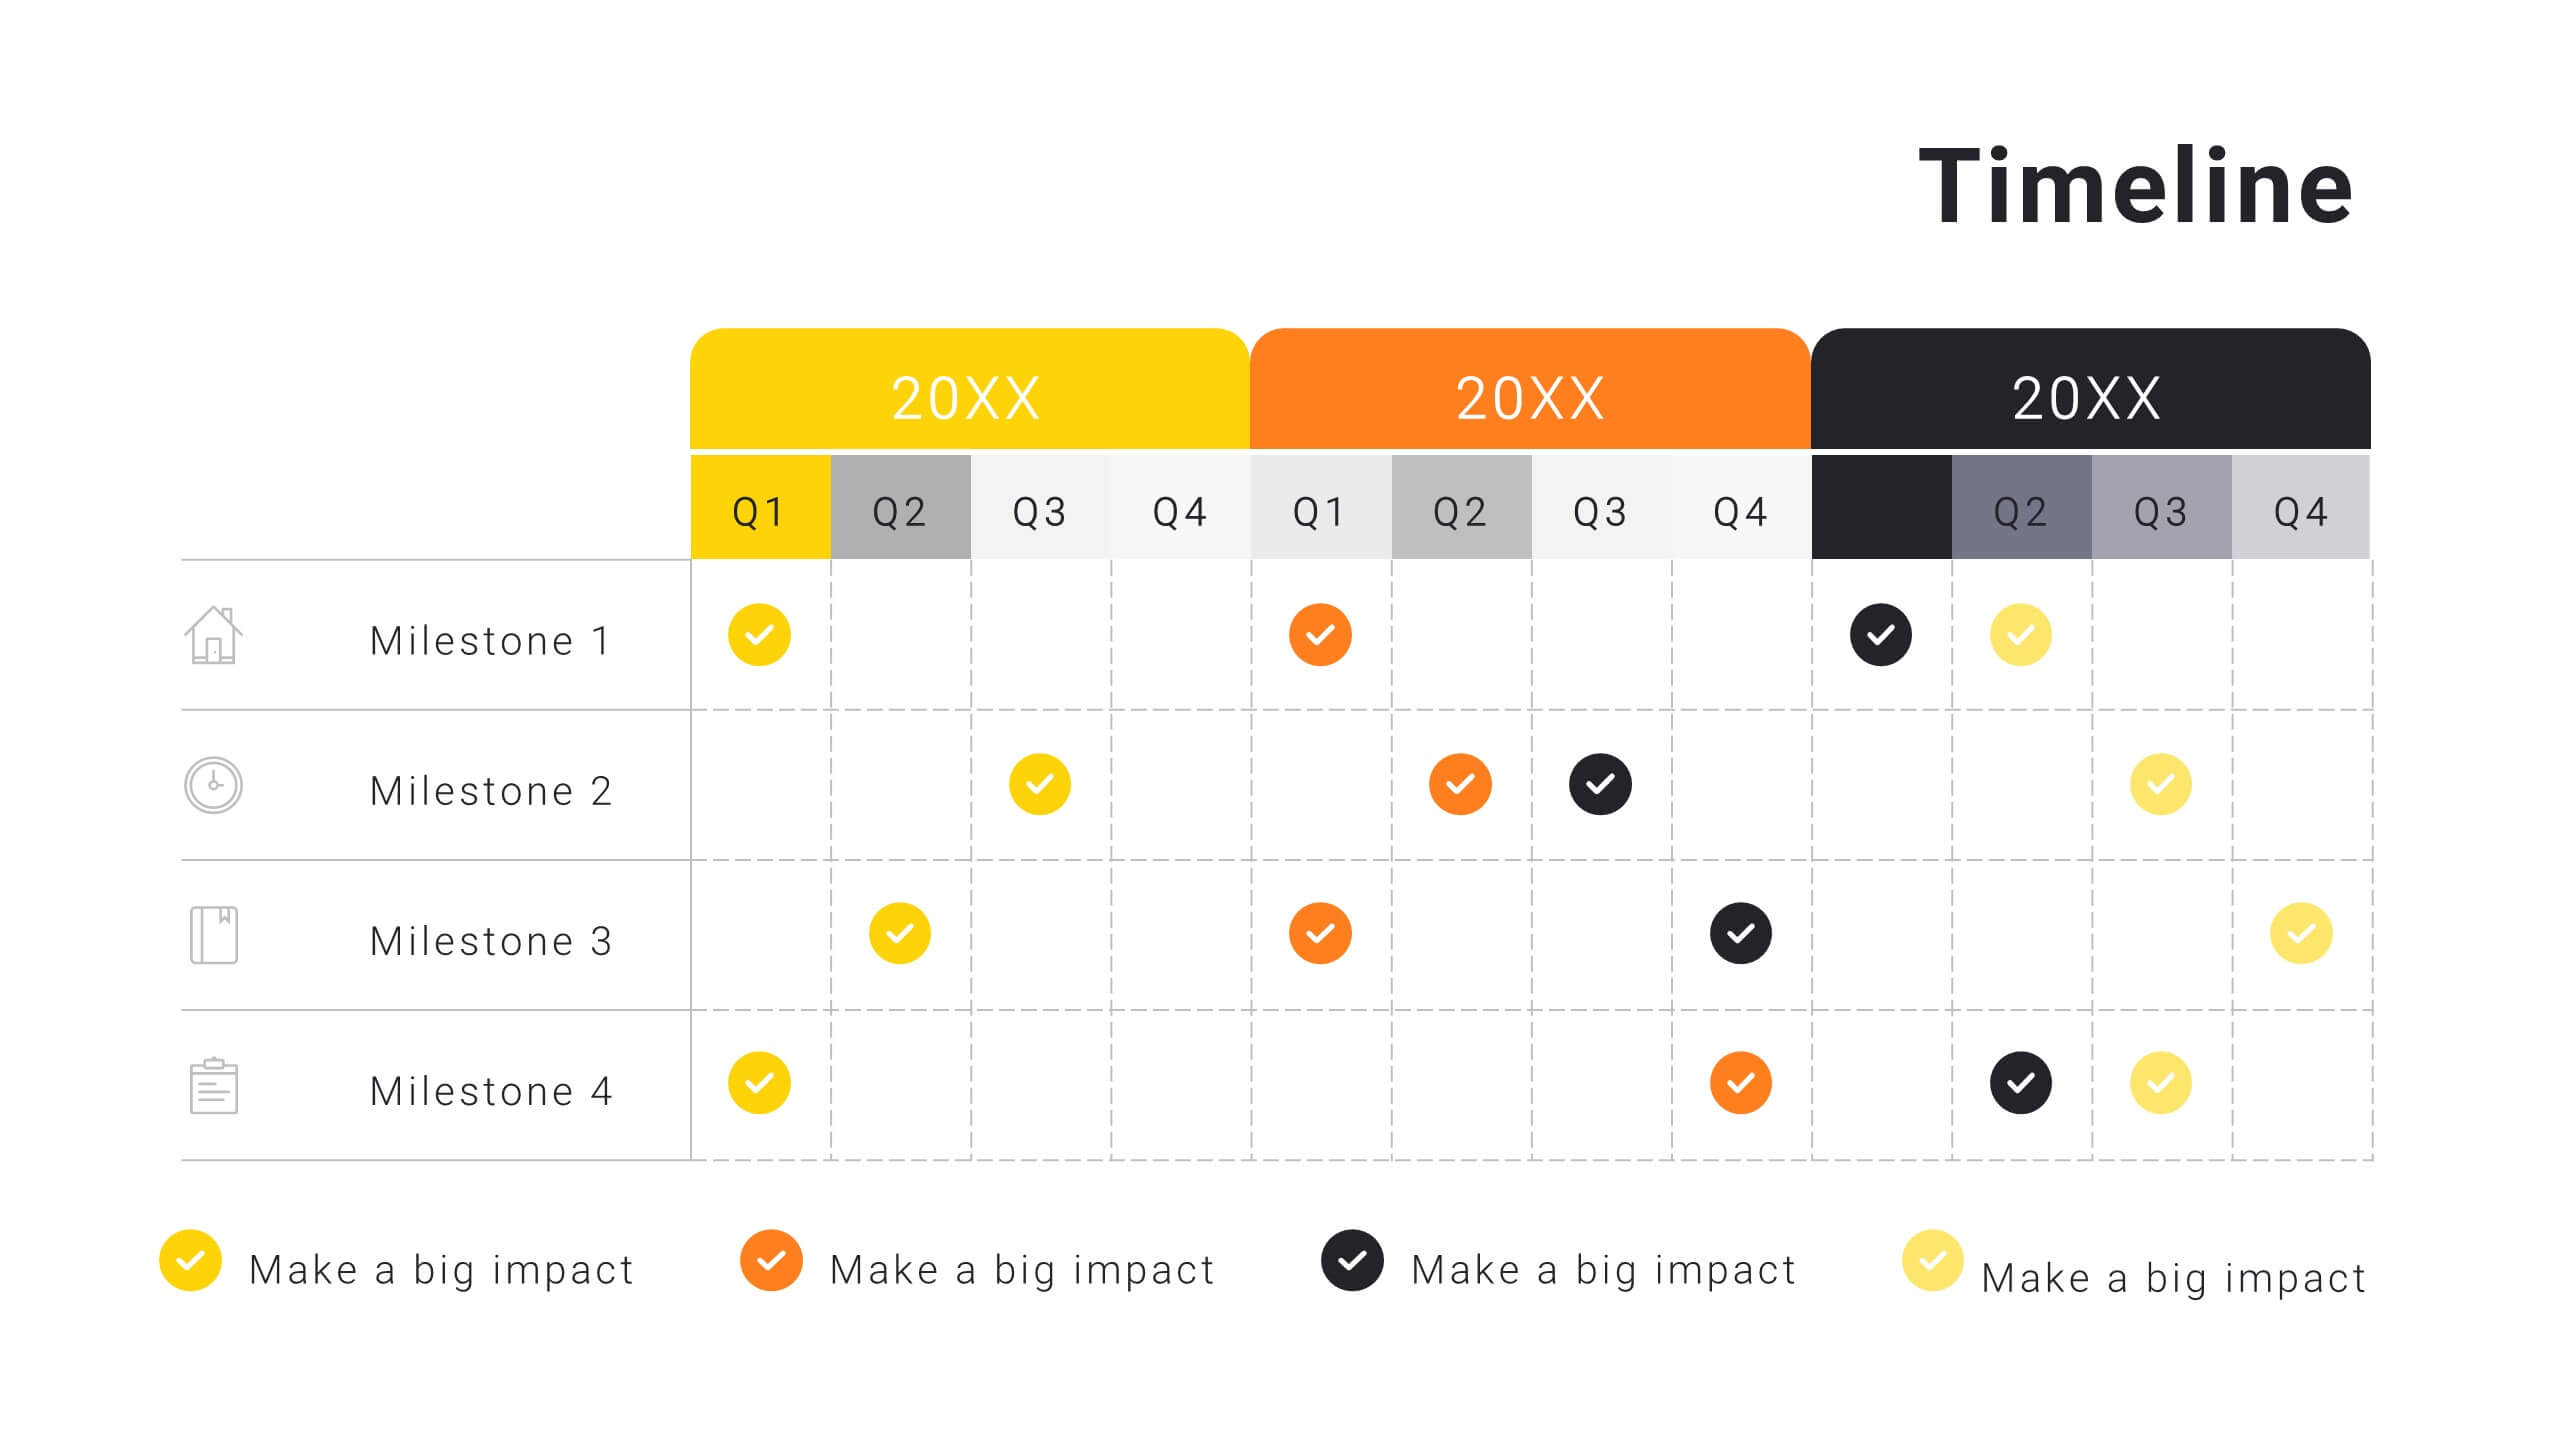
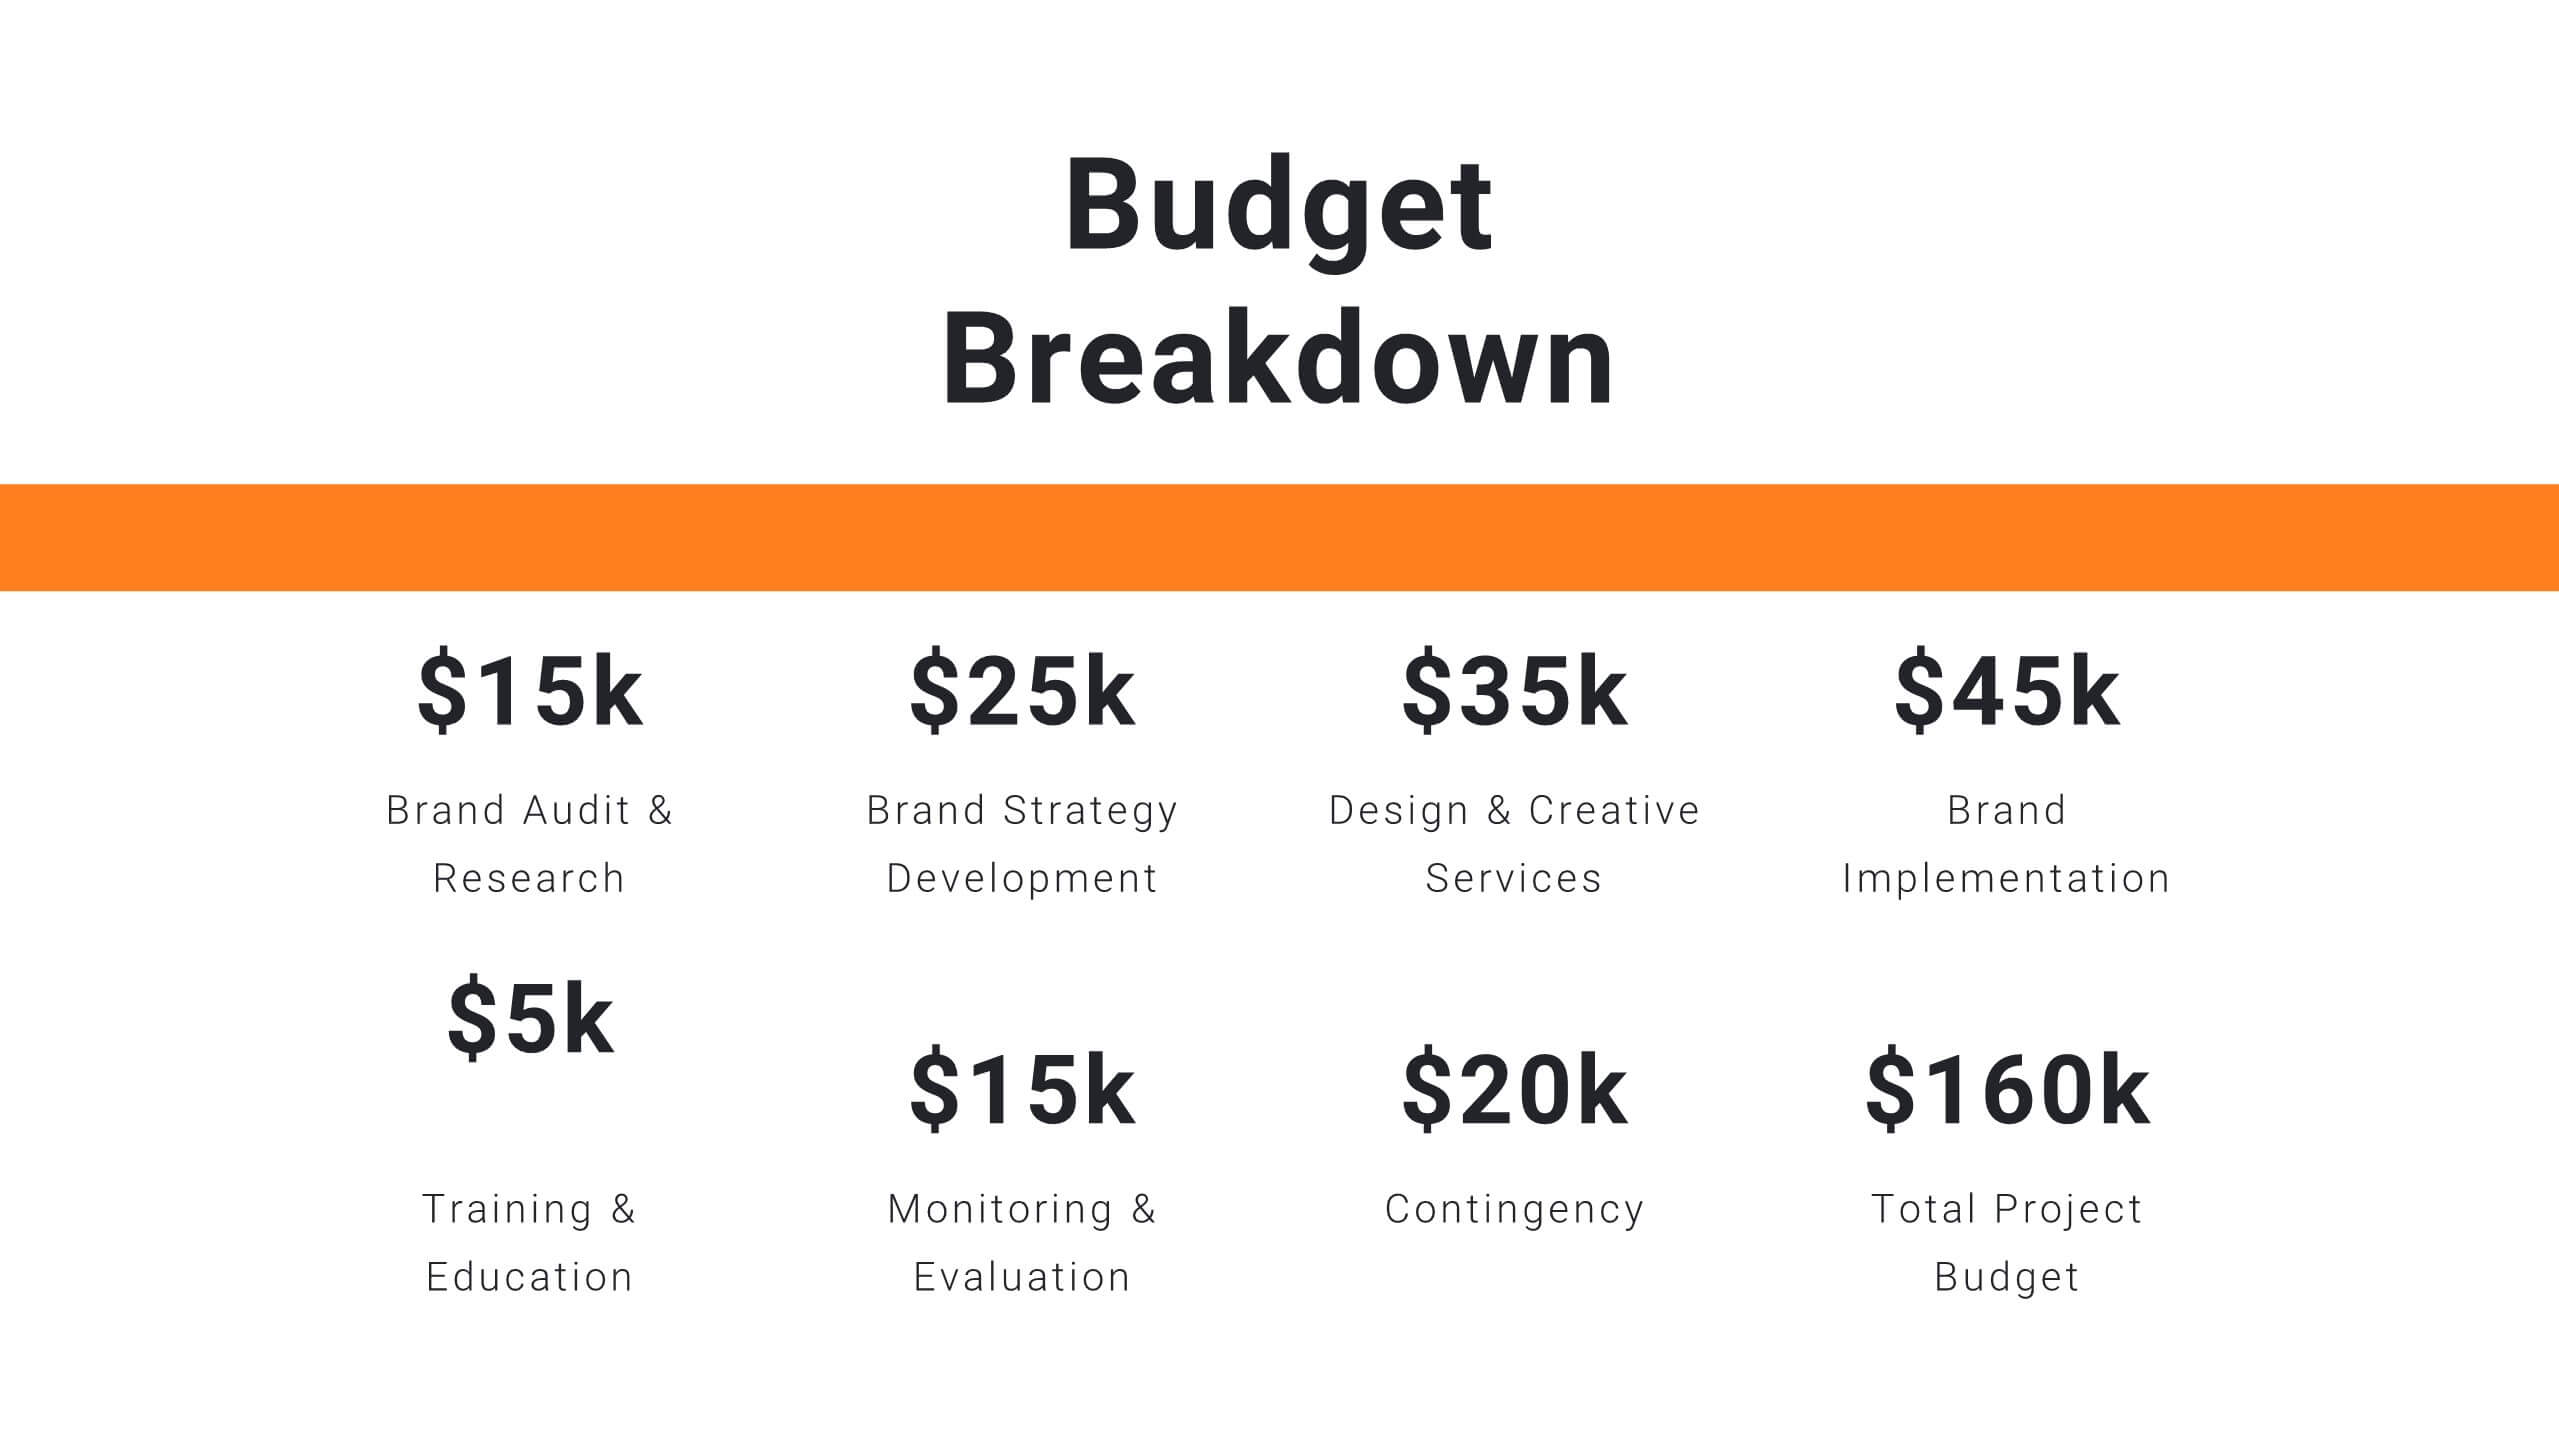
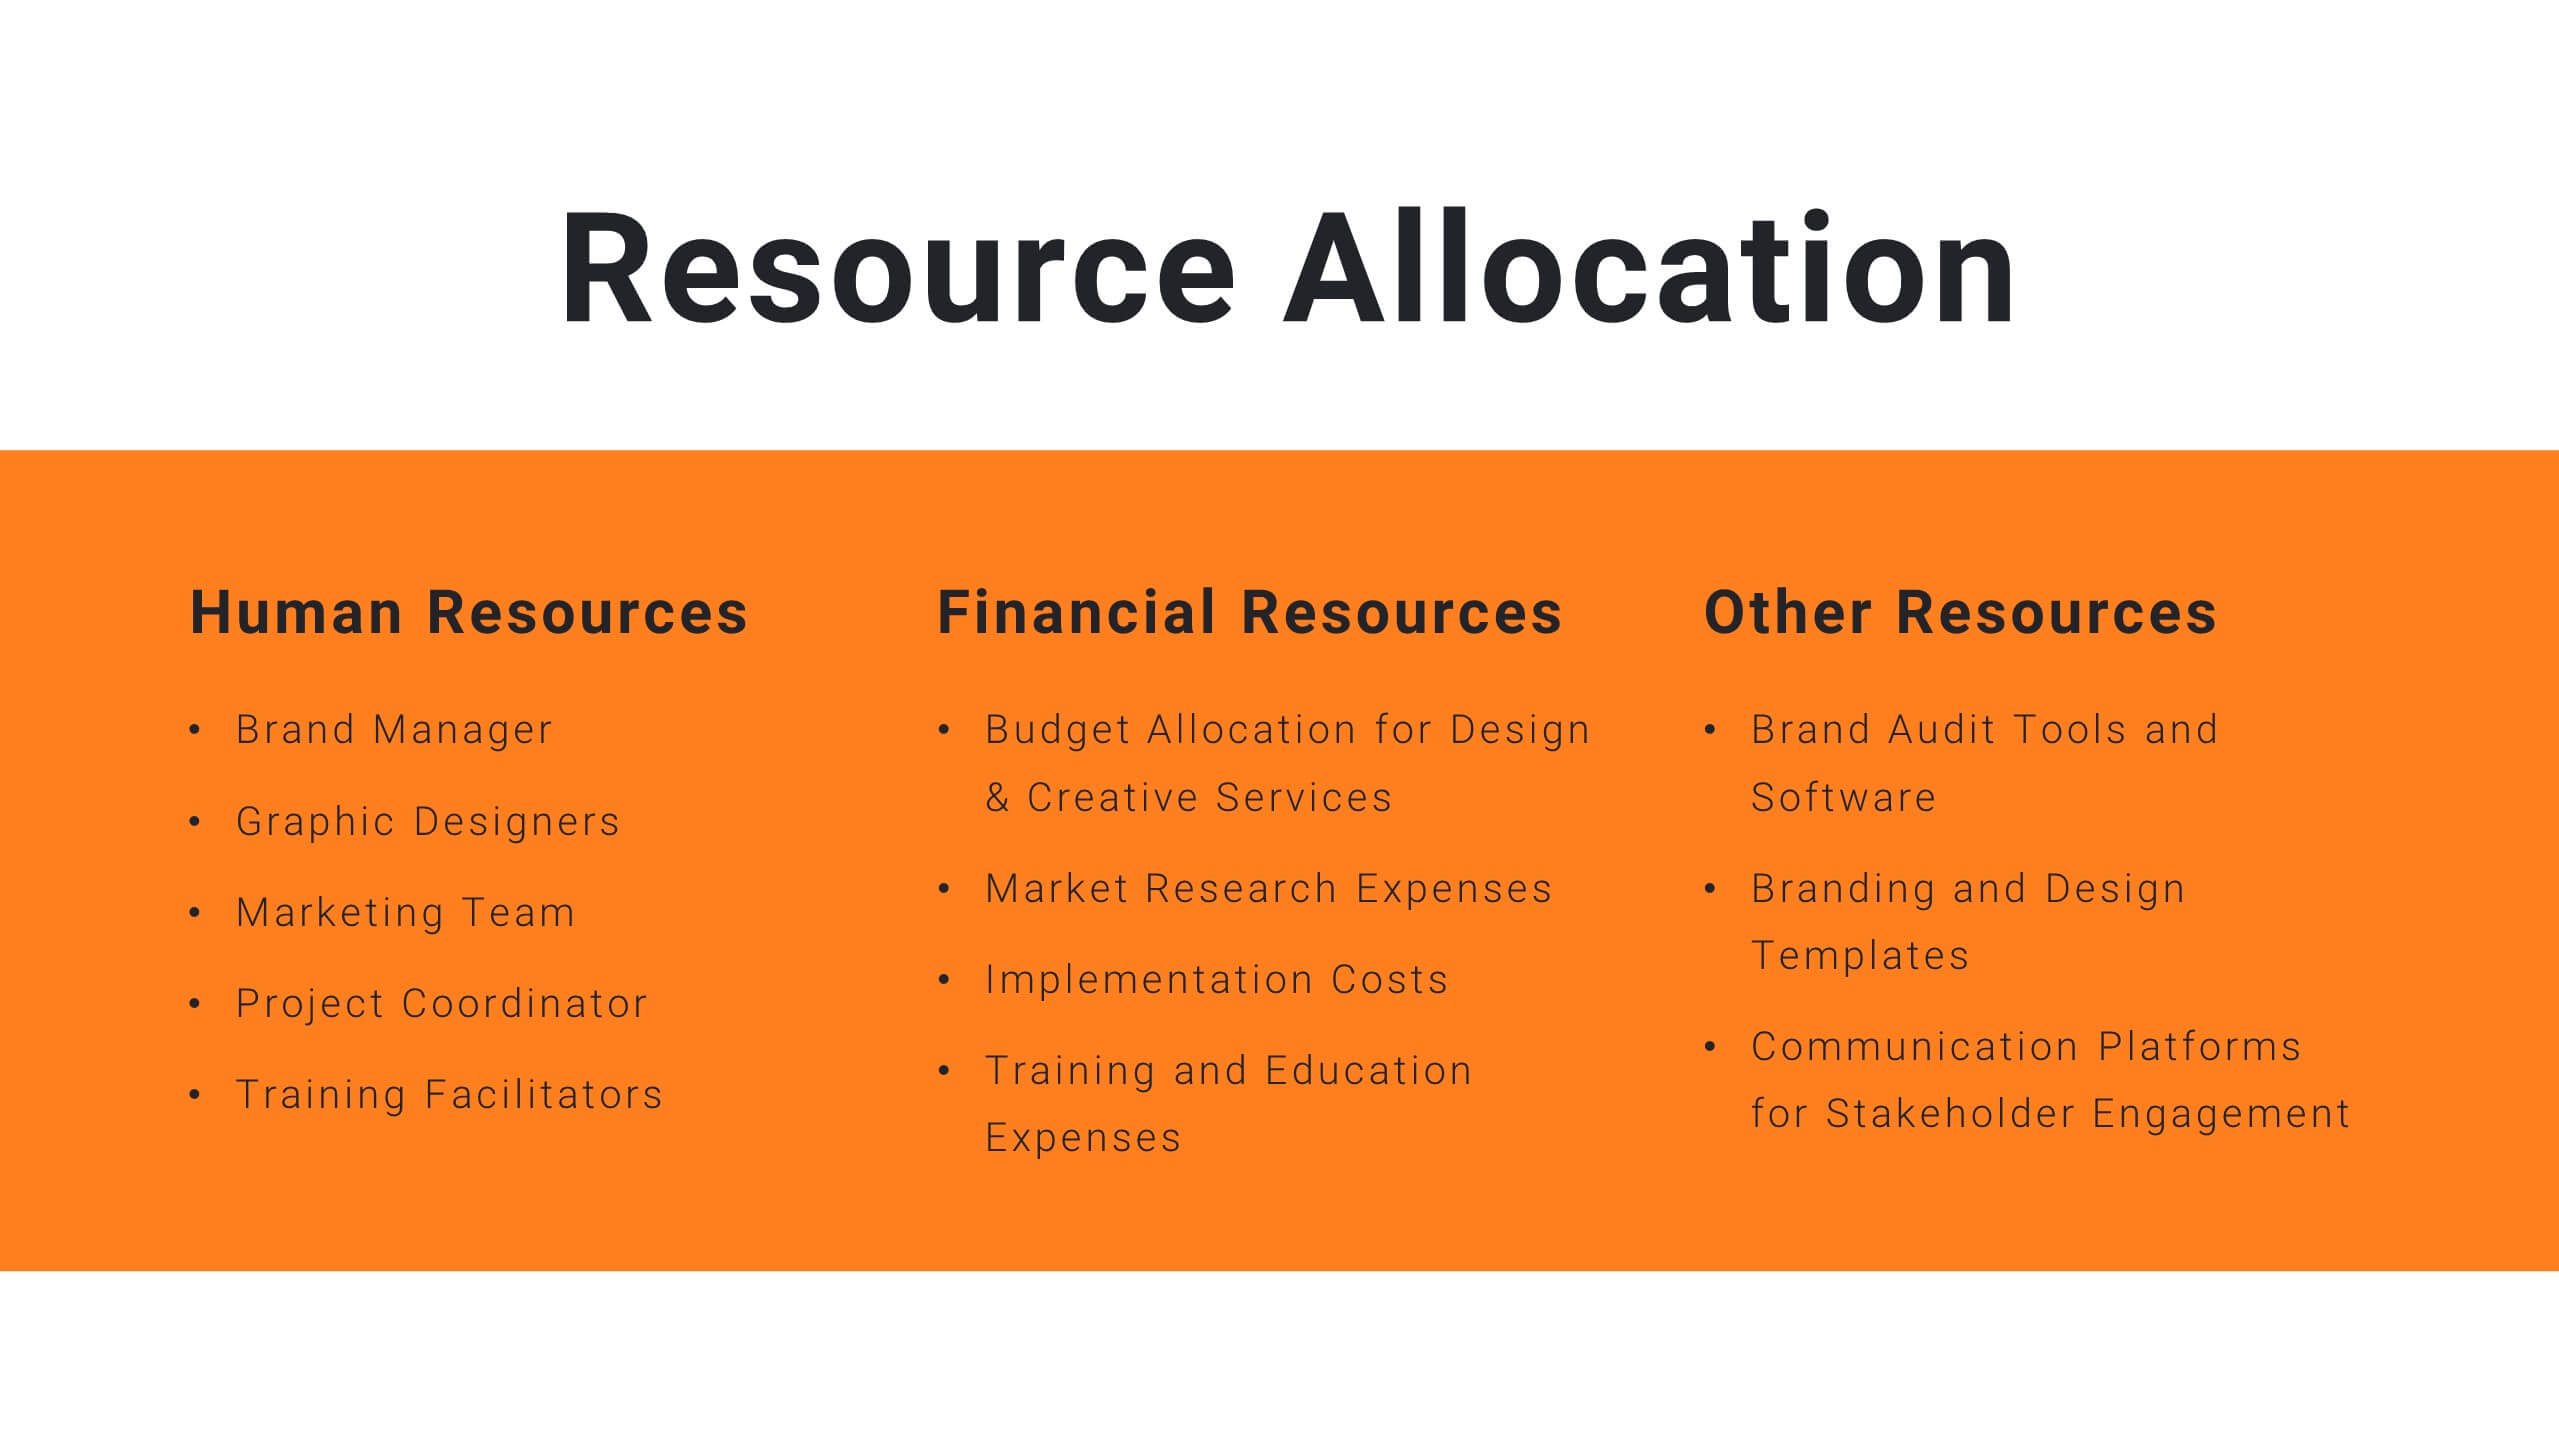
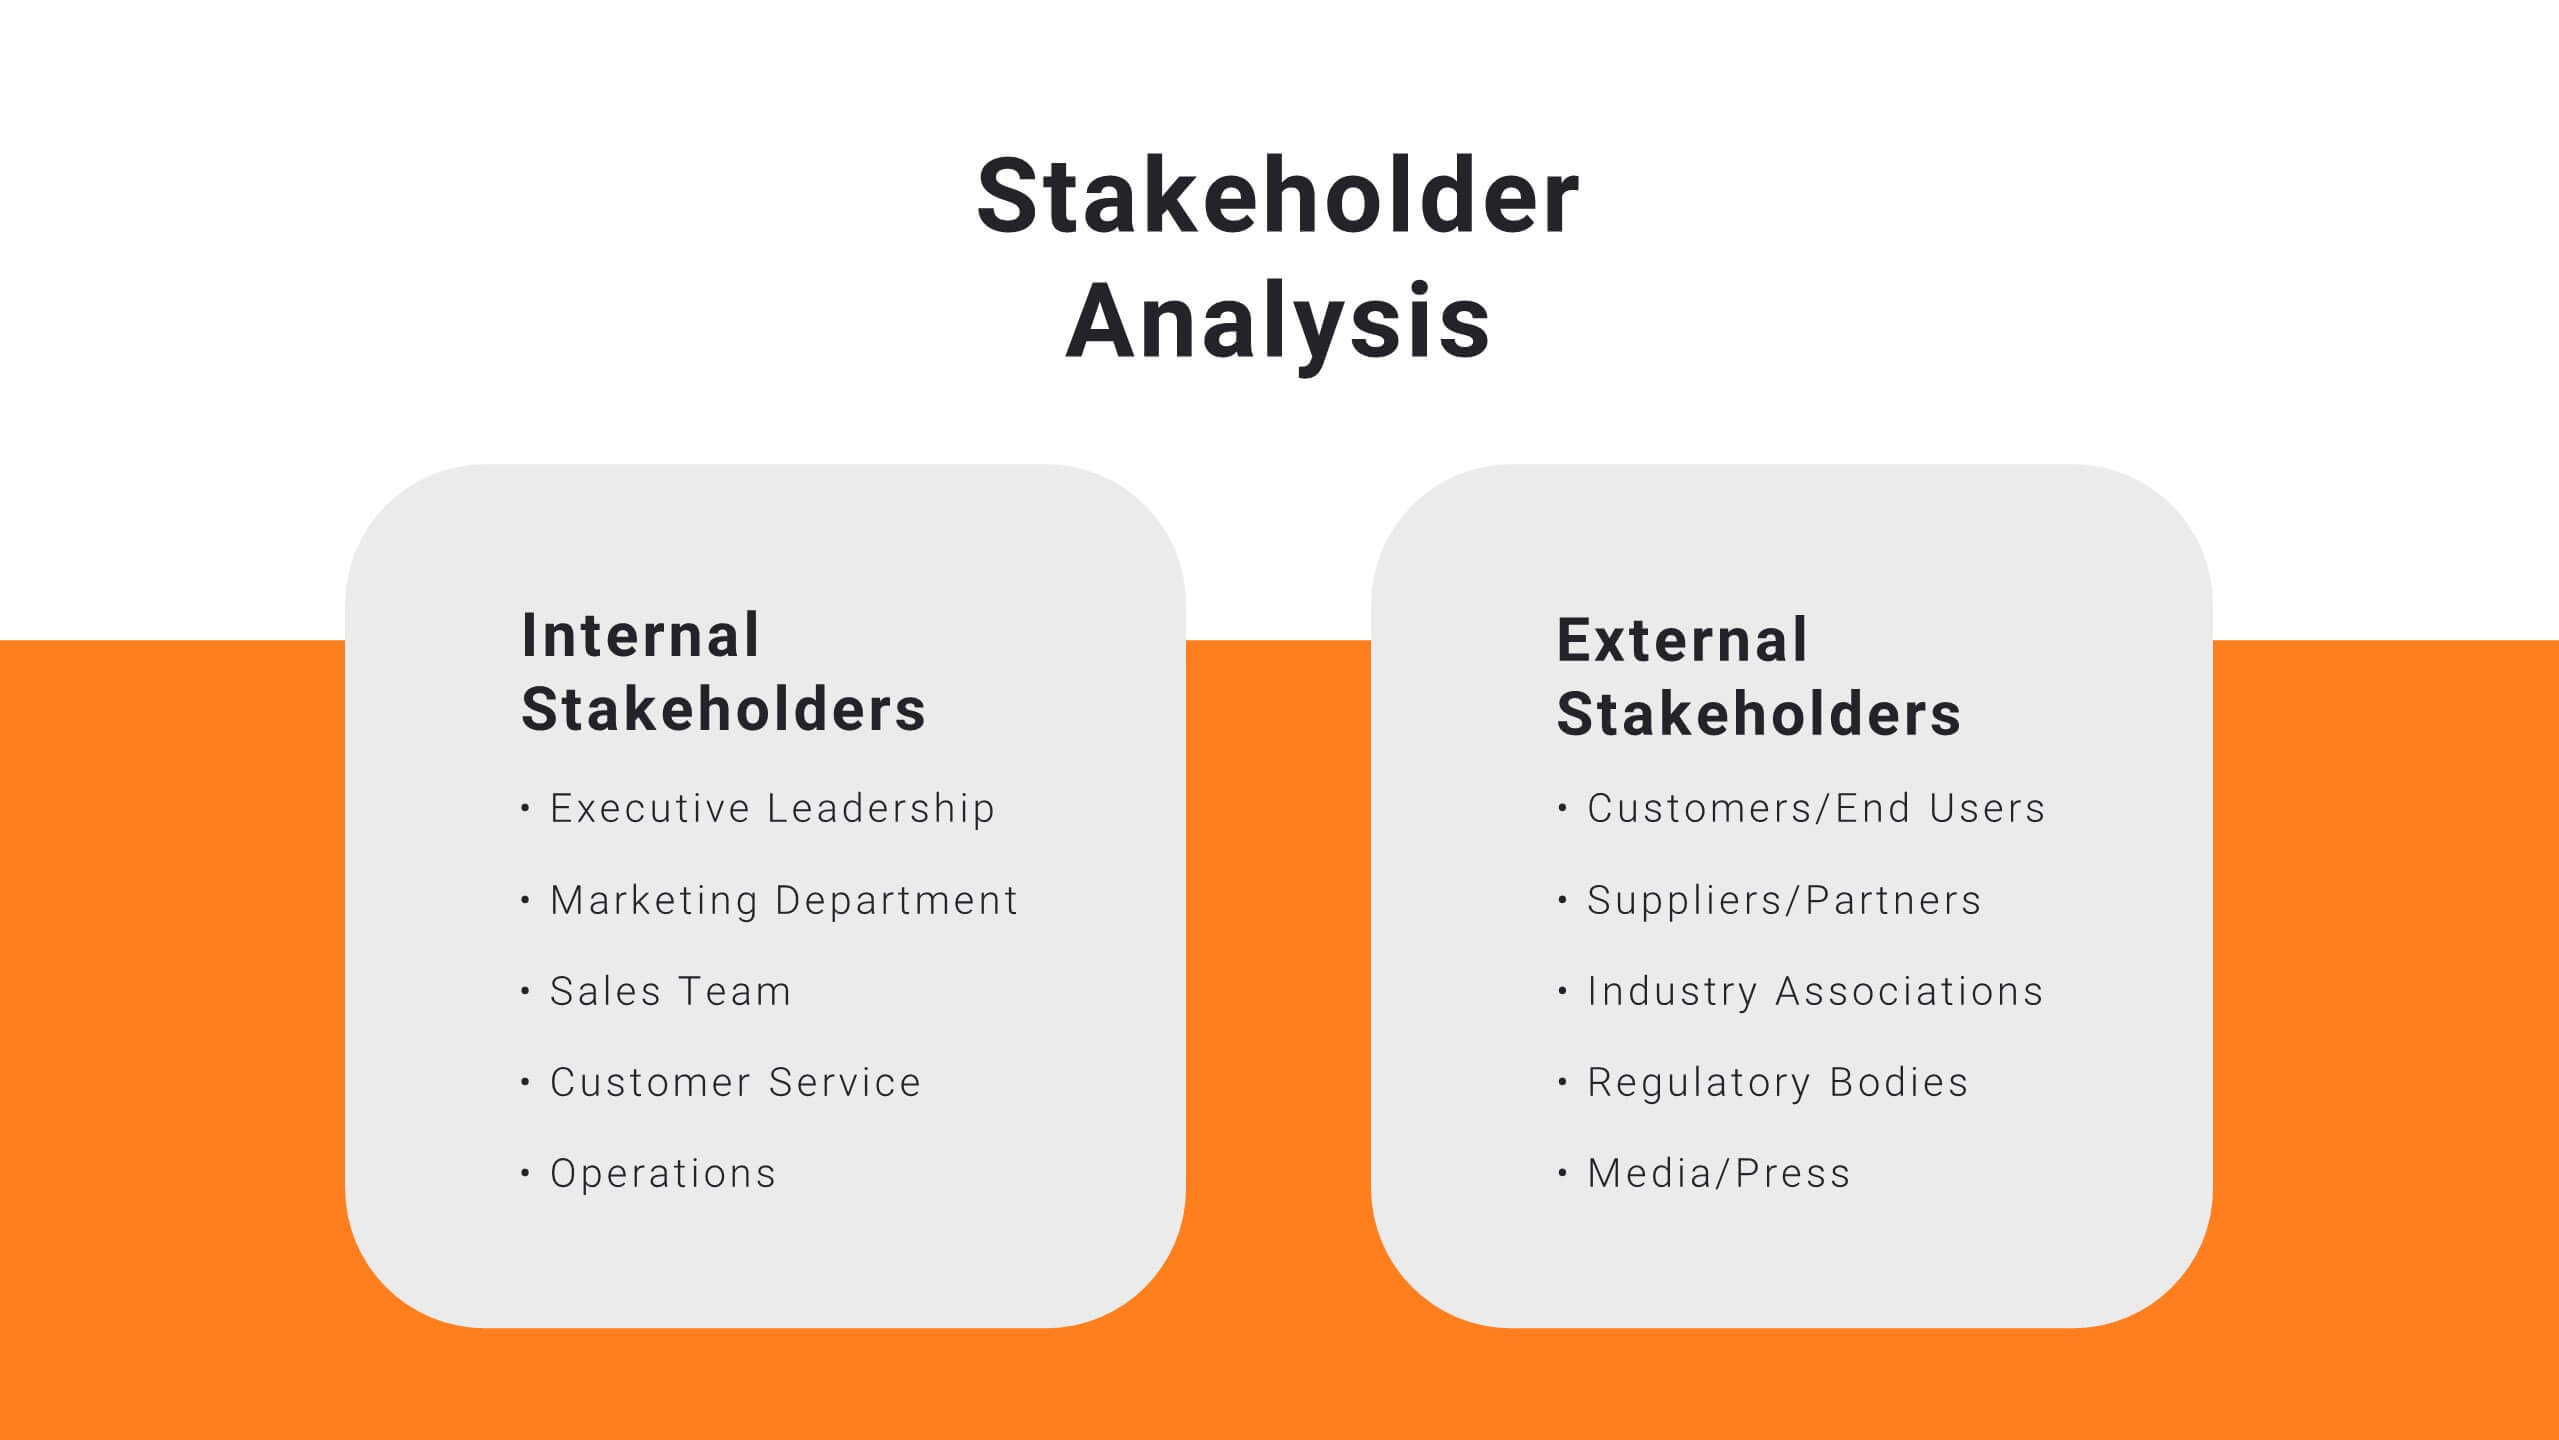
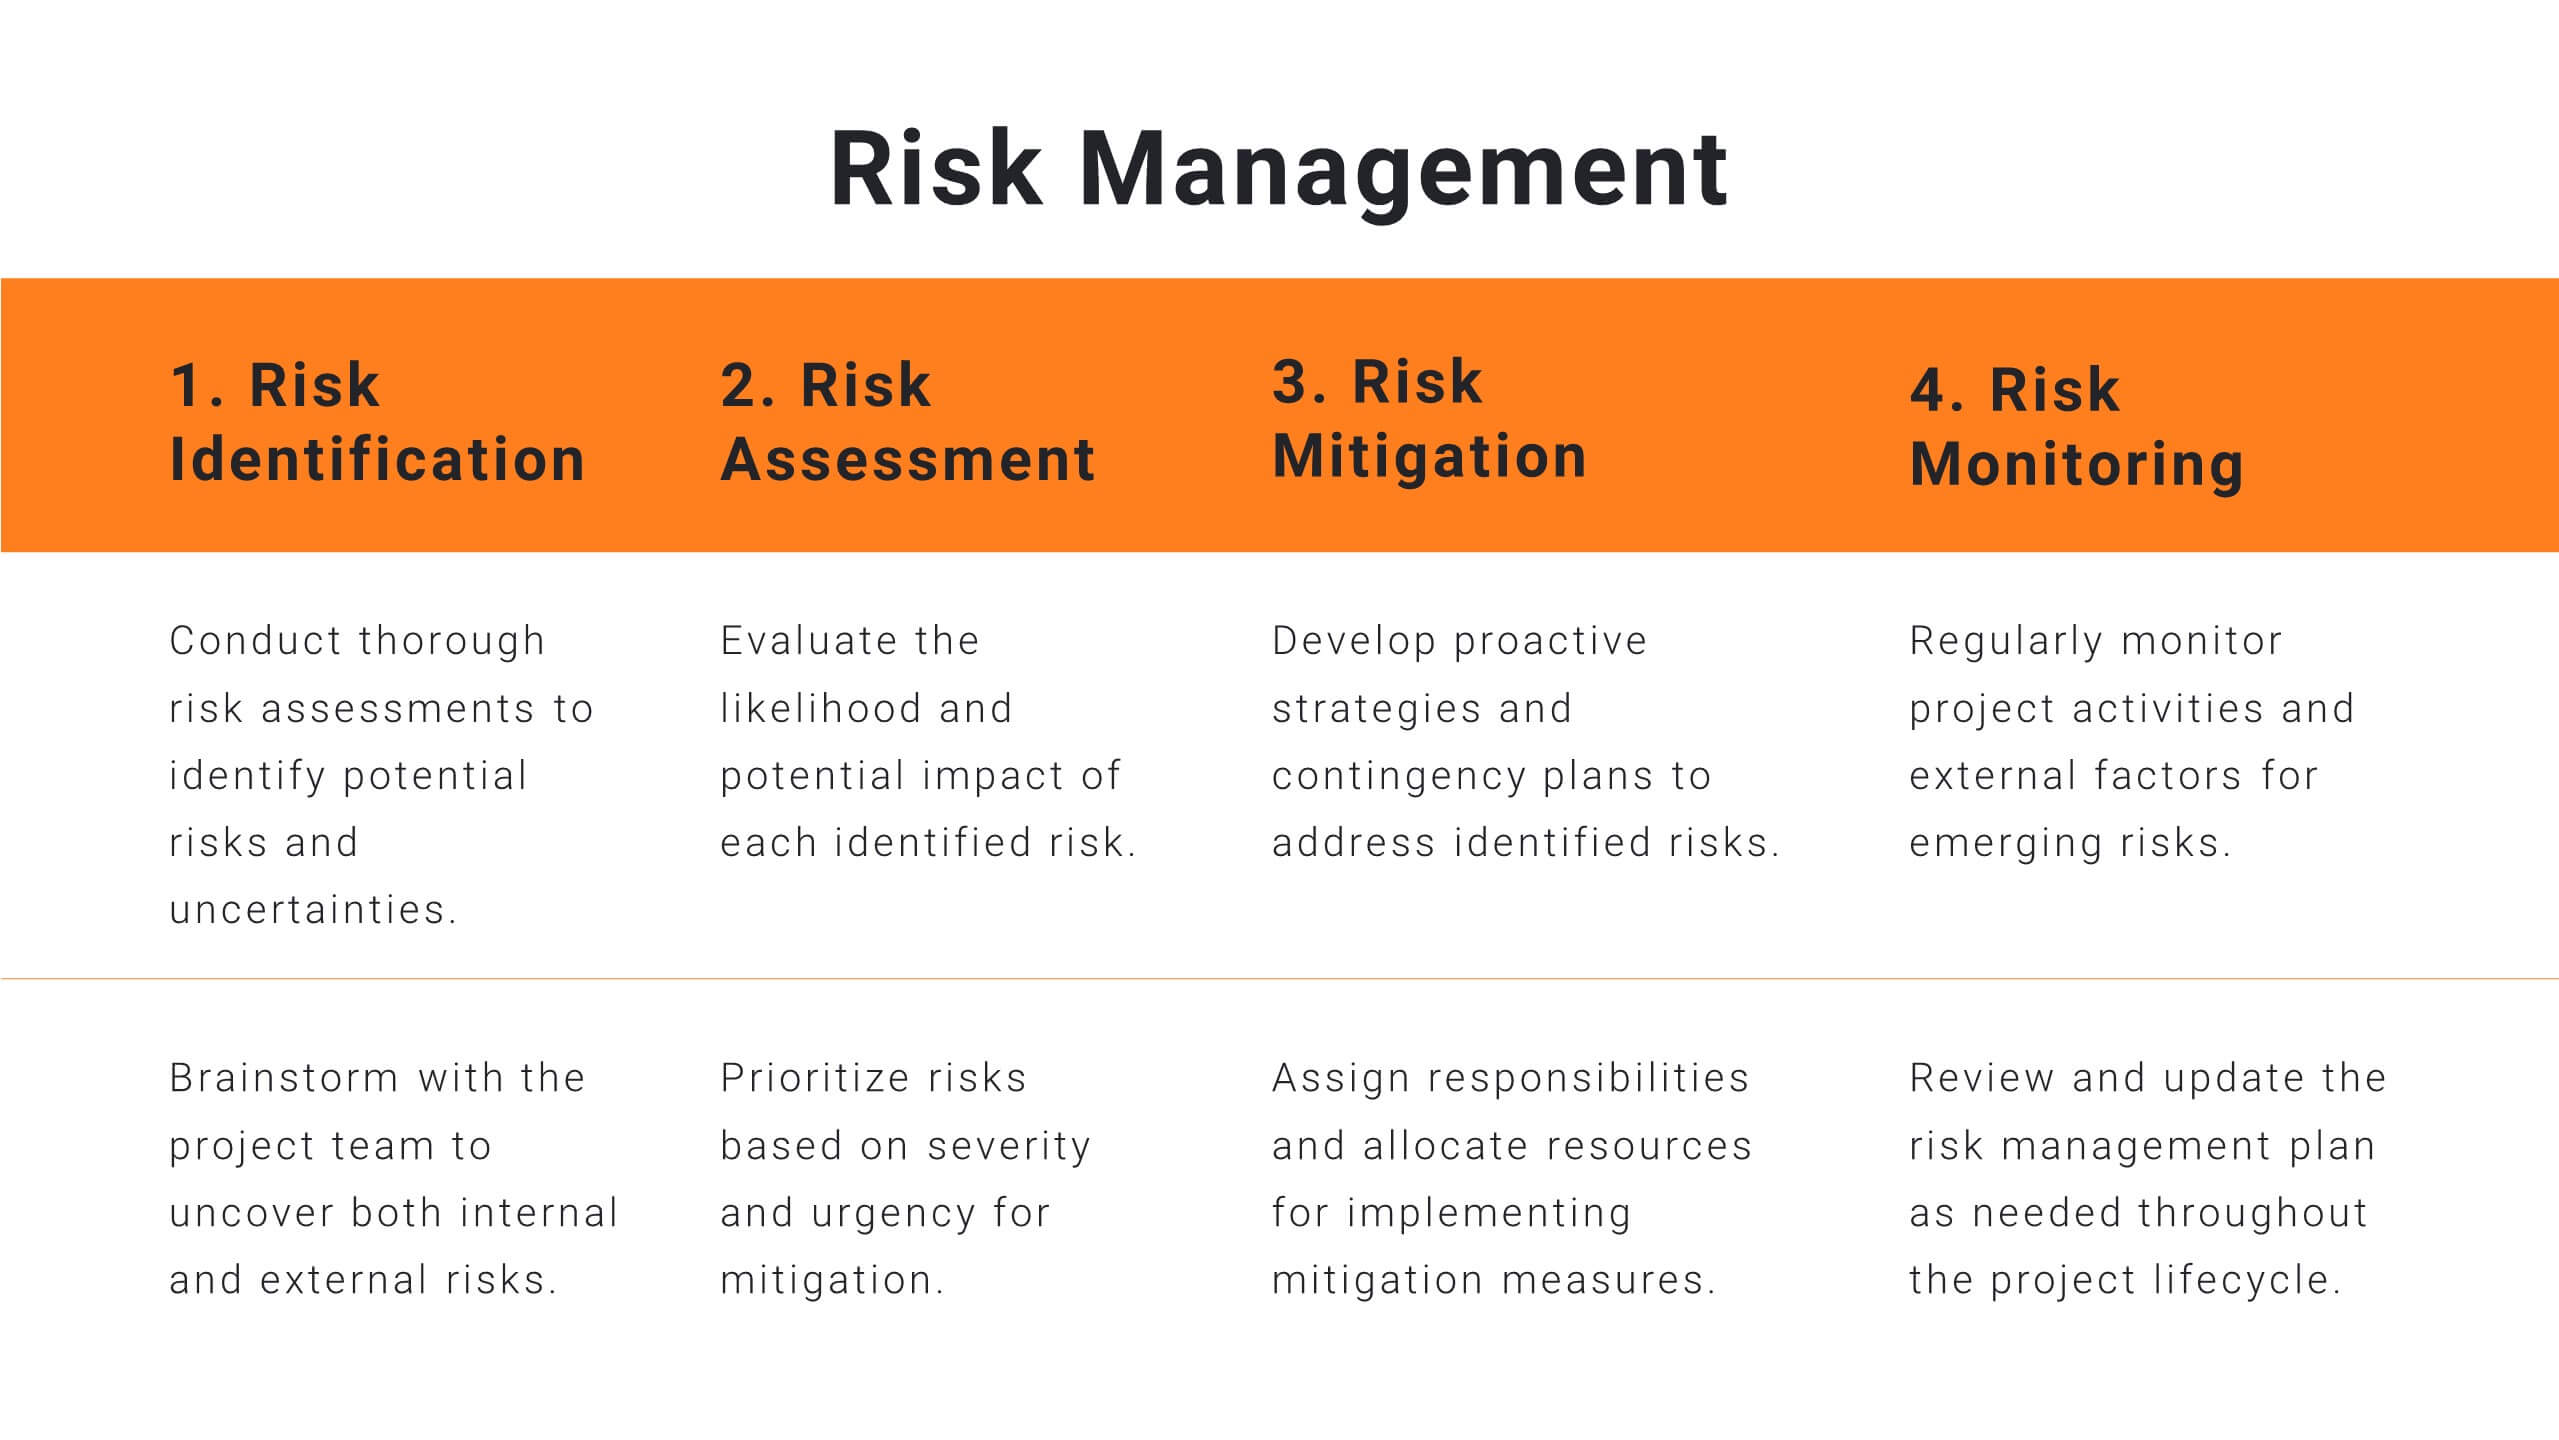
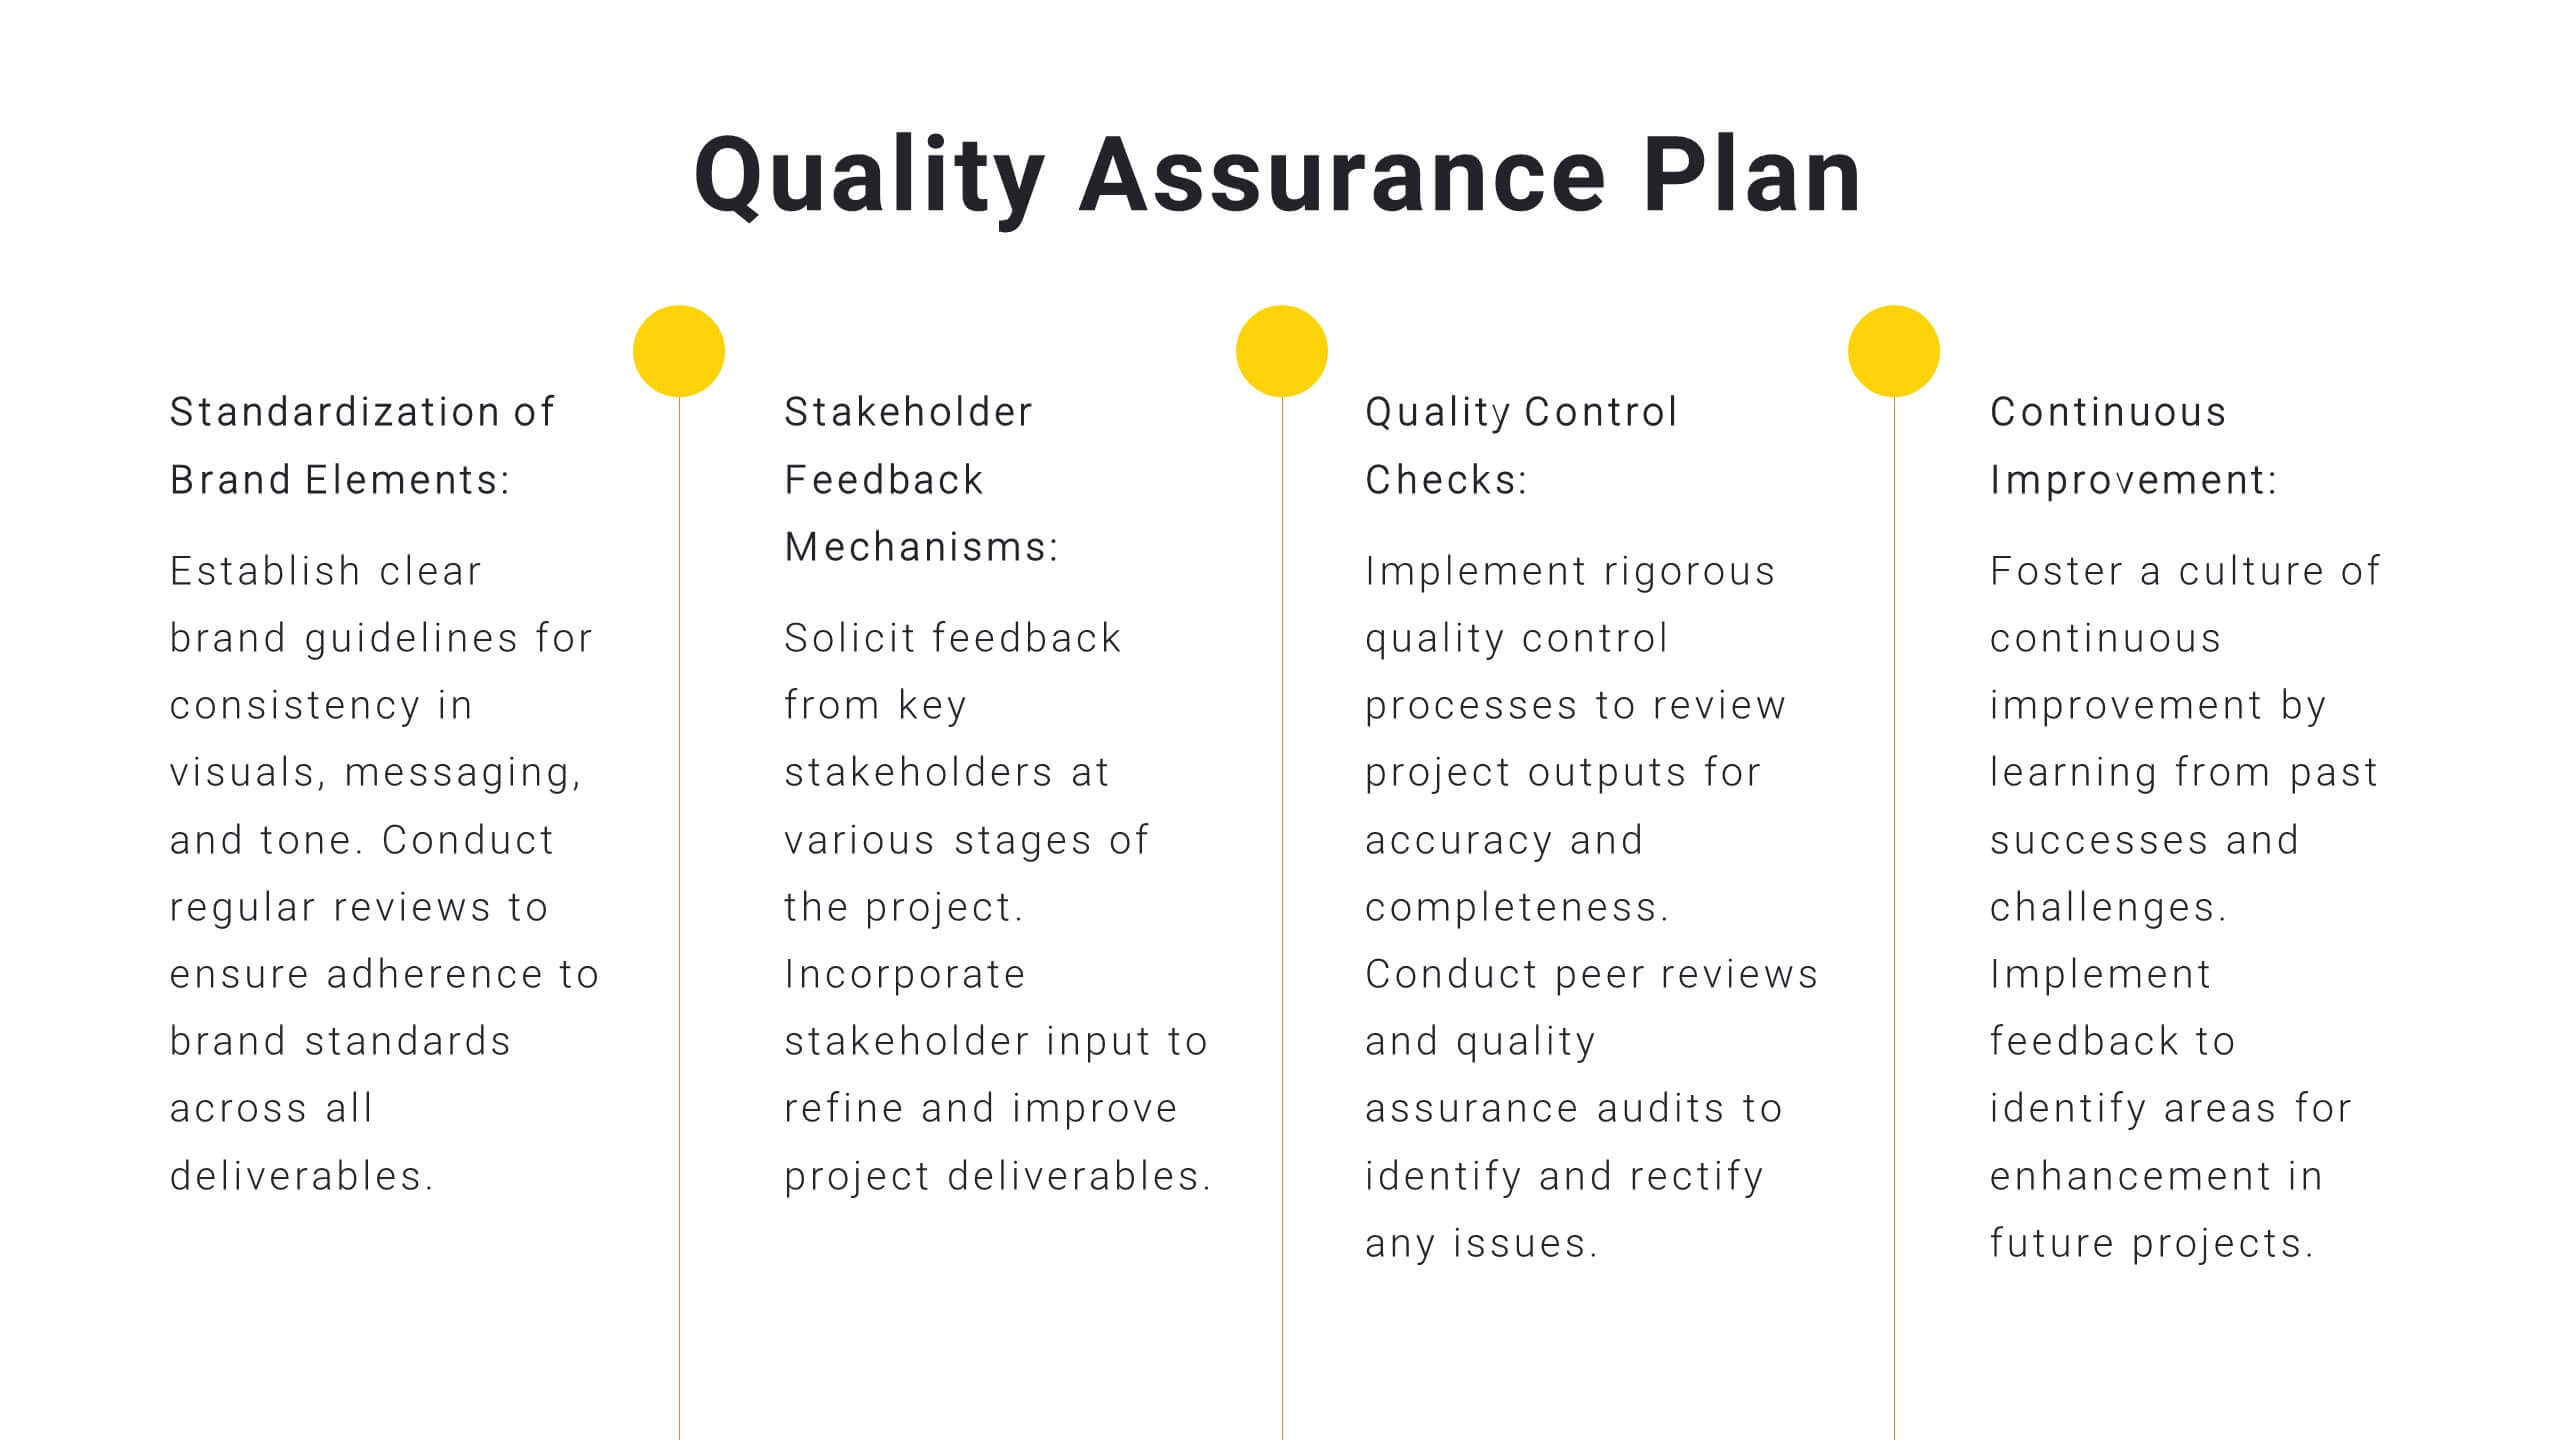
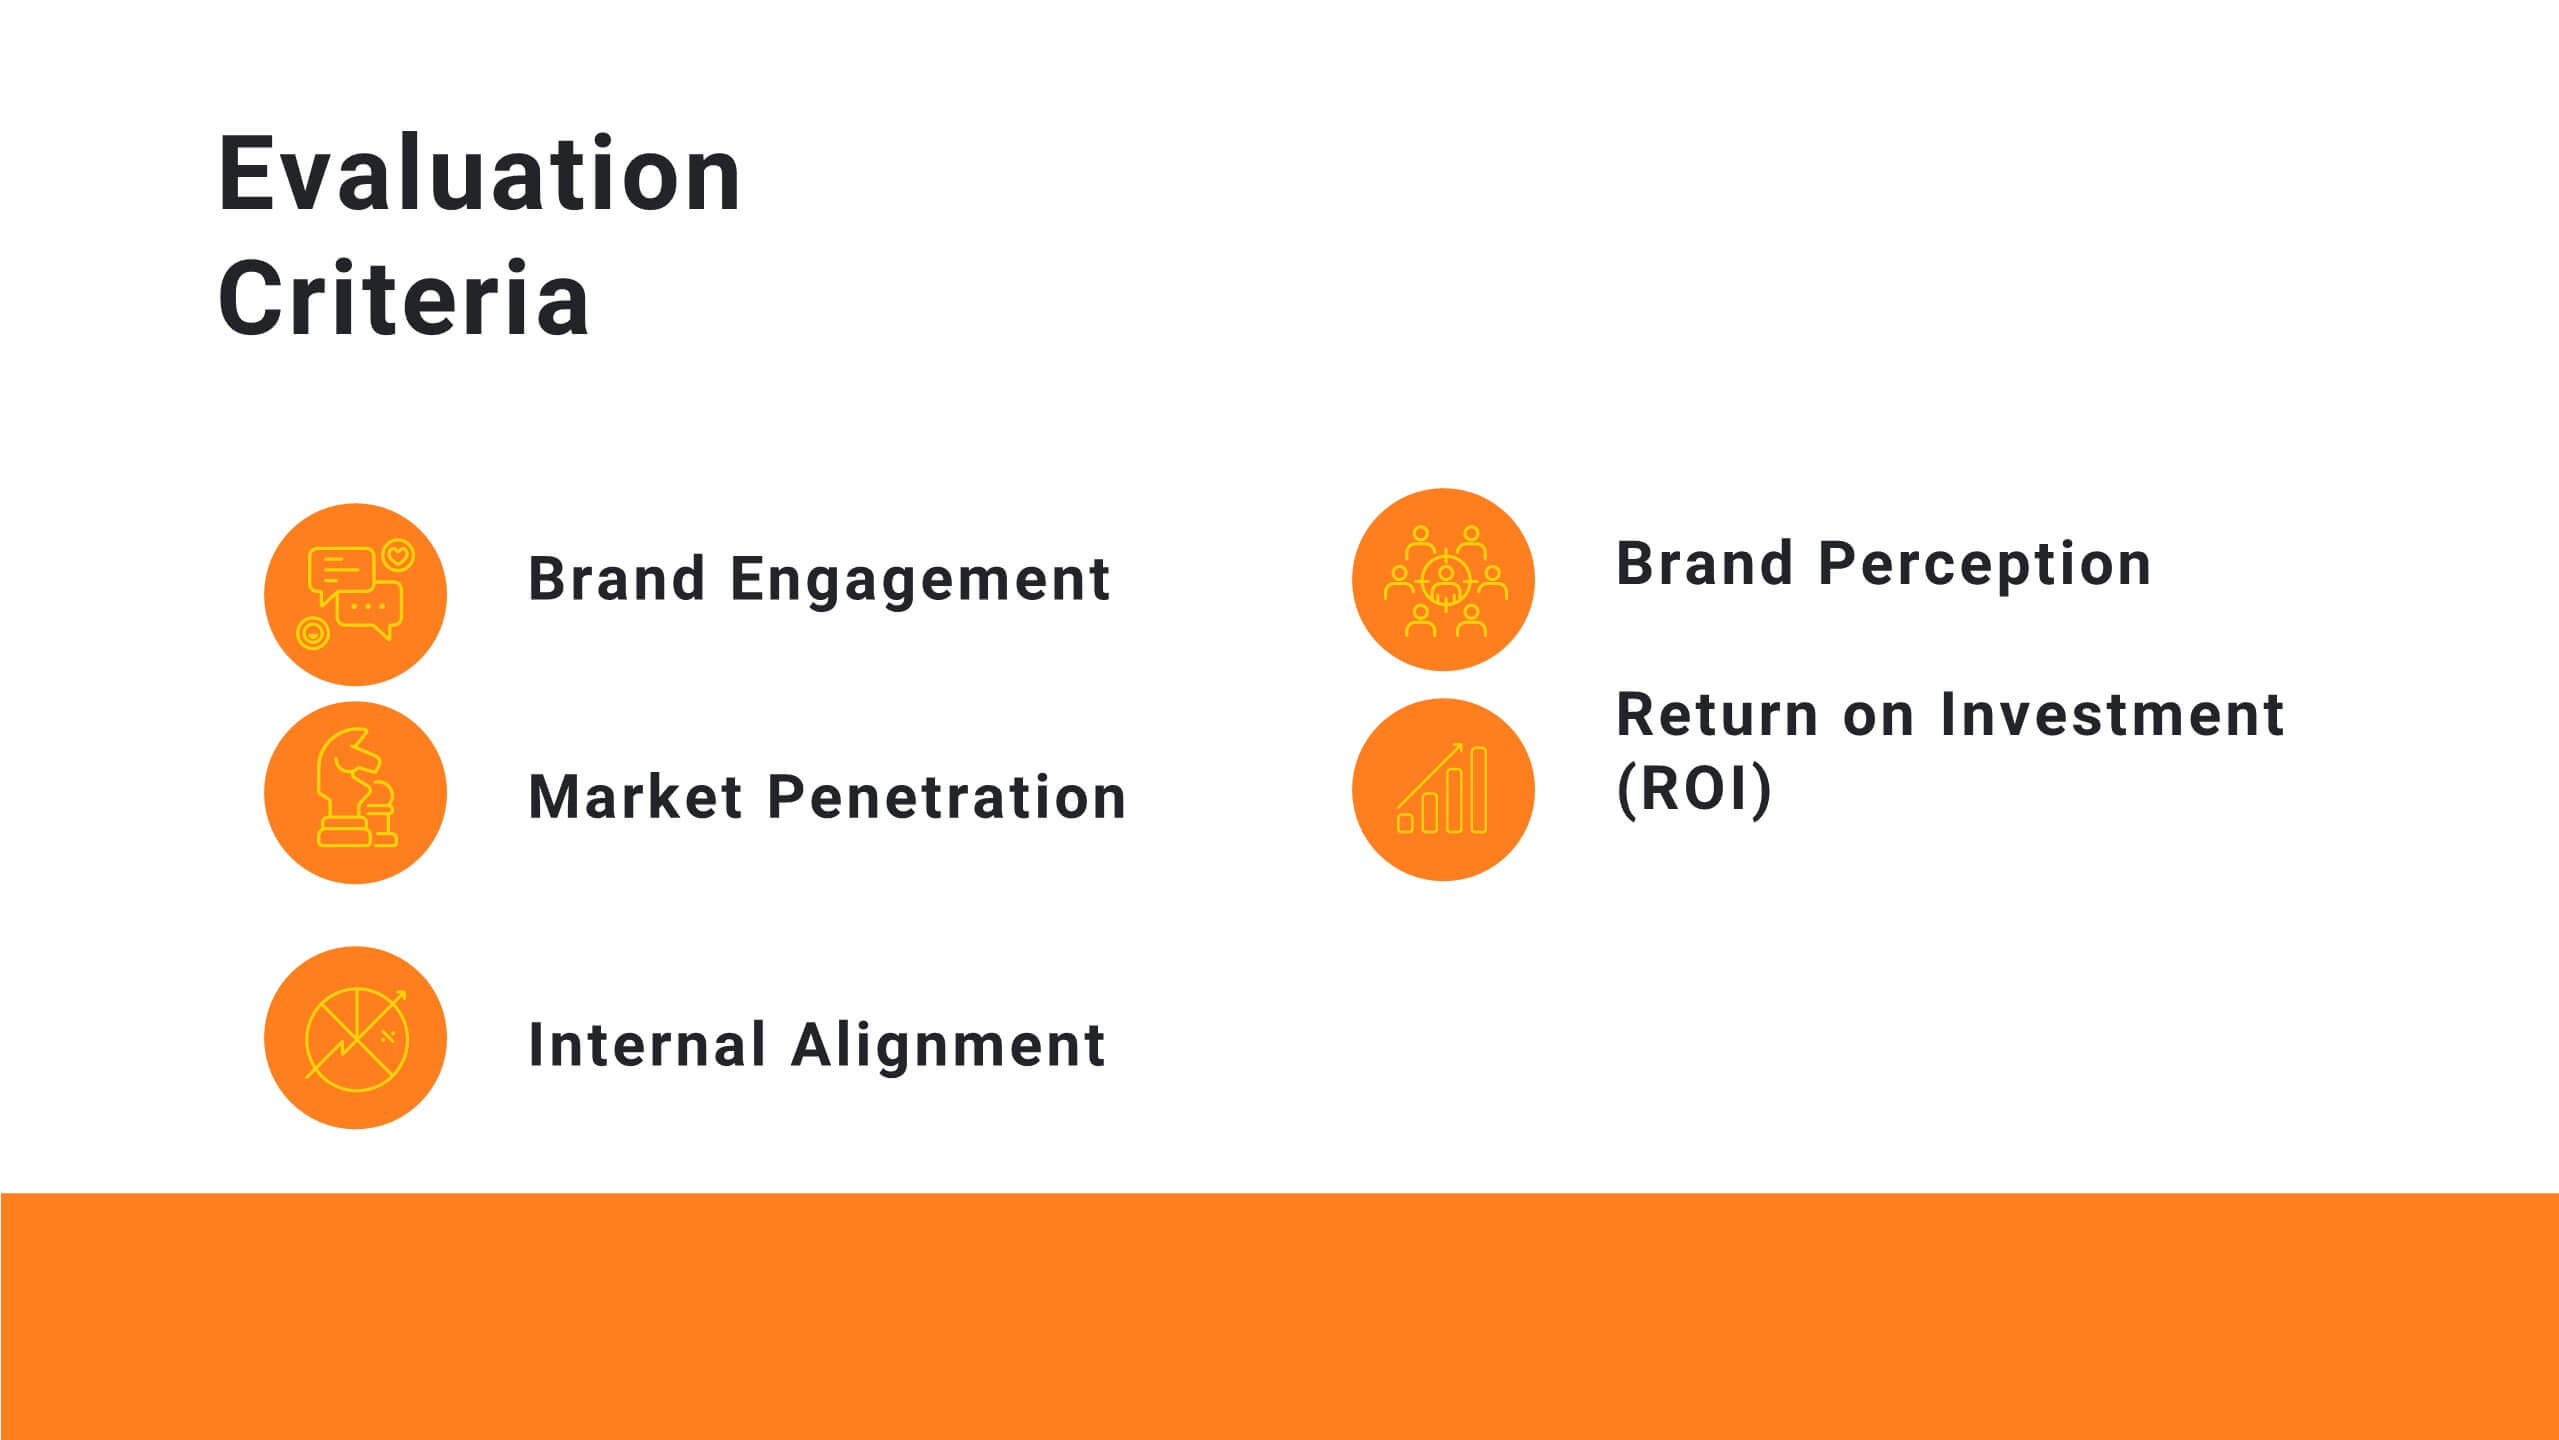
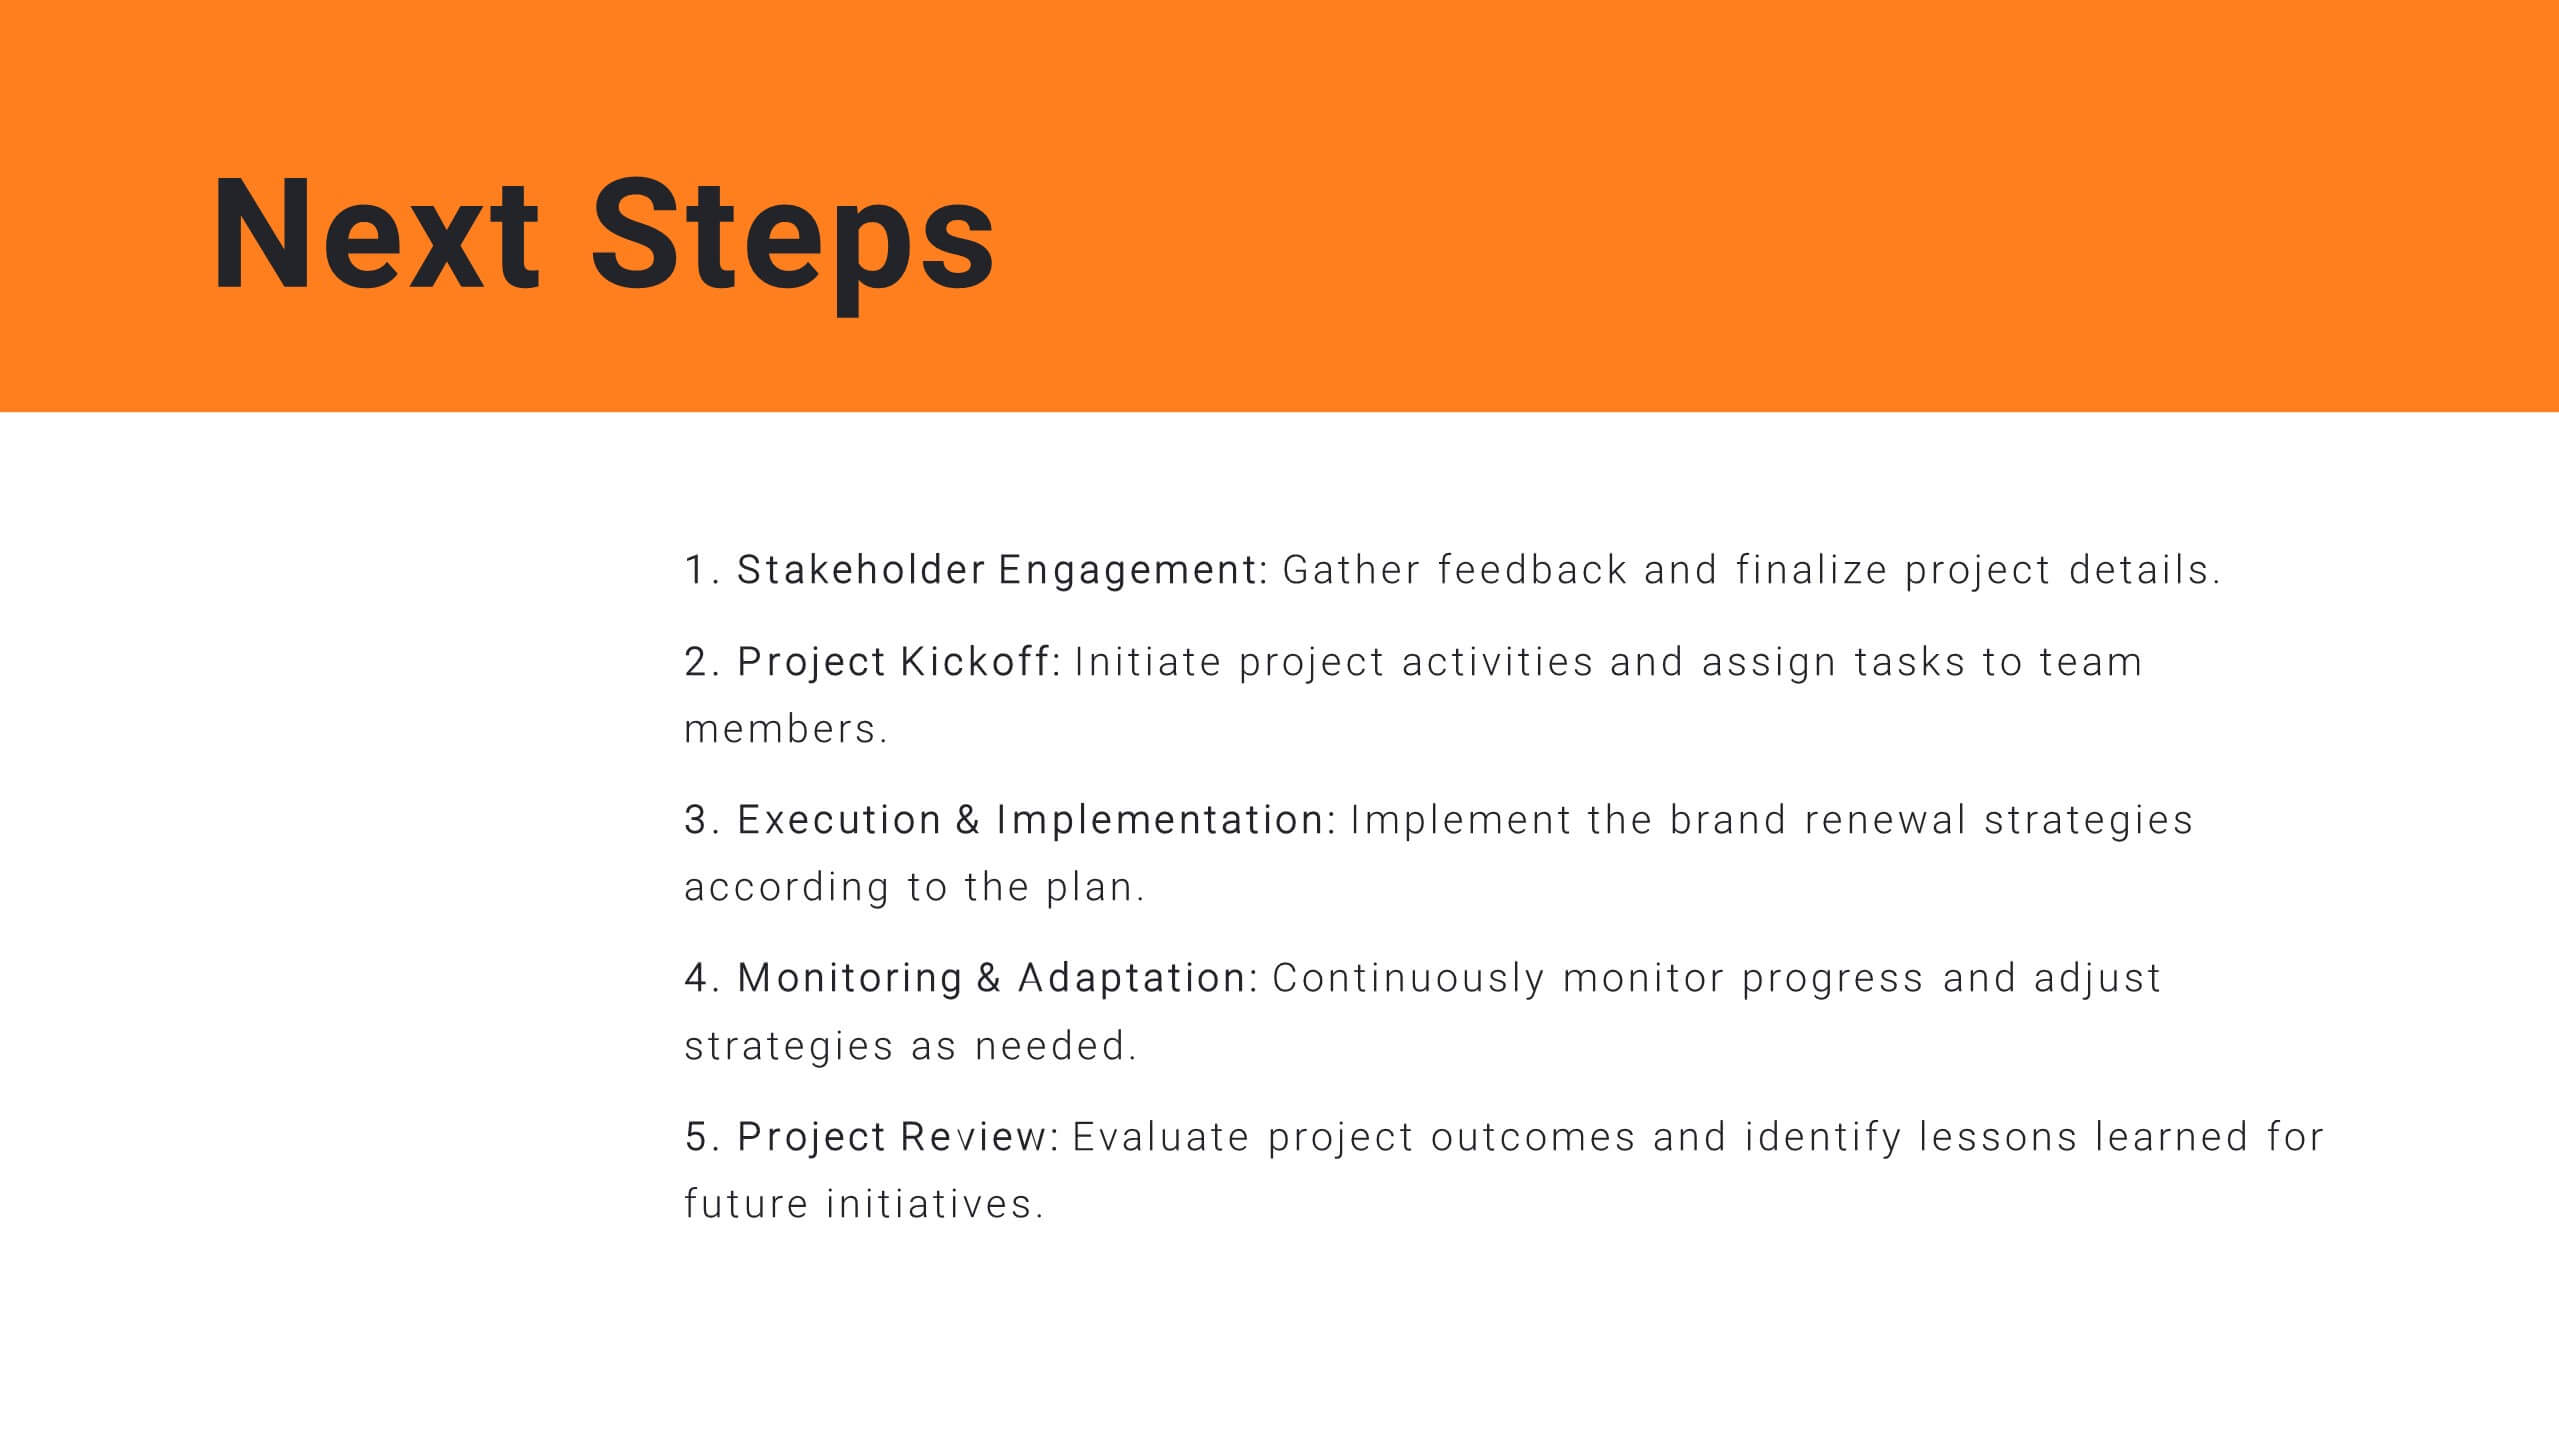
Harmony Project Management Plan Presentation
Plan your project efficiently with this comprehensive project management plan template! It covers all essential aspects including timeline, budget, resource allocation, and risk management. Ensure smooth project execution and achieve your objectives. Compatible with PowerPoint, Keynote, and Google Slides, it's designed to streamline your project planning and management process.