


Features
- 2 Unique slides
- Fully editable and easy to edit in Microsoft Powerpoint, Keynote and Google Slides
- 16:9 widescreen layout
- Clean and professional designs
- Export to JPG, PDF or send by email


Do you have any questions?
Recommend


7 slides
Modern Artificial Intelligence Infographic
Modern Artificial Intelligence refers to the contemporary state of AI technology, methods, and applications that have evolved significantly in recent years, especially from the early 21st century onwards. This infographic template is designed to present complex information in a clear and engaging manner. This template uses visuals like charts, graphs, icons, and text to enhance understanding. The objective of this infographic is to provide a visual and informative snapshot of the contemporary landscape of artificial intelligence, making complex concepts accessible to a broad audience.


10 slides
Workforce Learning & Training Module Presentation
Visualize your team’s learning journey with the Workforce Learning & Training Module Presentation. This hexagonal layout clearly maps training pillars or module stages, helping you present development plans in a structured, engaging way. Ideal for HR professionals, corporate trainers, and consultants. Fully editable in PowerPoint, Keynote, Google Slides, and Canva.


22 slides
Stormlight Qualitative Research Findings Presentation
This Qualitative Research Presentation Template is a dynamic and structured solution designed to present in-depth research findings, methodologies, and analysis. It covers key sections such as data collection, results interpretation, implications, and recommendations to deliver a comprehensive research overview. Perfect for academic, business, or market research purposes, and fully compatible with PowerPoint, Keynote, and Google Slides for easy customization.


24 slides
Wanderra UX Design Presentation
Elevate your user experience strategy with this comprehensive presentation template. Covering key aspects such as personas, wireframes, usability guidelines, and design systems, this template helps you create engaging and intuitive experiences. Fully customizable and compatible with PowerPoint, Keynote, and Google Slides.


22 slides
Meteor Academic Research Report Presentation
Get ready to make your research presentation stand out with the Meteor Academic Research Report template! This elegant and sophisticated design is perfect for showcasing your research findings with clarity and impact. The template features a refined color scheme of earthy browns and soft greens, giving your presentation a polished and professional look. Each slide is carefully crafted to highlight key aspects of your research, from objectives and methodology to data analysis and conclusions. With dedicated sections for literature review, key findings, and future research directions, this template ensures that your audience can follow your research journey from start to finish. The clean and structured layout makes it easy to present complex information in a way that is easy to understand. Fully compatible with PowerPoint, Keynote, and Google Slides, the Meteor template is the ideal choice for delivering compelling and visually appealing academic presentations.


4 slides
Team Collaboration Strategy
Illustrate cross-functional teamwork with this visually engaging slide. Featuring color-coded team clusters, it's perfect for showcasing group dynamics, collaborative workflows, or project responsibilities. Use this diagram to break down organizational units, collaboration models, or department contributions. Fully editable in PowerPoint, Keynote, and Google Slides.


21 slides
Alchemos UX Case Study Presentation
Showcase your UX process with clarity and impact using this sleek case study presentation. Covering key aspects like user research, interaction design, prototyping, and responsive design, this template helps you tell a compelling design story. Fully customizable and compatible with PowerPoint, Keynote, and Google Slides for a seamless presentation experience.


5 slides
Business Cycle and Wheel Diagram
Illustrate key stages, continuous workflows, or strategic frameworks with this circular business diagram. Ideal for visualizing four connected steps in a clean, modern style. Easily editable in PowerPoint, Keynote, and Google Slides for full customization.

23 slides
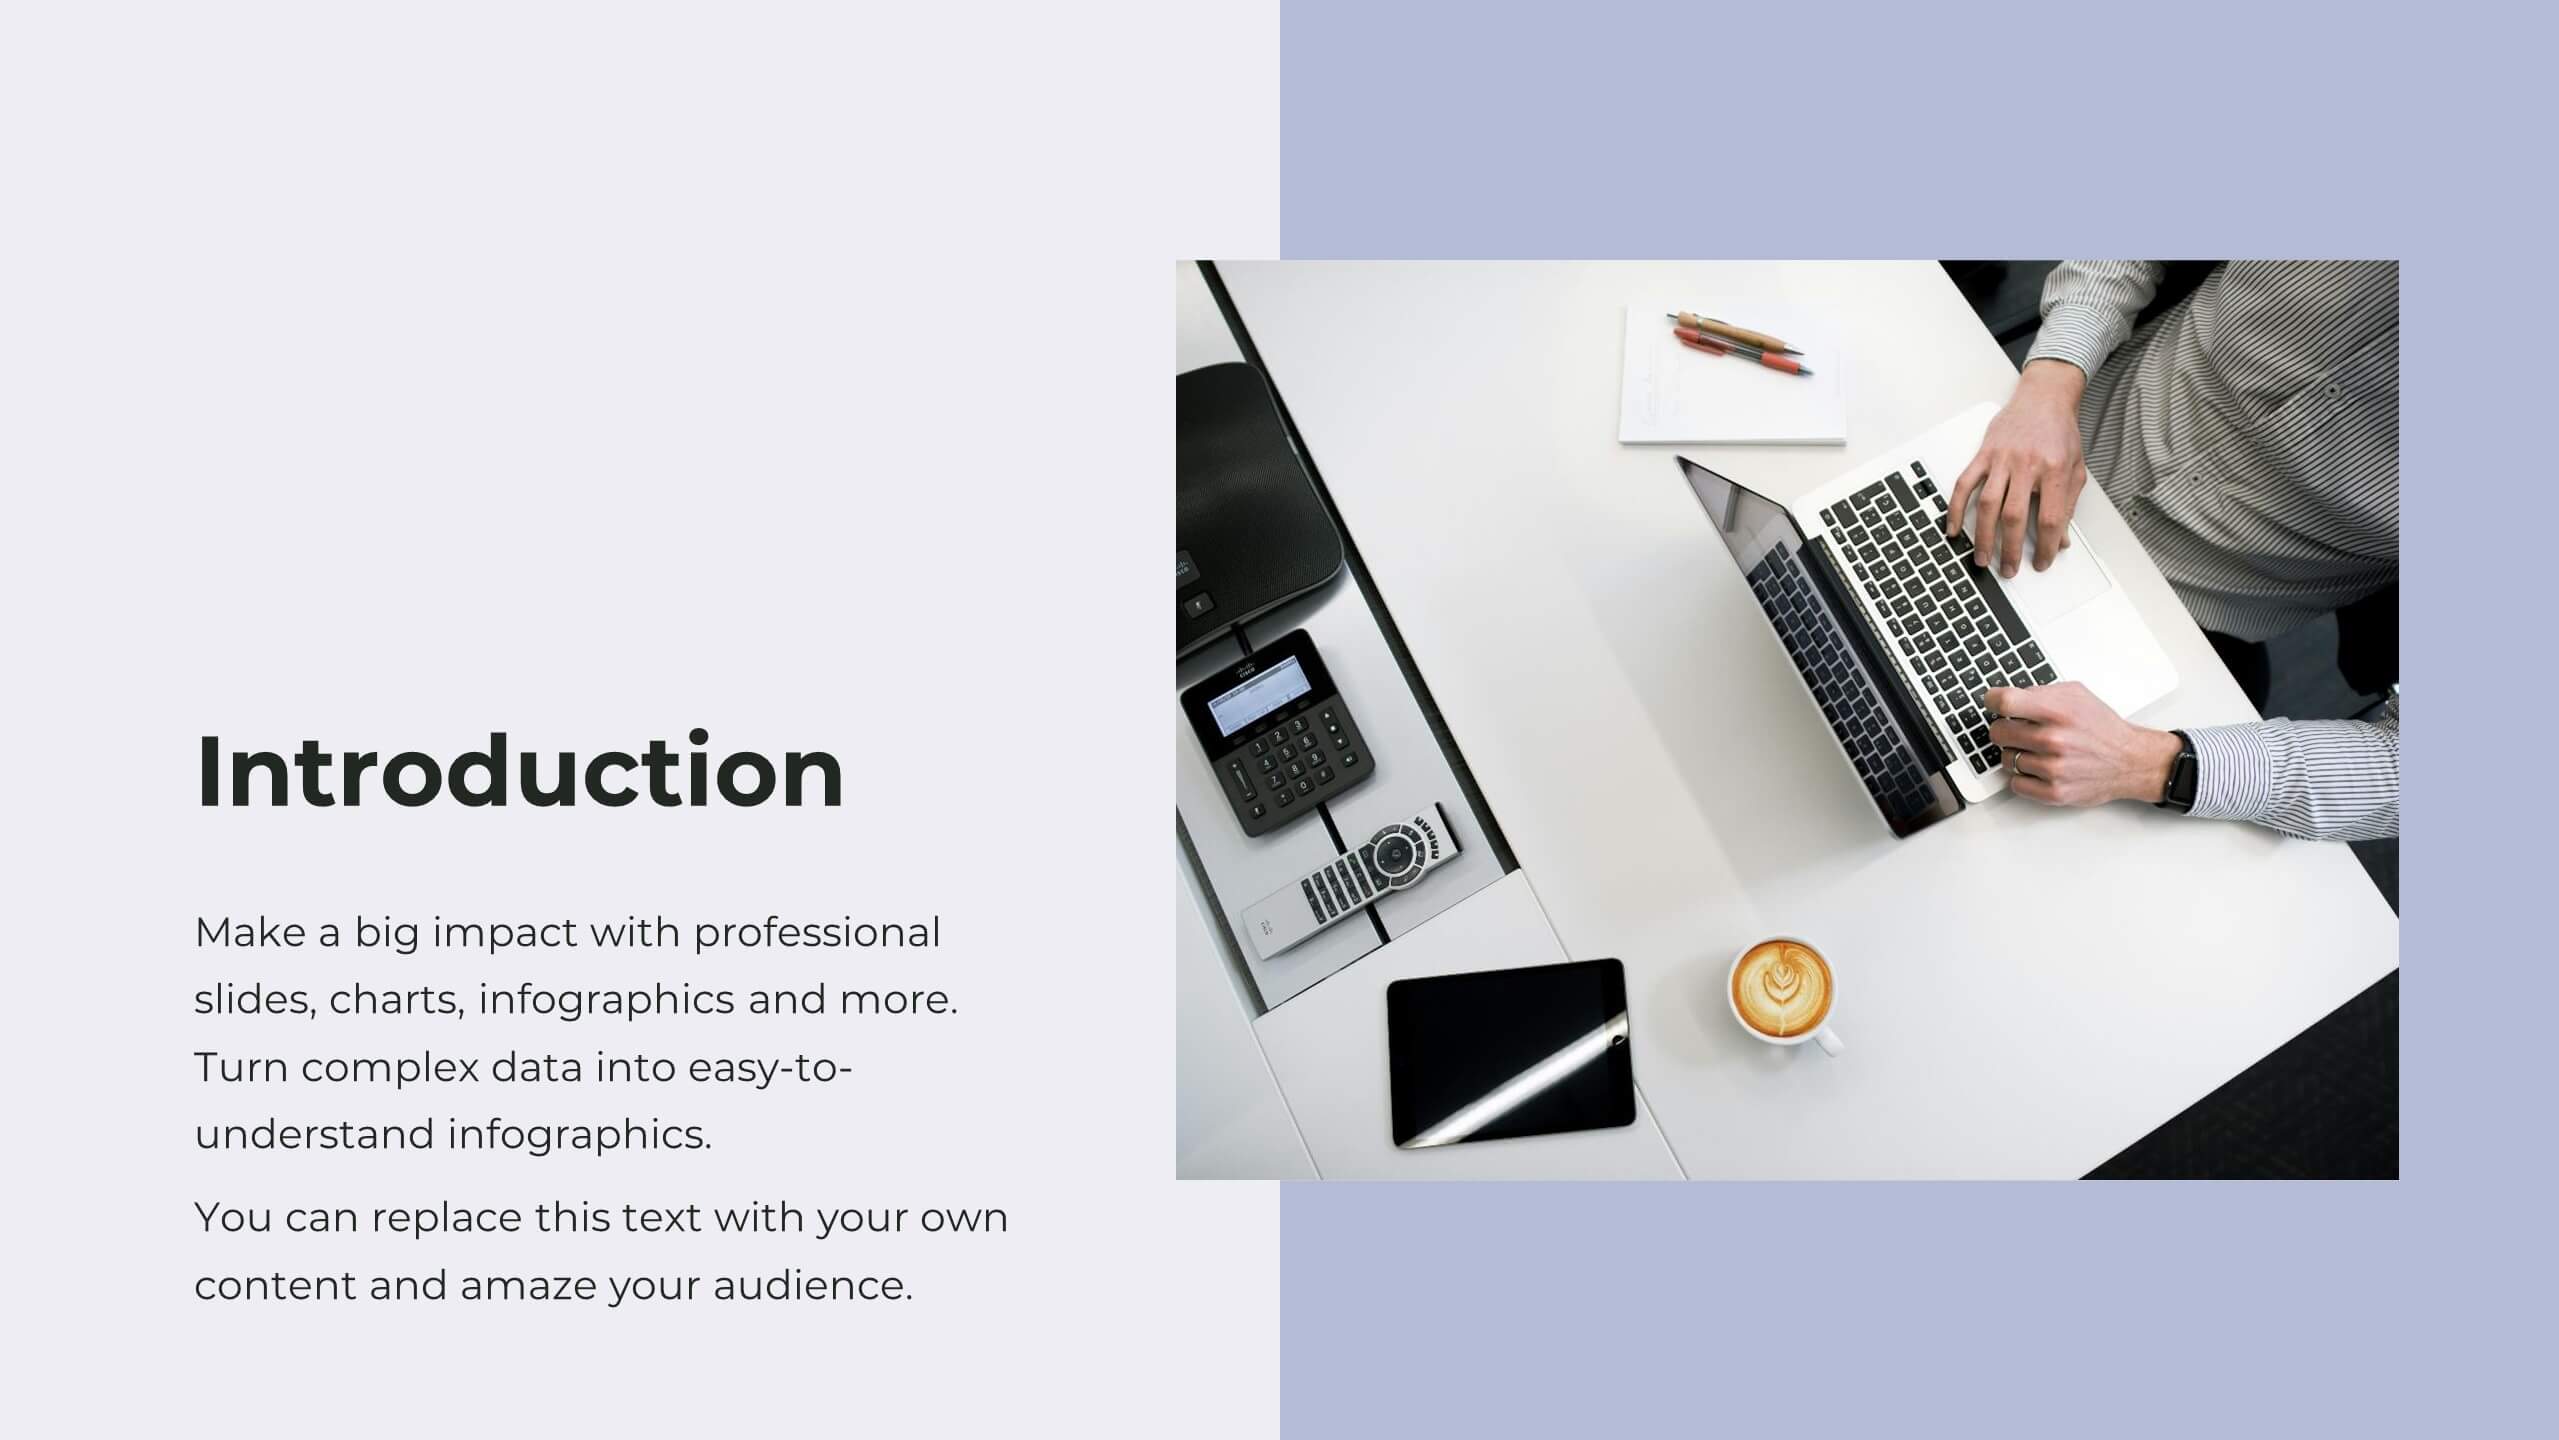
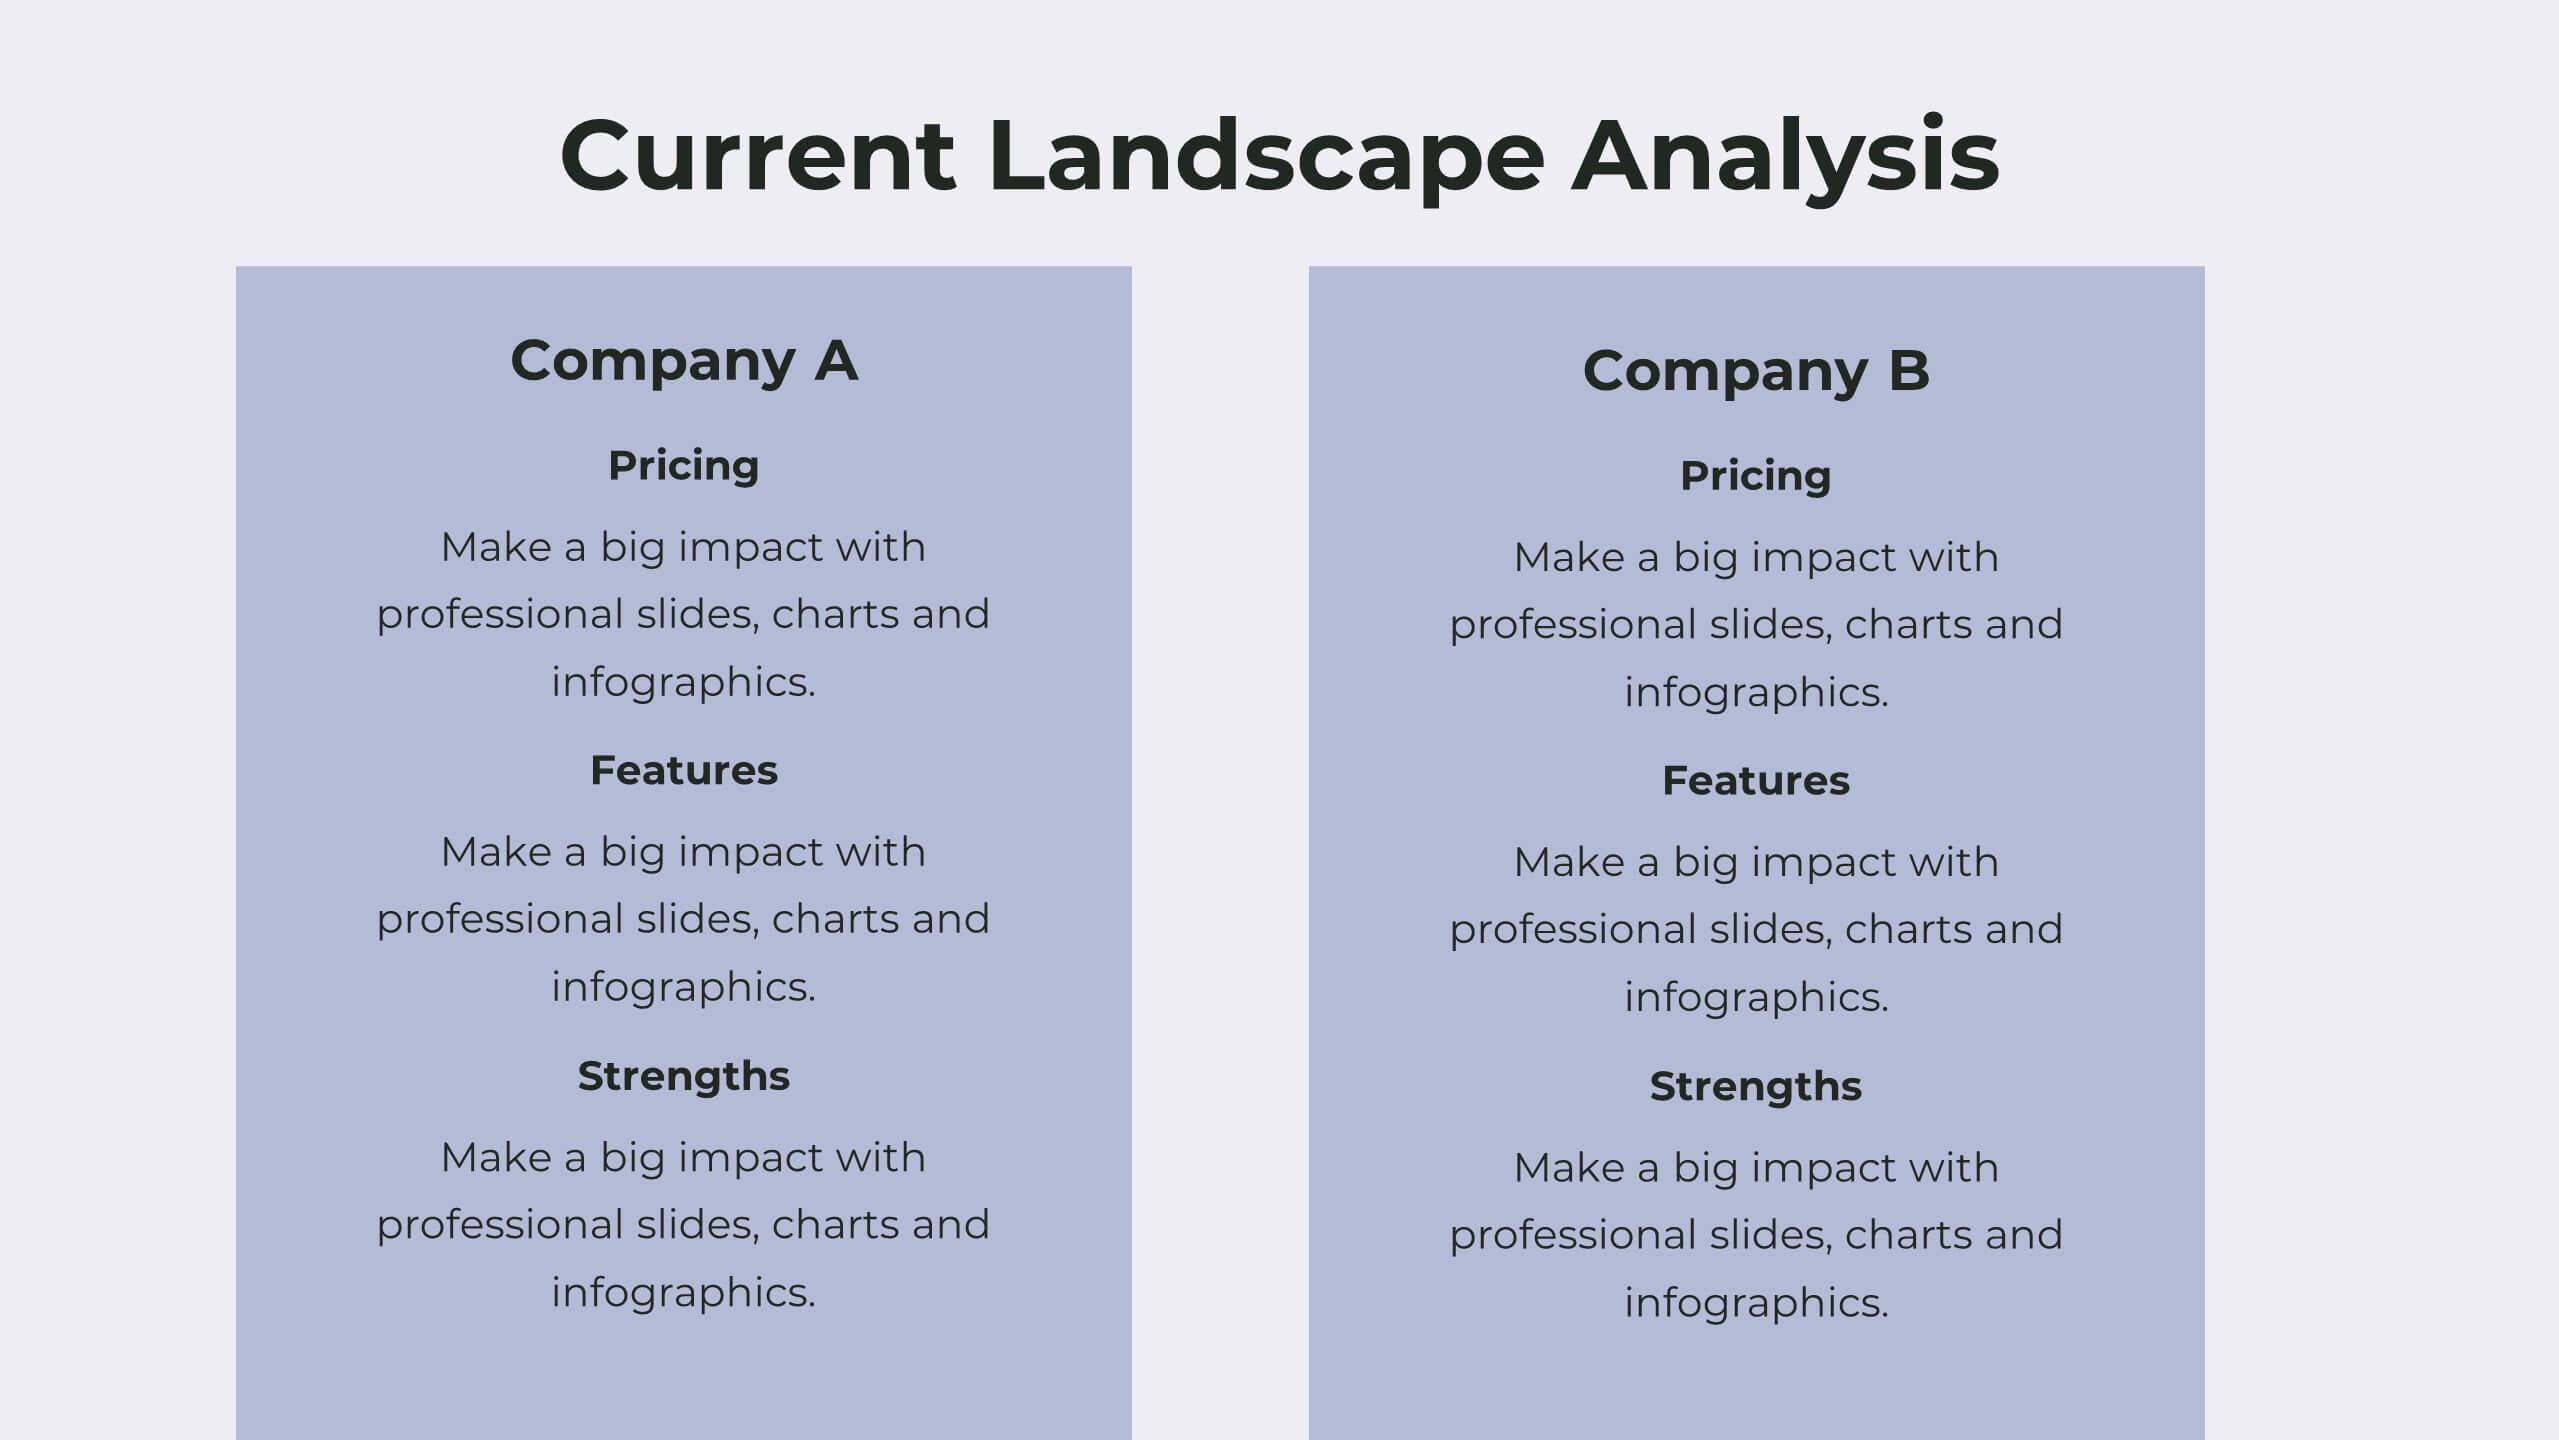
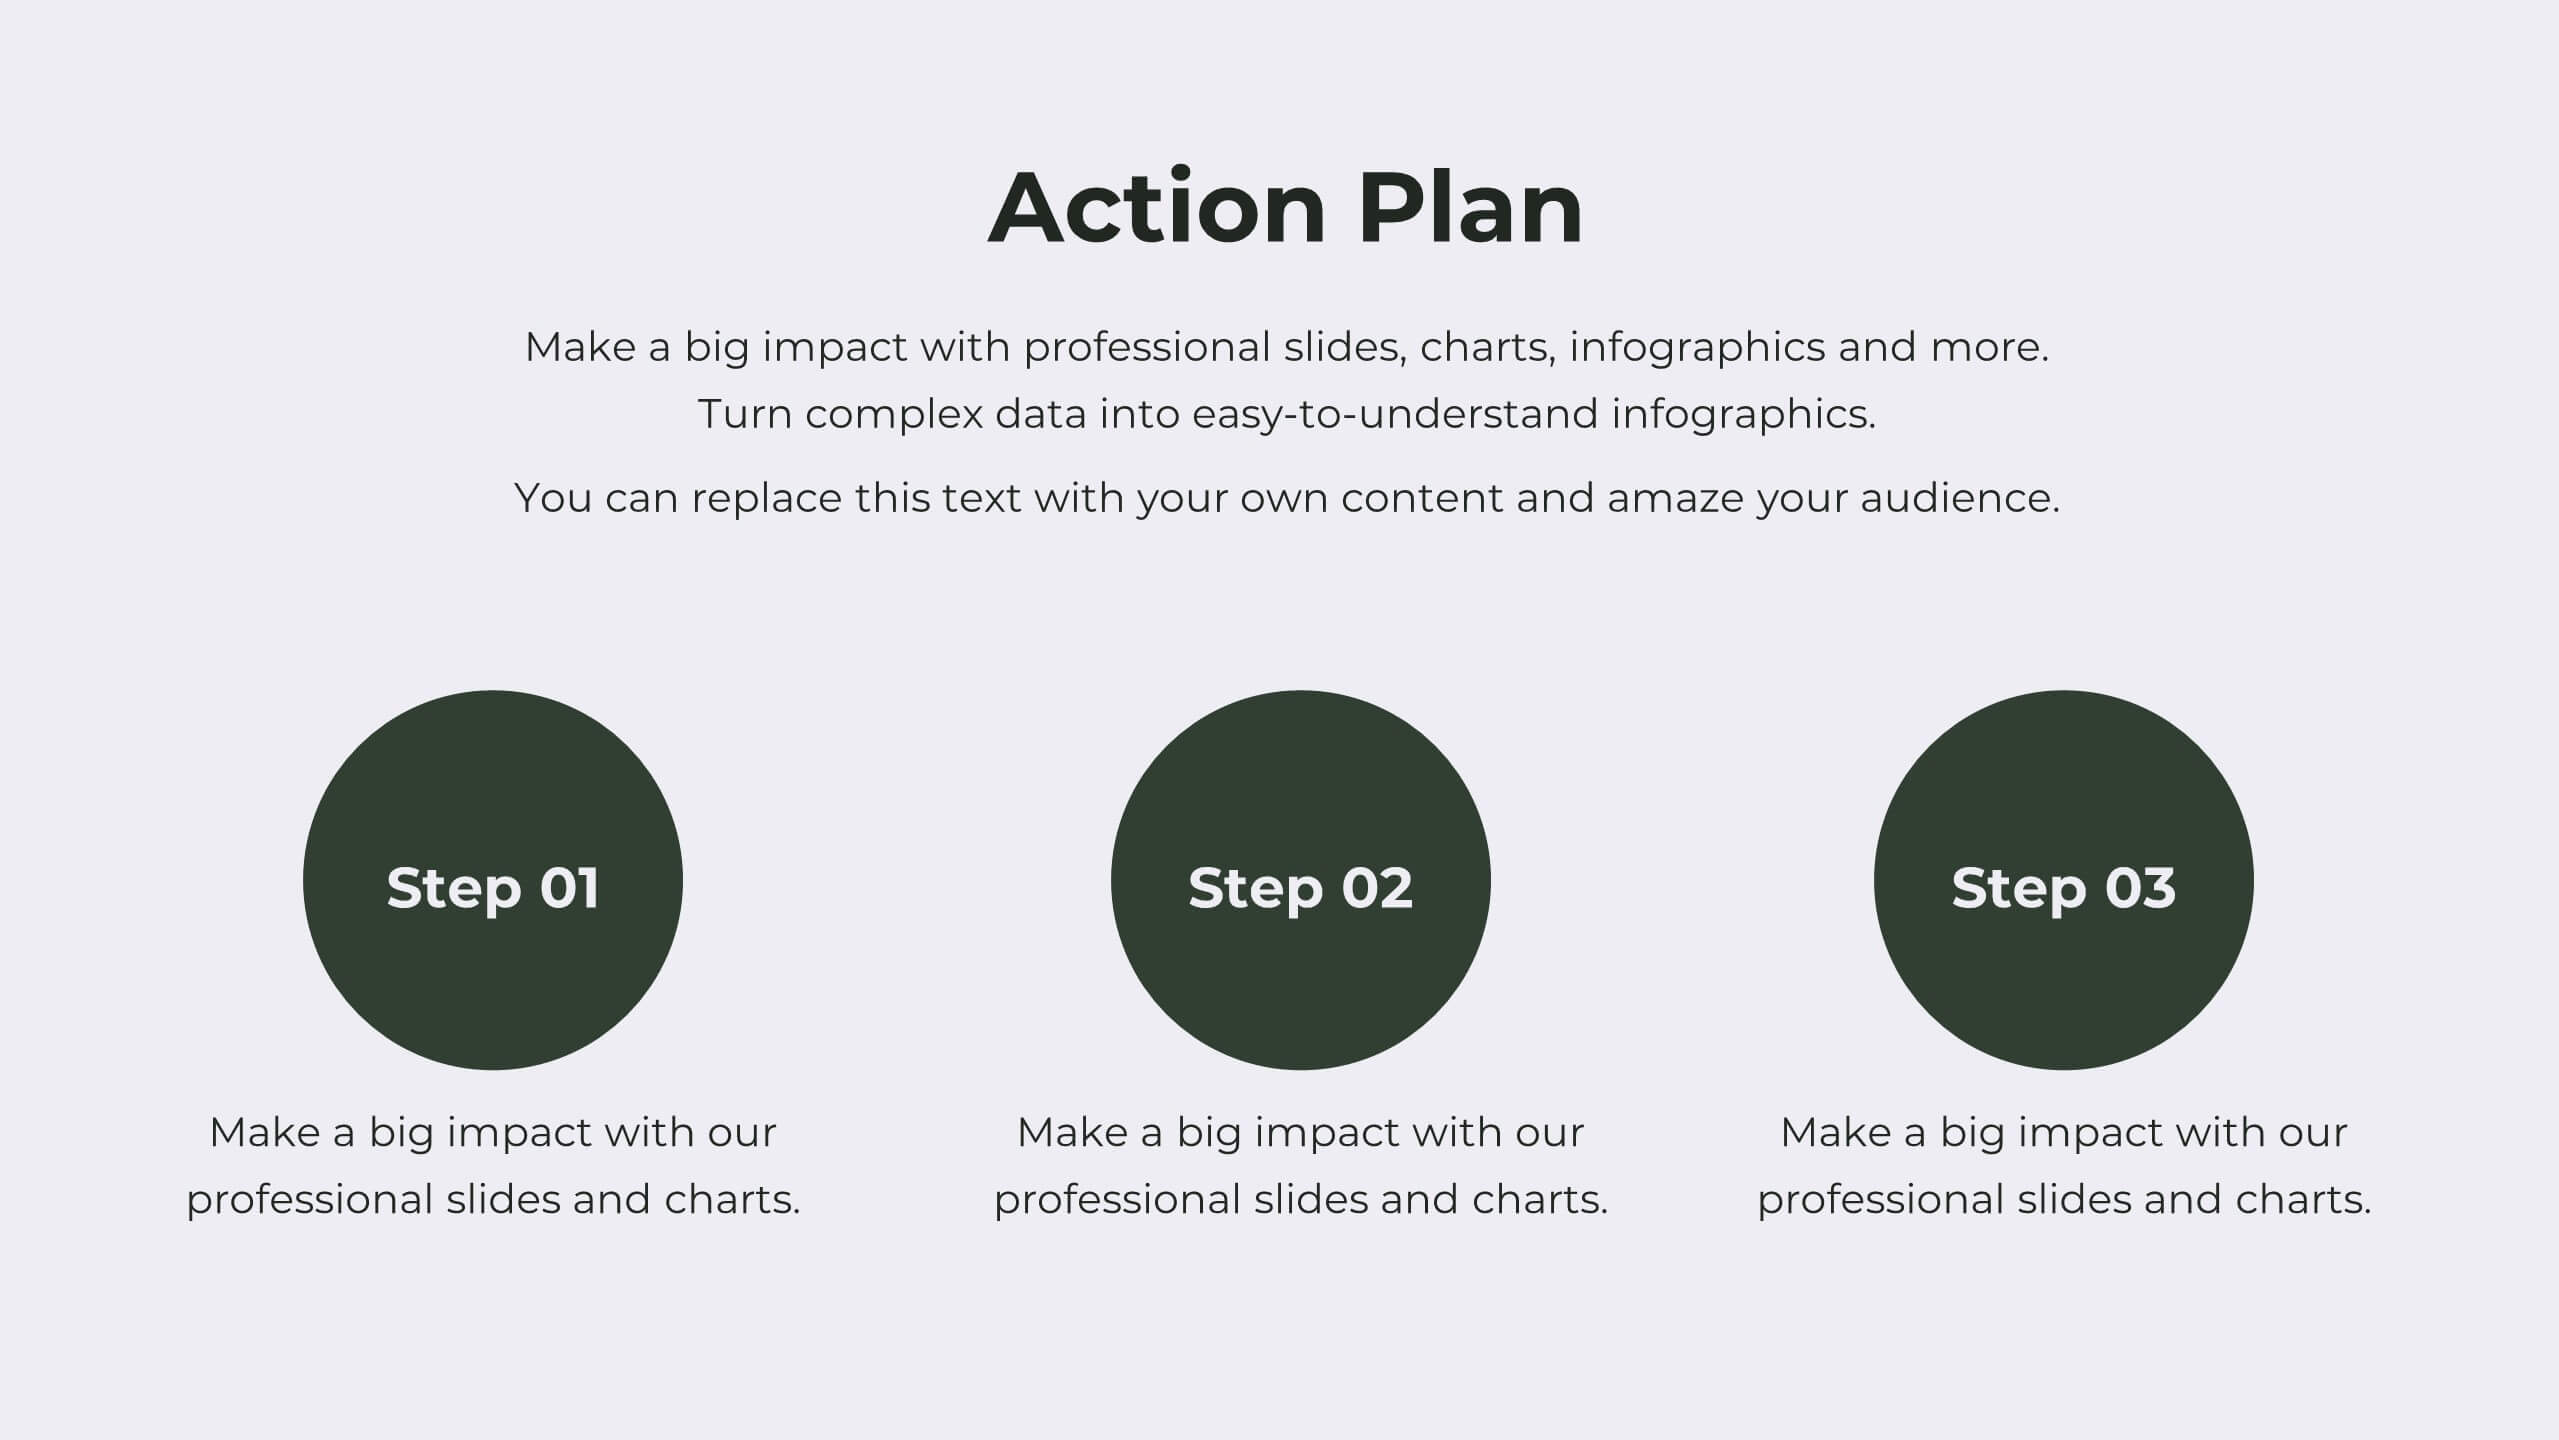
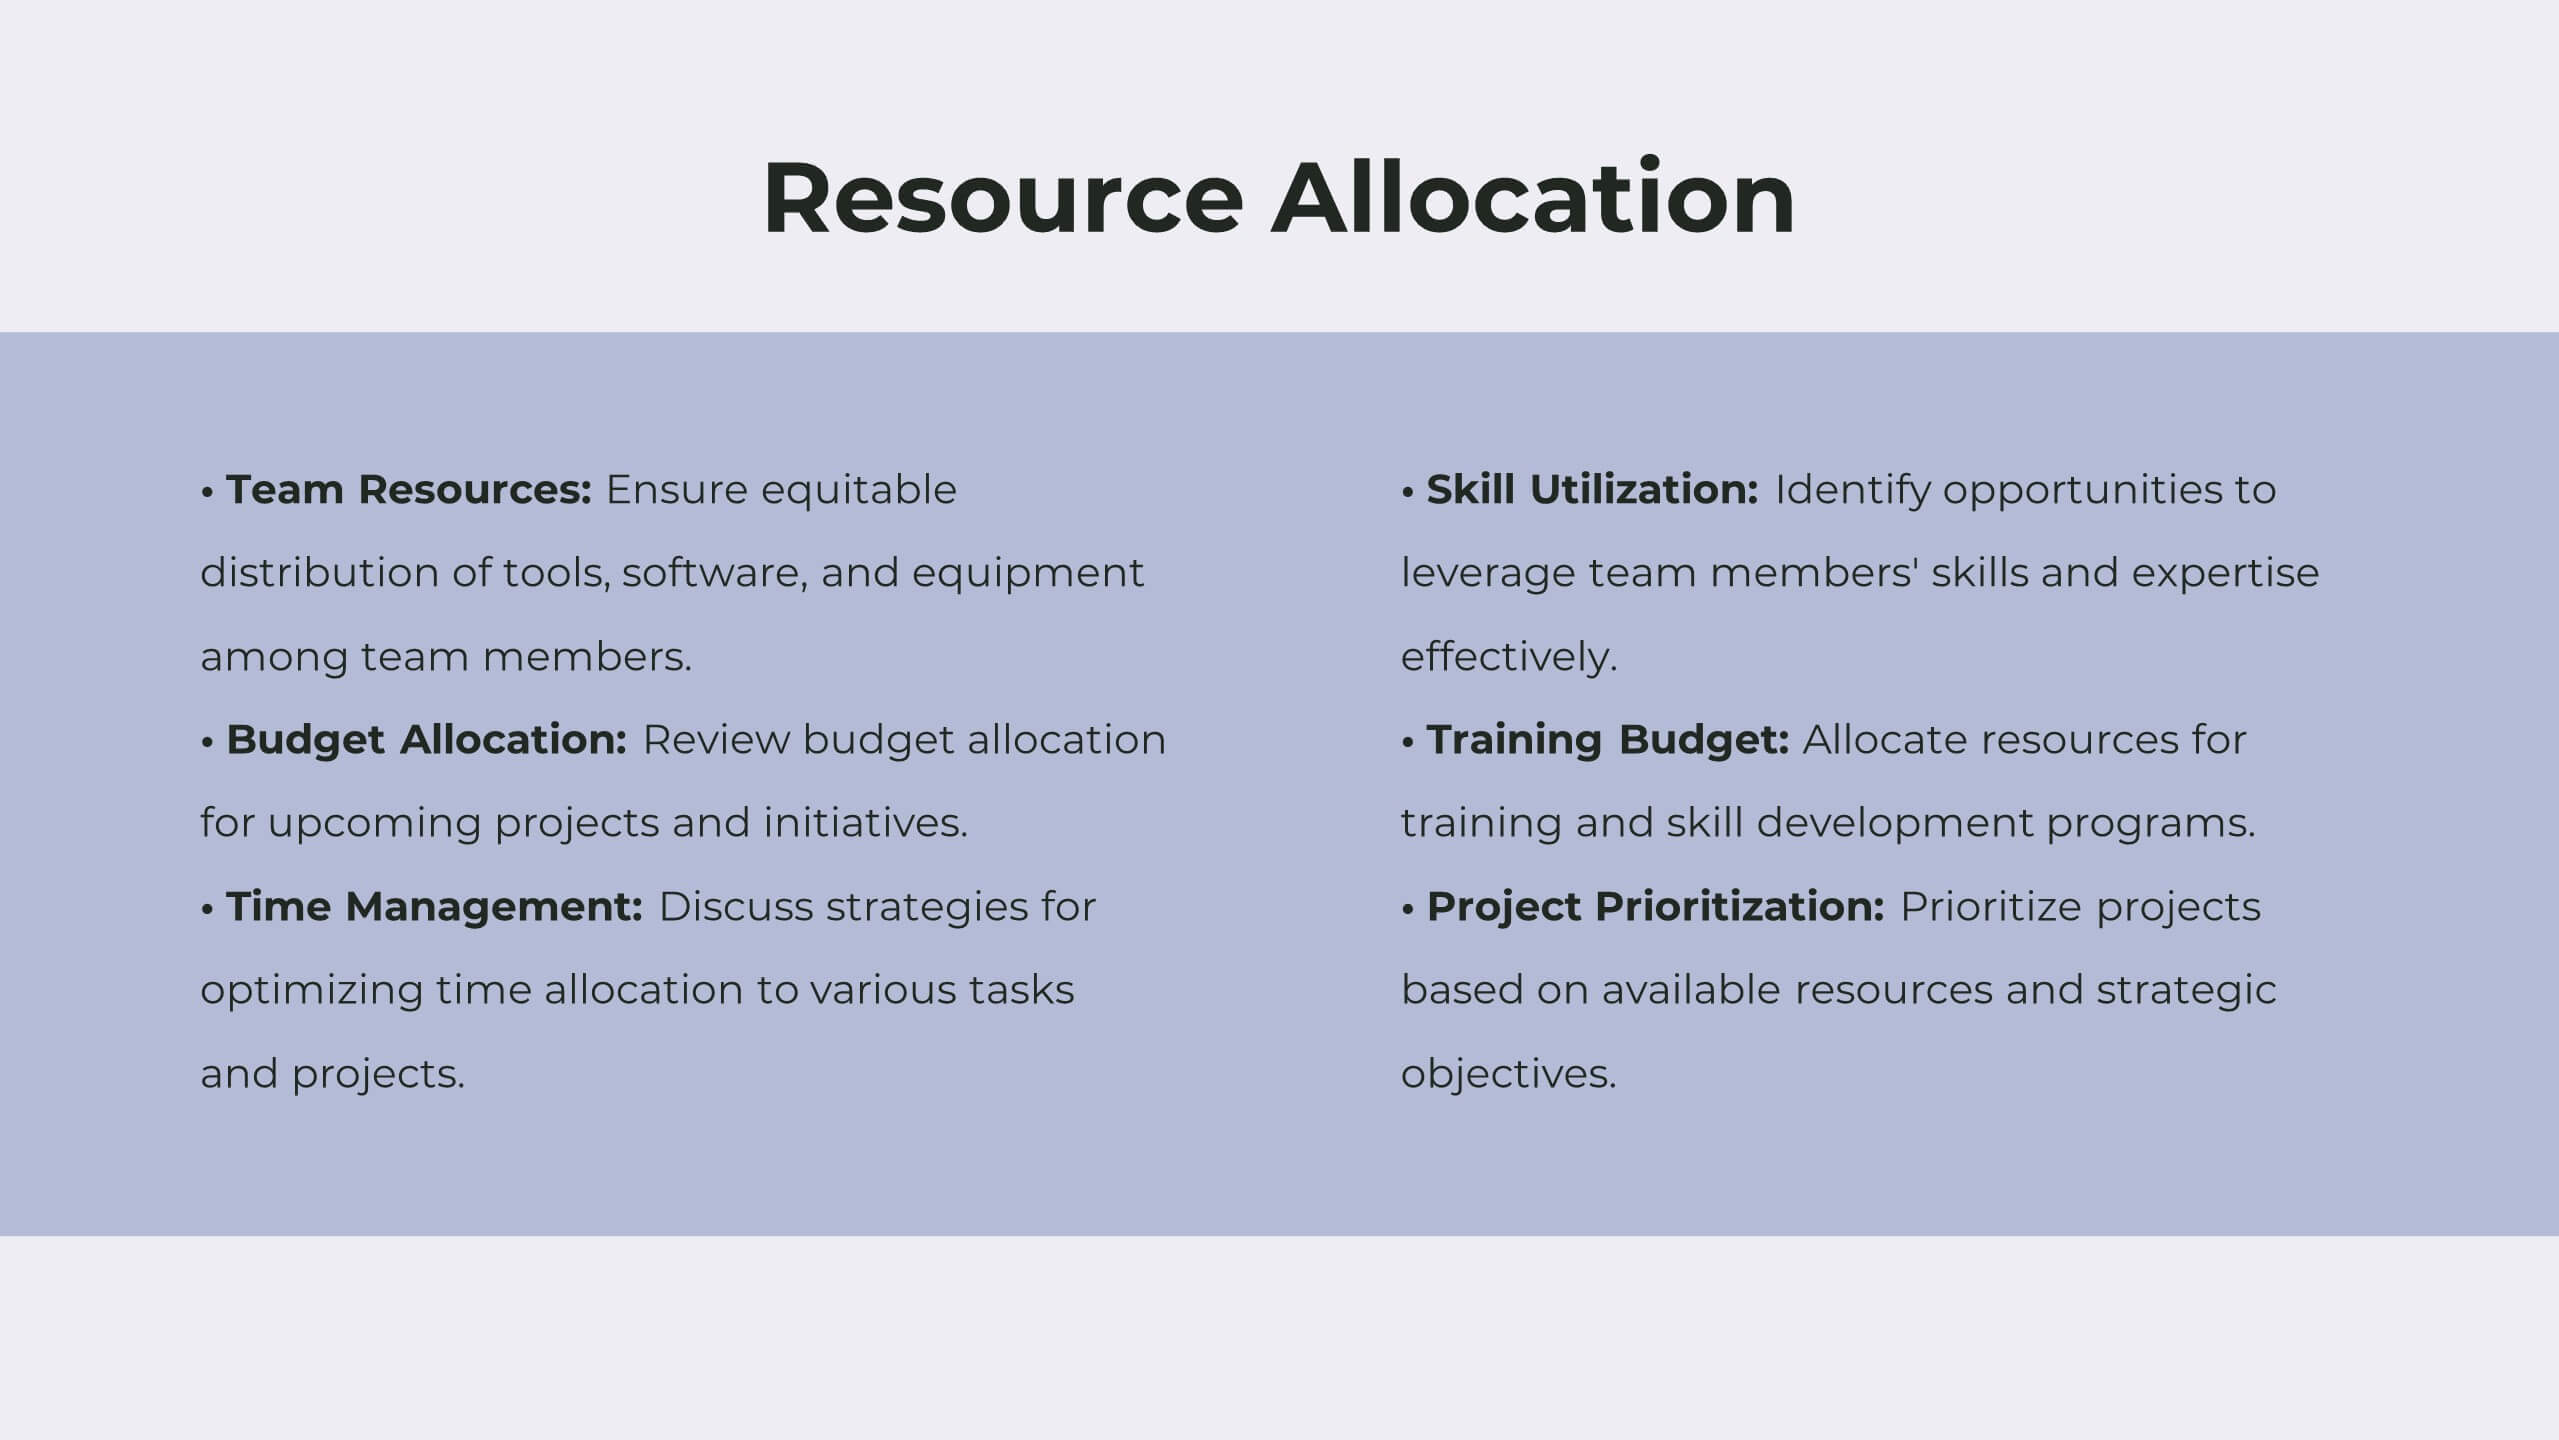
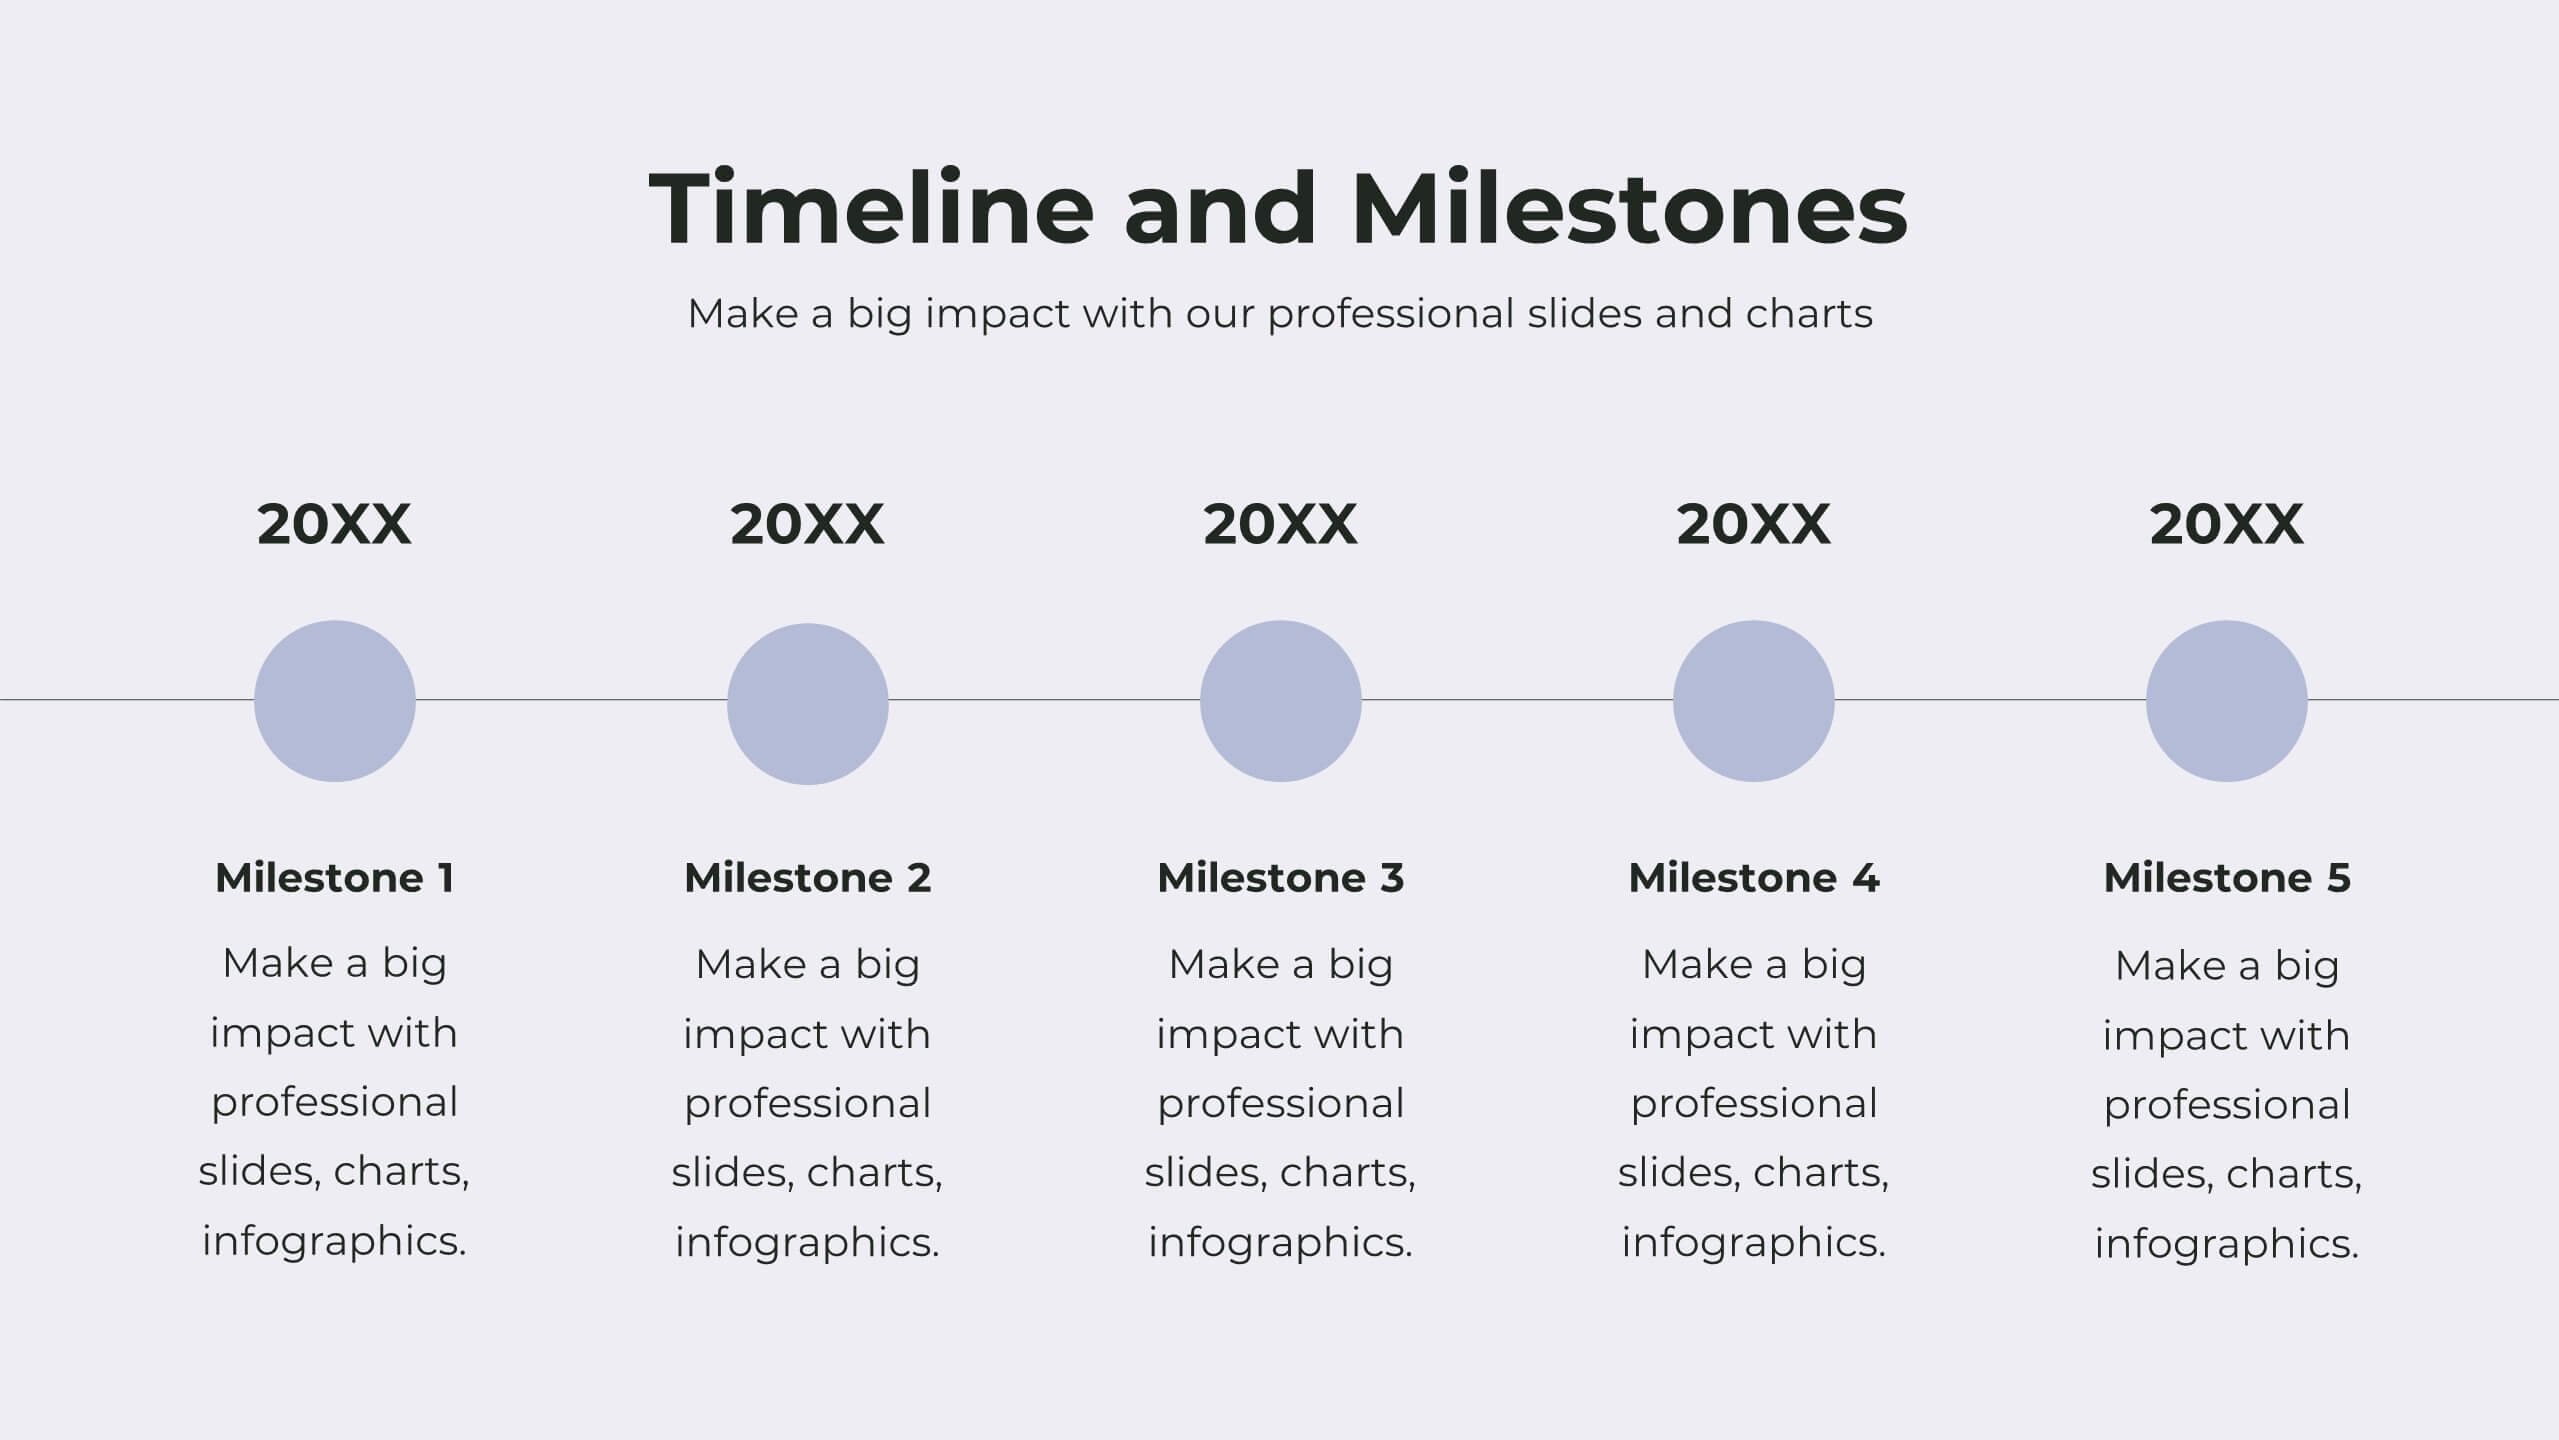
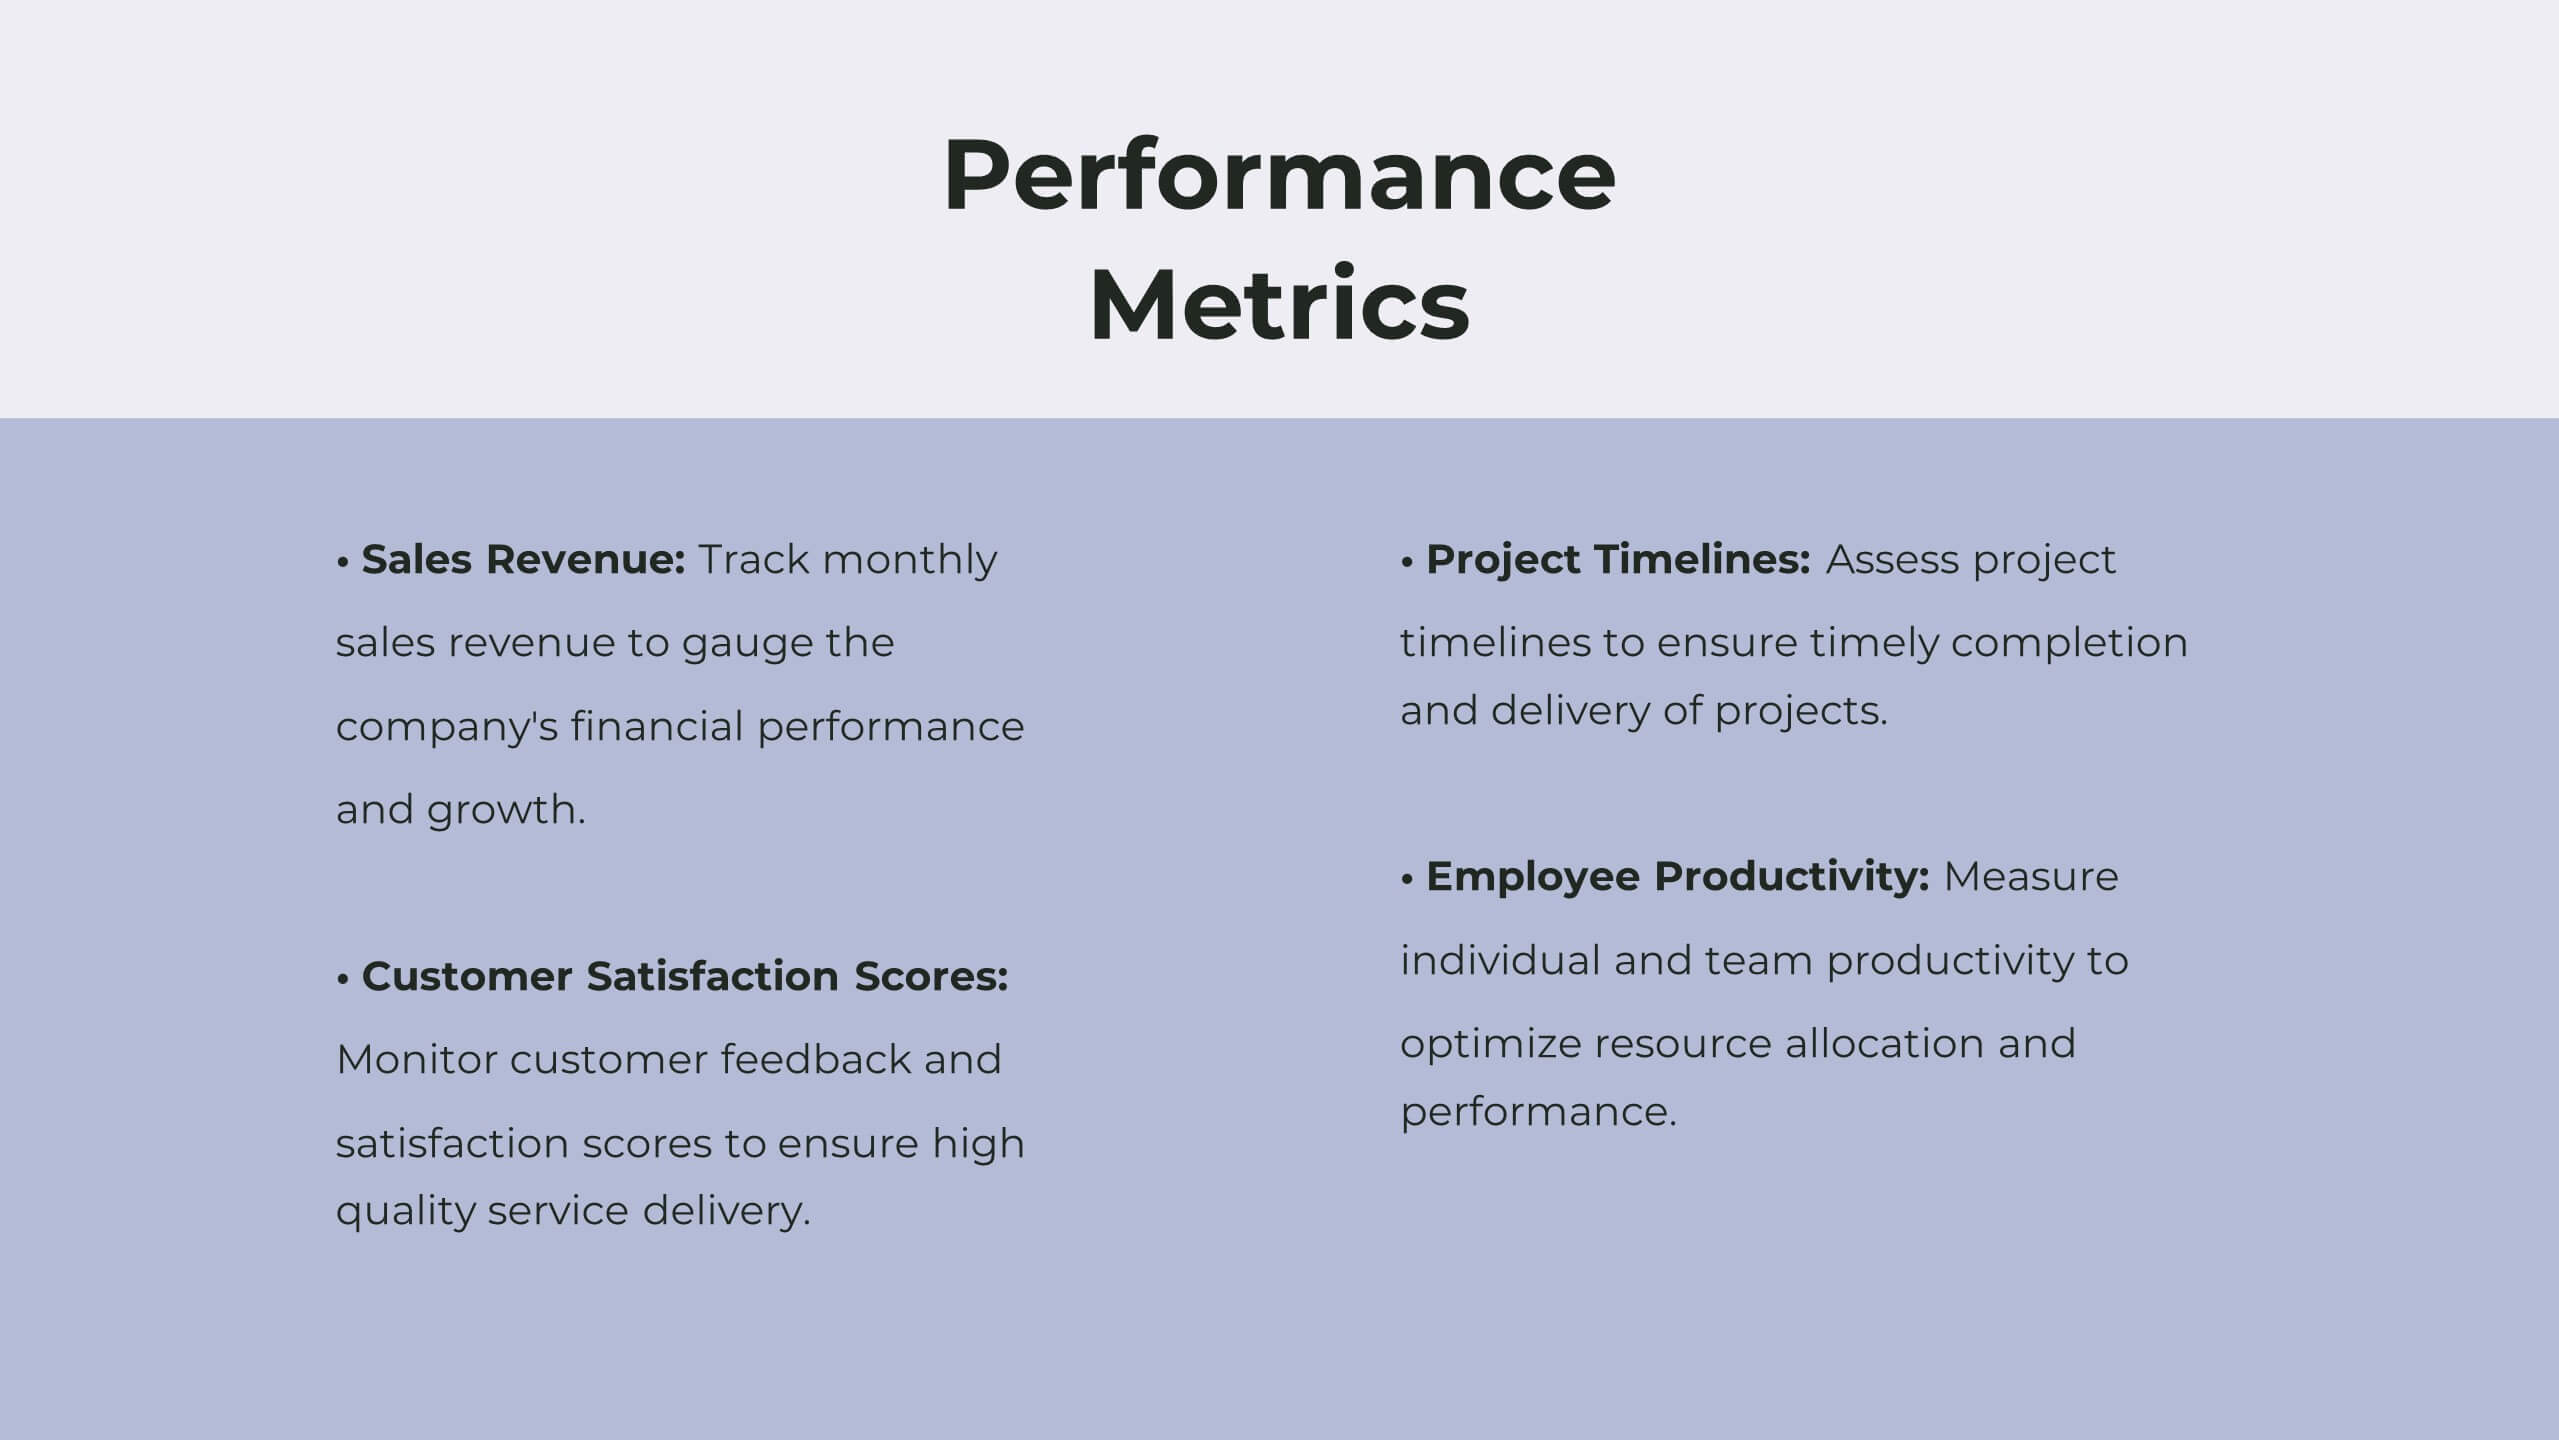
Tranquil Corporate Strategy Proposal Presentation
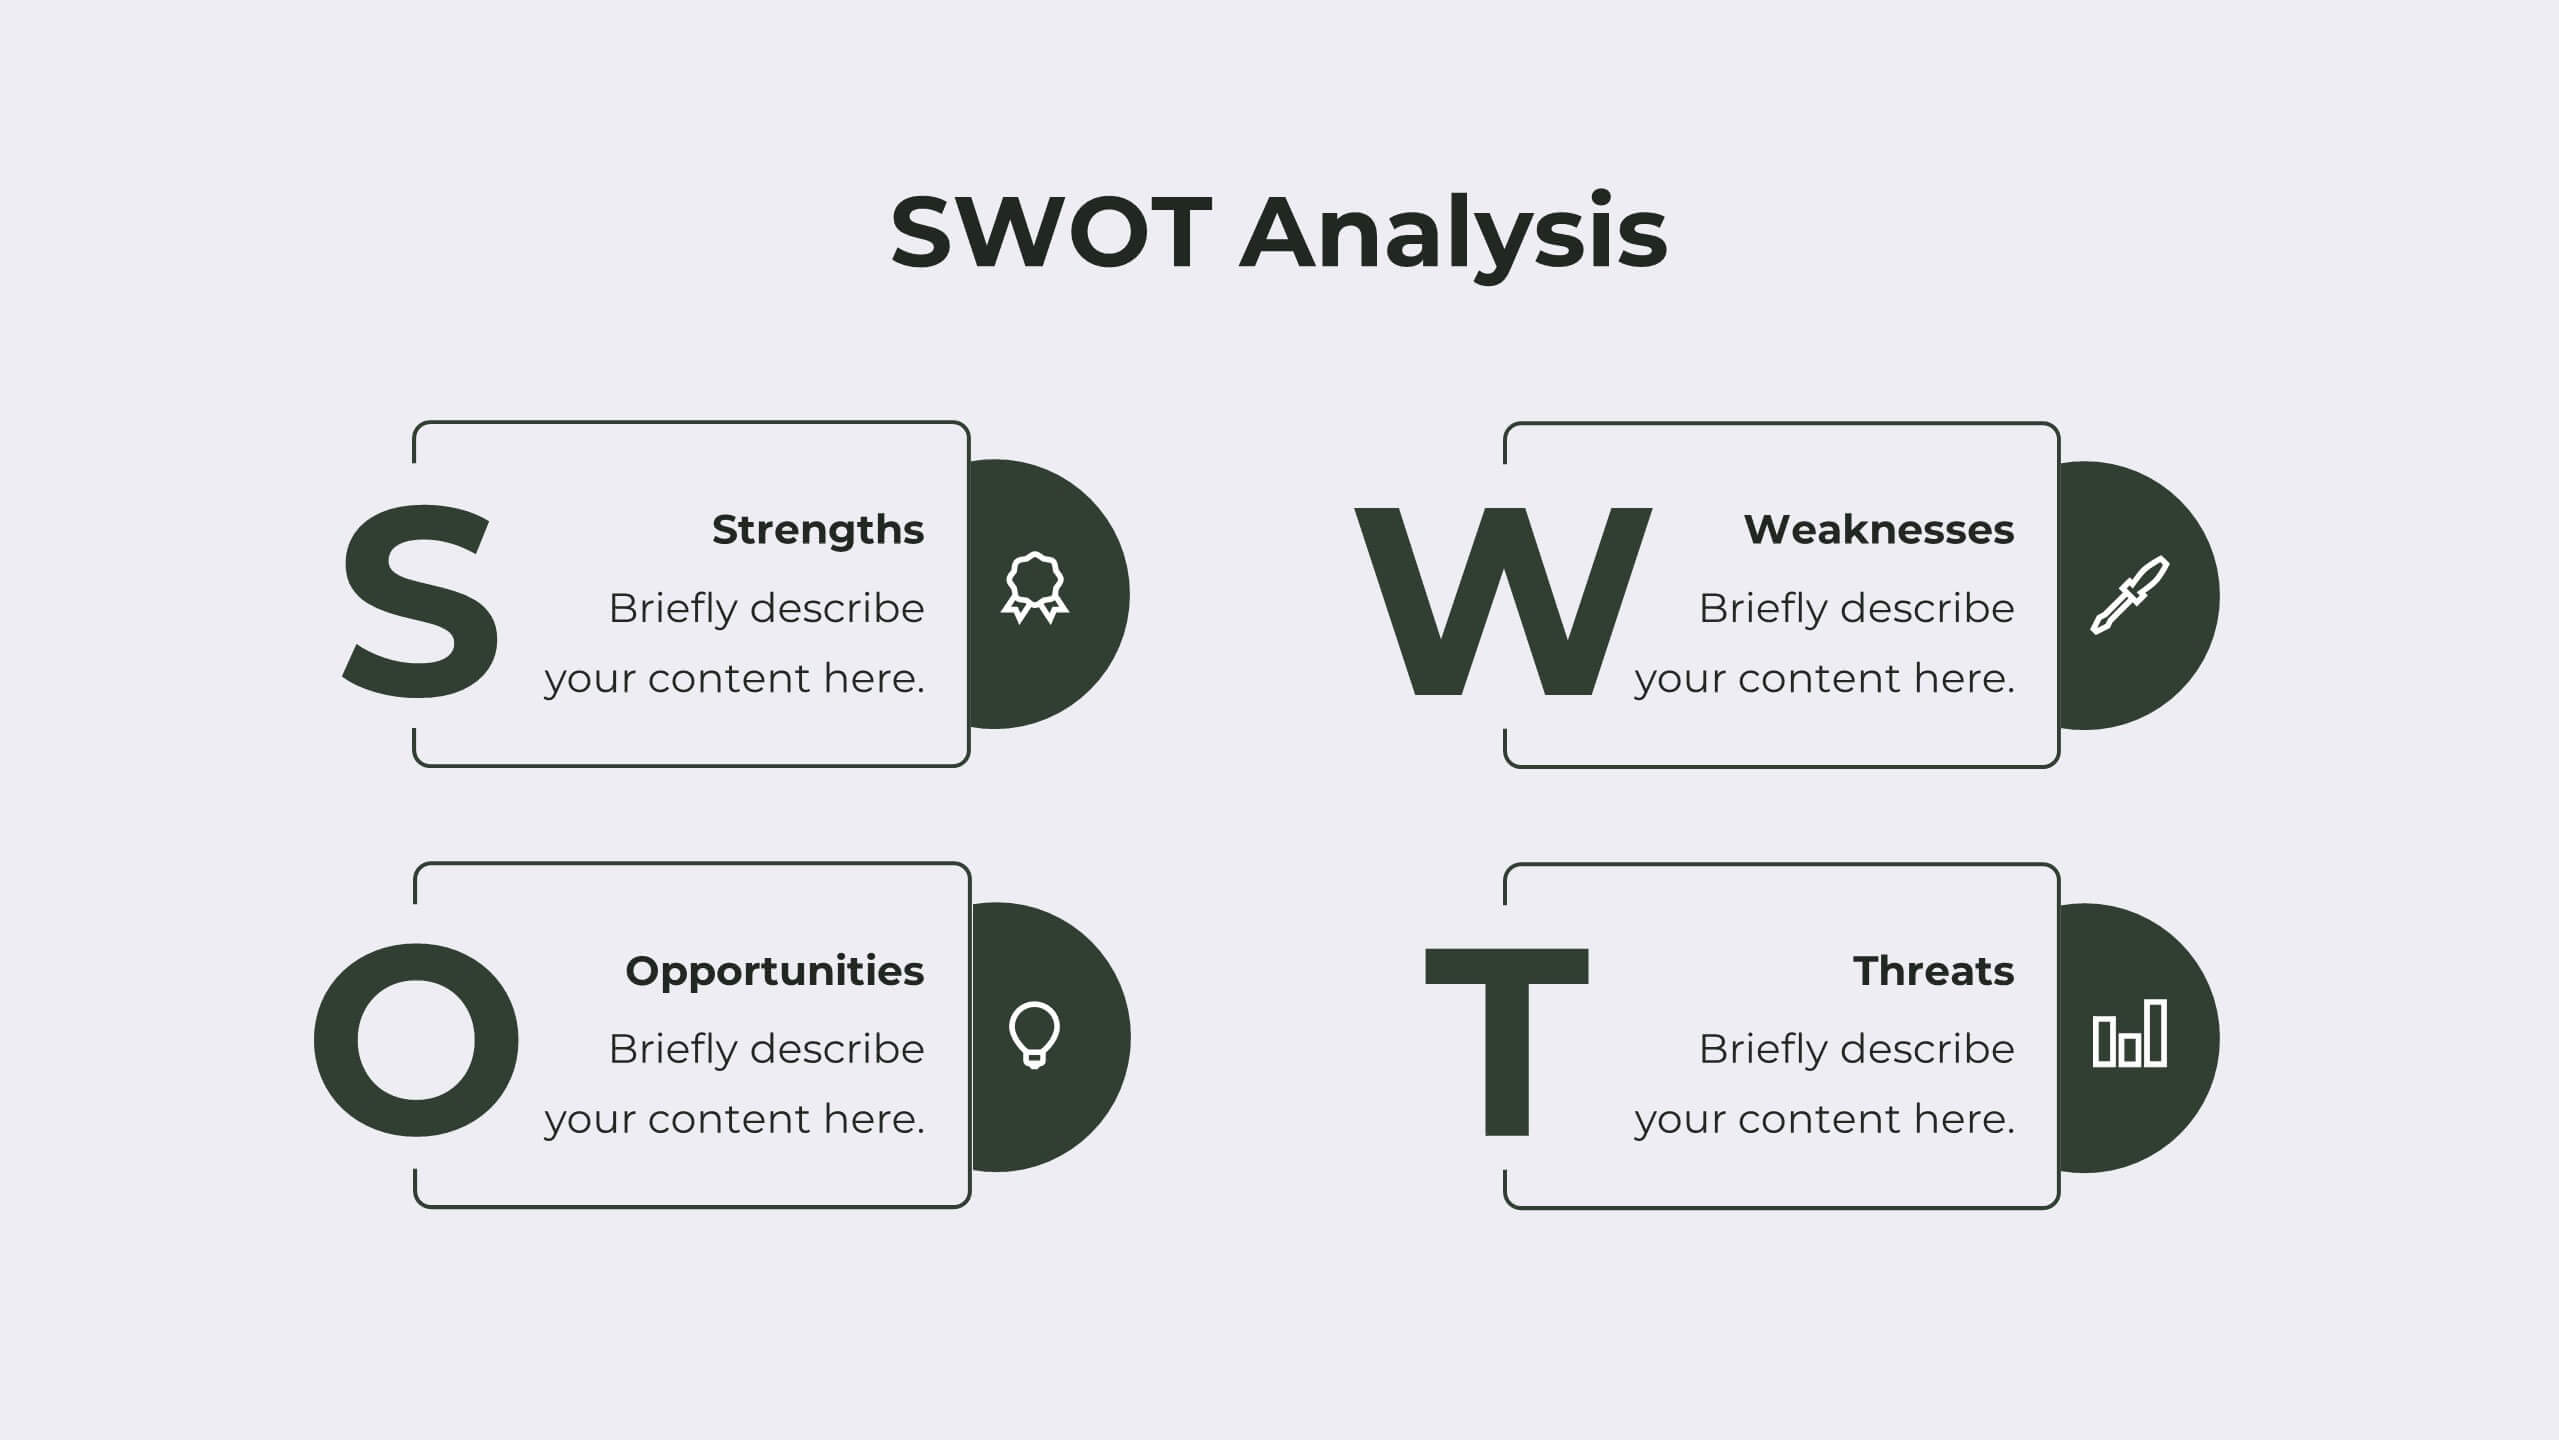
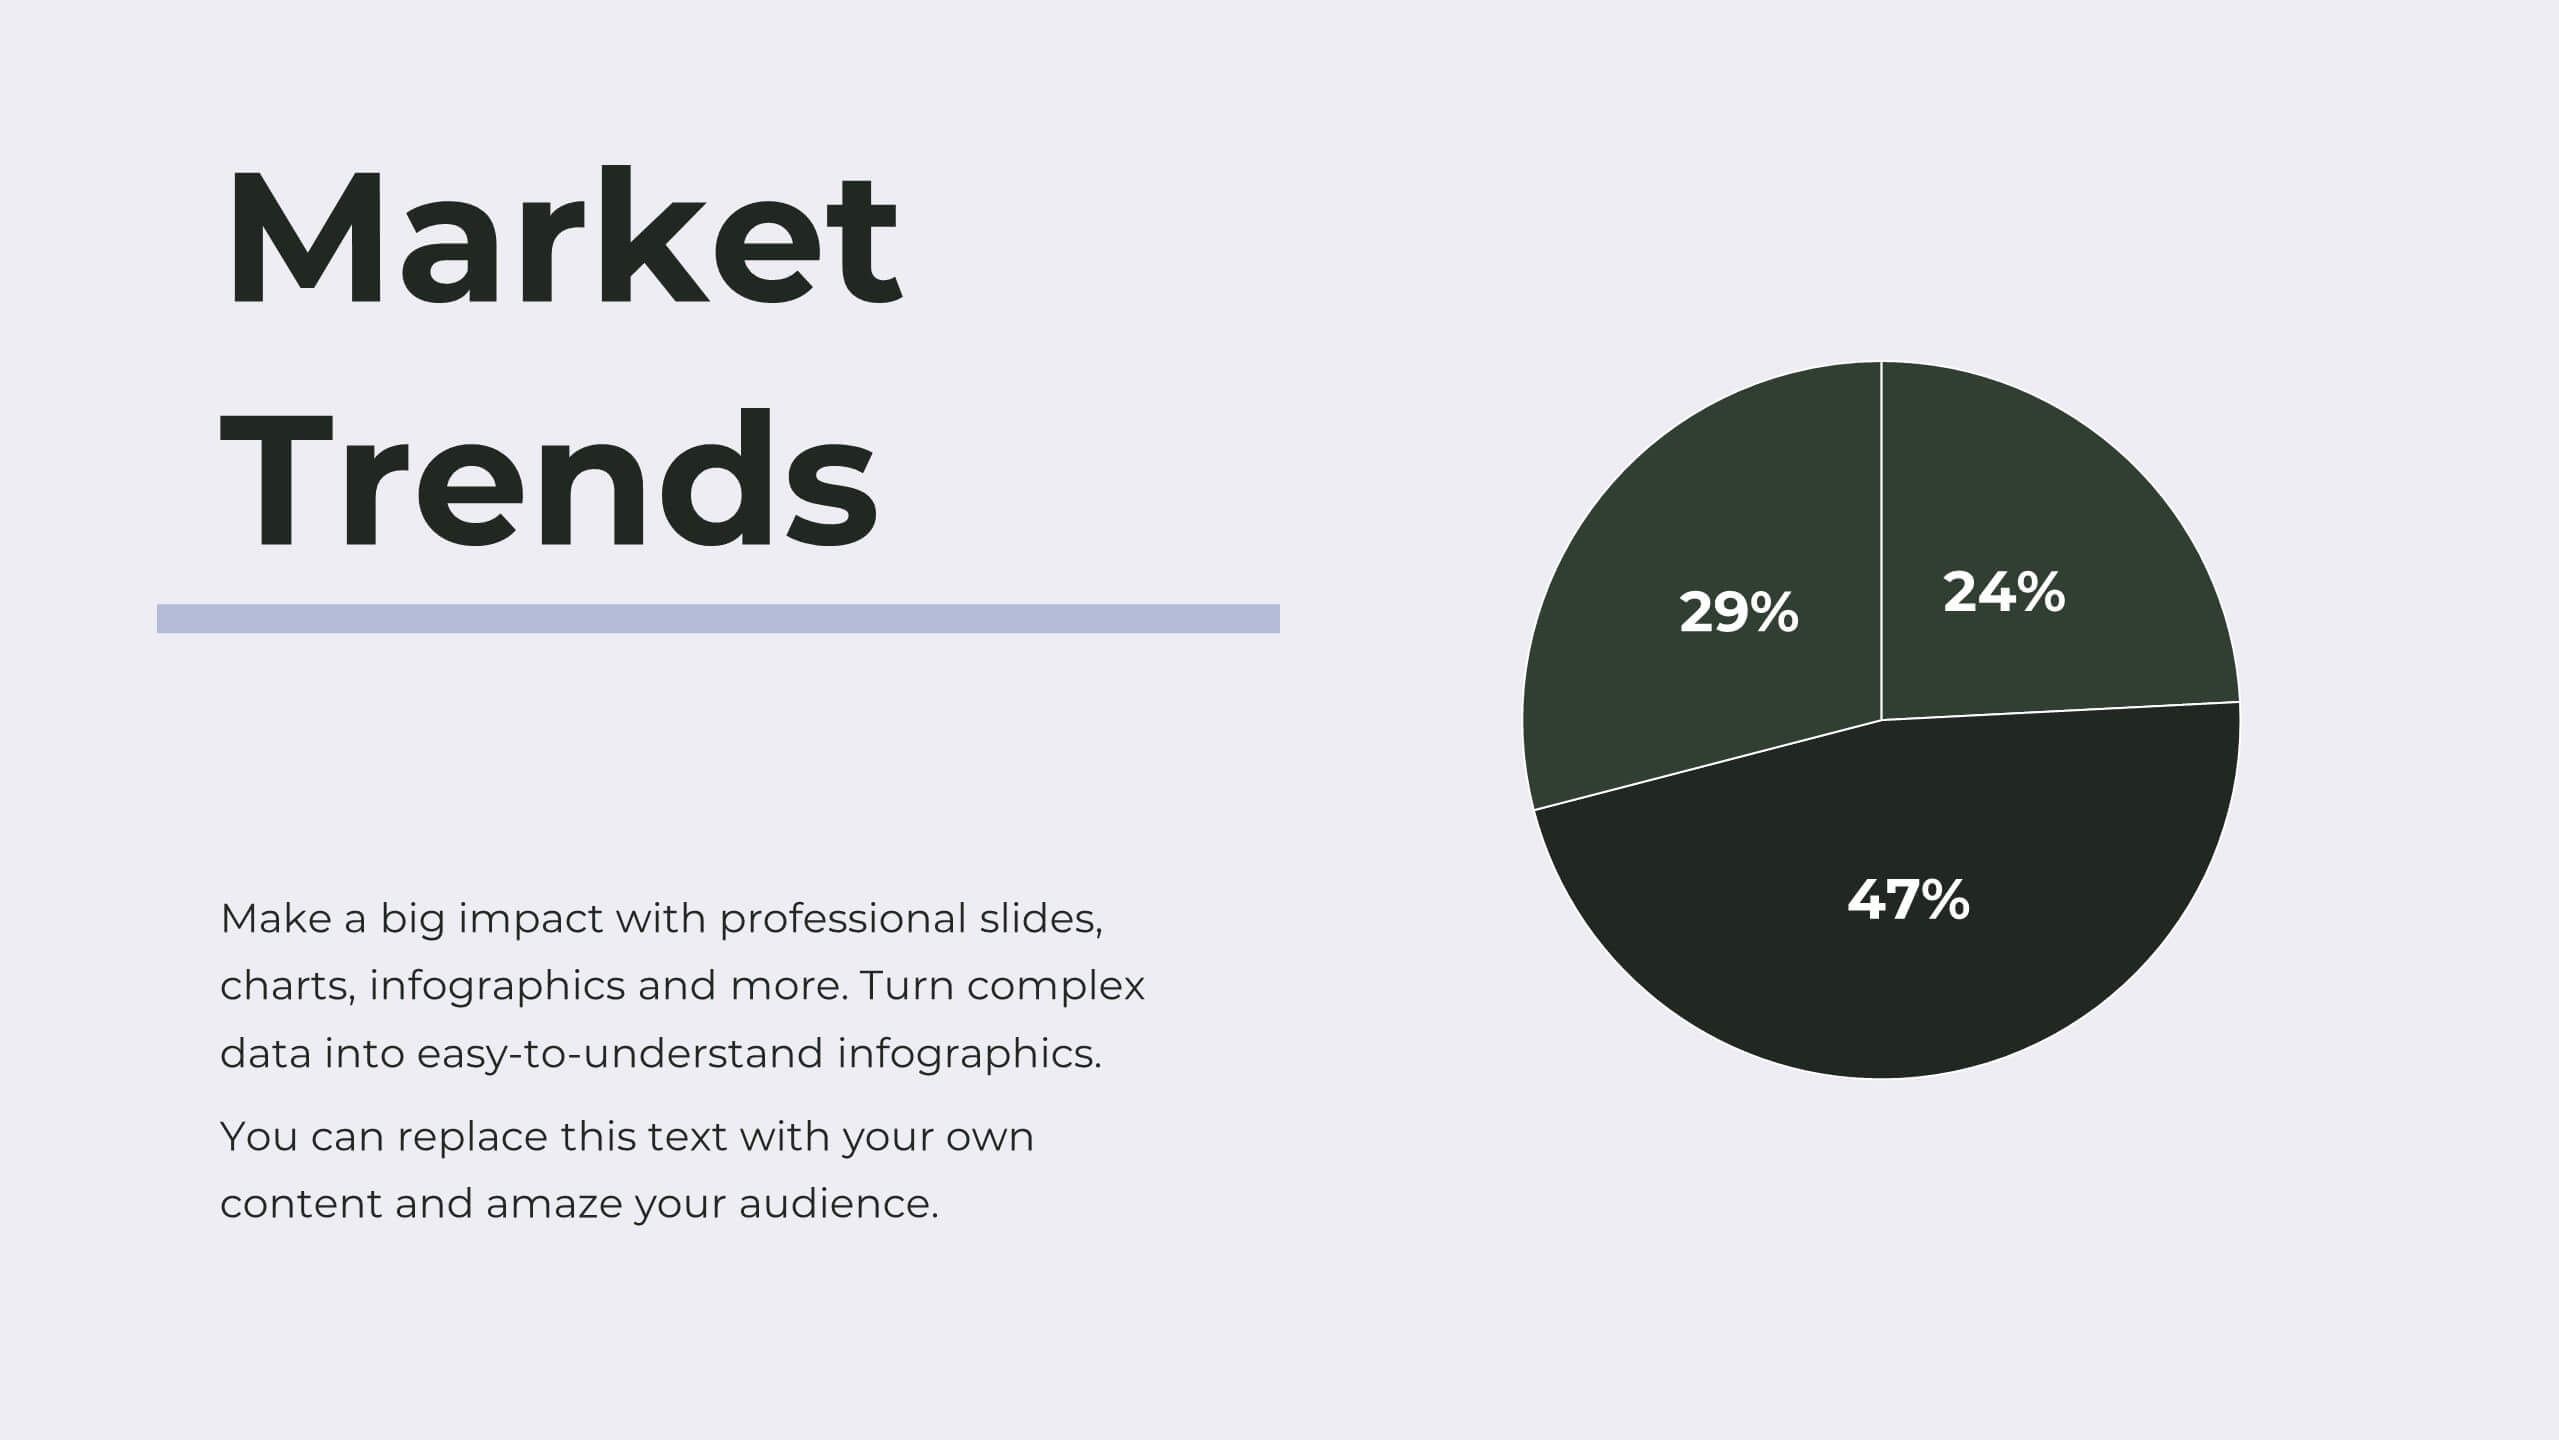
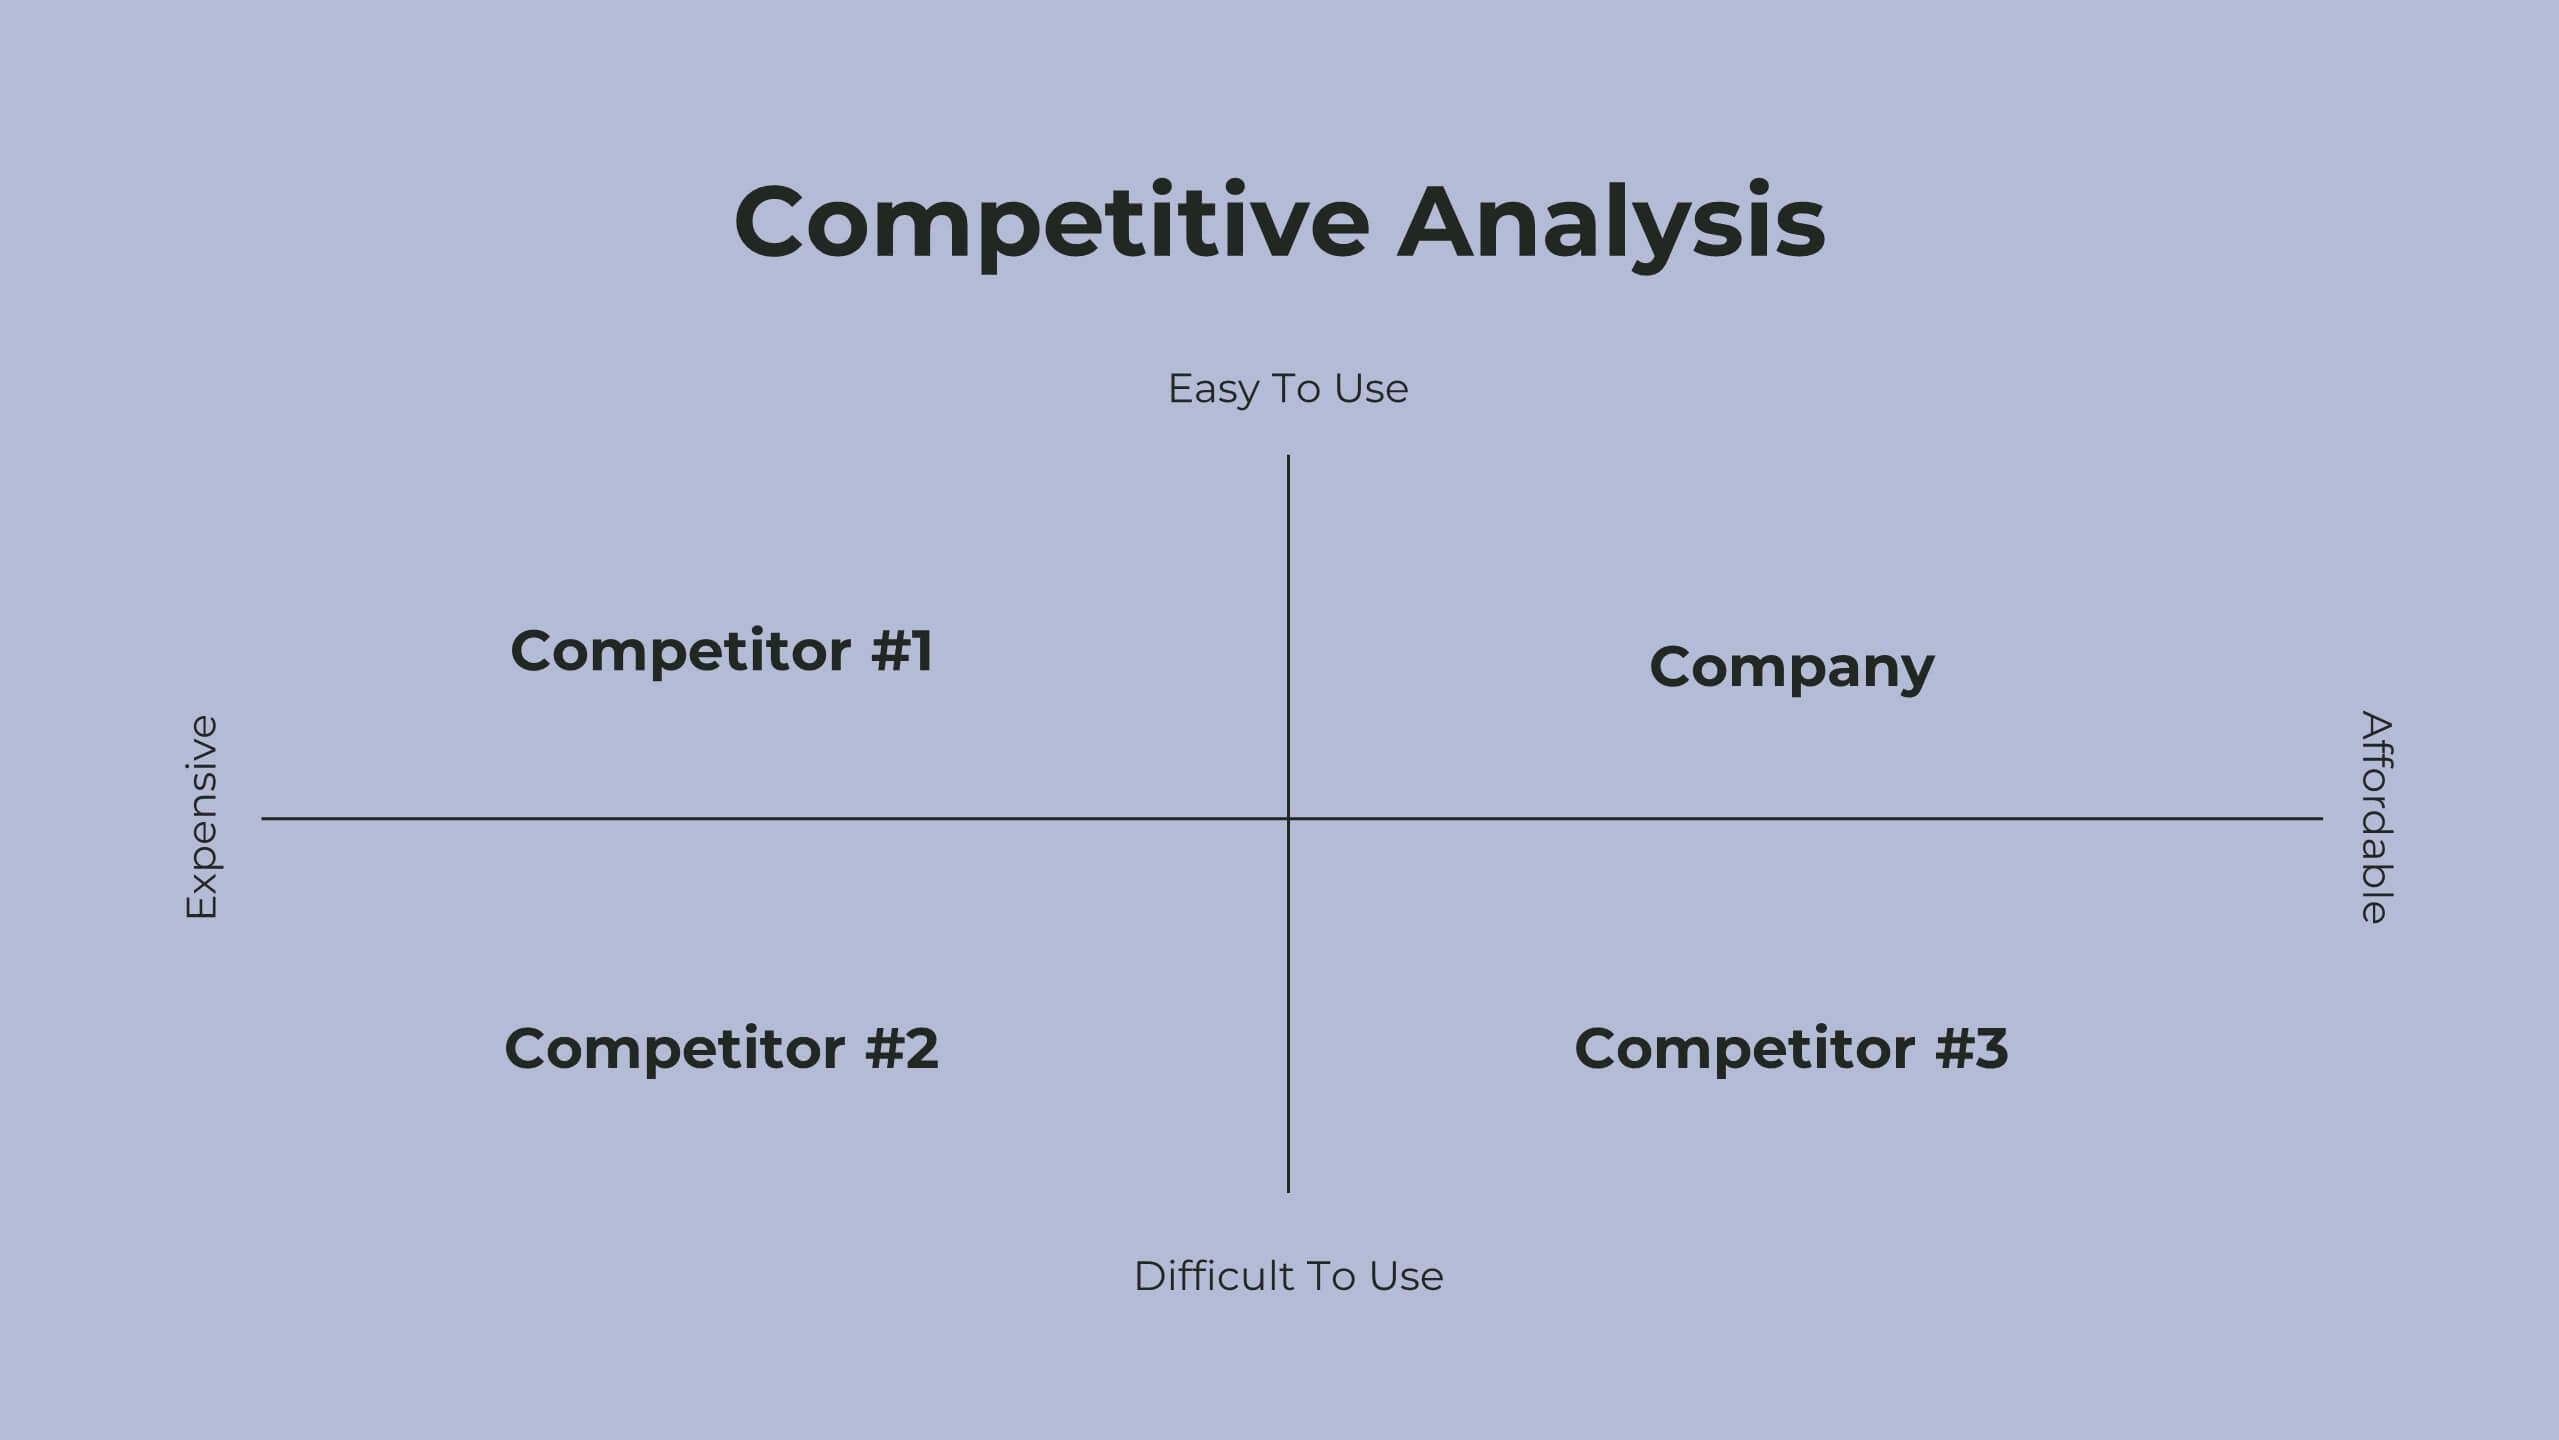
Drive your business forward with this elegant corporate strategy proposal template! Ideal for outlining strategic objectives, competitive analysis, and growth opportunities, it includes slides for SWOT analysis, resource allocation, and performance metrics. Impress stakeholders with clear visuals and structured content. Compatible with PowerPoint, Keynote, and Google Slides for seamless presentations on any platform.


4 slides
Sequential Roadmap Planning Timeline Presentation
Guide your audience through each milestone with the Sequential Roadmap Planning Timeline Presentation. This sleek layout is perfect for showing linear progress over time—ideal for strategic plans, product rollouts, or project phases. Each step is clearly marked with editable years and titles, ensuring clarity and easy customization. Fully compatible with PowerPoint, Google Slides, and Canva.


7 slides
Company Profile Infographic
This collection of company profile templates is designed to meet the diverse needs of various businesses, providing an efficient and polished method for presenting a company's identity, accomplishments, and offerings. Each template is meticulously crafted to cater to different professional contexts, making them suitable for annual reports, investment summaries, or internal briefings. Structured for clarity, these templates enable businesses to effectively communicate essential details such as company history, objectives, and the breadth of services or products offered. They are also equipped to showcase crucial statistics like employee numbers, significant achievements, and organizational hierarchy, enhancing the overall presentation. The design blends modern aesthetics with functionality, incorporating a professional color palette and clean layout that holds viewer interest and enhances readability. Customization is straightforward, allowing for easy adjustments in colors, fonts, and design elements to align with specific brand identities. Ideal for corporations looking to convey their market stance and engage potential clients, investors, or prospective employees, these templates serve as a vital tool in creating impactful and informative company profiles.


21 slides
Cascade Marketing Proposal Template Presentation
Ignite your creativity with our dazzling Cascade Marketing Proposal Template Presentation! This captivating design brings your ideas to life, ensuring your presentation stands out. The sleek, dark theme is punctuated by electric blue accents, adding a modern, professional touch. Each slide is meticulously crafted, offering a perfect blend of visuals and content that keeps your audience engaged from start to finish. From the Company Overview to Growth Projections, every aspect of your pitch is highlighted with style and clarity. The template is fully customizable, allowing you to tailor it to your brand's identity effortlessly. Whether you're pitching to investors or presenting internally, this template has everything you need to make a lasting impression. Compatible with PowerPoint, Keynote, and Google Slides, it’s versatile and easy to use. Get ready to electrify your next presentation and leave your audience in awe!


7 slides
Gap Analysis Infographic Presentation Template
A Gap Analysis is a tool that can significantly help you achieve your goals. It tells you where the gaps are in between two things, and how to fill them. Use our gap analysis template for your next project to understand the strengths and weaknesses of your business in relation to competitors, industry trends and best practices. This template has sections for naming the gap analysis and describing its objectives, identifying gaps between current state performance levels and desired state performance levels, discussing how these gaps could be addressed and identify further actions to be taken.


7 slides
Gap Analysis Skills Infographic
Gap analysis in a skills context is a process of evaluating the difference or "gap" between the current skills and competencies of an individual or a team and the desired or required skills for a particular role, project, or goal. This infographic template is a crucial tool for personal and professional development, talent management, and strategic planning within organizations. This captivating visual is designed to help individuals and organizations bridge the skills gap effectively. This infographic serves as a compass, guiding you through the essential steps needed to identify, analyze, and close the skills gaps within your organization.


4 slides
RACI Responsibility Assignment Matrix
Streamline your project roles with this clear and customizable RACI Matrix template. Easily define who's Responsible, Accountable, Consulted, and Informed across tasks or phases. Perfect for project managers, team leads, and business strategists. Fully editable in PowerPoint, Keynote, and Google Slides.


7 slides
Decision Tree Diagram Infographics
A Decision Tree Diagram is a visual representation of a decision-making process that uses a tree-like structure to map out various possible outcomes and their associated probabilities. This template can be used in fields such as business, economics, and data science to model complex decision-making scenarios. This infographic starts with a single node, representing the initial decision that needs to be taken. From this node, paths extend to other nodes representing possible outcomes that could occur as a result of the initial decision. The final nodes of the diagram represent the end results.


6 slides
1-Page Executive Summary Slide Presentation
Bring clarity to complex updates in a single, colorful layout designed to keep your audience engaged from start to finish. This clean and modern slide breaks down key messages into six distinct points, making it easy to showcase progress, milestones, or strategies. Fully compatible with PowerPoint, Keynote, and Google Slides.