


Features
- 2 Unique slides
- Fully editable and easy to edit in Microsoft Powerpoint, Keynote and Google Slides
- 16:9 widescreen layout
- Clean and professional designs
- Export to JPG, PDF or send by email


Do you have any questions?
Recommend


4 slides
Product Launch Schedule Timeline Presentation
Showcase your product rollout with this vertical rocket-themed timeline. Ideal for startups, marketing teams, or product managers, it highlights four key stages with icons and editable text. The cloud-based design adds visual flair while maintaining clarity. Fully customizable in PowerPoint, Keynote, and Google Slides to suit your launch plan.


4 slides
Business Growth in Numbers Presentation
Showcase business performance with the Business Growth in Numbers Presentation template. Designed for sales reports, financial reviews, and market analysis, this template includes visualized statistics, percentage comparisons, and trend graphs to highlight key growth metrics. Fully customizable and compatible with PowerPoint, Keynote, and Google Slides, it ensures clear and compelling data storytelling.


6 slides
Public Healthcare System Strategy Presentation
Present key components of your medical or government plan with the Public Healthcare System Strategy Presentation. This clean and modern slide design uses a heart-centered layout with five surrounding icons to highlight core pillars—perfect for policy updates, strategy overviews, or health service workflows. Fully editable in Canva, PowerPoint, Keynote, and Google Slides.


7 slides
Half Year Survey Results Infographic
Evaluating progress mid-year is essential for adapting and thriving. Our half-year survey results infographic, painted in vibrant hues of orange and blue, transforms raw data into visually appealing insights. Whether it's customer feedback, employee performance, or market trends, this template makes understanding findings both effortless and impactful. Ideal for business managers, data analysts, market researchers, and educators, it's designed to communicate complex survey results in an easily digestible manner. Fully compatible with PowerPoint, Keynote, and Google Slides, it's your companion for dynamic presentations that resonate and inform.


6 slides
Veterinary Clinic Service Guide Presentation
Bright, friendly, and professional—this clean infographic layout helps present veterinary services with clarity and warmth. Perfect for showcasing treatments, care plans, and clinic highlights, it brings a welcoming touch to any animal care presentation. Fully customizable and compatible with PowerPoint, Keynote, and Google Slides for effortless editing and presentation.


5 slides
Customer Conversion with AIDA Framework
Present your sales strategy effectively with the Customer Conversion with AIDA Framework Presentation. This template breaks down the four key stages—Attention, Interest, Desire, and Action—into a clear and visually engaging funnel design. Perfect for marketing professionals, sales teams, and business strategists. Fully editable in PowerPoint, Keynote, and Google Slides.


7 slides
Aviation School Infographic Presentation
If you're in search of striking visuals for your upcoming aviation school presentation, we've got just the solution for you. Our expertly crafted infographic template is designed to captivate and engage your audience, ensuring that your message is conveyed with maximum impact. Our template covers a diverse range of aviation topics, including airport and runway security. This guarantees that your information is presented in a clear, concise, and visually compelling manner. With our aviation infographic template, you'll be able to deliver an outstanding presentation that resonates with your audience and leaves a lasting impression.


6 slides
Commercial Real Estate Infographics
Explore the world of Commercial Real Estate with our customizable infographic template. This template is fully compatible with popular presentation software like PowerPoint, Keynote, and Google Slides, allowing you to easily customize it to illustrate and communicate various aspects of commercial real estate. The Commercial Real Estate infographic template offers a visually engaging platform to outline the different types of commercial properties, investment strategies, market trends, and the benefits of investing in commercial real estate. Whether you're a real estate professional, investor, business owner, or simply interested in the world of commercial properties, this template provides a user-friendly canvas to create informative presentations and educational materials. Deepen your knowledge of Commercial Real Estate with this SEO-optimized infographic template, thoughtfully designed for clarity and ease of use. Customize it to showcase property types (e.g., office, retail, industrial), financing options, risk management, and the potential for income and growth, ensuring that your audience gains valuable insights into this lucrative sector. Start crafting your personalized infographic today to explore the realm of Commercial Real Estate.


6 slides
TAM SAM SOM Market Analysis
Take your market insights to the next level with a visual that simplifies complex data in seconds. This layered template helps you clearly communicate TAM, SAM, and SOM breakdowns—perfect for startups, product pitches, or strategic planning. Easily editable in PowerPoint, Keynote, and Google Slides for fast, polished presentations.


5 slides
Fashion Design Infographics
Fashion Design is the art of creating clothing and accessories, incorporating elements of style, aesthetics, and functionality. These infographic templates offer a visually captivating and informative way to present key concepts, trends, and insights in the world of fashion design. This template is ideal for fashion designers, students, industry professionals, or anyone interested in sharing knowledge about fashion design principles, fashion history, or emerging trends. Featuring a stylish design that reflects the creative and dynamic nature of the fashion industry. This allows for easy customization and seamless integration of your fashion-related content.


6 slides
12-Month Business Timeline Presentation
Jump into a year of planning with a crisp, colorful layout that makes every month feel organized and actionable. This presentation helps you map goals, deadlines, and initiatives across all four quarters, offering a clear structure for business planning and progress tracking. Fully compatible with PowerPoint, Keynote, and Google Slides.


13 slides
Organizational Company Profile Presentation
Elevate your business overview with this straightforward Company Profile template. The opening slide announces the essence of your business, preparing the audience for a journey through your organizational landscape. Structured to highlight the key areas of your business, the template includes an 'About Us' section, laying out your mission and vision. Learn about the dedicated team behind the success with the 'Meet Our Team' slide, providing a personal touch to your corporate identity. Set clear, achievable goals with a slide dedicated to outlining your short-term and long-term objectives. Engage your audience with a 'Business Facts' slide that provides tangible insights into your company's performance. Finally, the 'Contact Us' slide offers a clear invitation for further dialogue, fostering potential partnerships. Ideal for those searching for a comprehensive yet accessible company presentation, this template is designed to convey your business strengths and opportunities effectively.


7 slides
Business Strategy Plan Infographic
A Business Strategy Infographic shows you how to create a business plan that will help you achieve your goals. This infographic is designed to help you understand how your company and competitors are going to win in the marketplace by showing how all of their moves fit together. This template is a beautiful combination of data visualization, charts, and graphics to help you see what's going on in your business. This is the perfect tool for anyone who wants to understand the current state of their operations and make informed decisions about how to move forward. Fully customizable and compatible with Powerpoint, Keynote, and Google Slides.


5 slides
Benefits of Insurance Infographics
The purpose of insurance is to mitigate the financial impact of unexpected events or circumstances that may result in financial loss. These infographic templates are versatile and effective tools to convey the value of insurance to your audience. These are perfect to highlight the various advantages and importance of having insurance coverage. This serves as an engaging tool to educate and inform your audience about the benefits of different types of insurance policies. This makes it easy for viewers to understand the benefits and importance of insurance in various aspects of life. Compatible with Powerpoint, Keynote, and Google Slides.


5 slides
AIDA Marketing Funnel Presentation
The "AIDA Marketing Funnel Presentation" template is expertly designed to streamline the visualization of the AIDA model, which stands for Attention, Interest, Desire, and Action. This template aids marketers in presenting and analyzing the effectiveness of marketing strategies to capture the consumer's journey from awareness to the final action of purchasing. Each stage of the funnel is clearly defined and color-coded, making it simple to insert specific strategies or results that relate to each step of the consumer engagement process. Ideal for marketing presentations, this template helps in explaining complex concepts in a digestible format, ensuring that the audience can easily follow along and understand key marketing tactics and outcomes.


7 slides
Business Strategy Infographic Presentation Template
A business strategy is a detailed plan that lays your goals, accomplishments and direction for the whole organization. A strategic plan will bring stability to your business and make it more profitable. This template can be used to inform your business on how essential a business strategy is. With this template, your business will learn that creating a strategy will help gain a better understanding of their organization's current strengths and weaknesses. This template is easy to use, includes helpful illustrations and allows you to add tips for managing your business more effectively.


24 slides
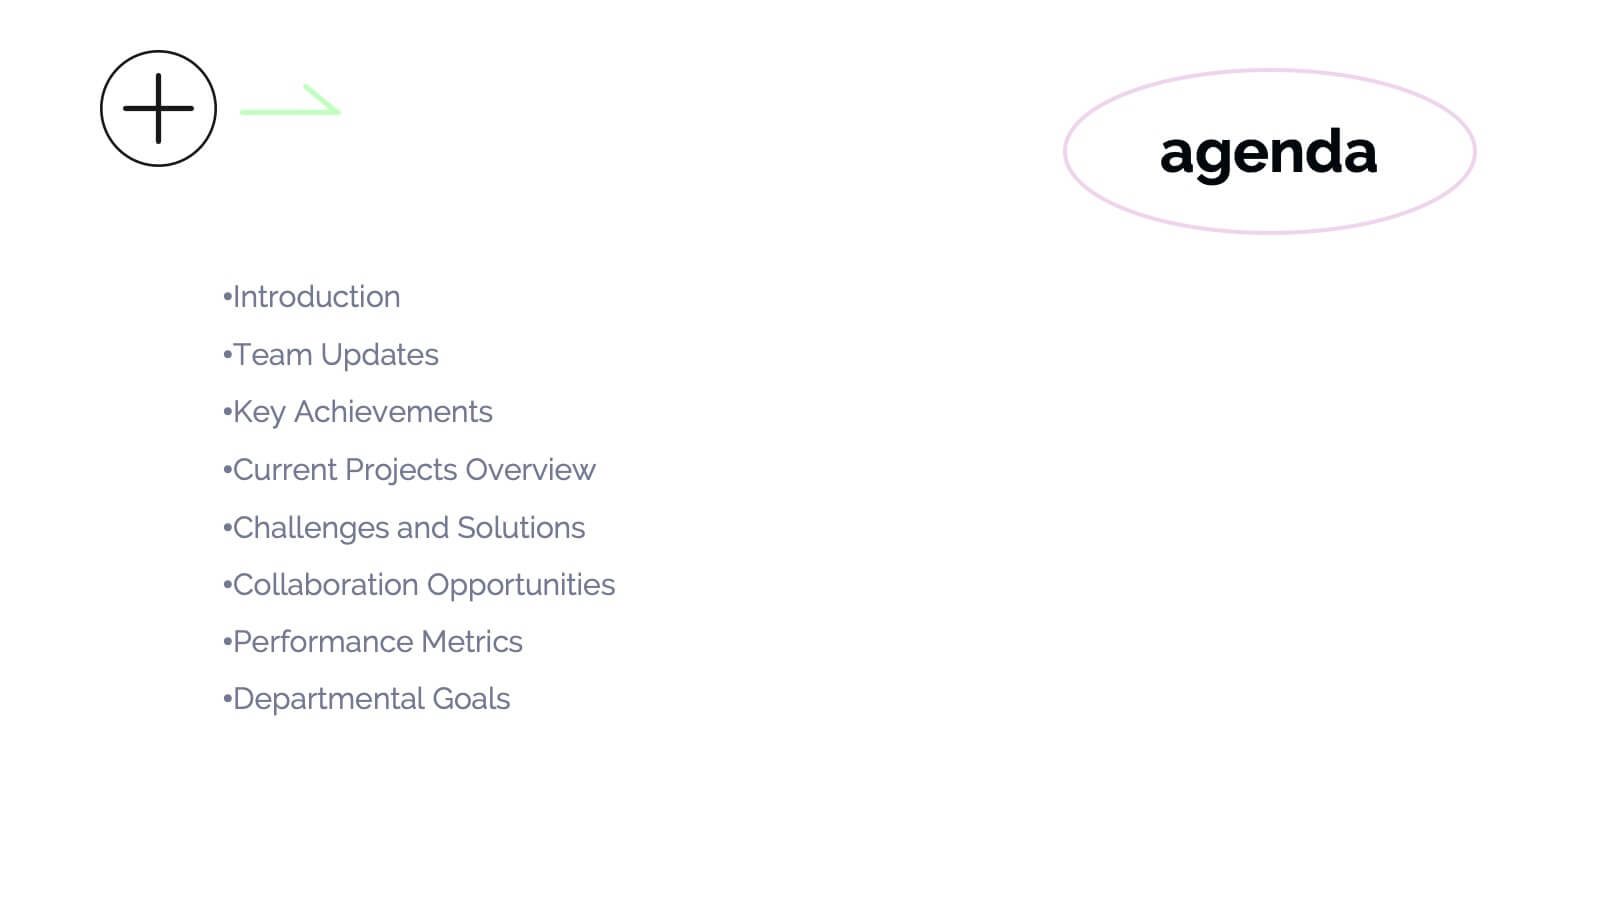
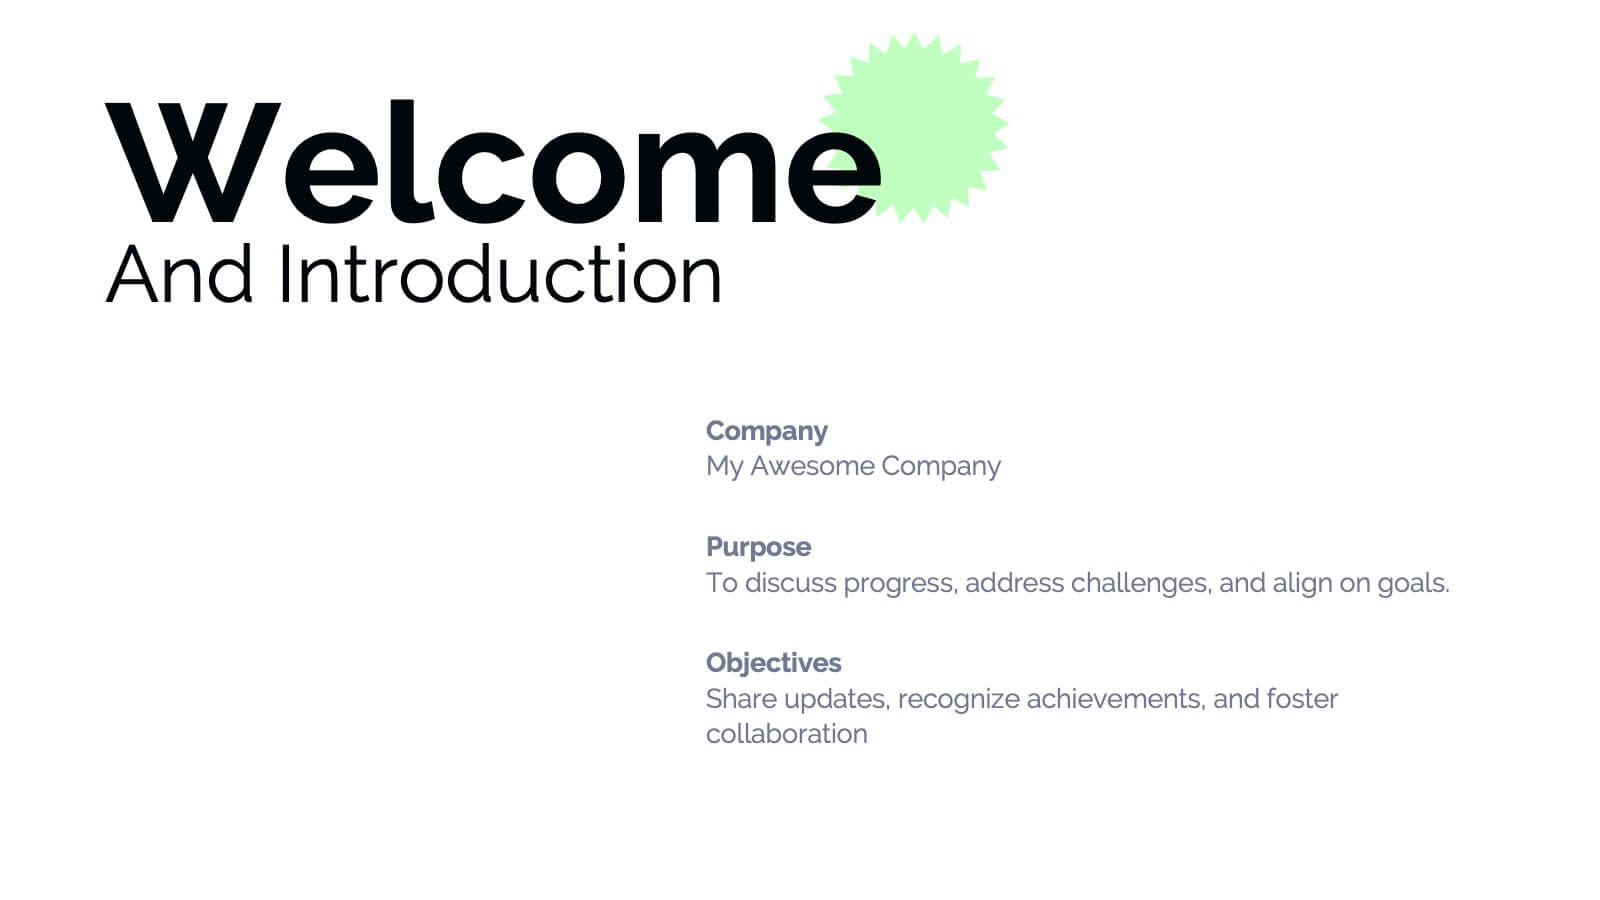
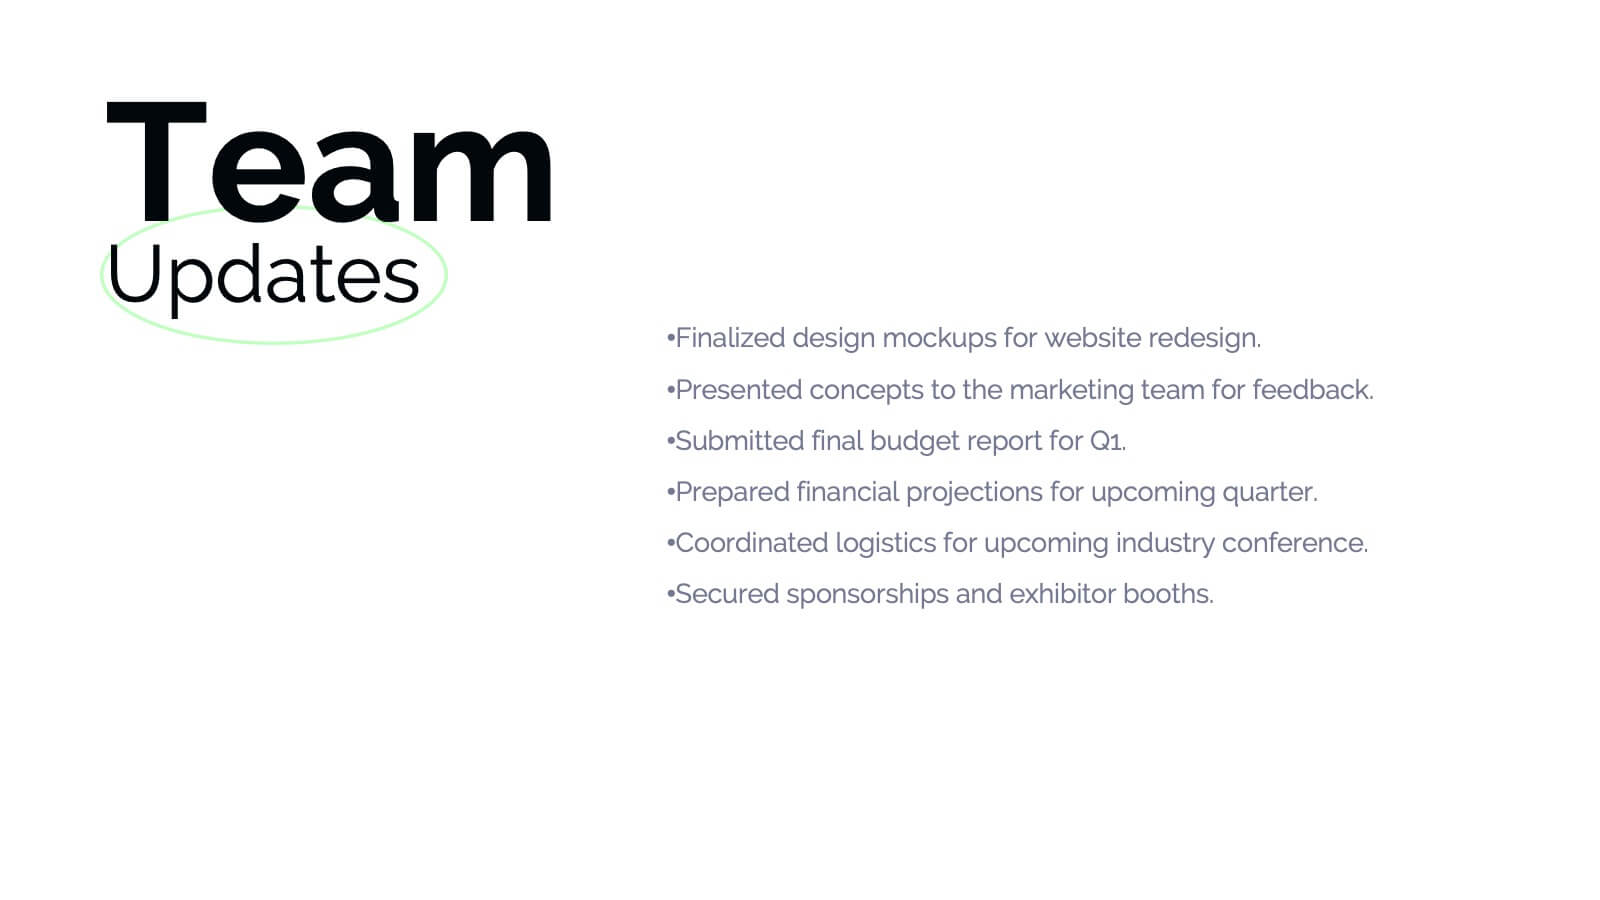
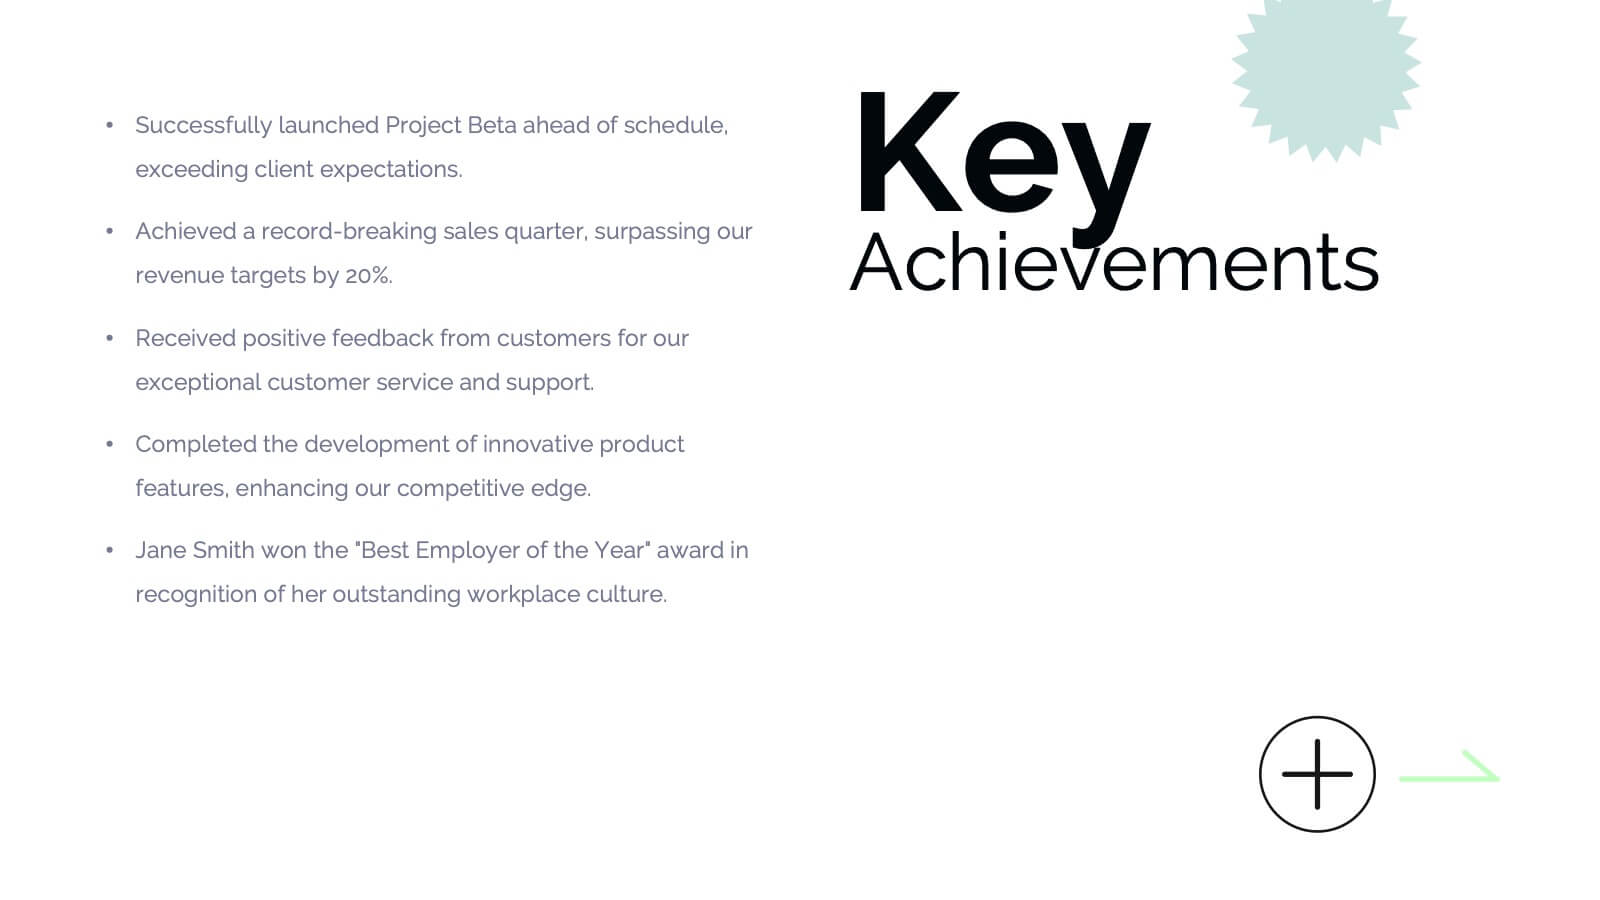
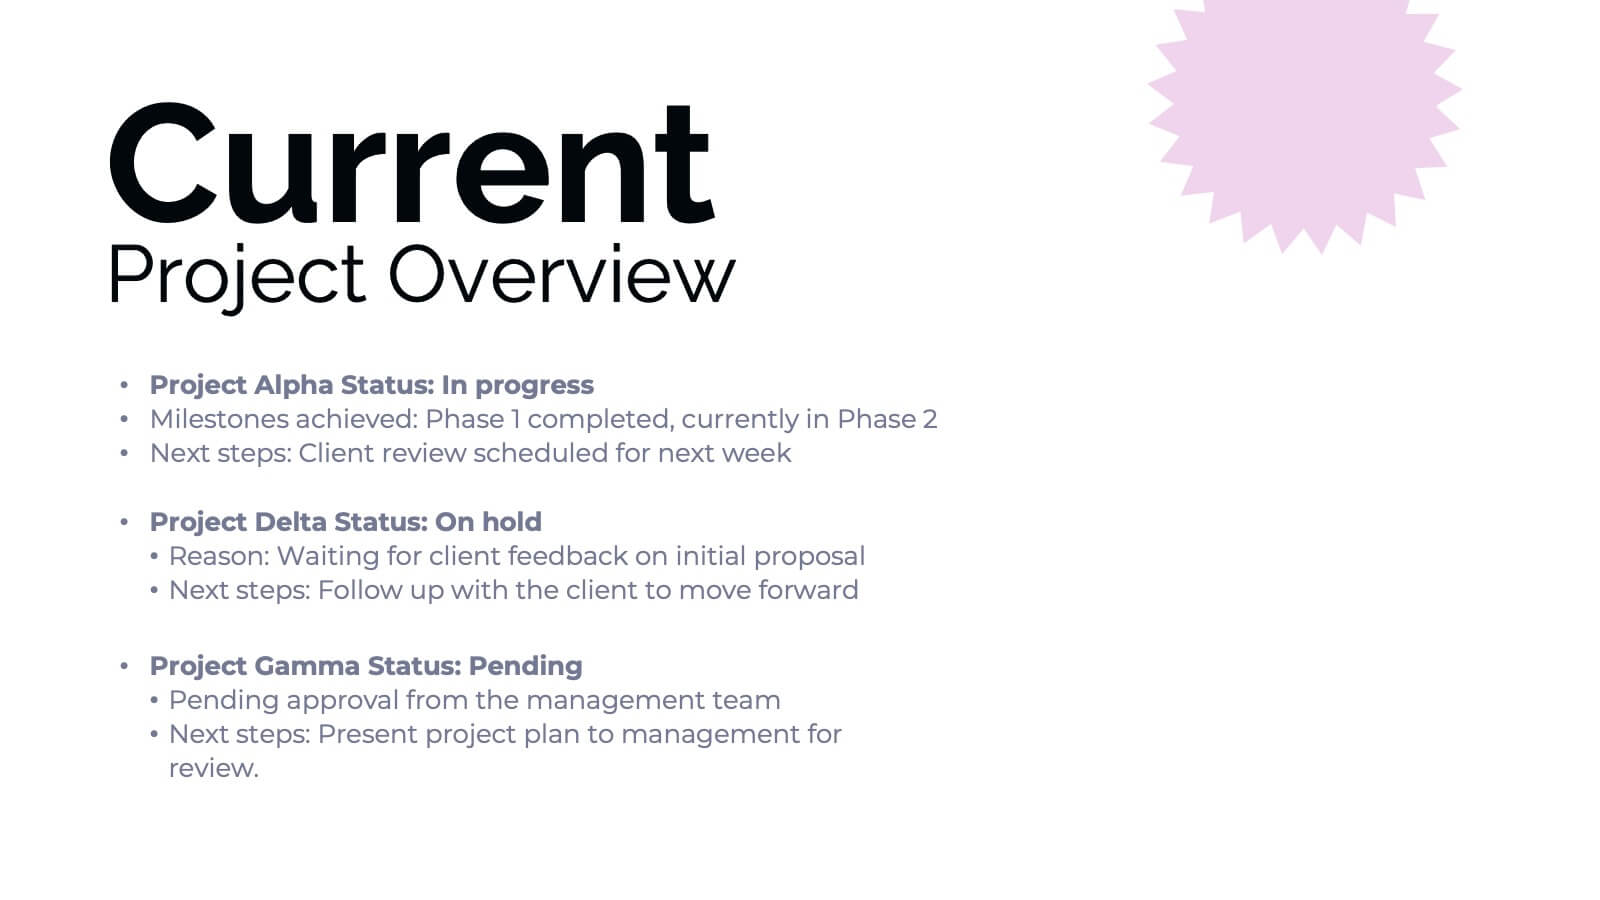
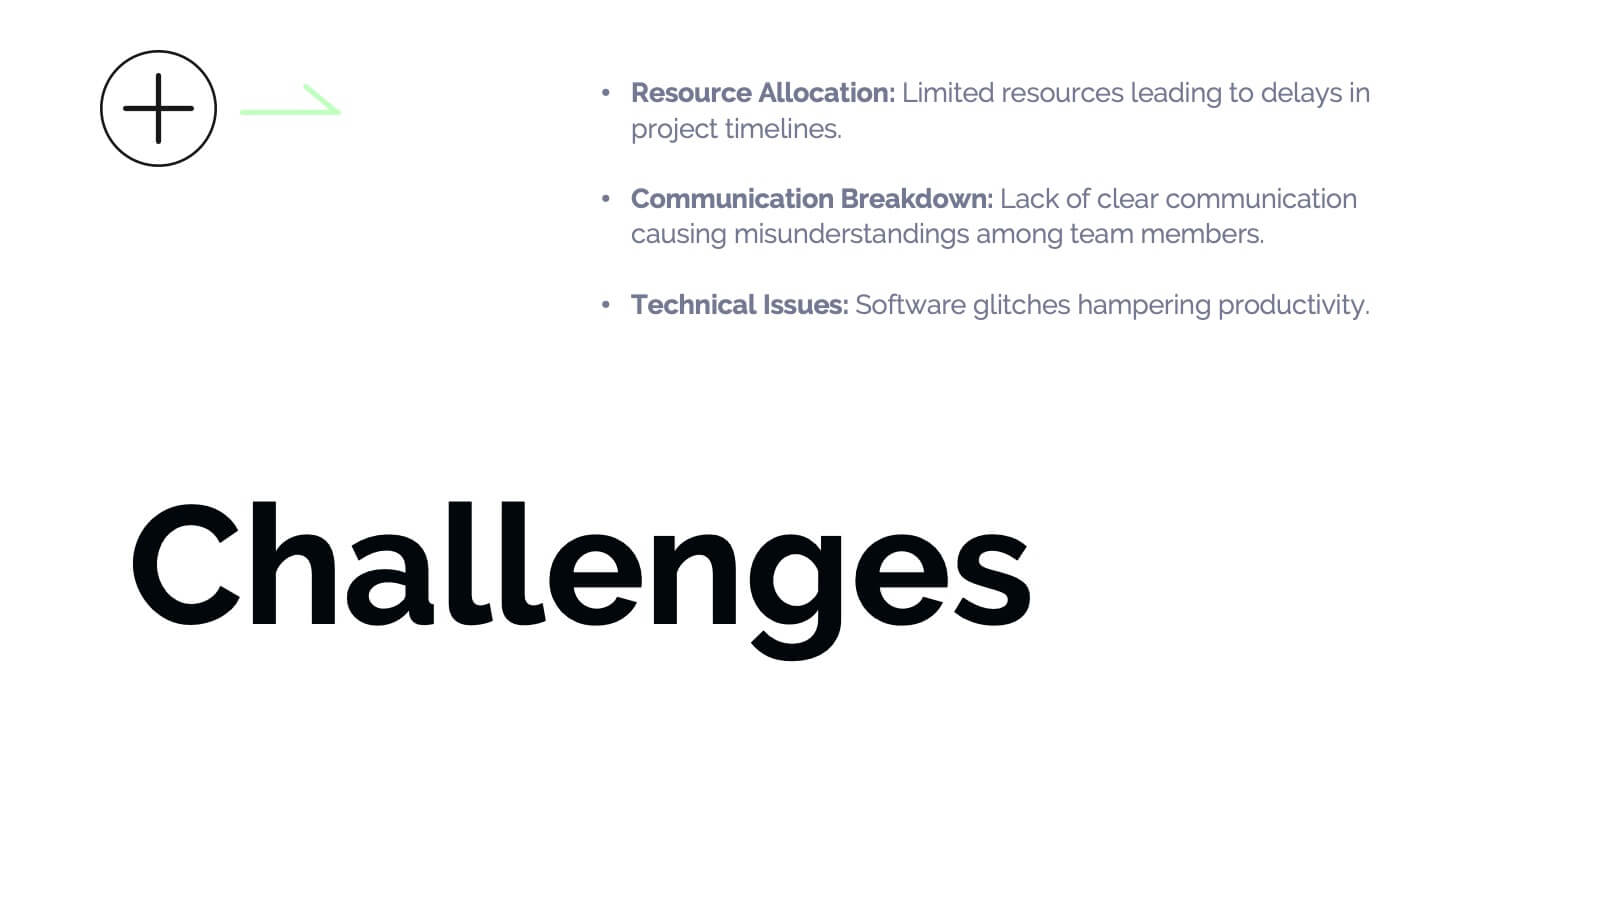
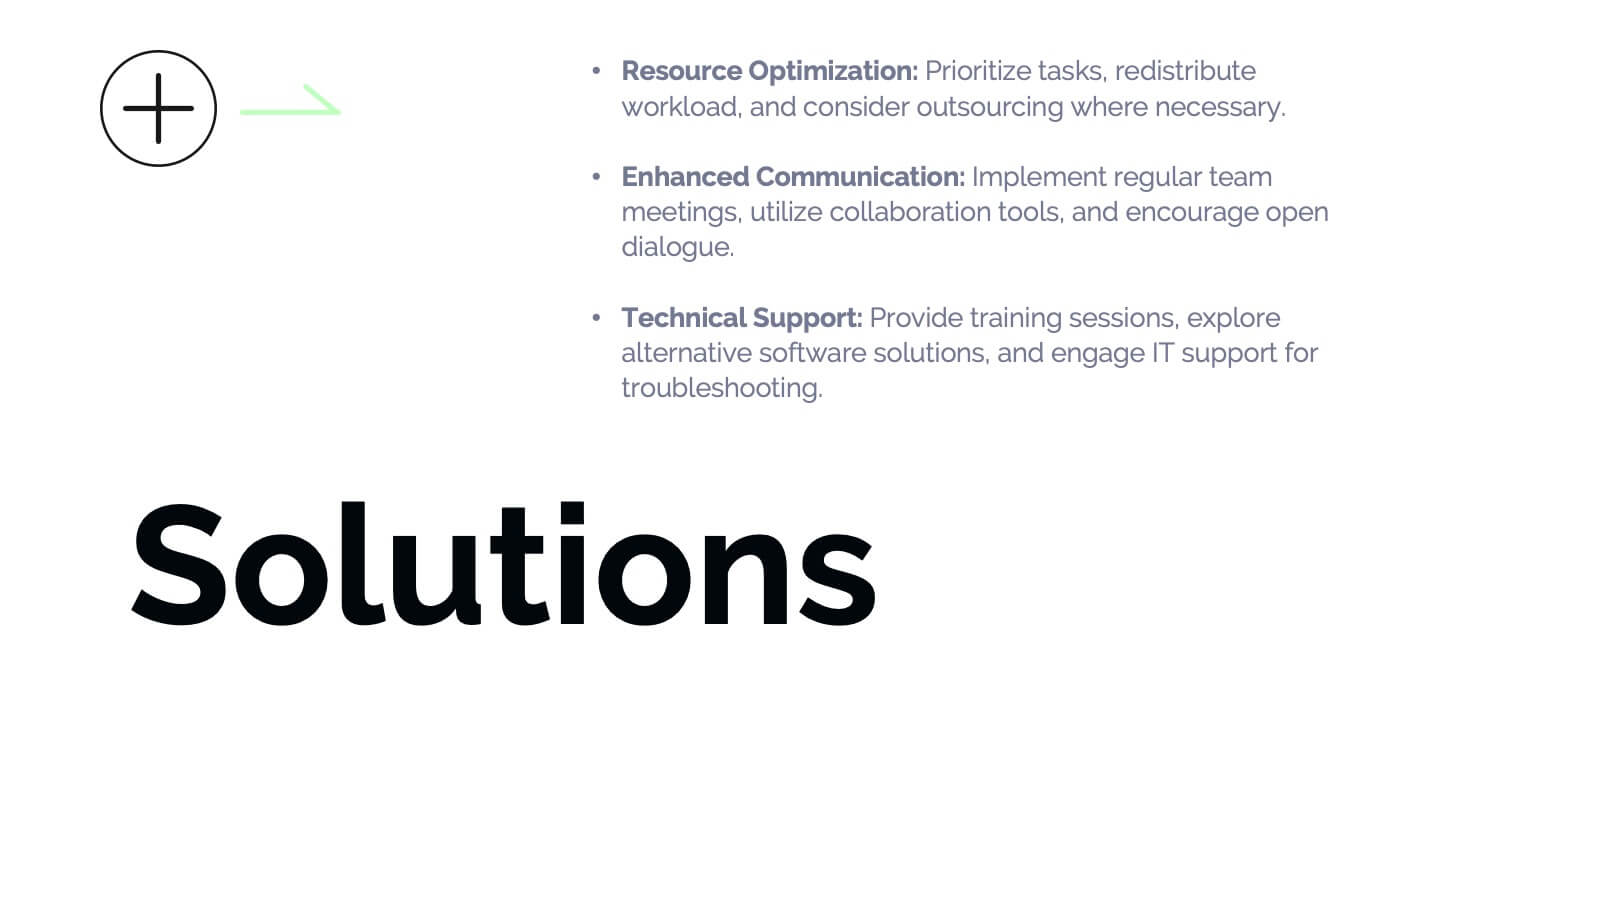
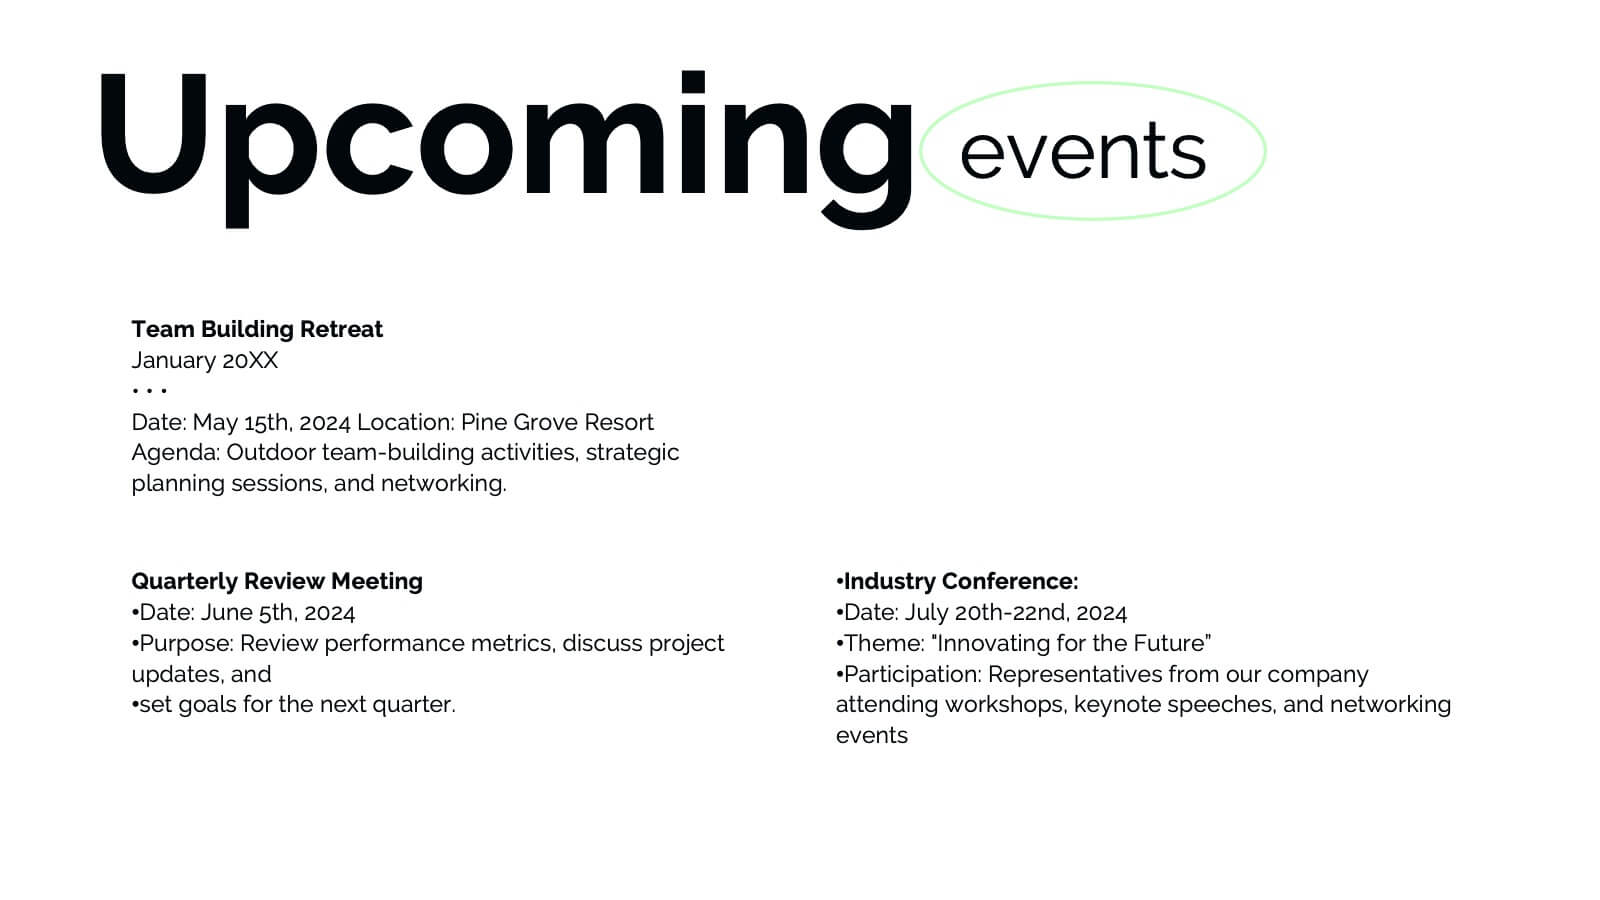
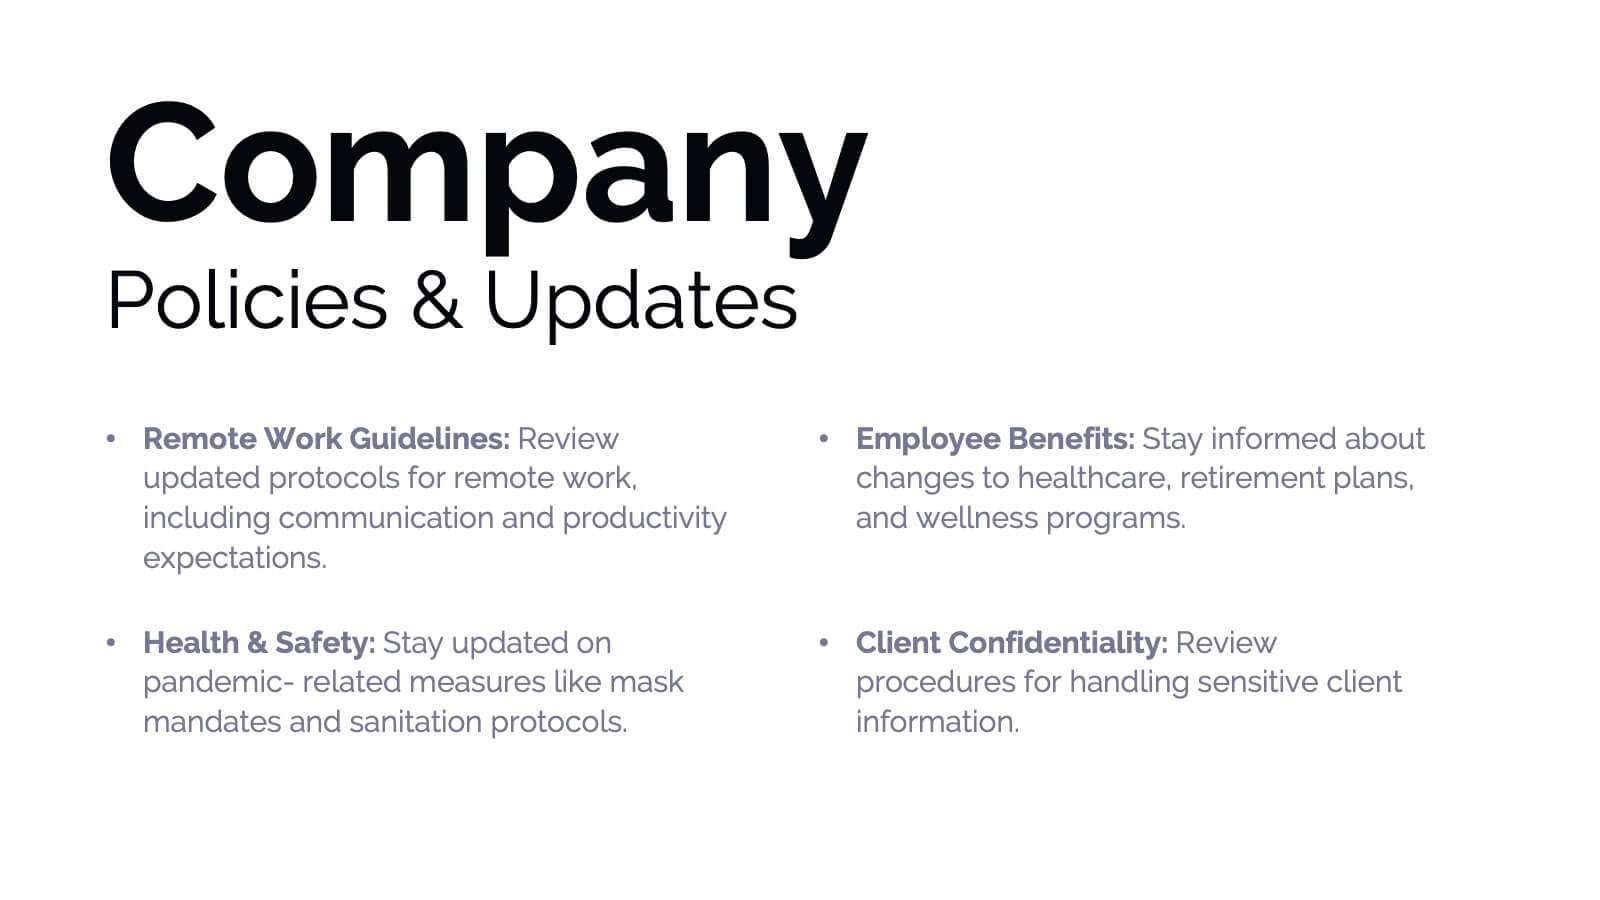
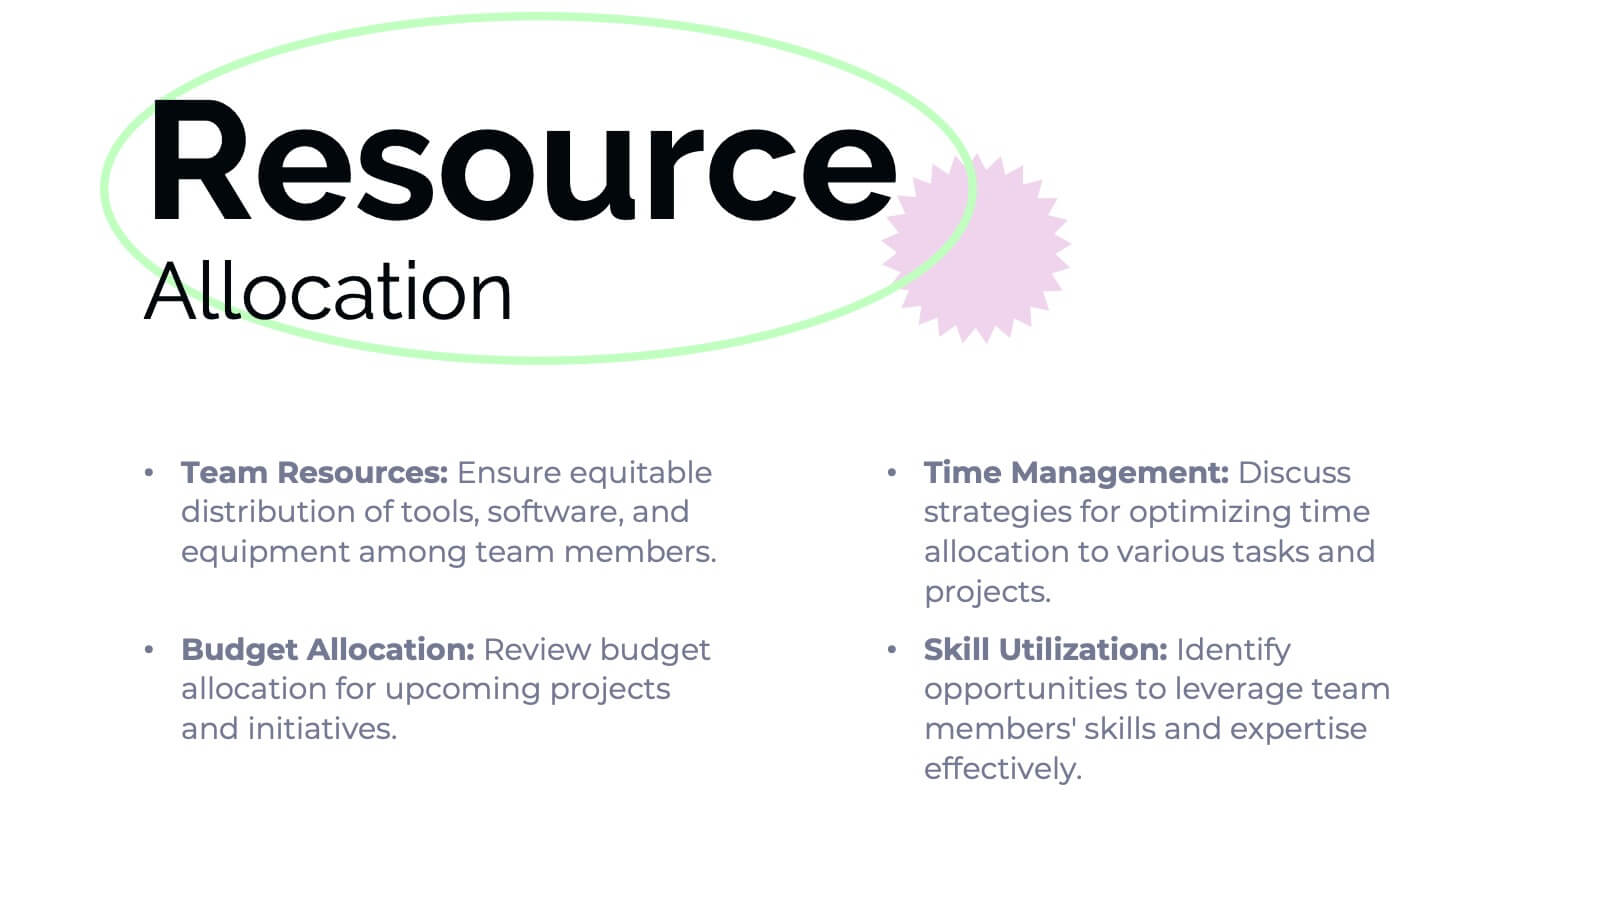
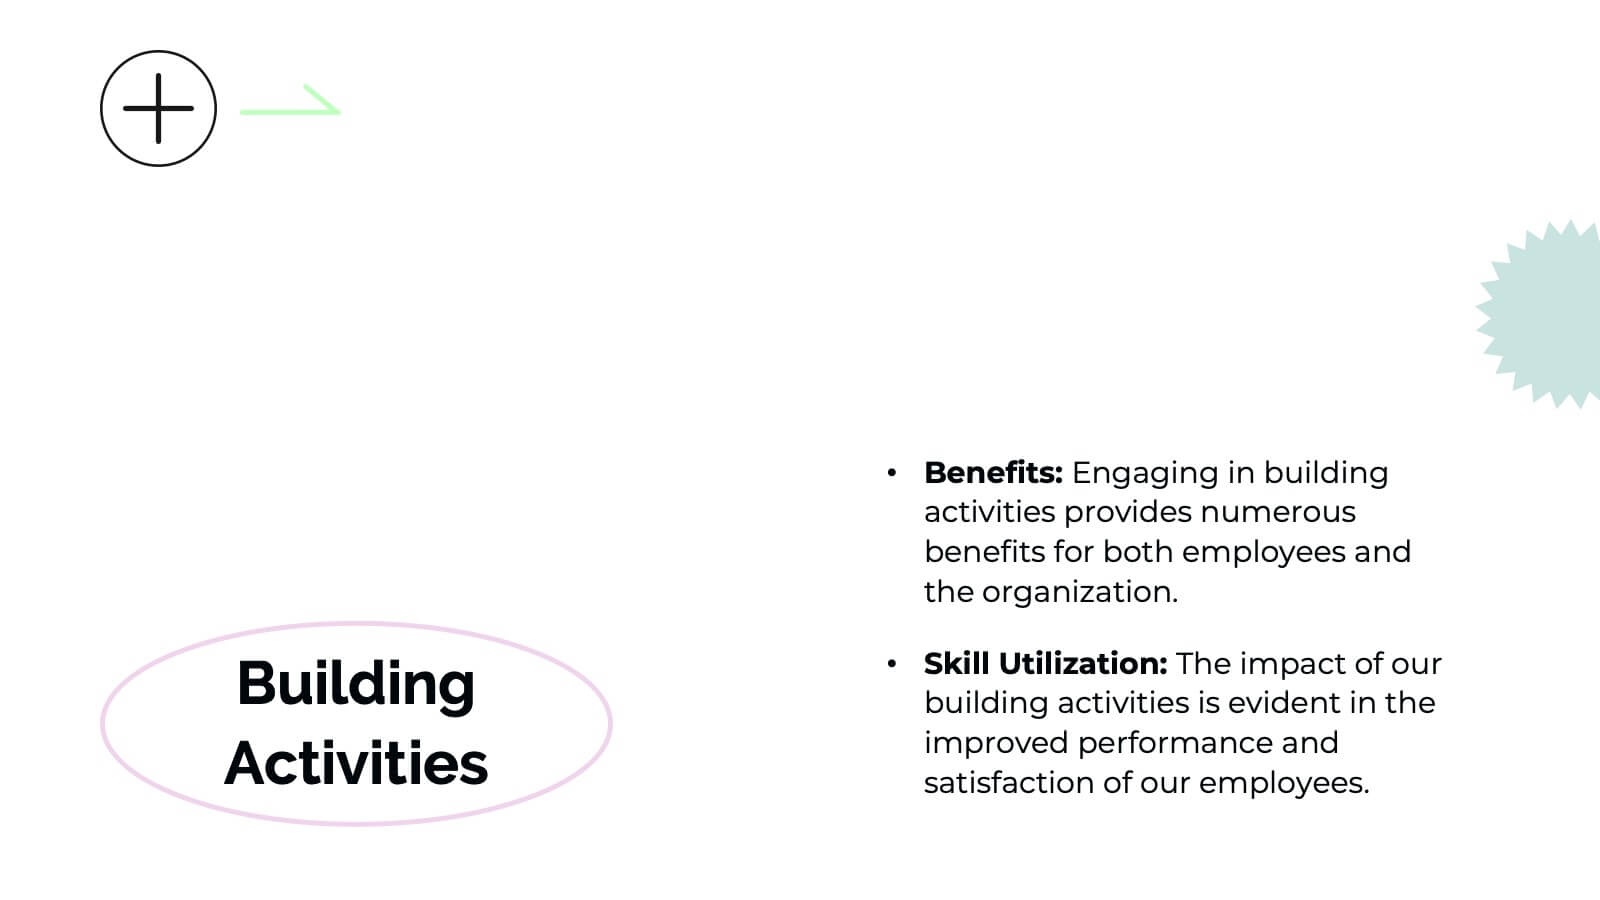
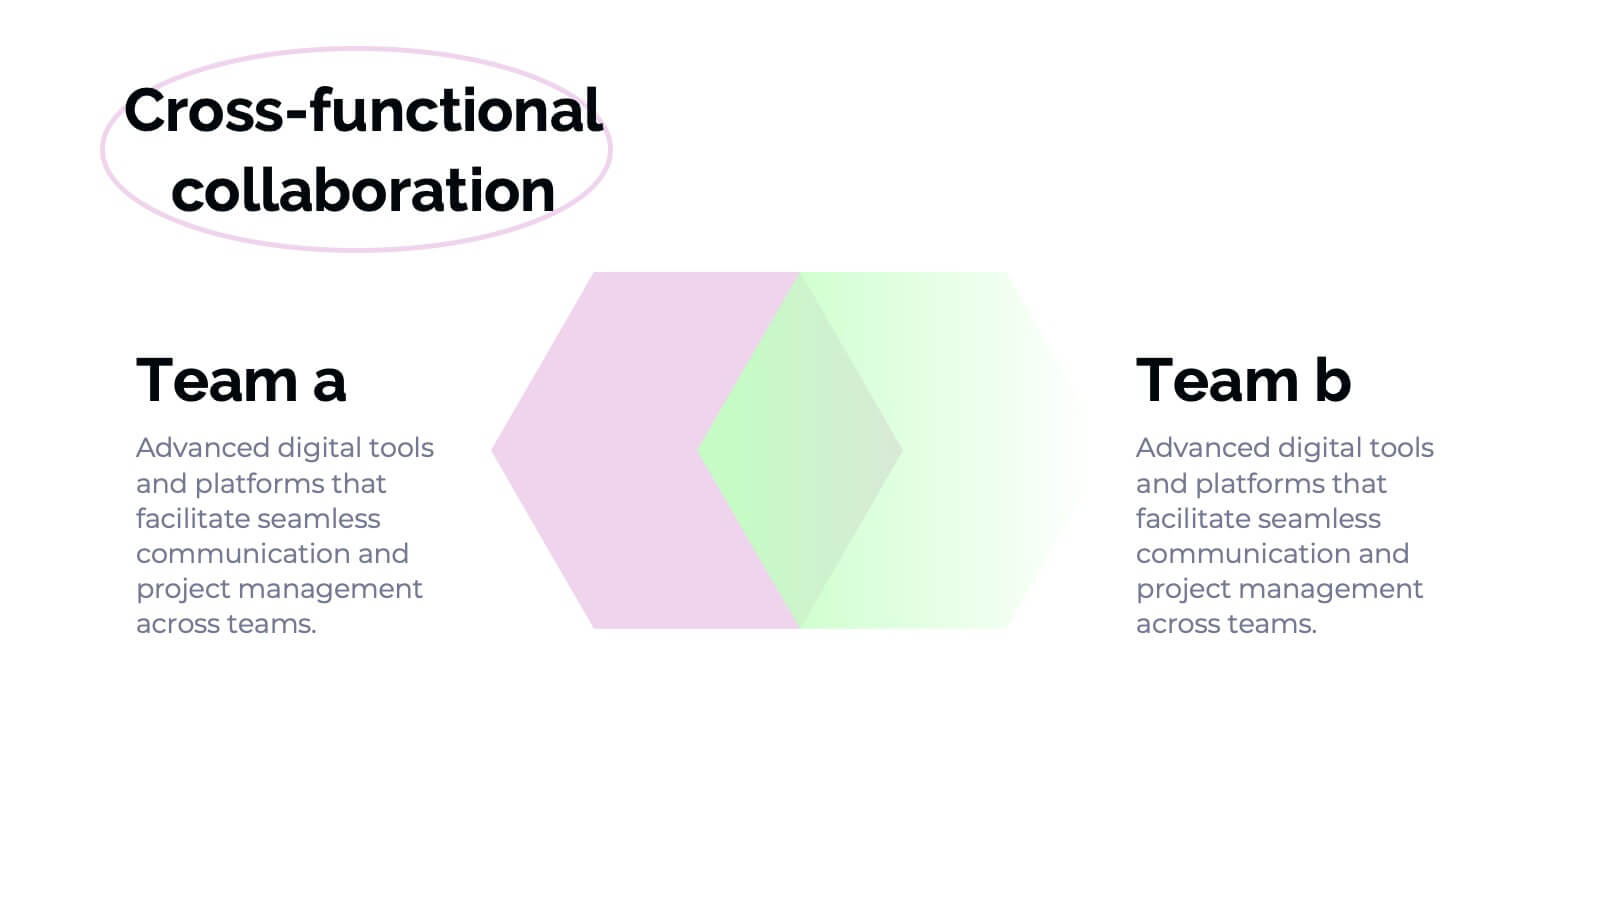
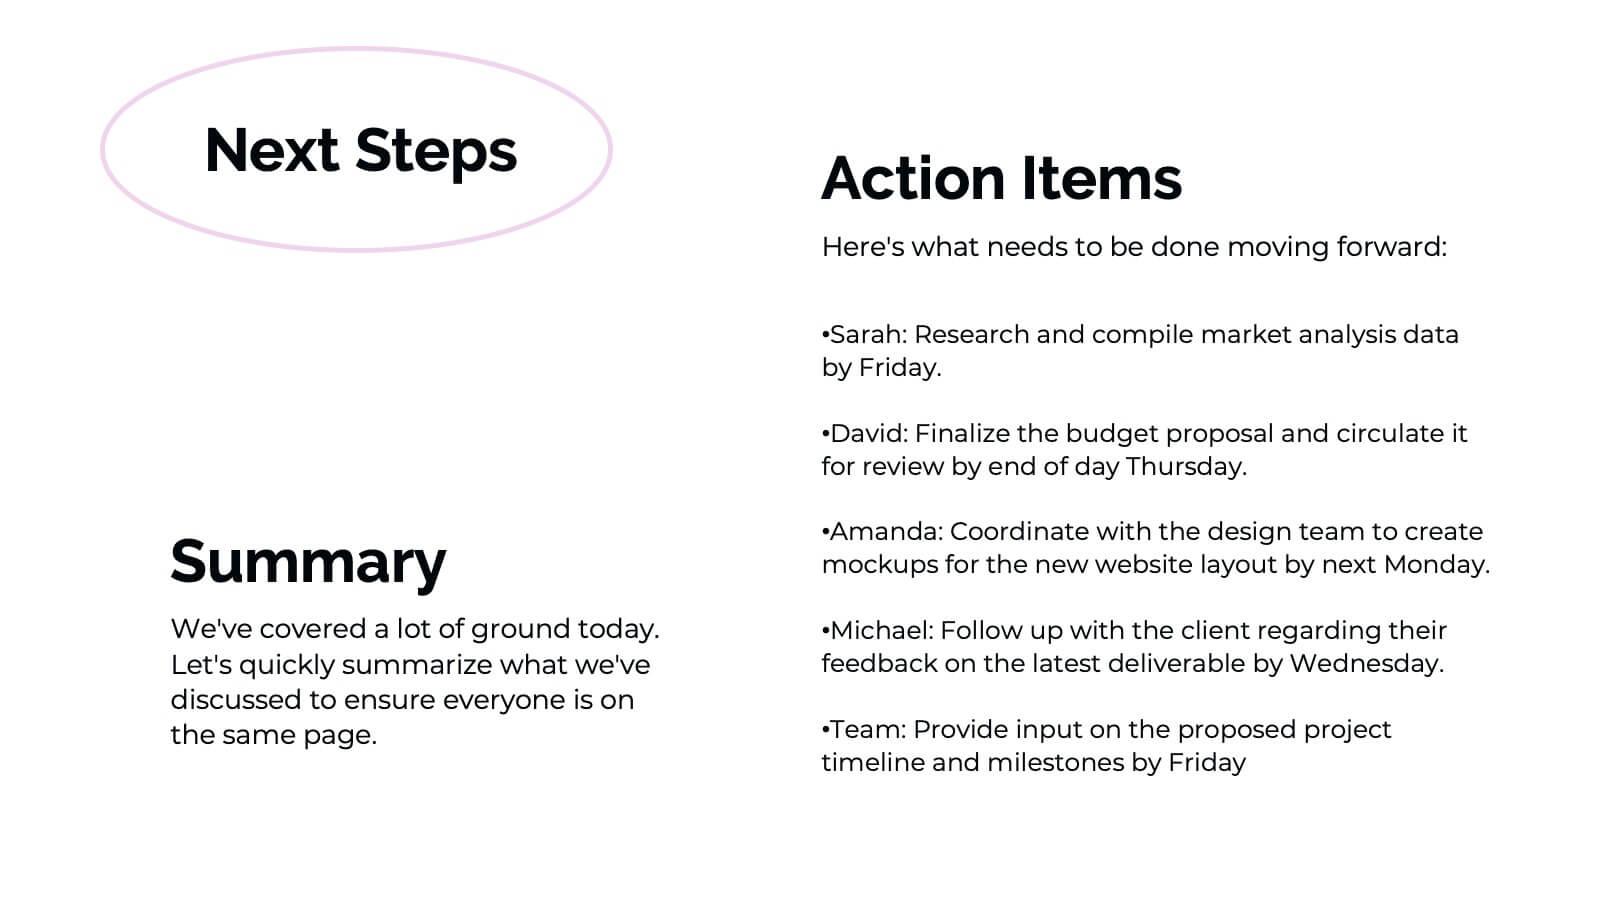
Banshee Business Operations Plan Presentation
Streamline your business operations with this comprehensive presentation template! From team updates and key achievements to challenges and solutions, every aspect of your business plan is covered. Ideal for tracking performance metrics, resource allocation, and upcoming events, this design keeps your operations organized and efficient. Compatible with PowerPoint, Keynote, and Google Slides for seamless integration.