


Features
- 6 Unique Slides
- Fully editable and easy to edit in Microsoft Powerpoint, Keynote and Google Slides
- 16:9 widescreen layout
- Clean and professional designs
- Export to JPG, PDF or send by email


Do you have any questions?
Recommend


26 slides
Solar Energy Company Profile Presentation
Step into the radiant world of solar energy, where the sun’s power promises a greener tomorrow. This playful, vibrant template, painted in refreshing shades of green and light tan yellow, encapsulates the joy and promise of renewable energy. Decked with sun-kissed graphics, spirited icons, and illuminating image placeholders, it brings the power of solar to the forefront. Effortlessly adaptable to Powerpoint, Keynote, or Google Slides. A ray of sunshine for green startups, environmental educators, energy consultants, or anyone eager to spread the word about solar solutions. Illuminate your ideas; let the power of the sun shine through.


7 slides
Business Model Canvas Segments Infographic Presentation
The Business Model Canvas is a strategic management and entrepreneurial tool that helps businesses to visualize, analyze, and develop their business models. This template gives you the ability to create a visually attractive infographic while presenting your business model in a professional format. This eye-catching template is made to help your audience visualize the business model you are presenting and easily follow it with the instructive text slides. Customize this template in just a couple of minutes. Simple and easy to use, ready to be edited with colors and graphics of your choice.


5 slides
Organic Search Growth Plan Presentation
Grow your visibility the natural way with this sleek and easy-to-follow organic strategy slide. Perfect for outlining SEO goals, keyword clusters, and growth tactics, this visual layout makes your presentation clean and compelling. Fully compatible with PowerPoint, Keynote, and Google Slides for flexible editing across platforms.


5 slides
Sustainable Development Goals Deck Presentation
Present your sustainability roadmap with clarity using the Sustainable Development Goals Deck. Designed for highlighting eco-initiatives, circular strategies, and responsible development objectives. The circular layout supports goal-based narratives and strategic breakdowns. Fully editable in PowerPoint, Keynote, and Google Slides—ideal for ESG reports, environmental pitches, or CSR presentations.


8 slides
Value Chain Optimization and Analysis Presentation
Streamline Your Business for Maximum Efficiency with this Value Chain Optimization and Analysis presentation template. This visually engaging template is designed to map, analyze, and enhance the key activities in your value chain, helping businesses identify opportunities for cost reduction, performance improvements, and strategic advantages. Featuring a clean flowchart layout, intuitive color-coded sections, and editable placeholders, this template is ideal for business analysts, consultants, and executives. Fully compatible with PowerPoint, Keynote, and Google Slides, ensuring seamless customization and professional delivery.


6 slides
Business Milestone Timeline Presentation
Showcase key achievements and future goals with the Business Milestone Timeline Presentation. This visually engaging template allows you to highlight crucial company events, project phases, or strategic plans in a clear, structured format. Ideal for corporate reporting, business growth tracking, and investor presentations. Fully customizable and compatible with PowerPoint, Keynote, and Google Slides.


6 slides
Project Timeline Infographic Presentation
Streamline your workflow with this Project Timeline Infographic template. Perfect for visualizing milestones, tracking progress, and organizing tasks, this design is fully editable to suit any project needs. Adjust colors, icons, and text effortlessly. Compatible with PowerPoint, Keynote, and Google Slides for smooth presentations and collaboration.


12 slides
Milestone Achievement Progress Map Presentation
Visualize progress with clarity using this dynamic Milestone Achievement Progress Map. Each slide combines bar charts and upward arrows to showcase key accomplishments, performance phases, or goal tracking. With three customizable titles and color-coded segments, this layout is perfect for project updates, strategy reviews, or performance recaps. Fully editable in PowerPoint, Keynote, and Google Slides.


7 slides
Idea Clustering Mind Map Presentation
Great ideas become clearer when you can see how everything connects, and this presentation makes that process effortless. It helps you organize thoughts, group related concepts, and visually map creative themes for planning or strategy discussions. Clean, modern, and easy to customize. Fully compatible with PowerPoint, Keynote, and Google Slides.


8 slides
End-to-End Project Lifecycle Management Presentation
Visualize each phase of your project lifecycle with this clean, circular flow layout. Ideal for showcasing planning, execution, and delivery stages in a structured loop. Each segment is fully editable to match your content. Compatible with PowerPoint, Google Slides, and Keynote for effortless customization and professional results.


5 slides
Risk Coverage and Claims Process Presentation
Visualize your risk levels and claims procedures with this Risk Coverage and Claims Process slide. The thermometer-style graphic clearly represents stages of coverage or escalation. Ideal for insurance, compliance, or legal teams. Fully editable and compatible with PowerPoint, Keynote, and Google Slides to match your branding and workflow needs.


7 slides
Schedule Infographics Presentation Template
Featuring our Schedule Infographic template, this is a great tool for business owners, students and others who need to create an impactful presentation. Using this template will ensure that your main point is emphasized and can be easily understood by all of your viewers. This template includes different colors and fonts that can be easily edited and changed. This will help you visualize your existing data and create a presentation that includes all of your points. Use this template to make a professional and smart looking schedule, and present your plan to others in an easy to understand way.


31 slides
Astralis Brand Strategy Report Presentation
Present your brand strategy effectively with this well-structured presentation template. This comprehensive design covers all essential aspects, including vision and positioning, identity components, brand guidelines, and touchpoints. It is perfect for showcasing how your brand stands out, communicates, and connects with its audience. Highlight your unique selling points, ensure visual consistency with color palettes, and emphasize your brand's voice through tailored sections. This template is easy to customize and works seamlessly across PowerPoint, Google Slides, and Keynote, ensuring accessibility for all. Empower your brand strategy discussions with a professional and polished design.


4 slides
4-Quadrant Empathy Map Presentation
Dive into your audience’s mindset with a clean, structured layout that brings clarity to what they see, feel, hear, and do. This presentation helps teams understand user behavior and motivations with simple quadrant-based insights. Fully compatible with PowerPoint, Keynote, and Google Slides.


5 slides
Strategic Planning with OKRs Presentation
Optimize goal-setting with the Strategic Planning with OKRs presentation. This visually engaging template uses a trophy-inspired design to highlight key objectives and results, making it perfect for business strategy sessions, team alignment, and performance tracking. Fully customizable and compatible with PowerPoint, Keynote, and Google Slides for seamless use.


26 slides
Dariux Presentation Template
Travel is one of the most popular themes for businesses, Dariux template is the perfect solution for presentations on travel and tourism. It's tan and blue background makes the right graphical impression and photo templates with a simple but fun design make your presentation perfect. Colorful charts and an animation will make your presentation livelier as well as attract more attention in the audience's mind. Inside this template, you'll find a wealth of material for anything related to beach destinations and travel generally — there are even multiple slides dedicated to give you so many tips!

24 slides
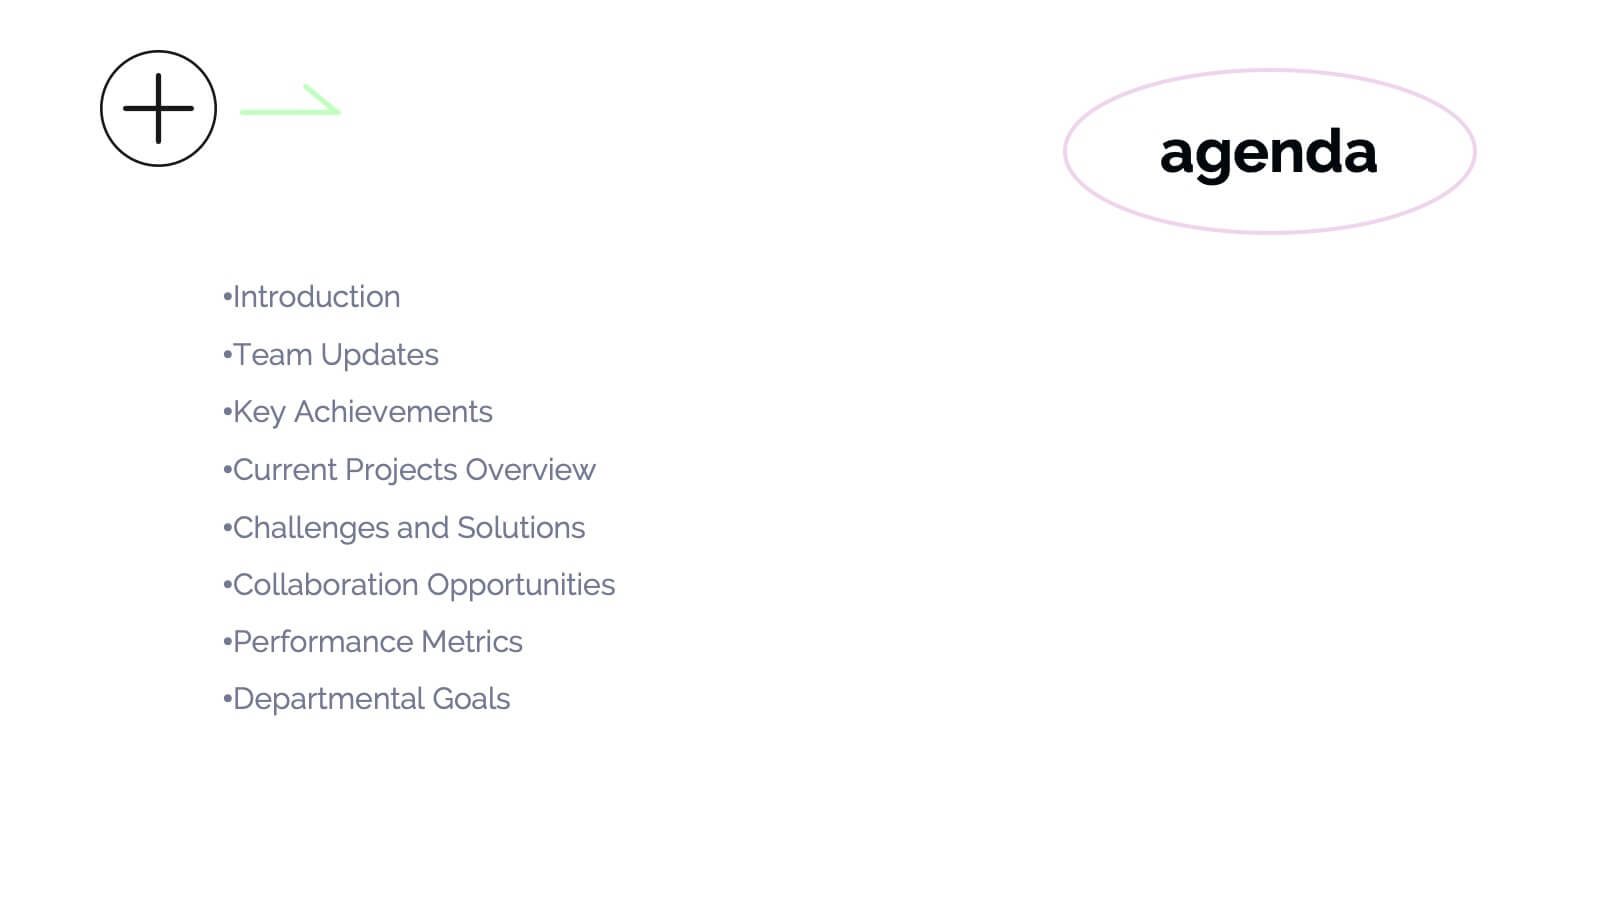
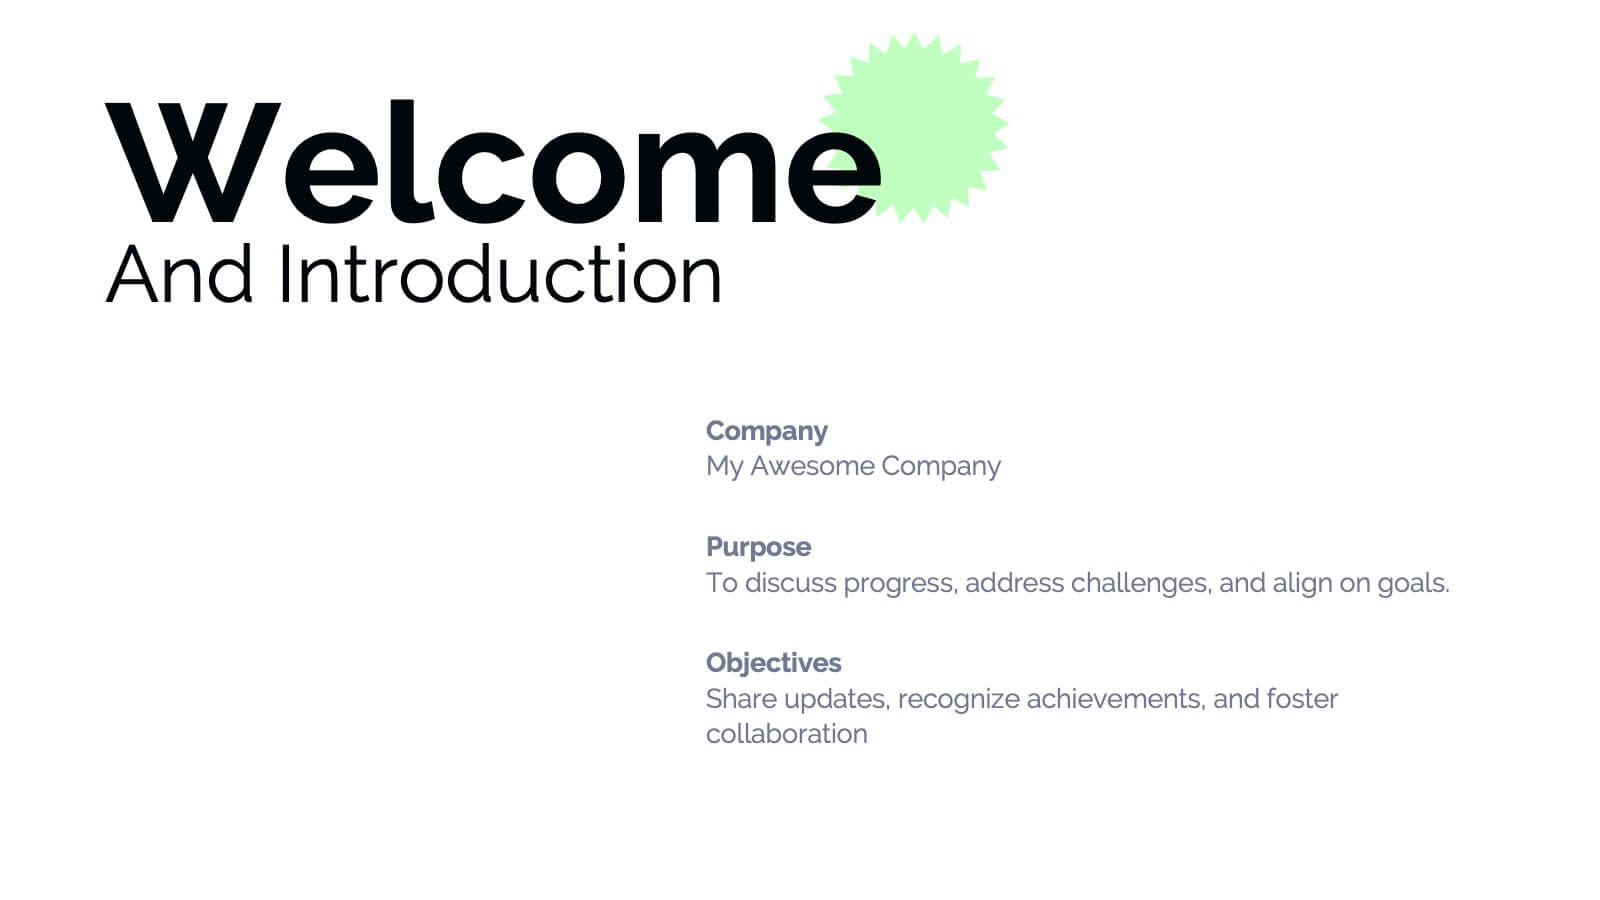
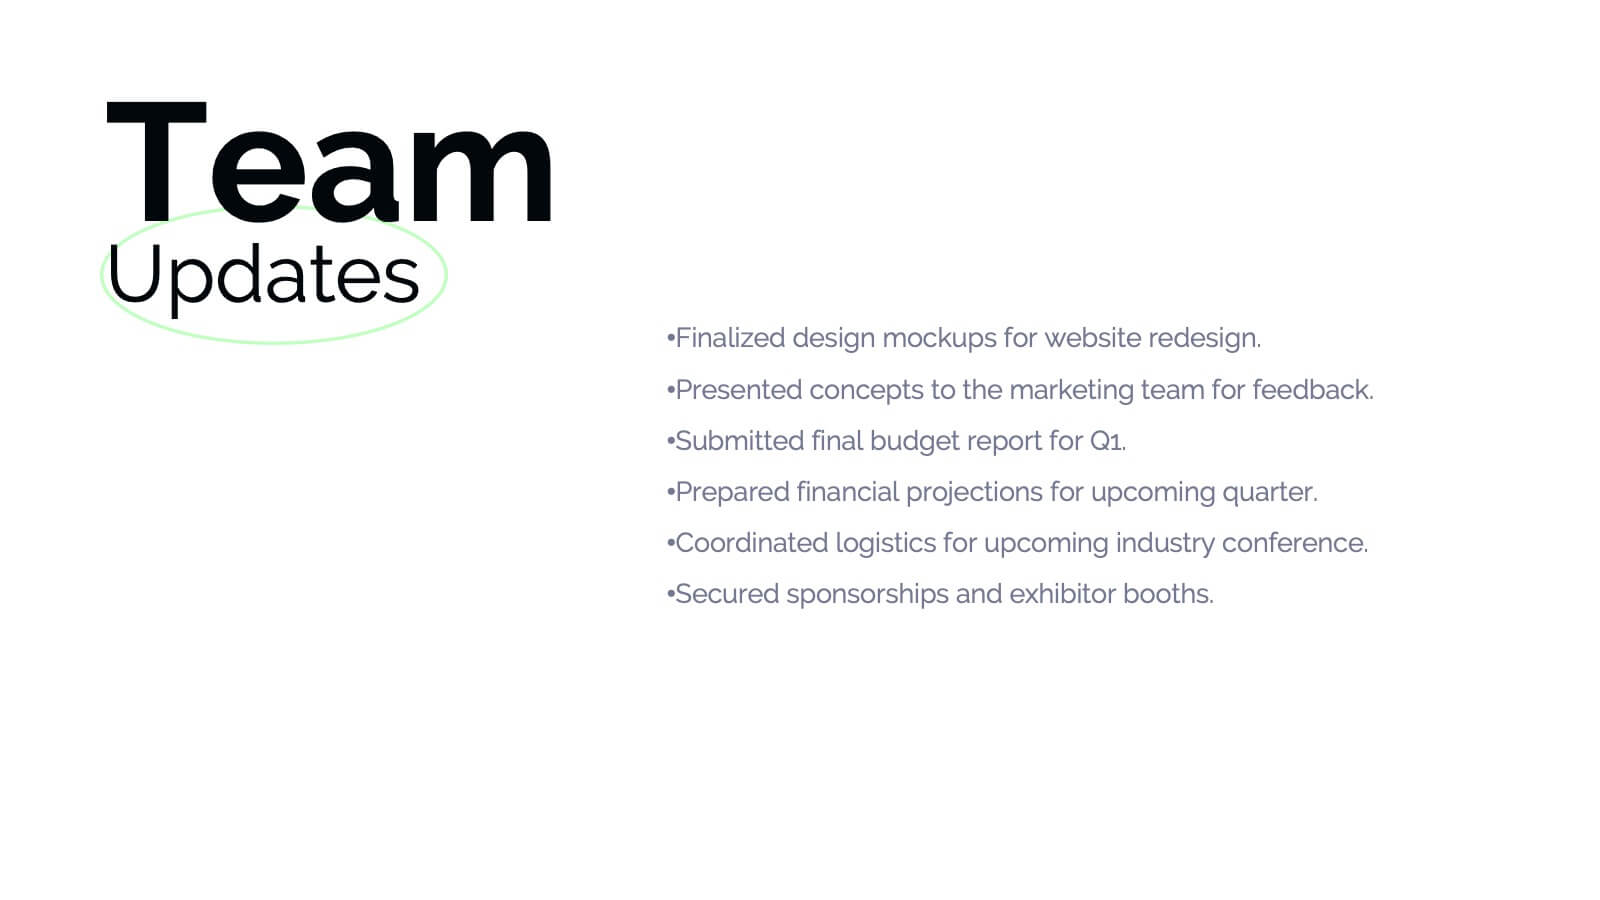
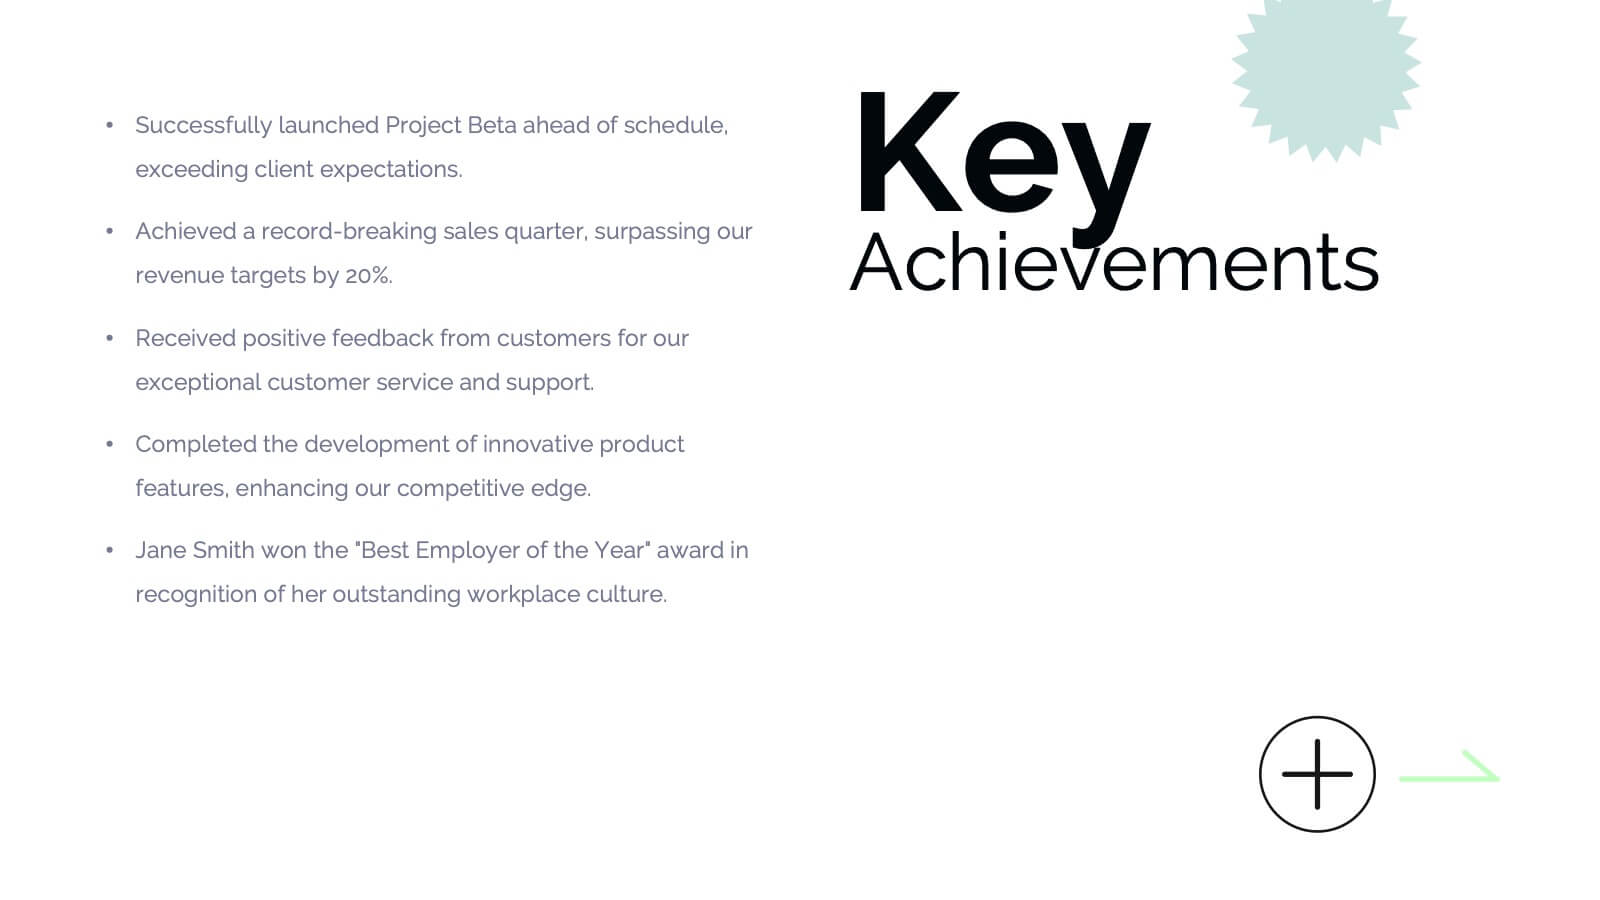
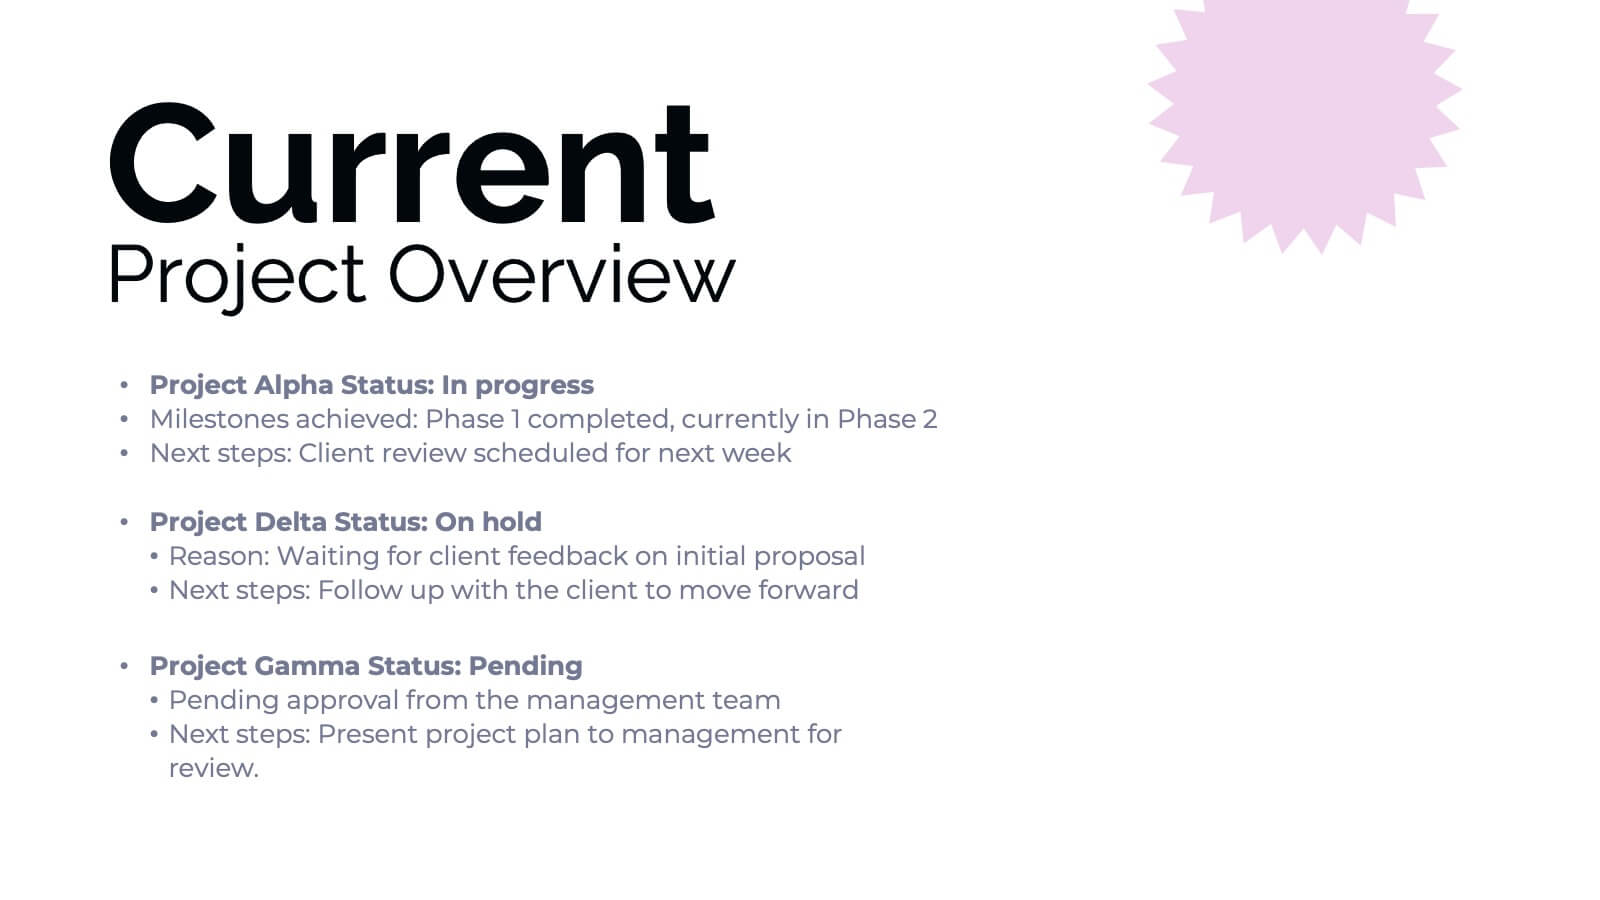
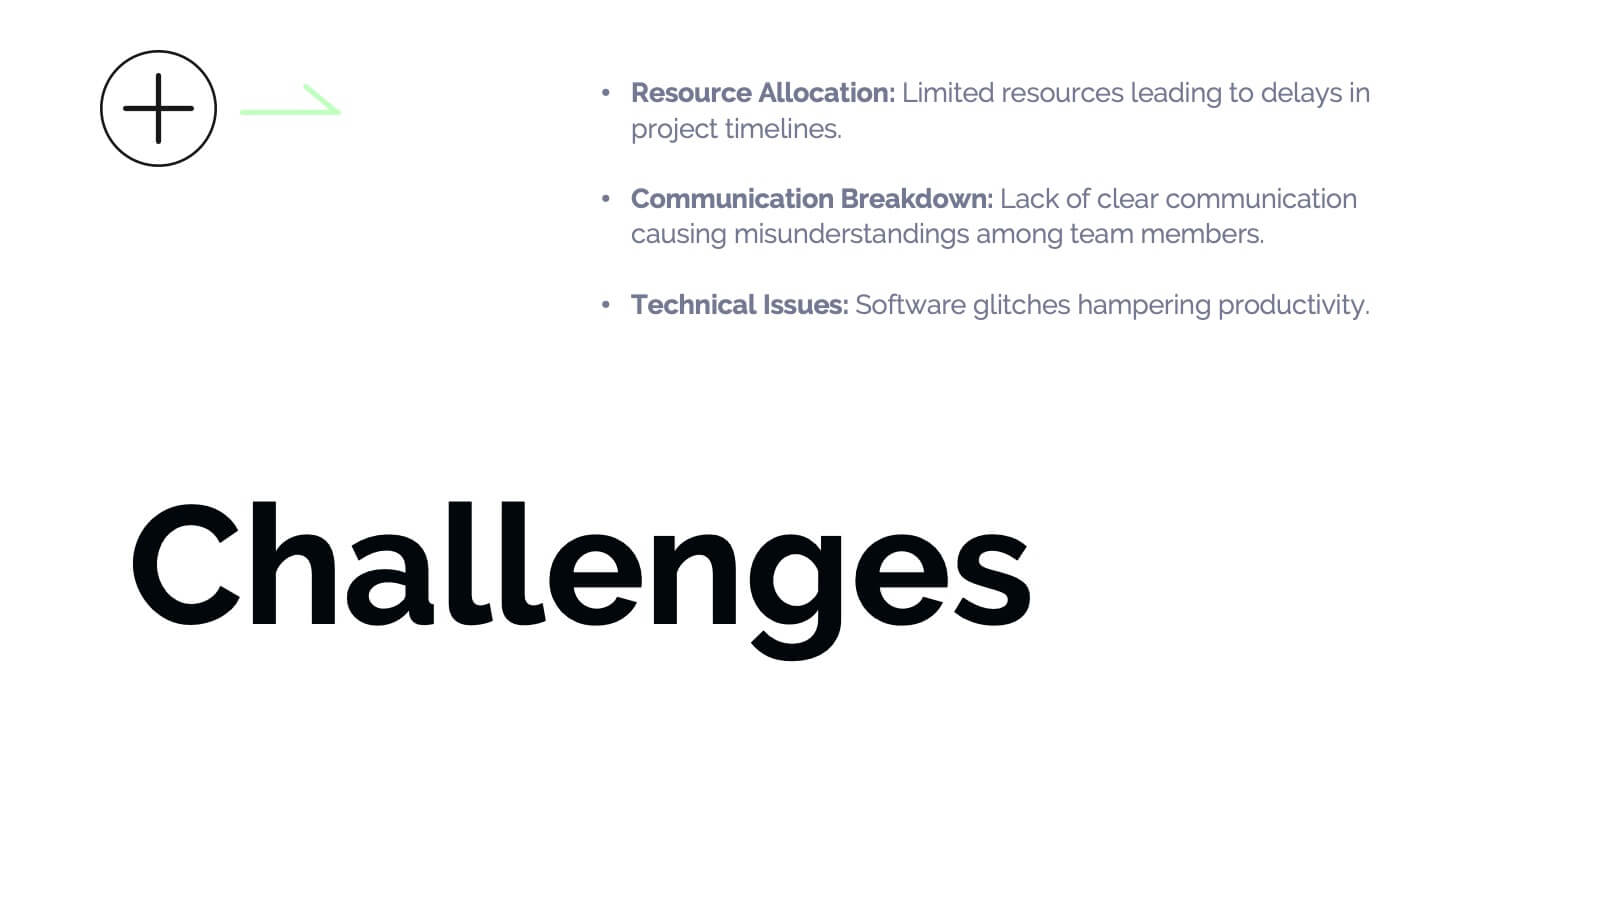
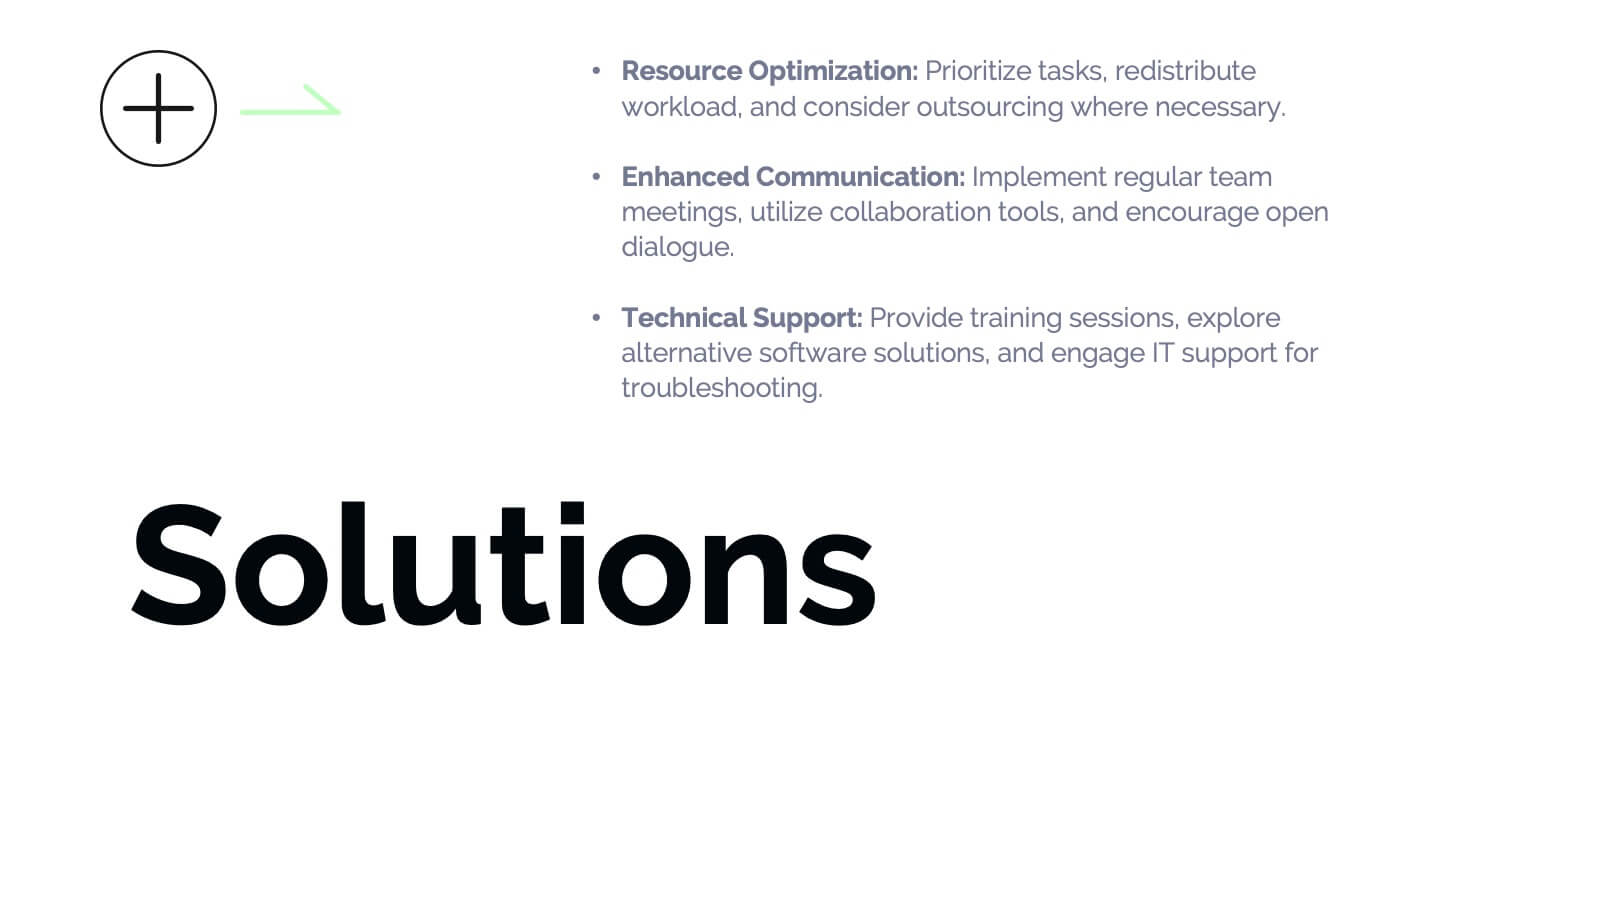
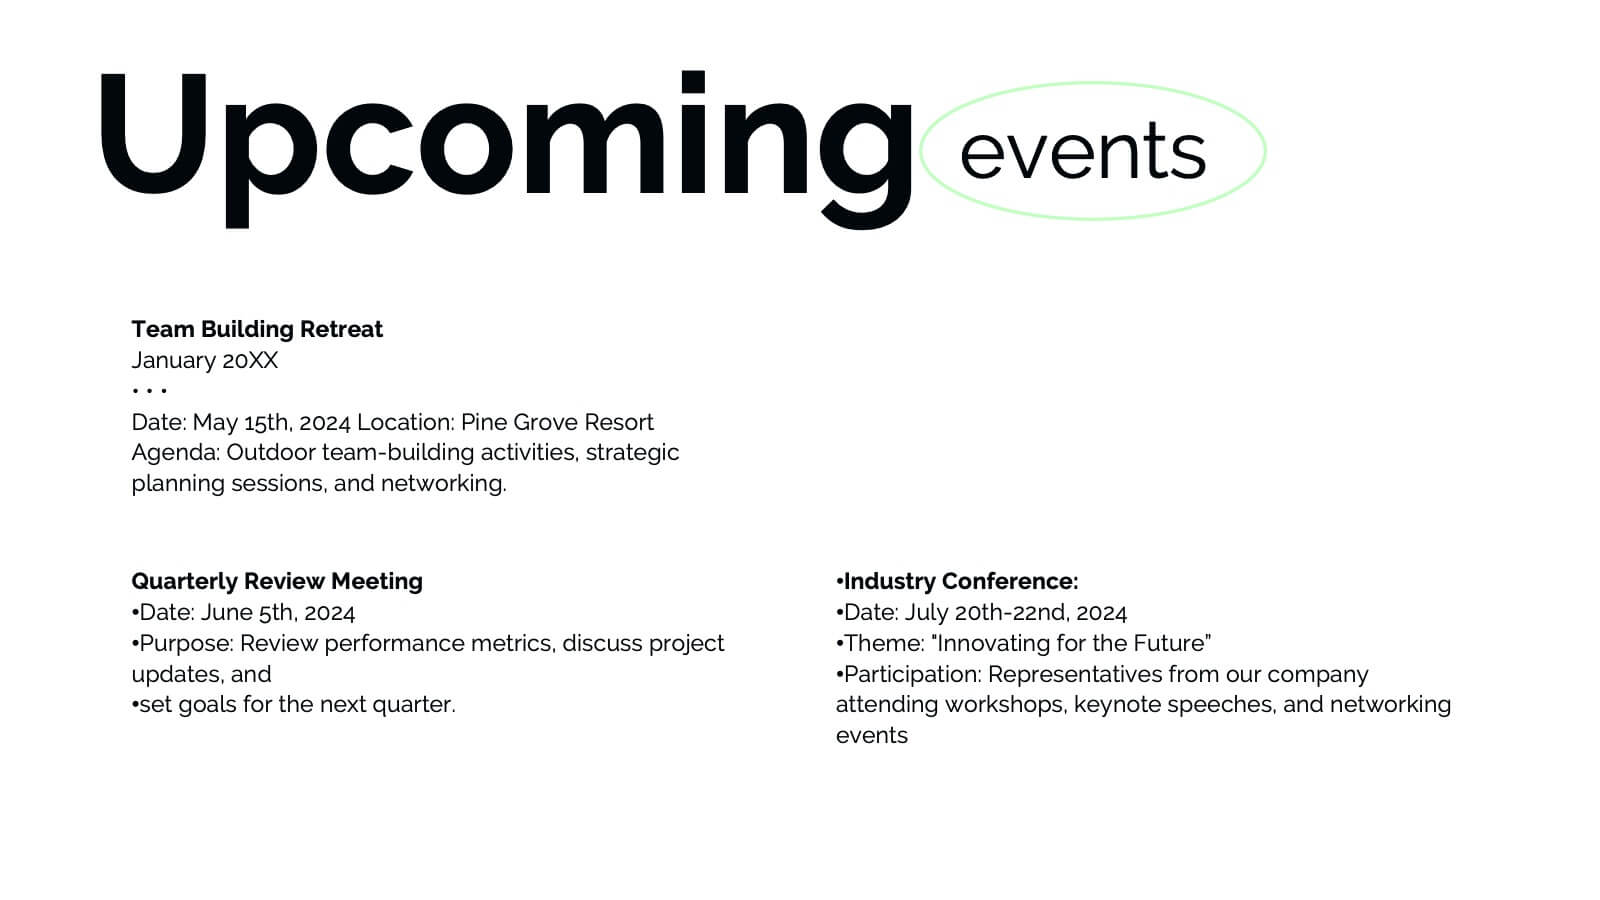
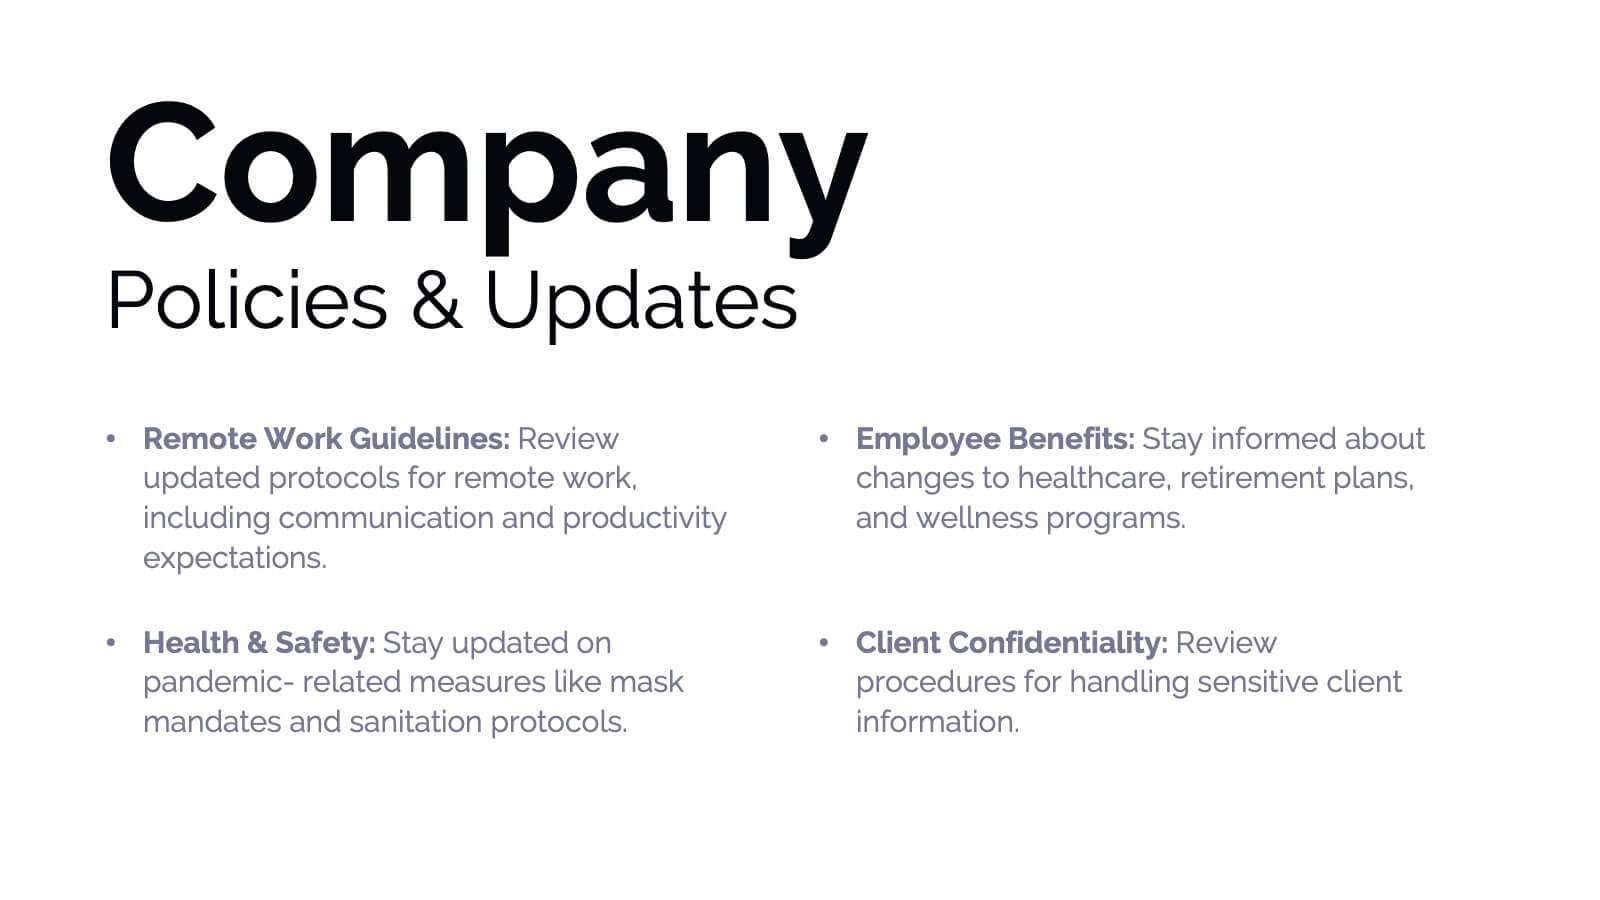
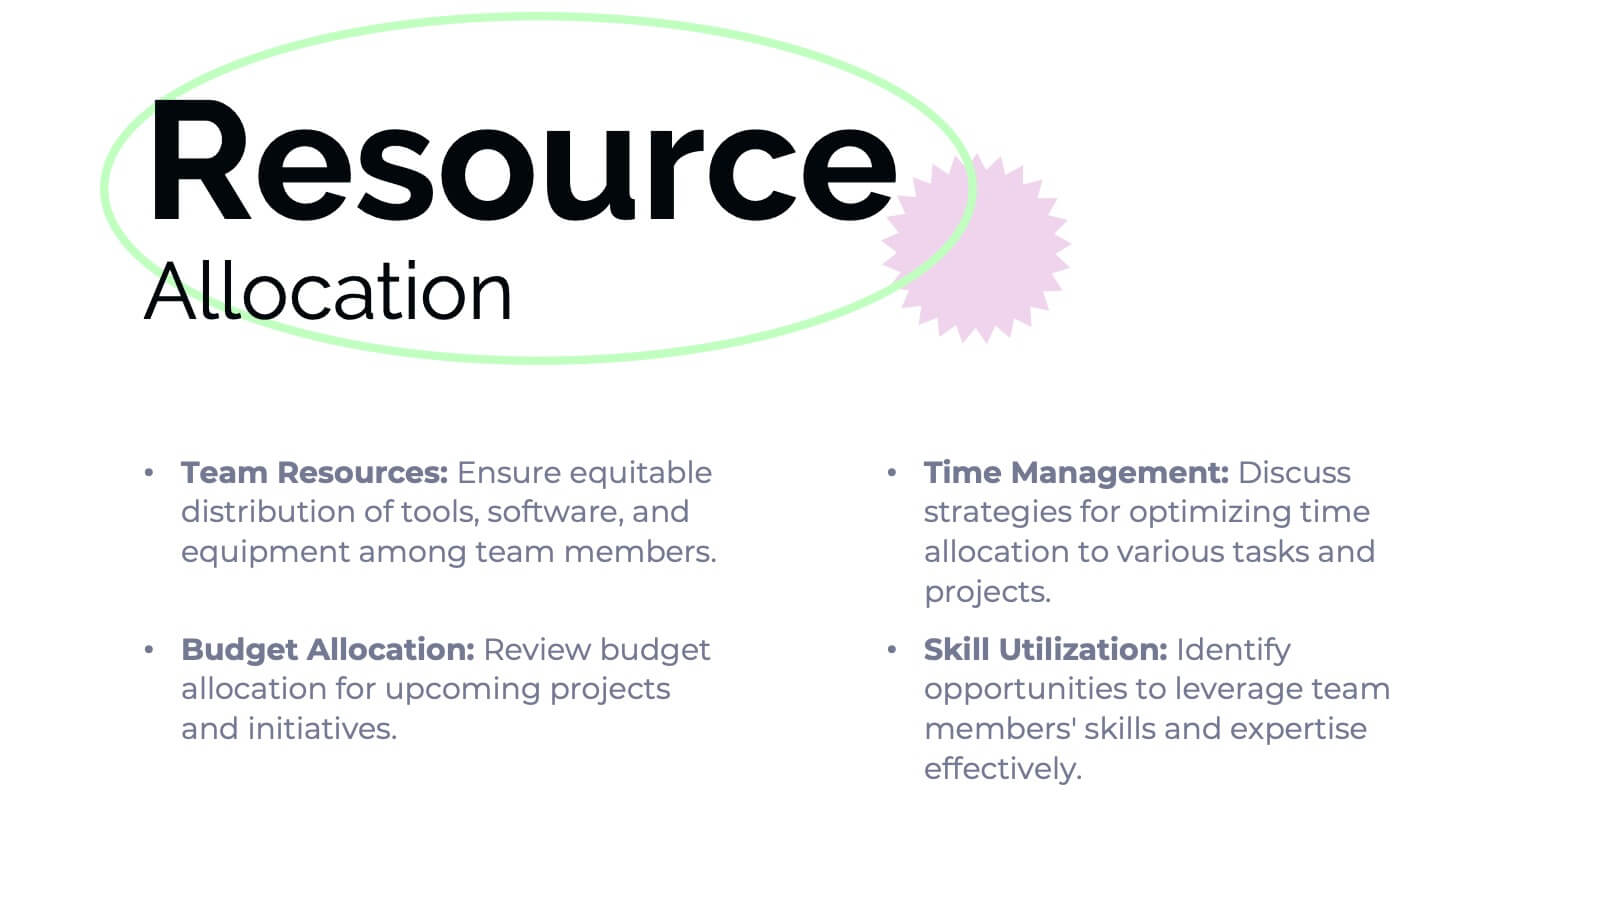
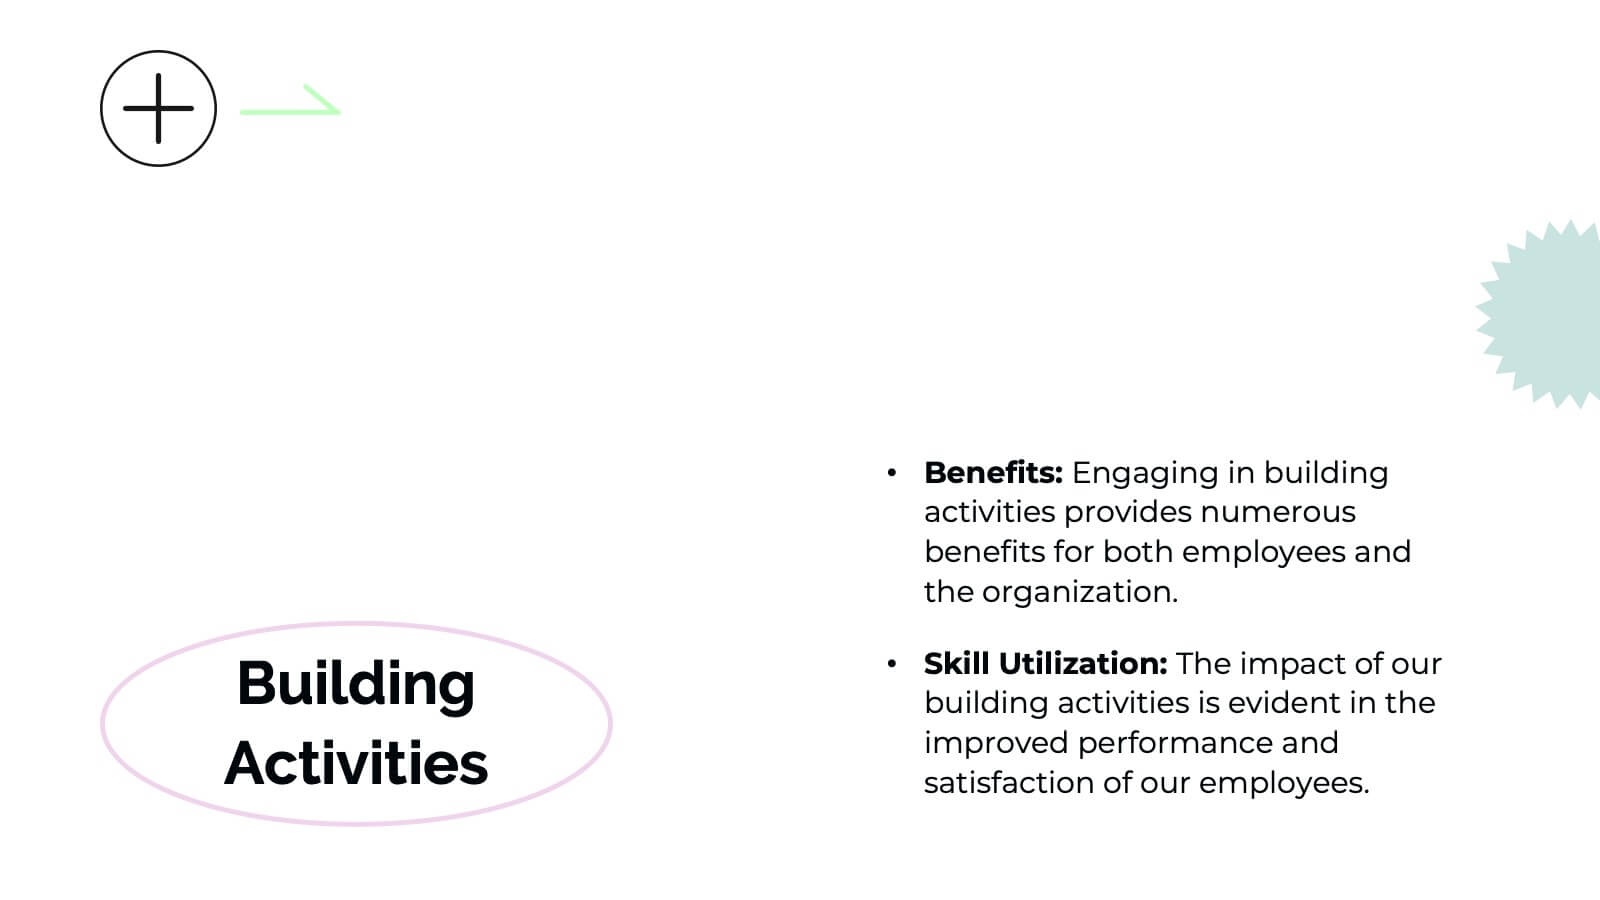
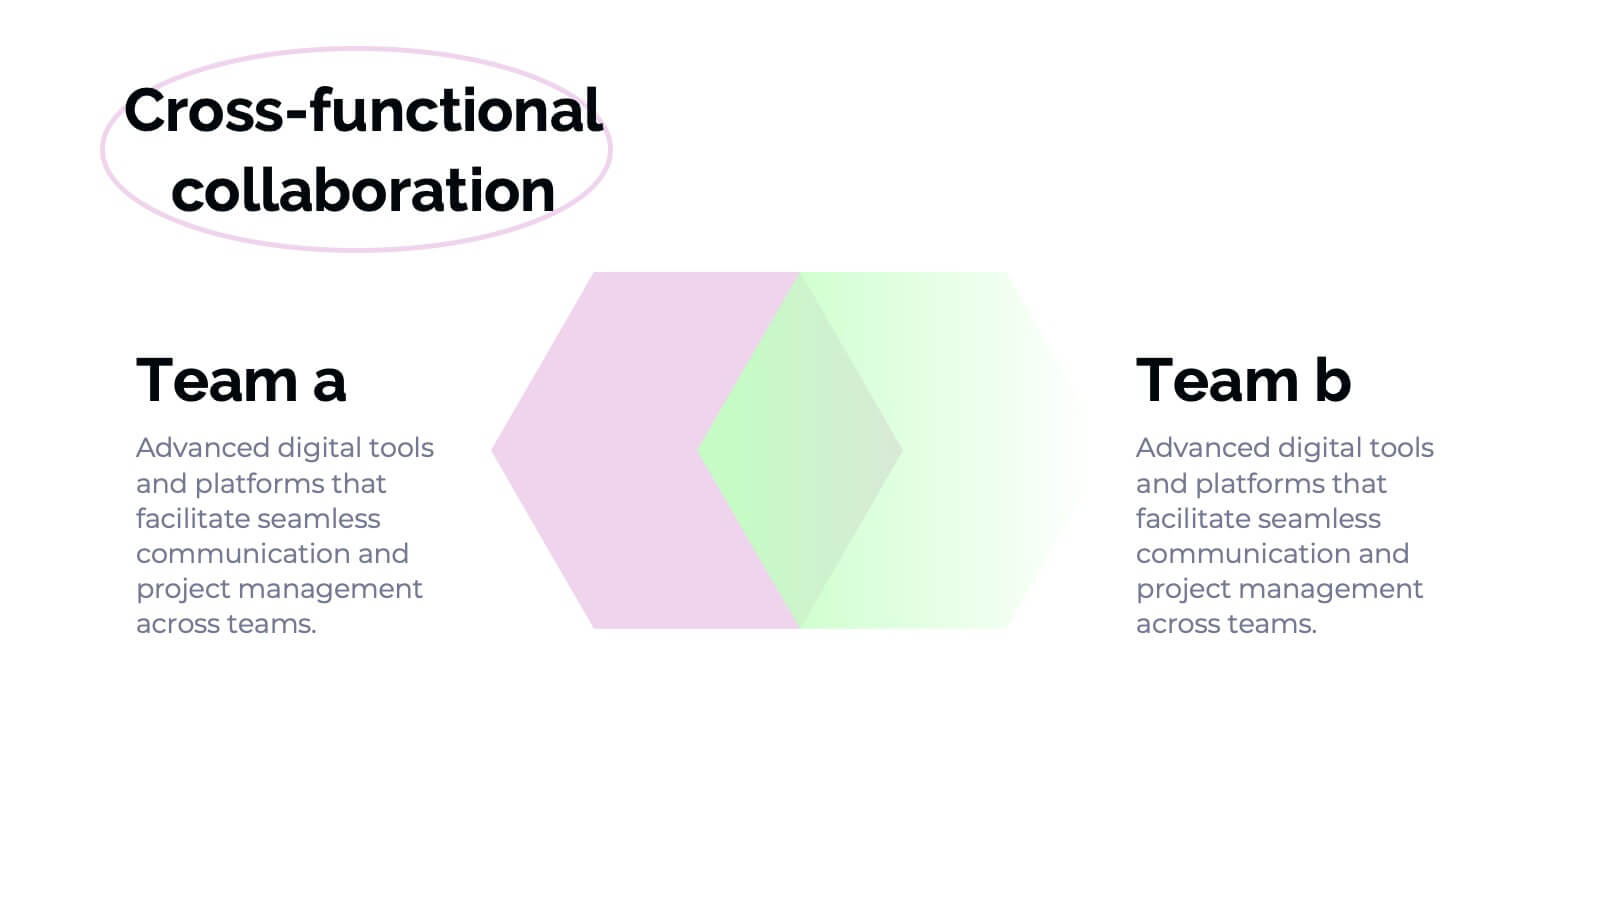
Banshee Business Operations Plan Presentation
Streamline your business operations with this comprehensive presentation template! From team updates and key achievements to challenges and solutions, every aspect of your business plan is covered. Ideal for tracking performance metrics, resource allocation, and upcoming events, this design keeps your operations organized and efficient. Compatible with PowerPoint, Keynote, and Google Slides for seamless integration.