


Features
- 3 Unique slides
- Fully editable and easy to edit in Microsoft Powerpoint, Keynote and Google Slides
- 16:9 widescreen layout
- Clean and professional designs
- Export to JPG, PDF or send by email


Do you have any questions?
Recommend


4 slides
Medical Research and Healthcare Trends Presentation
Stay ahead in the healthcare industry with the Medical Research and Healthcare Trends Presentation template. This structured layout highlights key statistics, research insights, and emerging trends in the medical field. Ideal for healthcare professionals, analysts, and policymakers, this fully customizable template is compatible with PowerPoint, Keynote, and Google Slides.


7 slides
Business Puzzle Infographic Presentation
A Puzzle Piece Infographic is great for visualizing and communicating complex topics, such as the order of steps to solve a problem or a methodical process. This template is great if you want to show your audience how different topics relate to each other, or if you want to illustrate how information fits together. This infographic will allow you to showcase your data and information in a fun, visual way. The puzzle design will help you organize information for your audience to easily understand. This template is compatible with Powerpoint, keynote and google slides, making it easy to edit!


5 slides
Mental Health Disorders Infographics
Mental Health Disorder Infographics play a crucial role in raising awareness, combating misinformation, and advocating for better mental health support. These Infographics are visual representations of information about mental health disorders. They include statistics, images, and text to provide information on the prevalence of these disorders, common symptoms, risk factors, and available treatments. These infographics are designed with the goal to raise awareness about mental health disorders and to help people better understand and identify the signs and symptoms of these conditions.


8 slides
Business Framework Strategy
Simplify your strategy breakdown with this layered, step-by-step infographic. Ideal for presenting three core pillars or stages of a business model, this layout highlights each section with a bold letter identifier (A, B, C), vivid icons, and space for supporting content. Fully editable in PowerPoint, Keynote, and Google Slides.


6 slides
Construction Project Management Infographic
Construction project management is the process of planning, organizing, and overseeing construction projects from inception to completion. This infographic template is designed to showcase the essential elements and processes involved in managing a construction project. It is a concise and easy-to-understand visual representation of key aspects that play a vital role in successful project execution. This provides an overview of the project's key elements, progress, and success factors. This visually appealing infographic helps in effective communication, decision-making, and project monitoring throughout the construction process.


6 slides
Transition Strategy for Change Implementation Presentation
Guide your audience through change with a clear roadmap using this transition strategy grid. Each step is mapped visually, making complex implementation plans easier to communicate and understand. Great for organizational development, team onboarding, or operational rollouts. Fully compatible with PowerPoint, Keynote, and Google Slides.


22 slides
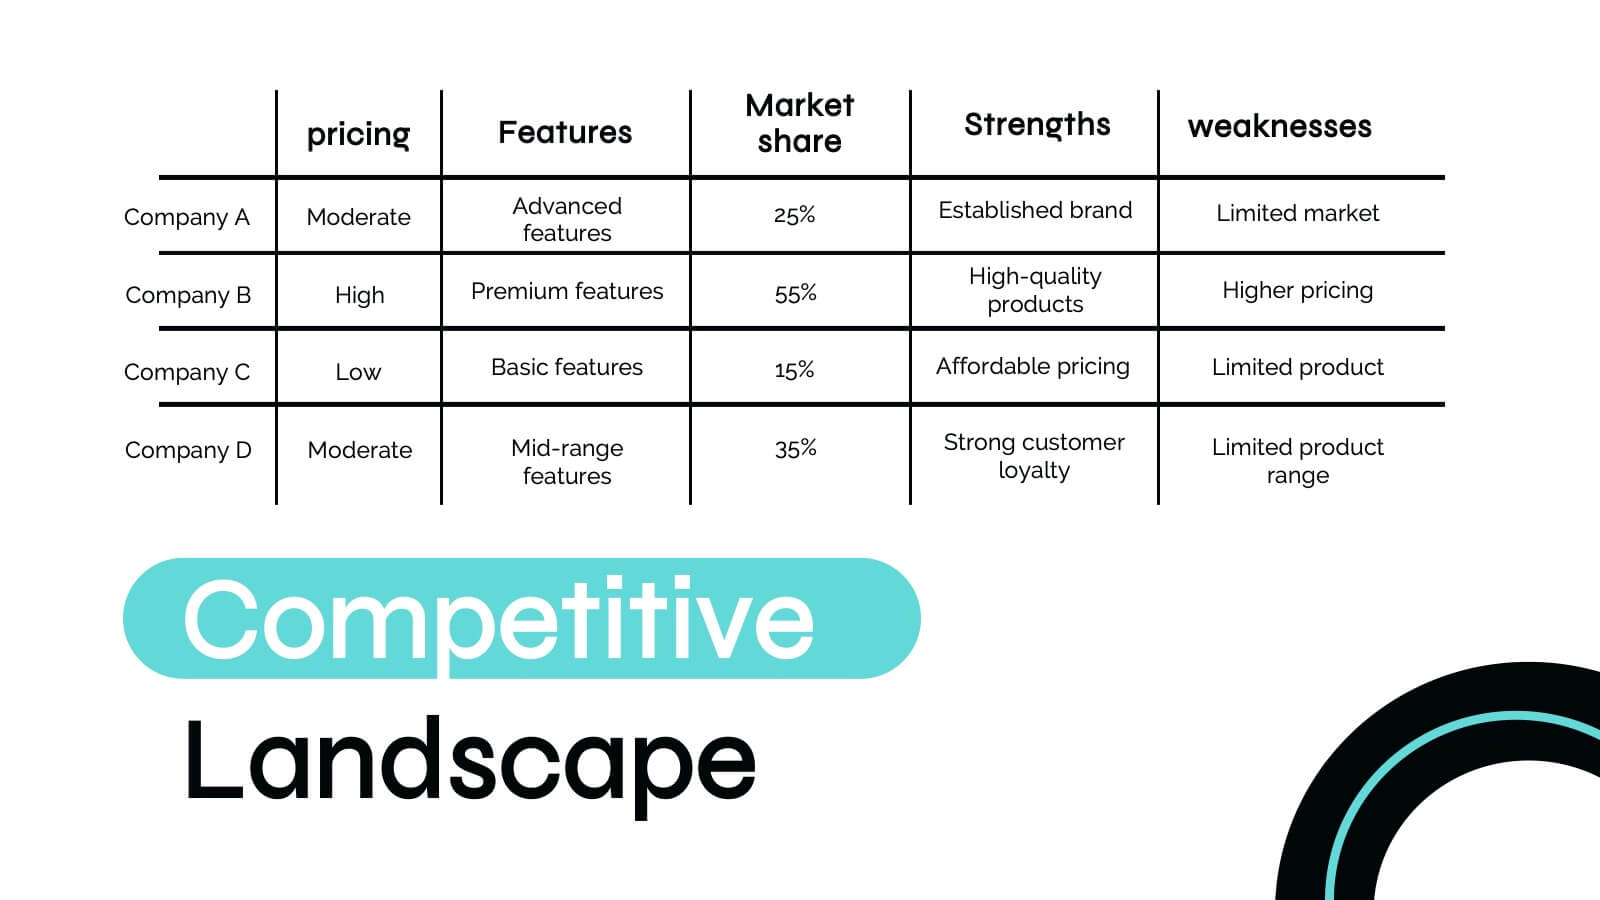
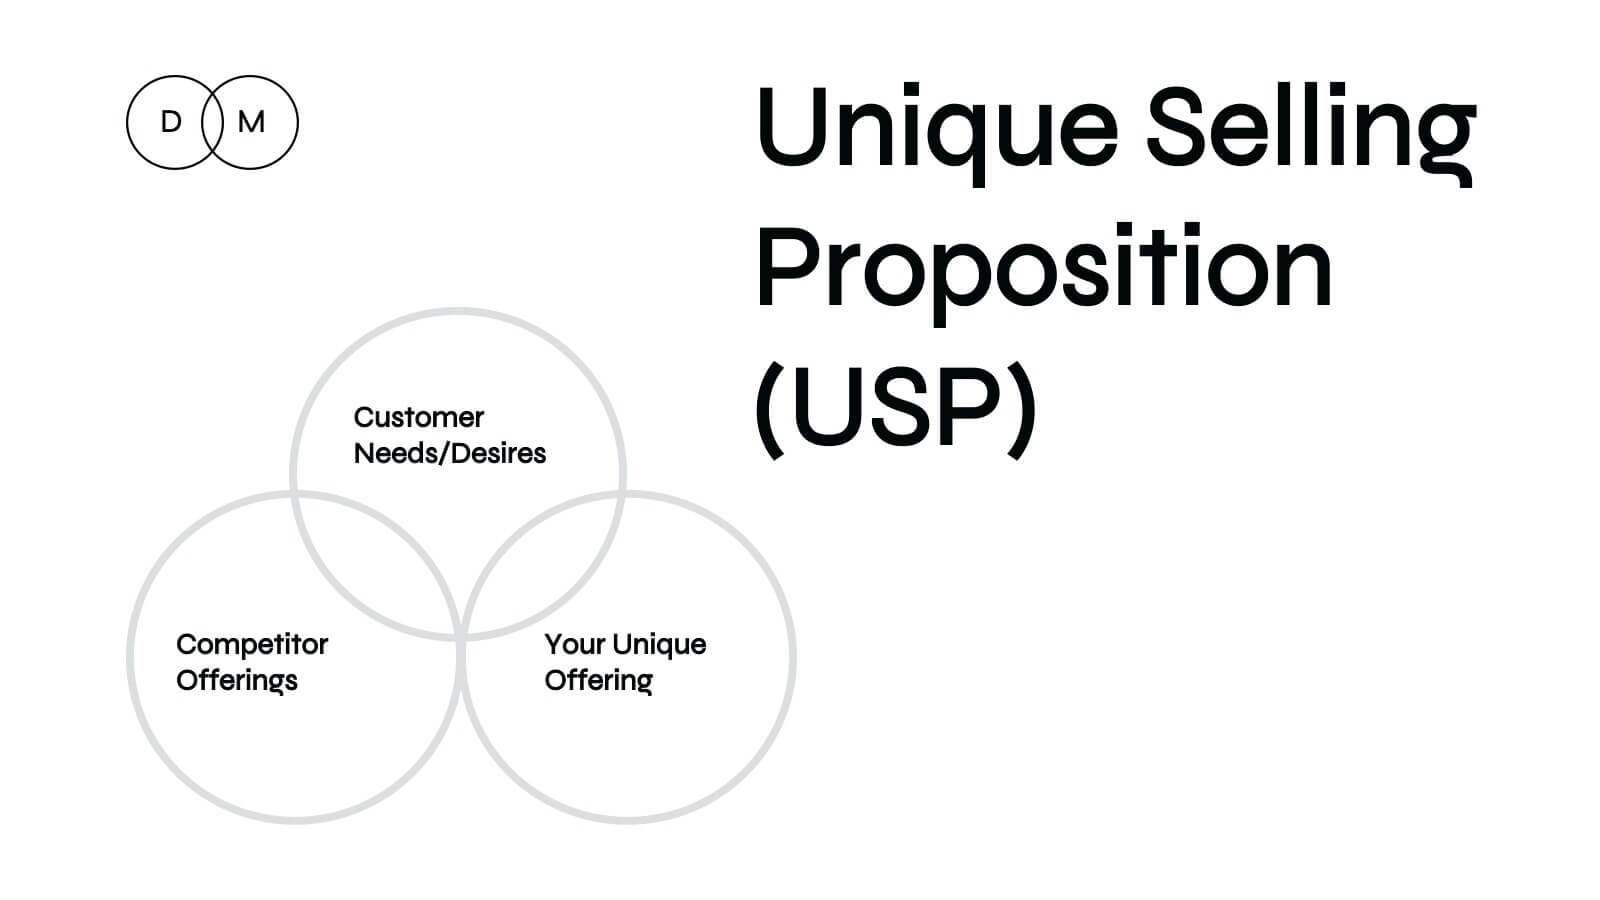
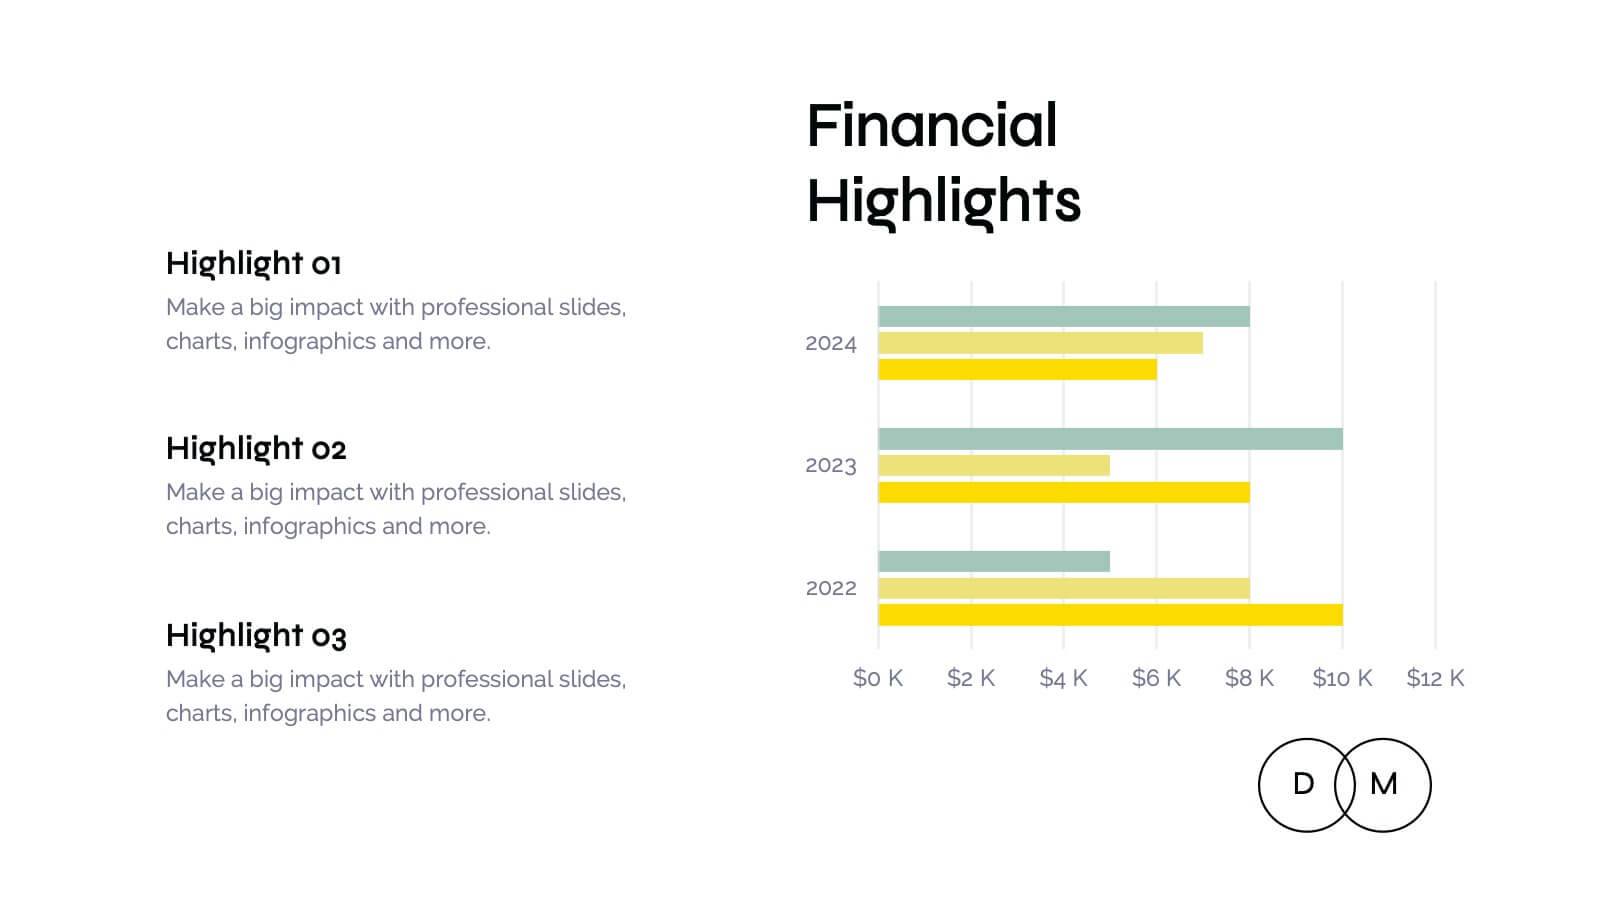
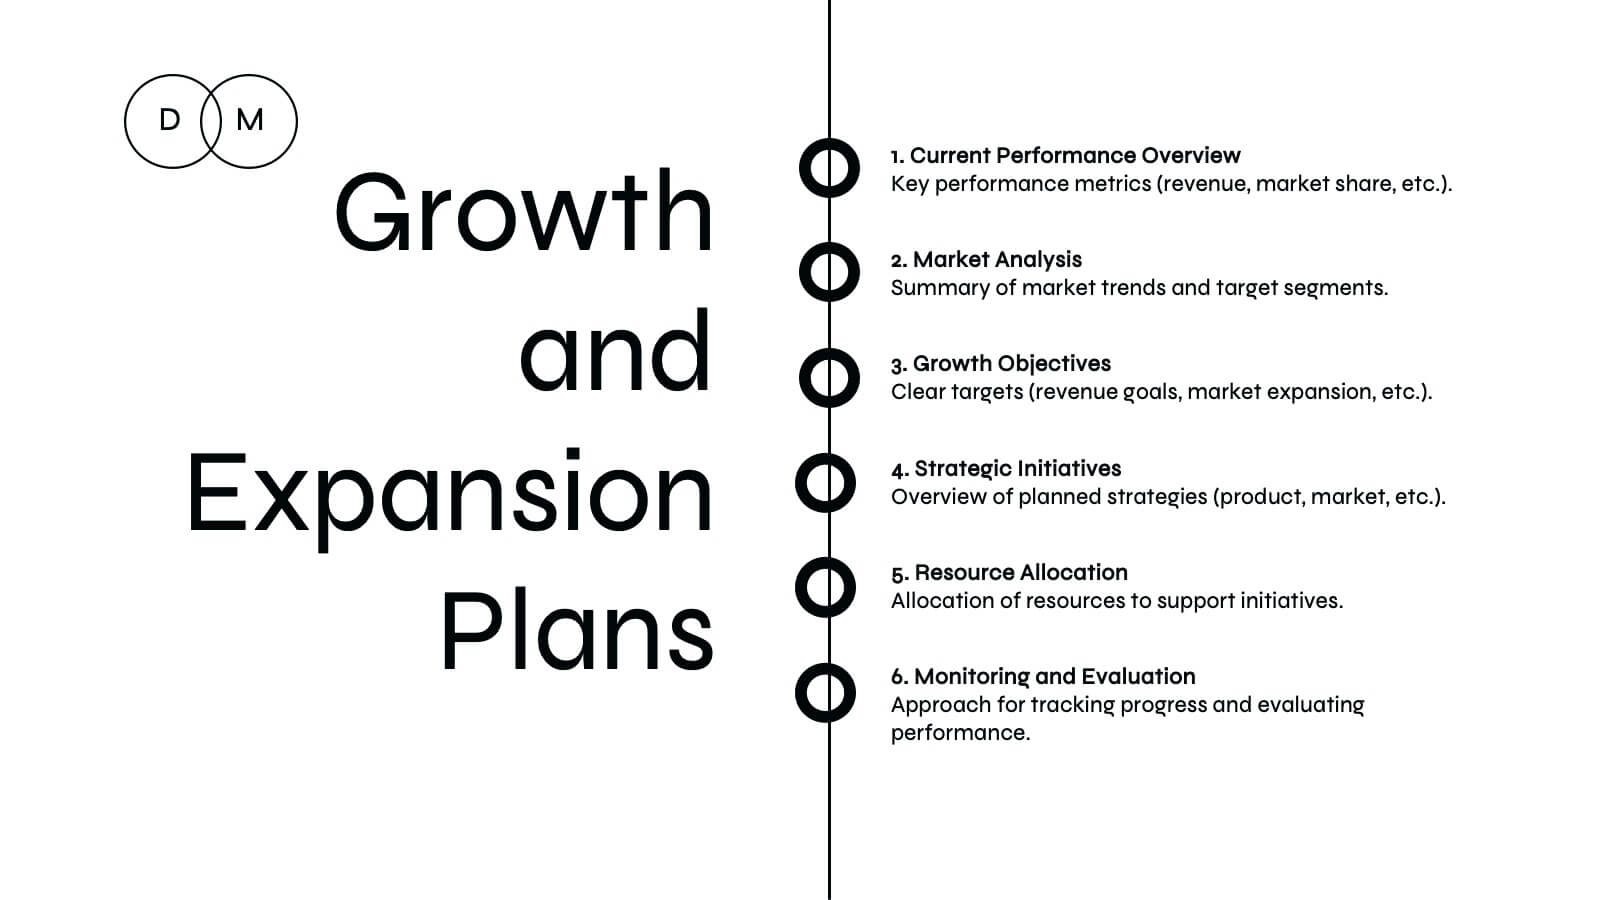
Hercules Digital Marketing Strategy Plan Presentation
Ignite your next marketing presentation with this bold, dynamic template that showcases every key element of your marketing strategy! From company history and target audience insights to competitive landscape analysis, this design makes presenting your marketing message a breeze. Perfect for professionals, it’s fully compatible with PowerPoint, Keynote, and Google Slides for seamless usage across platforms.


4 slides
Brain Function Breakdown Chart Presentation
Bring clarity to complex thinking with a visual layout that highlights key mental processes in a clean, engaging way. This presentation helps you explain cognitive functions, organize insights, and break down information into easy-to-follow sections. Perfect for education, training, or research. Fully compatible with PowerPoint, Keynote, and Google Slides.


7 slides
Relationship Infographics Presentation Template
Featuring our Relationship Infographic template, this provides the entire process of relationship building in its true form. This infographic will take you through the stages of building a relationship. This design is good for any purpose and can be used as a template for many presentations. Use this template to illustrate your ideas, put forward an argument, or make statistics and facts catchy. In this template, you’ll find everything you need to create a gorgeous relationship infographic. This is the perfect way to share your story and create an emotional connection with your audience.


6 slides
Future Trends in 5G Connectivity Presentation
Showcase the evolving landscape of mobile innovation with this modern 5G trends infographic. Featuring a central smartphone graphic and five vertically aligned icons, this slide is perfect for highlighting connectivity advancements, industry shifts, and upcoming opportunities. Color-coded markers enhance clarity for presentations on telecom, IoT, smart cities, and emerging tech. Fully editable in PowerPoint, Keynote, and Google Slides.


5 slides
How to Prevent Cyberbullying Infographics
Cyberbullying is a serious issue that can have detrimental effects on individuals' mental and emotional well-being. These vertical infographics provide essential information and tips for preventing cyberbullying. These are designed to raise awareness about the issue and educate individuals on how to effectively address and prevent cyberbullying incidents. The infographics feature a visually appealing design with attention-grabbing colors, icons, and illustrations. The engaging visuals are intended to capture the attention of the audience and convey the seriousness of the topic. The infographics offer practical tips and strategies for preventing cyberbullying.


8 slides
Professional Business Executive Summary Presentation
Make your insights stand tall with a bold, clean layout that feels like a data-driven story in motion. This executive summary slide is perfect for breaking down complex ideas into three clear steps, using sleek vertical bars to add visual rhythm. Compatible with PowerPoint, Keynote, and Google Slides for easy editing.


5 slides
Quality Control with Six Sigma Strategy Presentation
Showcase your quality control framework using the Quality Control with Six Sigma Strategy Presentation. This modern layout highlights each stage of the DMAIC process in a visually engaging format, ideal for Lean Six Sigma teams and continuous improvement professionals. Fully customizable in PowerPoint, Keynote, Canva, and Google Slides.


5 slides
Statistical Insights for Business Growth Presentation
Showcase key business statistics with impact using this radial chart-style presentation slide. Ideal for visualizing growth percentages, progress tracking, or survey results, this design helps break down five distinct insights with matching callouts. Perfect for analytics reports, performance dashboards, and stakeholder updates. Fully customizable in PowerPoint, Keynote, and Google Slides.


10 slides
Body System Educational Overview Presentation
Dive into anatomy with a slide that makes learning the human body visual, clear, and interactive. This educational overview breaks down key body systems into simple, labeled sections—perfect for classroom teaching, medical training, or health awareness campaigns. Fully editable and compatible with PowerPoint, Keynote, and Google Slides for seamless customization.


7 slides
North America Map Infographic Presentation Template
North America is a continent entirely within the Northern Hemisphere and almost all within the Western Hemisphere. It can also be considered a northern subcontinent of the Americas. North America is the third largest continent in the world, and home to some of the world's most iconic landmarks. This North America template is great for creating a simple and clean map. This easy-to-customize map includes icons in both light and dark color variations. This North America map template is great for presentations, reports and more. Add your data to create a professional presentation.


7 slides
Programming Framework Infographic
Delve into the intricate world of coding with the programming framework infographic. With a harmonious palette of blue, white, and green, this template visualizes the intricacies of different programming frameworks in a clear and engaging manner. Tailor-made for developers, software engineers, educators, and tech enthusiasts, it transforms complex concepts into digestible visual snippets. Embedded with custom graphics, relevant icons, and adaptable image placeholders, it enhances any tech presentation. Moreover, its seamless adaptability with PowerPoint, Keynote, and Google Slides ensures you leave a lasting impression.