


Features
- 26 Unique slides
- Fully editable and easy to edit in Microsoft Powerpoint, Keynote and Google Slides
- 16:9 widescreen layout
- Clean and professional designs
- Export to JPG, PDF or send by email


Do you have any questions?
Recommend


5 slides
Project Management Framework Presentation
Master the art of project management with our Project Management Framework template. This design is tailored to guide you through every phase of your project, ensuring a smooth and structured execution. The template is perfect for visually representing processes within PowerPoint, Keynote, and Google Slides, providing a clear pathway from project initiation to completion. Ideal for project managers looking to streamline their strategies and enhance project communication.


4 slides
Governance Policy Overview Presentation
Set the foundation for transparency and accountability with this visually engaging presentation design. Perfect for outlining organizational rules, compliance standards, and policy frameworks, it turns complex governance details into clear, structured visuals. Fully customizable and compatible with PowerPoint, Keynote, and Google Slides for effortless professional presentations.


7 slides
Communication Infographic Presentation Template
Communication Infographics are a more professional way of presenting facts and a great way to share your marketing strategy and goals with your team. Our template includes a variety of infographic elements, including bullet points, call to actions and persuasive slogans. This template design is ideal for presentations on subjects such as content marketing, sales, social media strategy, and many more. Our Communication Template includes graphic illustrations, slides and text boxes for your topics. In this template you can easily add your own text and images to create a meaningful presentation.


5 slides
Team Roles and Responsibilities Matrix Presentation
Define accountability with this Team Roles and Responsibilities Matrix. Clearly map tasks to team members using RACI codes (Responsible, Accountable, Consulted, Informed). Ideal for project planning, cross-functional alignment, and team coordination. Fully editable and compatible with PowerPoint, Keynote, and Google Slides to suit any workflow or team structure.


6 slides
Circular Motion Business Wheel Diagram Presentation
Showcase continuous processes or interconnected strategies with the Circular Motion Business Wheel Diagram Presentation. This visually engaging template features a six-part circular layout, ideal for illustrating business cycles, project workflows, or recurring tasks. Each segment includes customizable titles, icons, and content areas to support clarity and impact. Fully compatible with PowerPoint, Keynote, and Google Slides.


20 slides
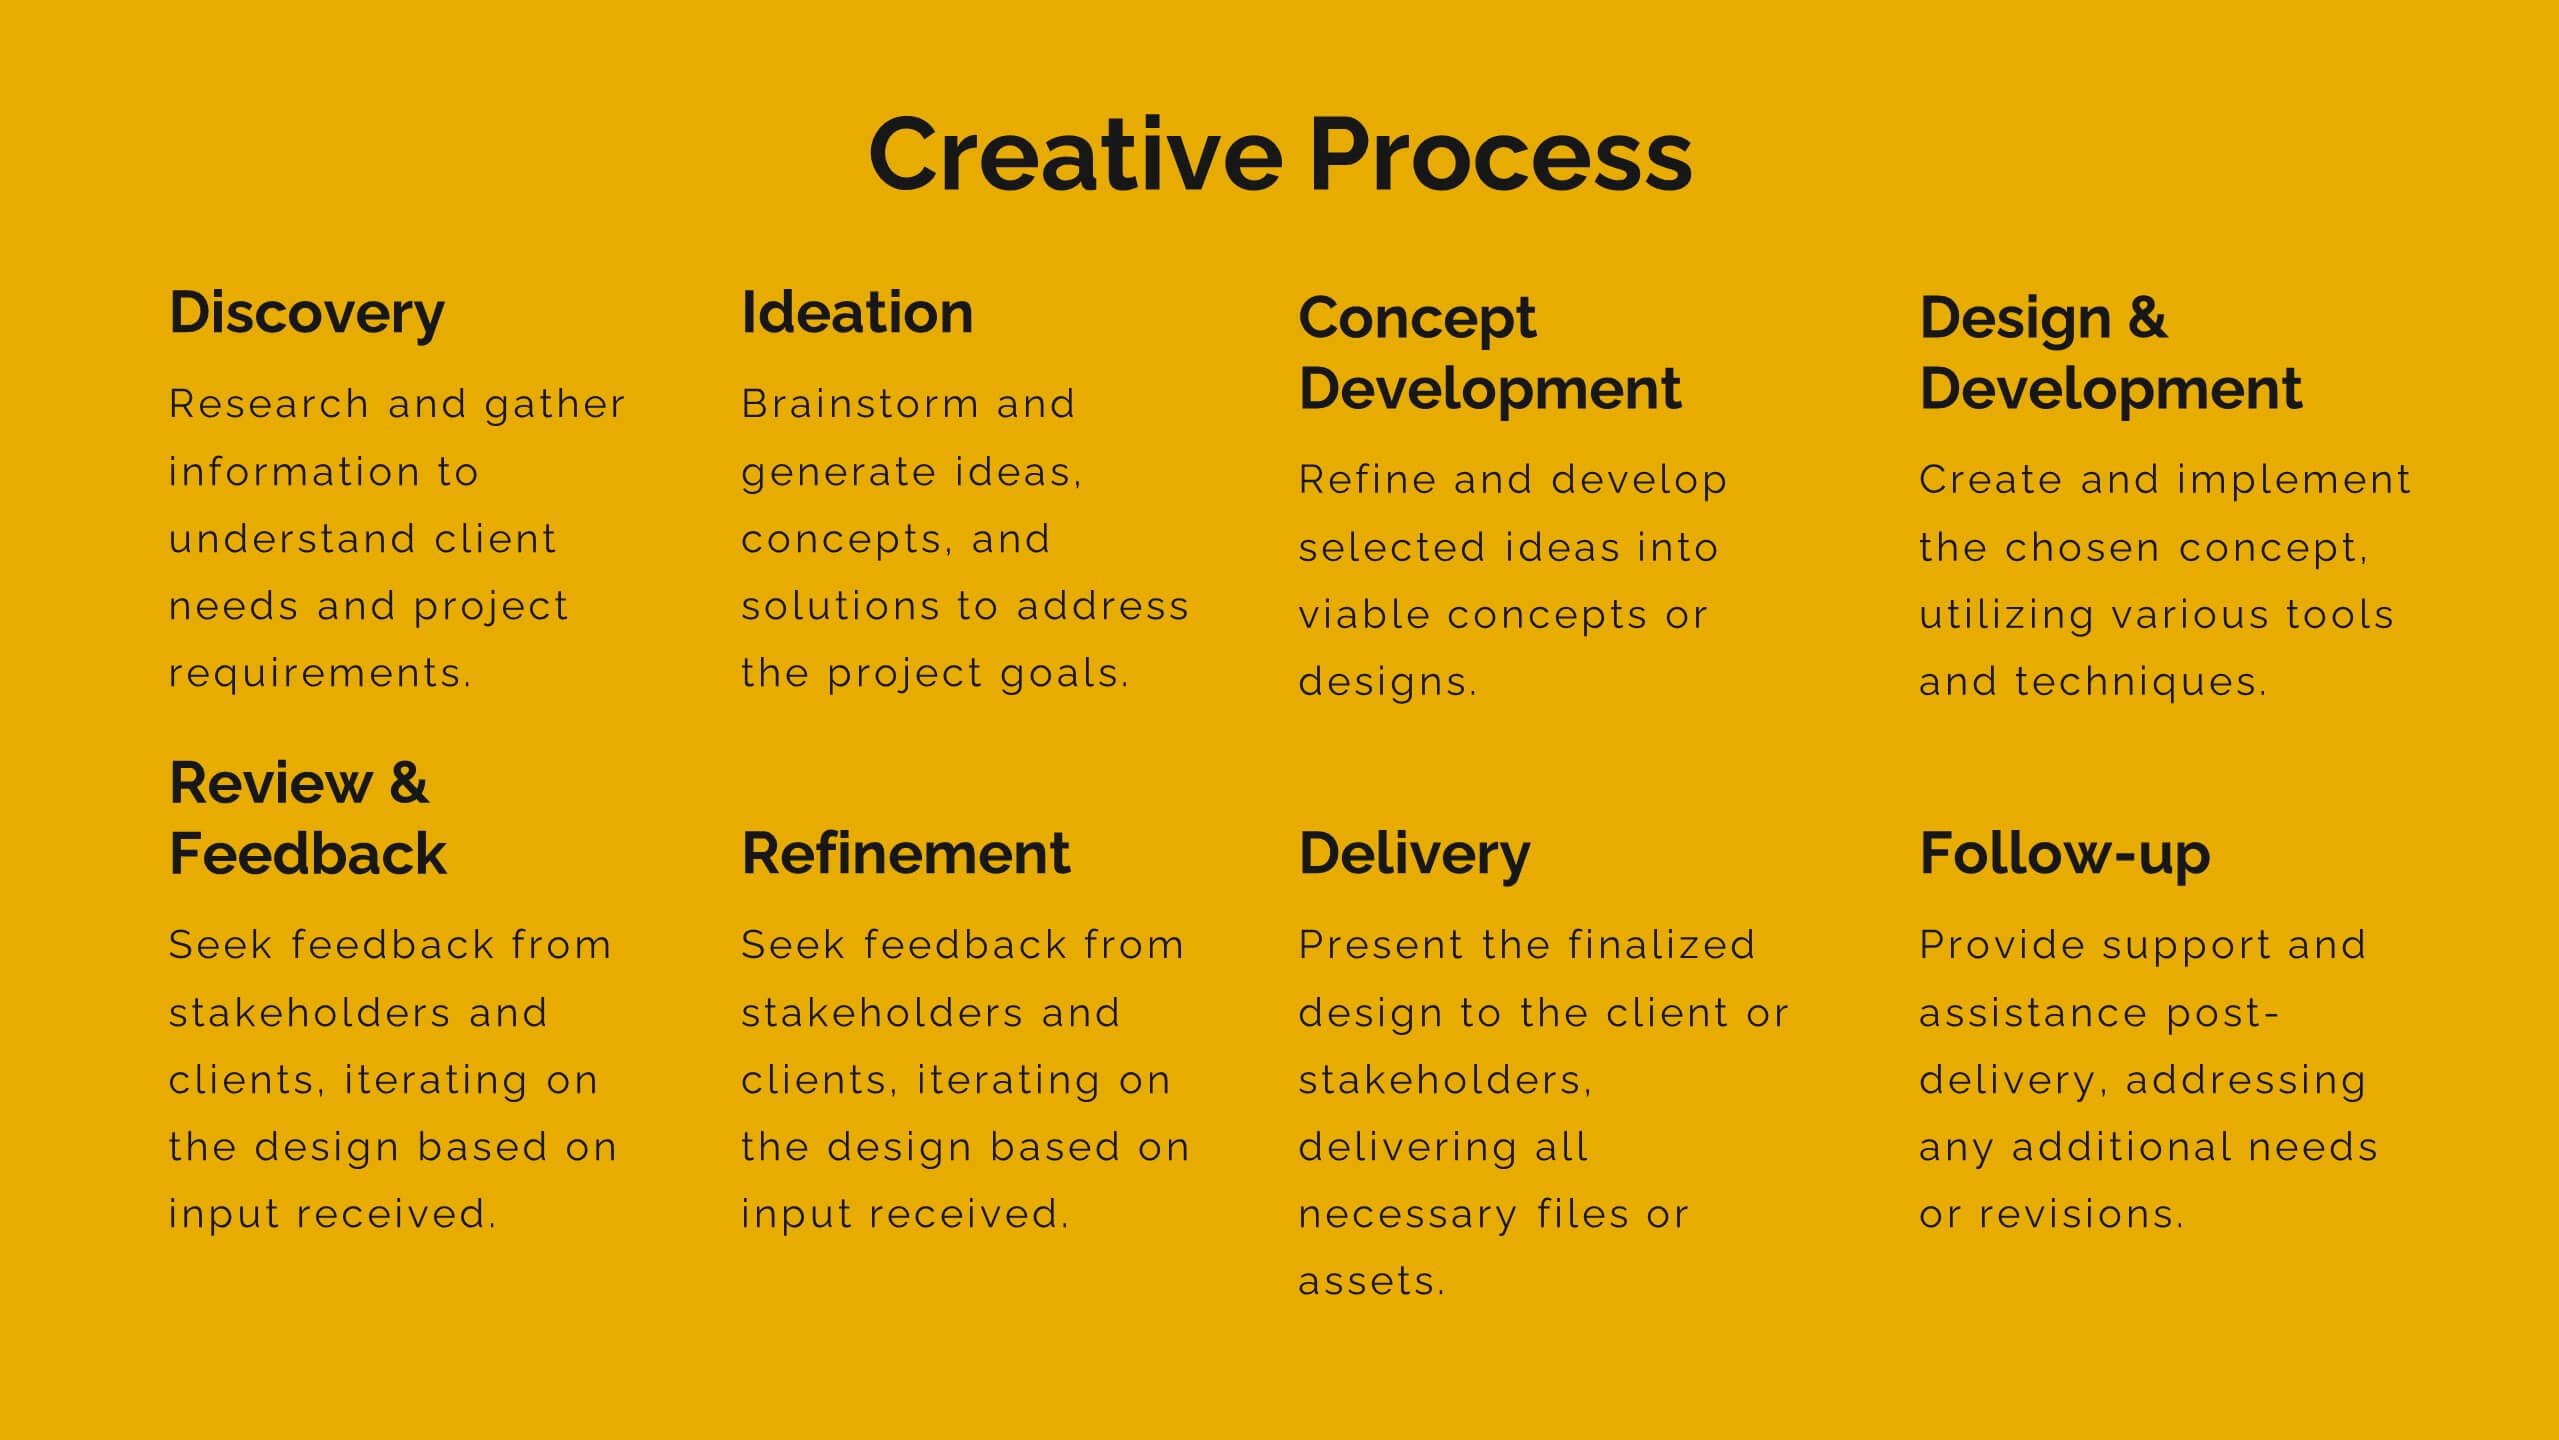
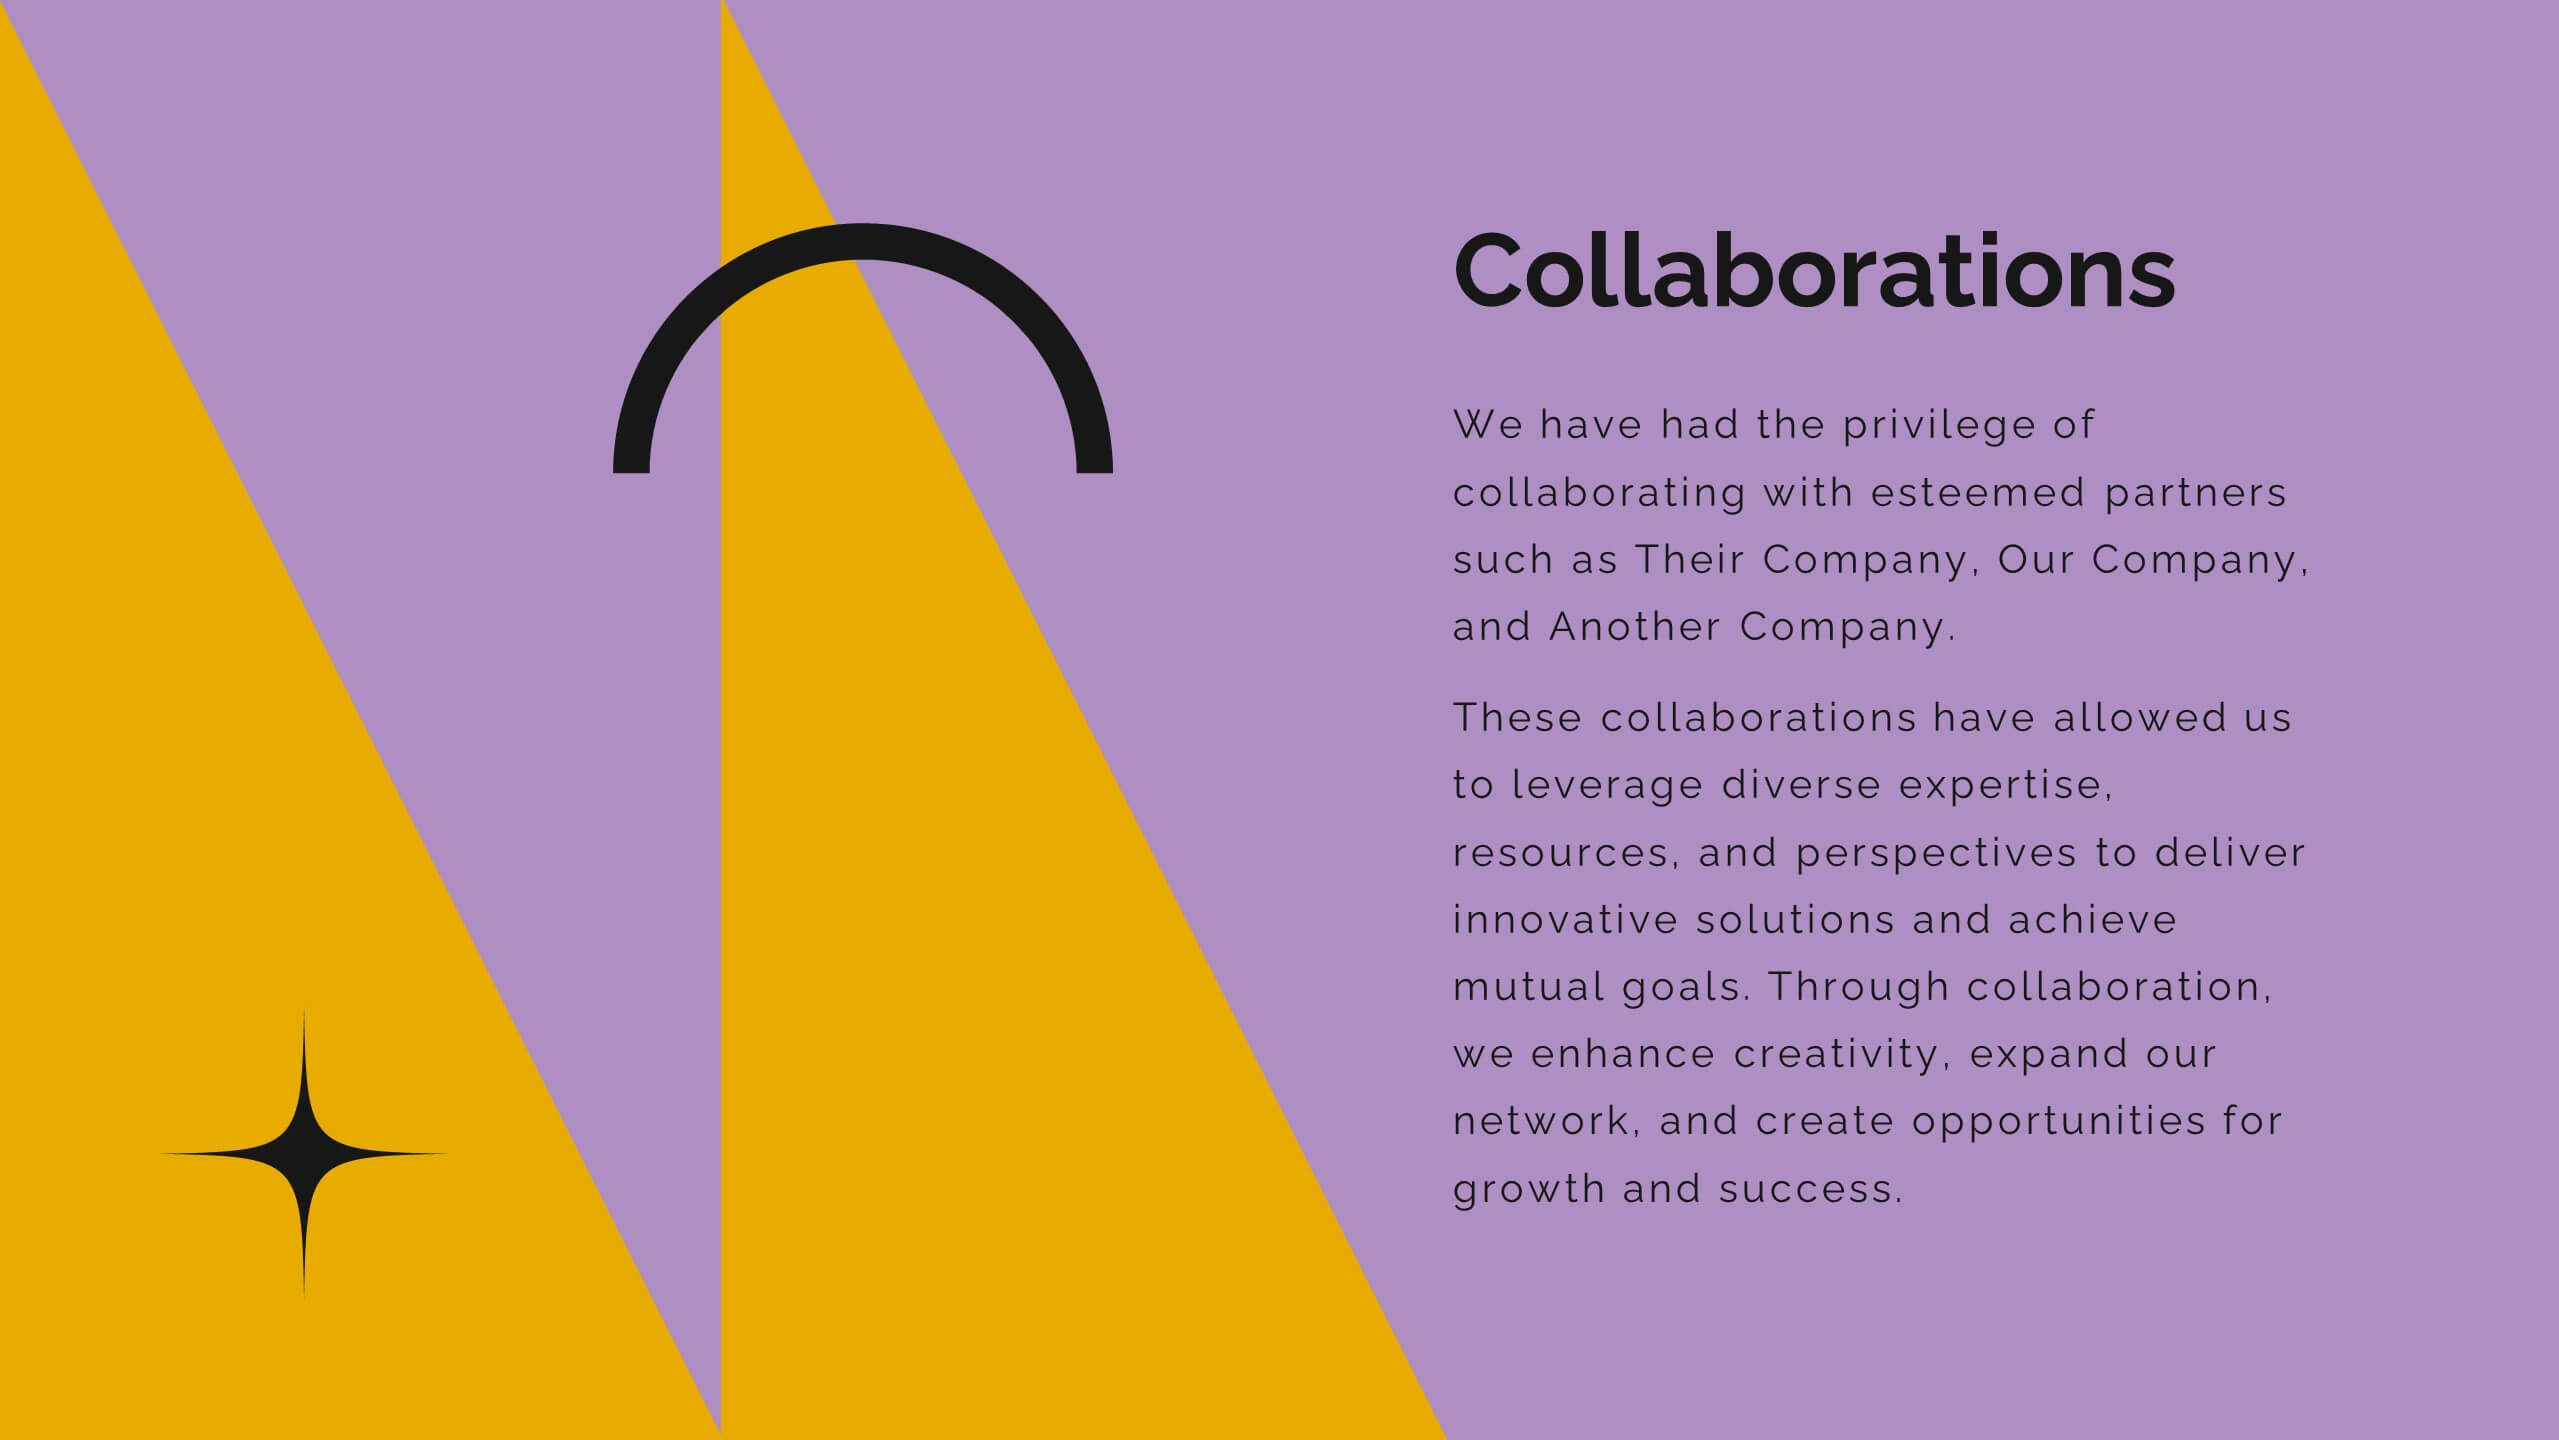
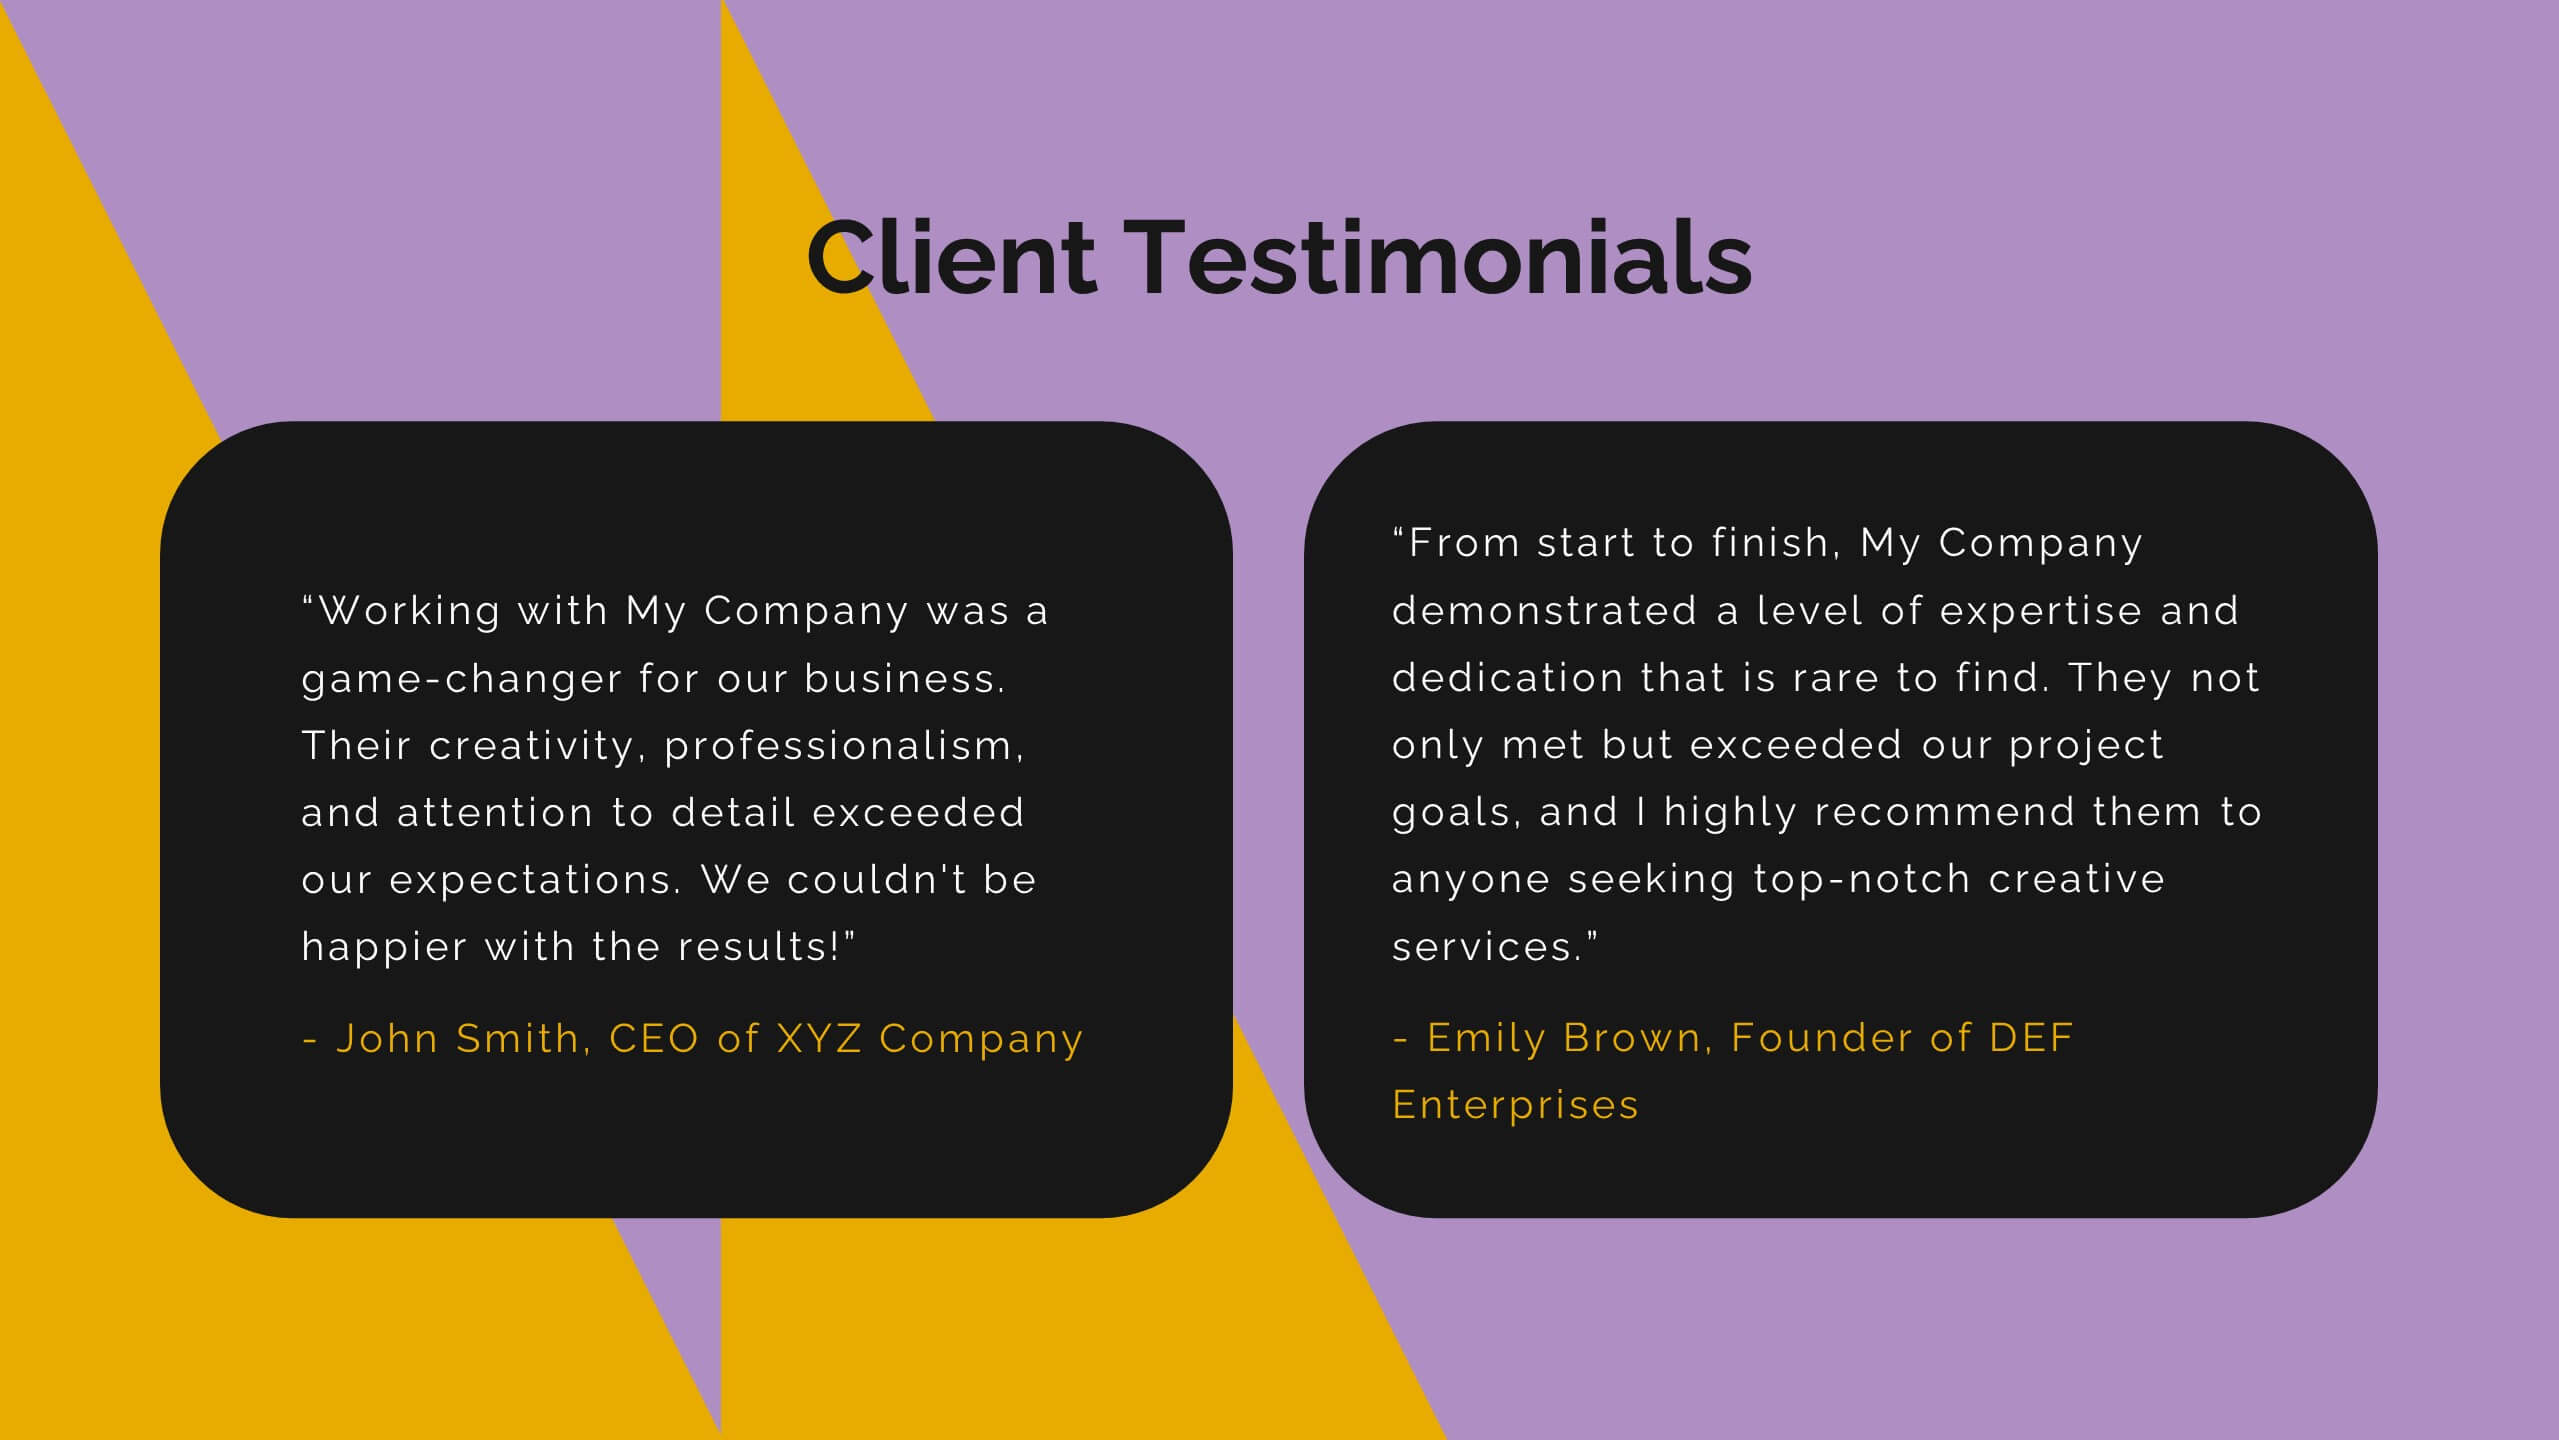
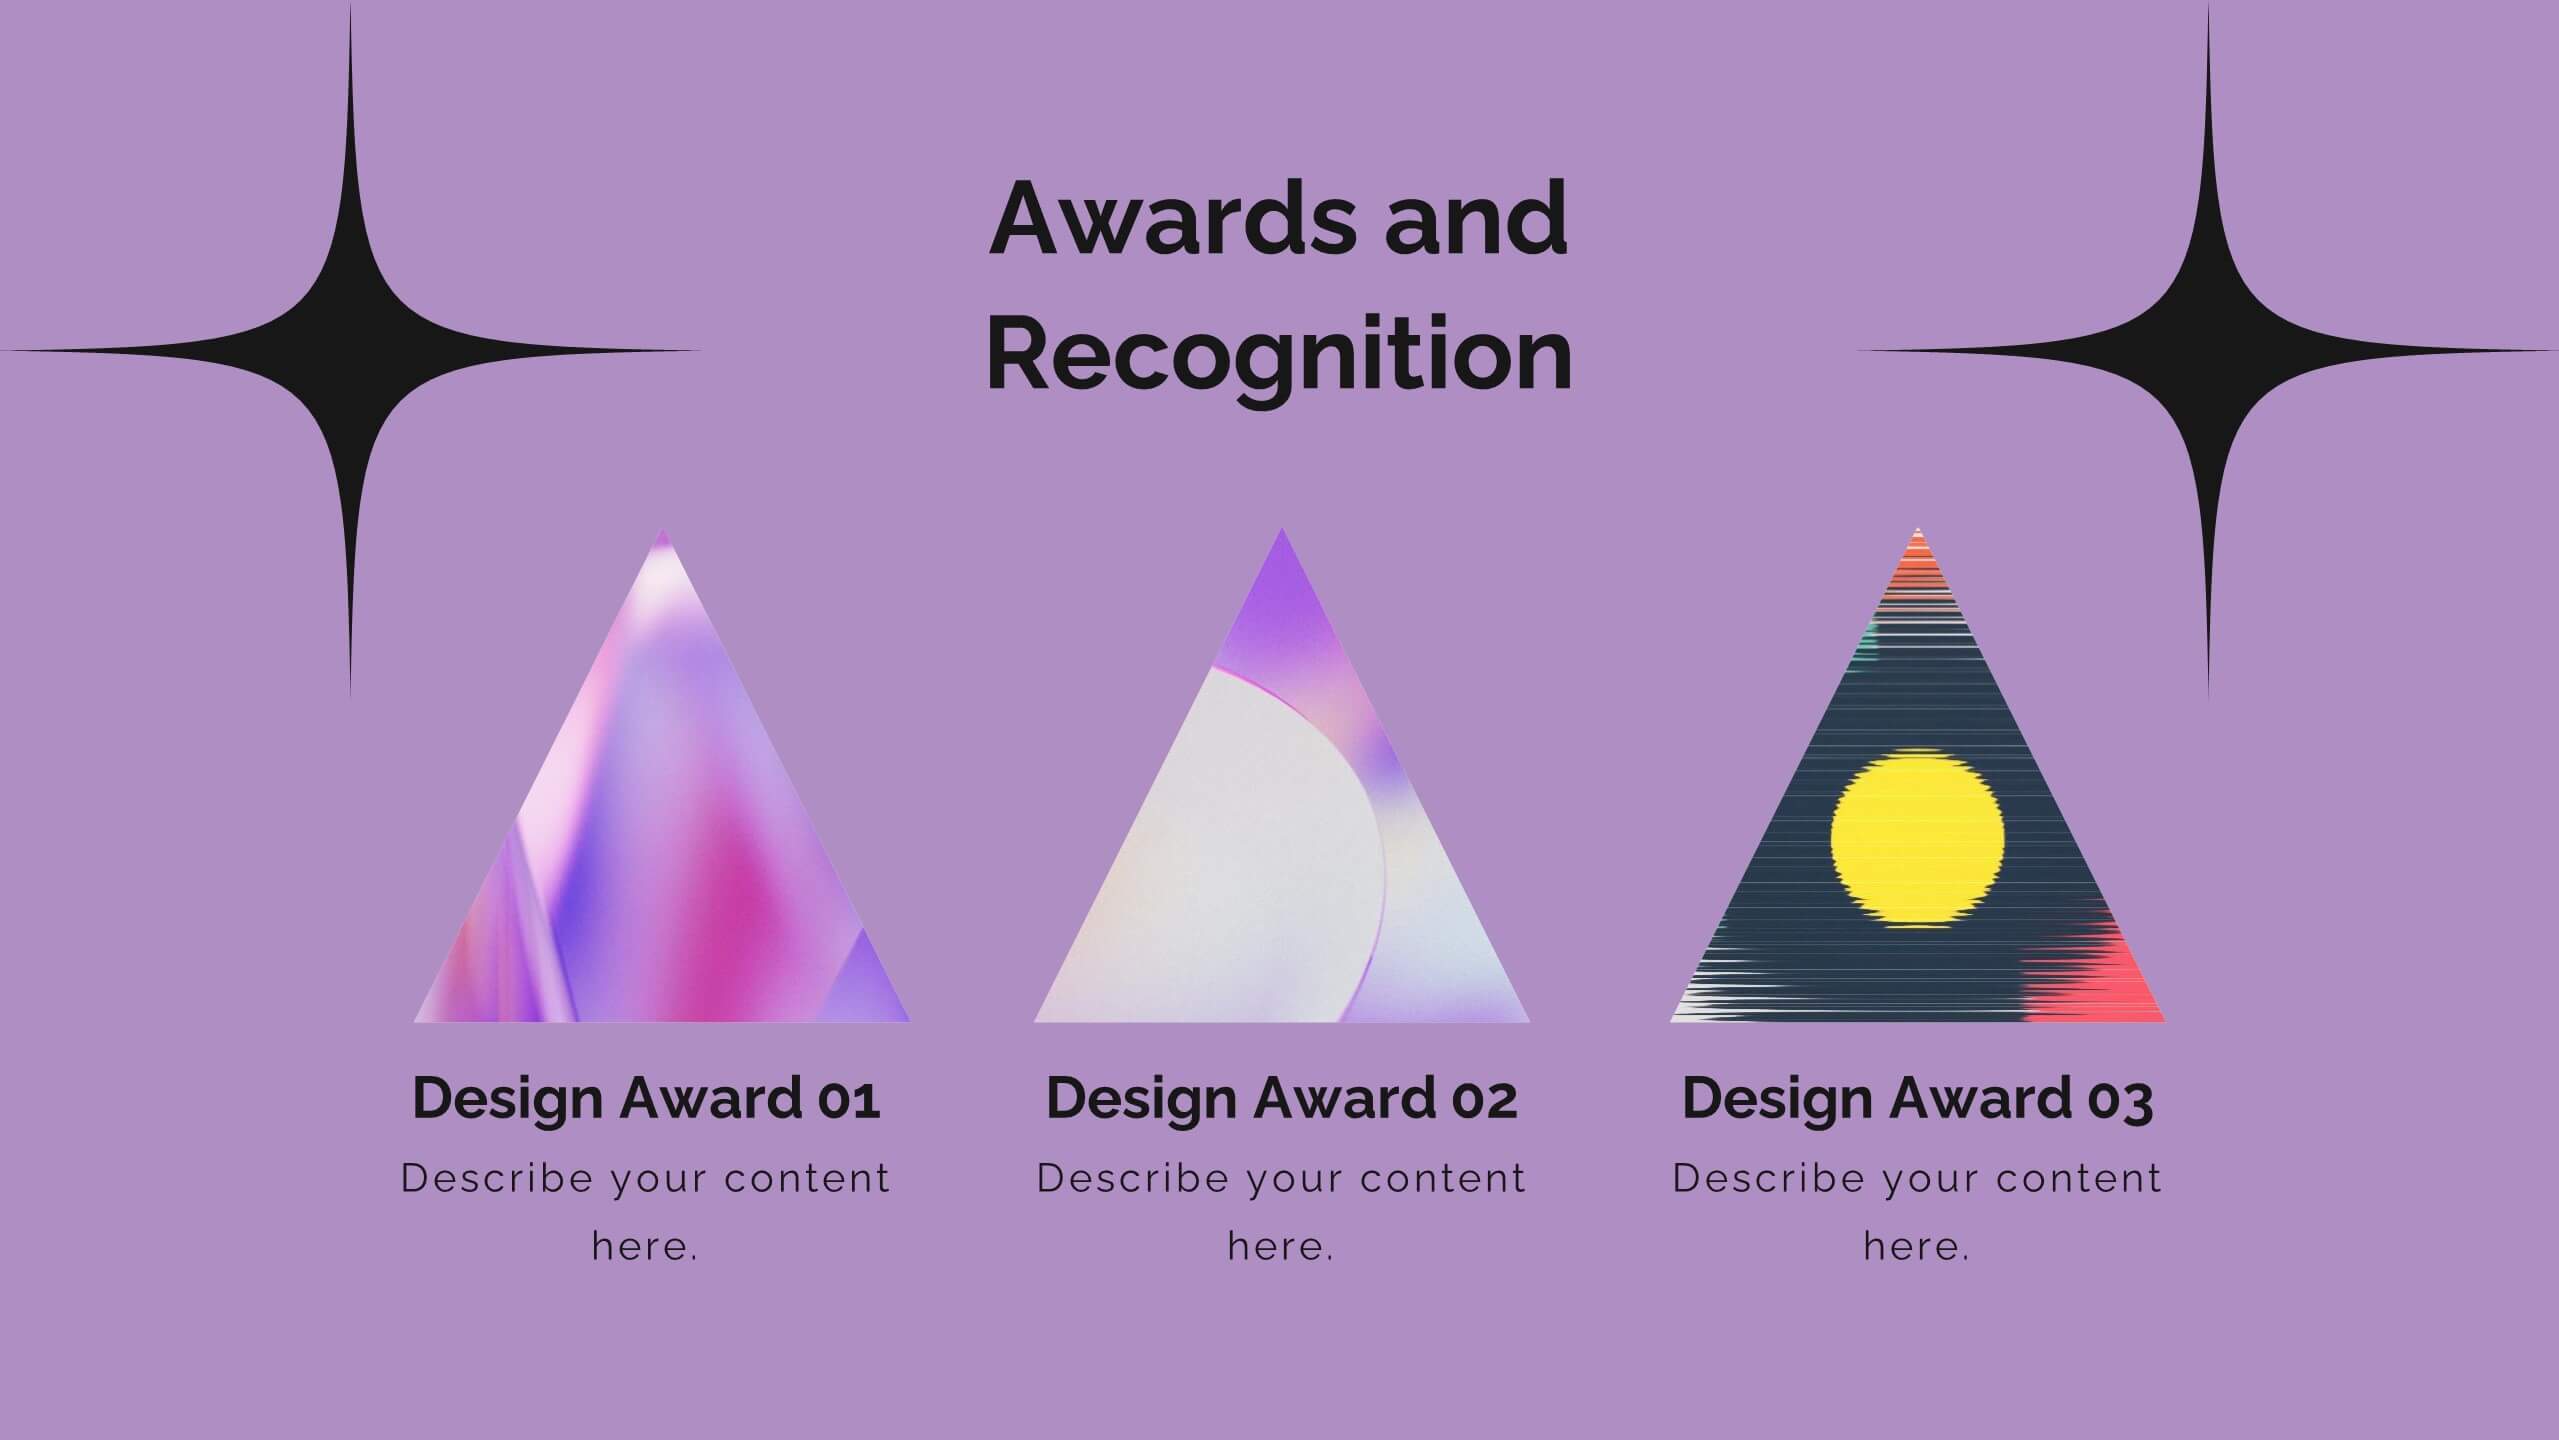
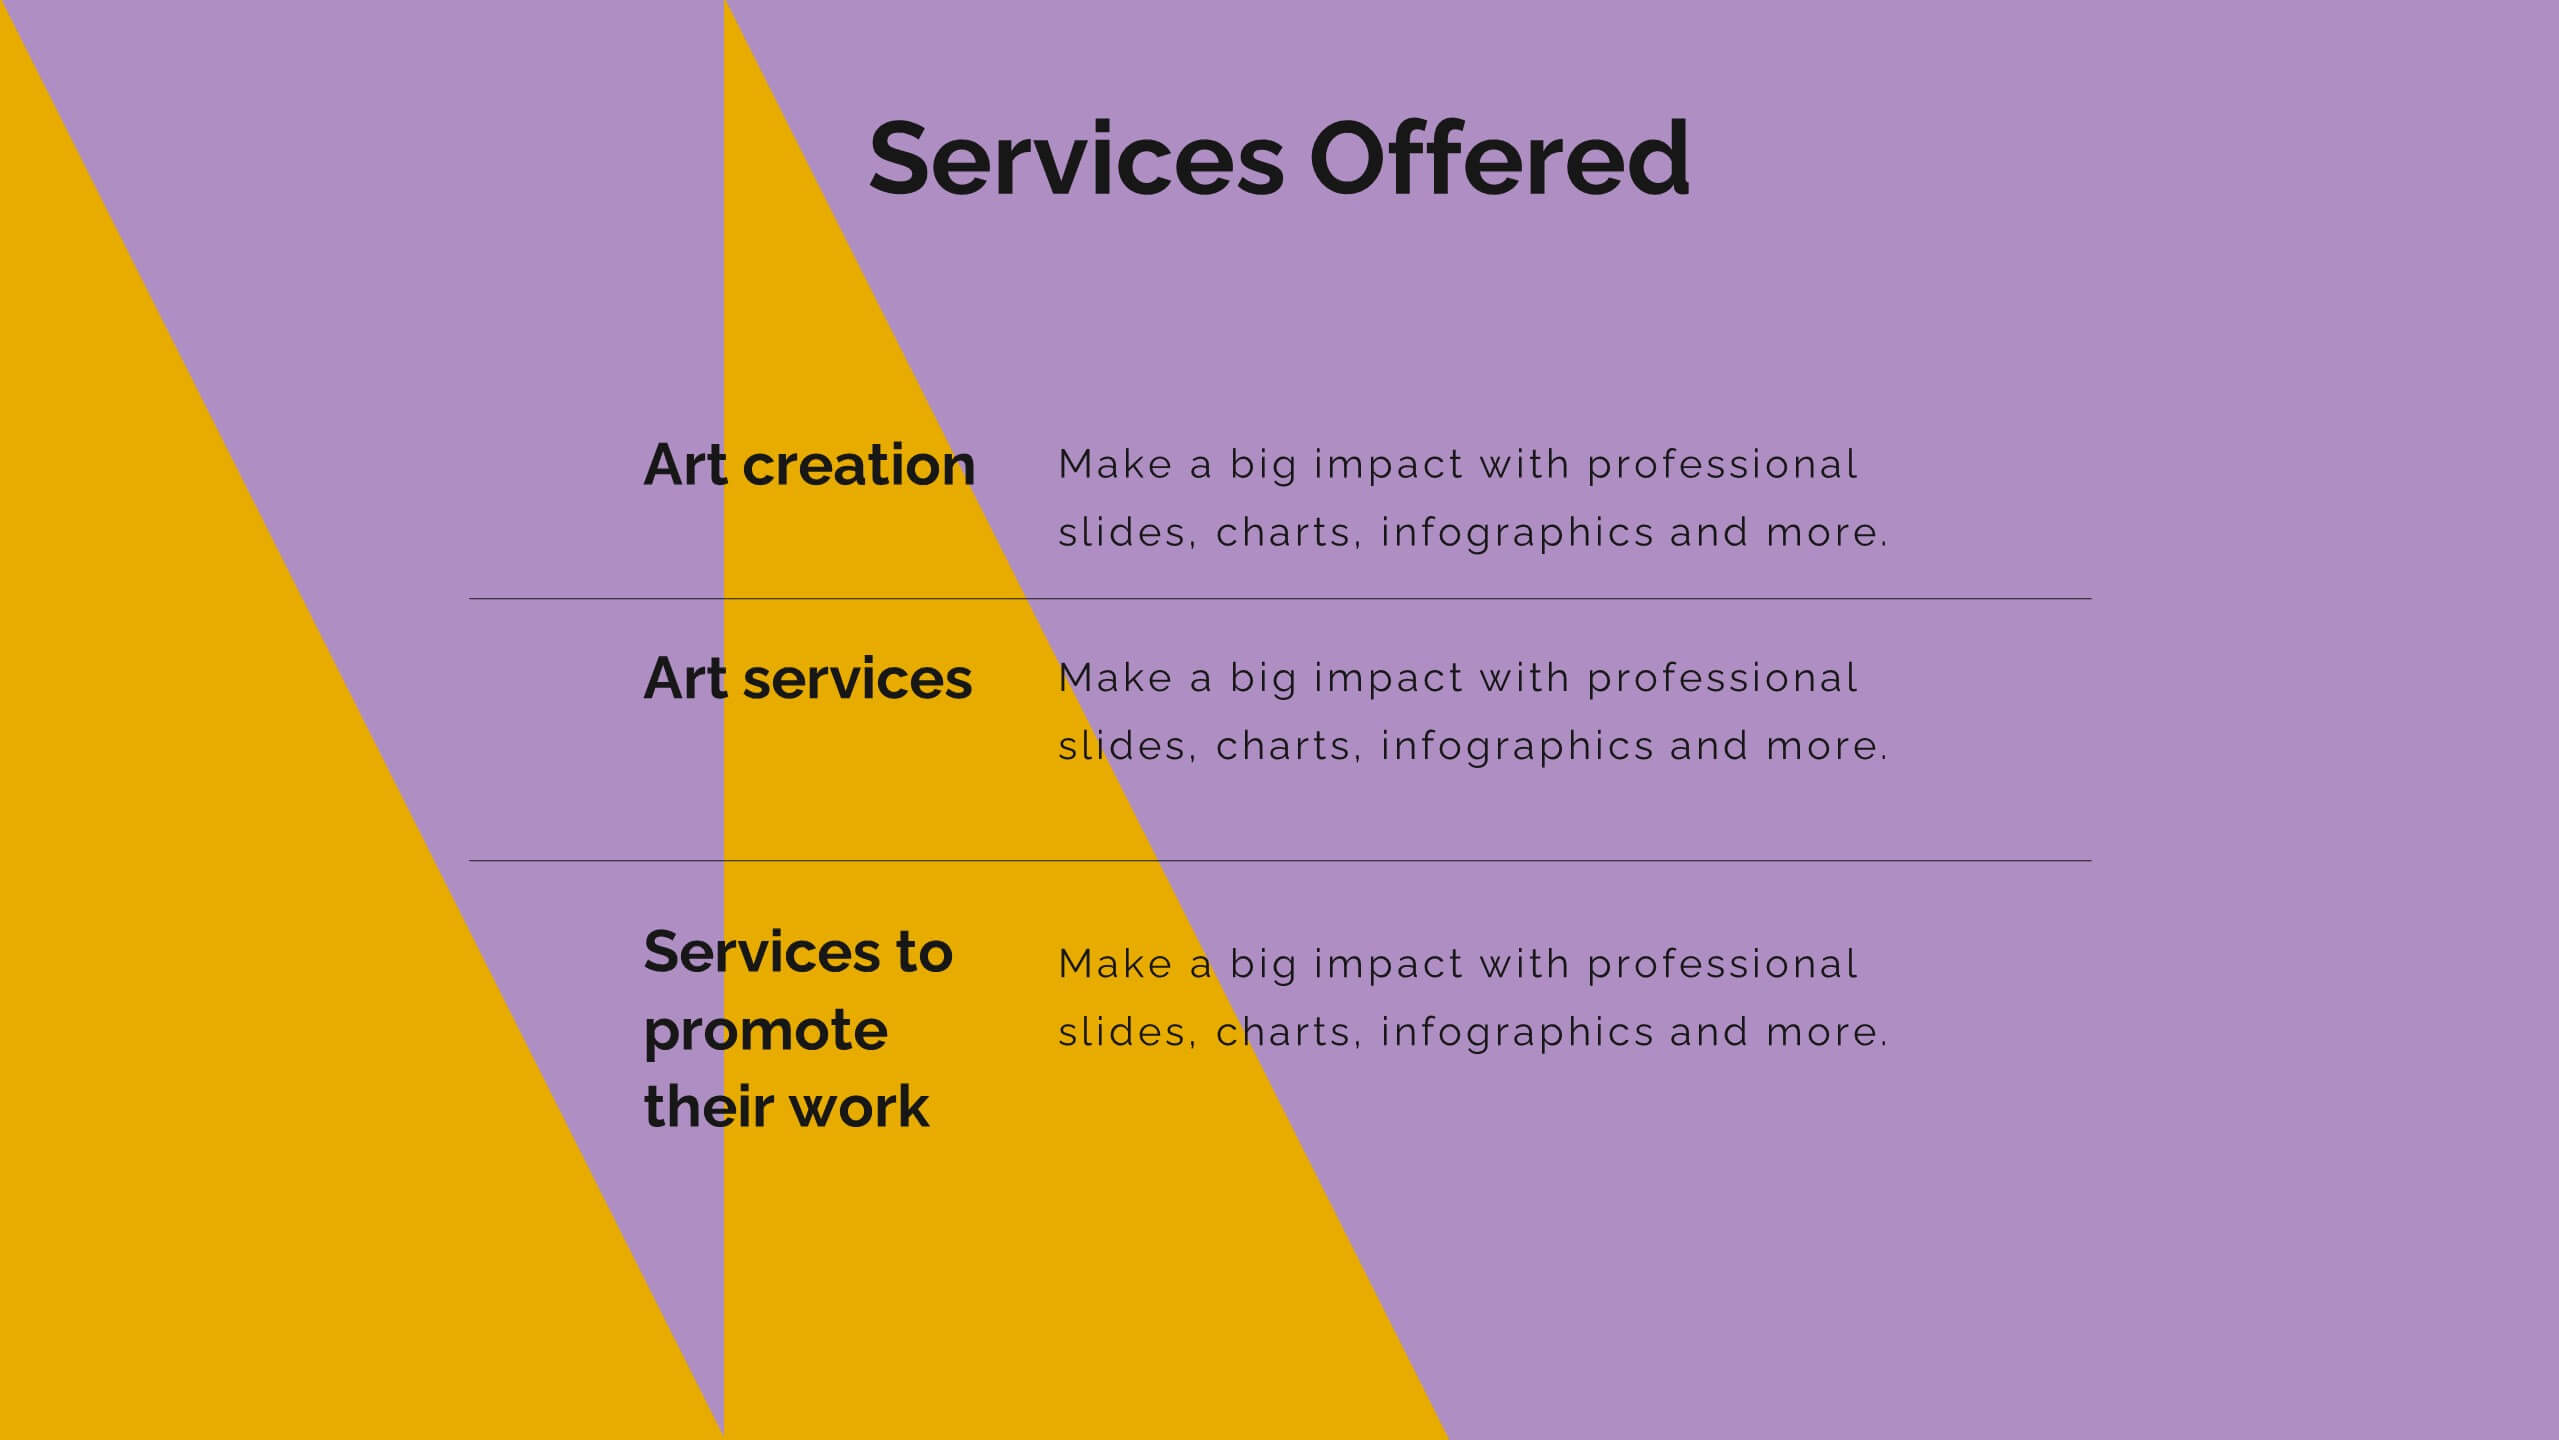
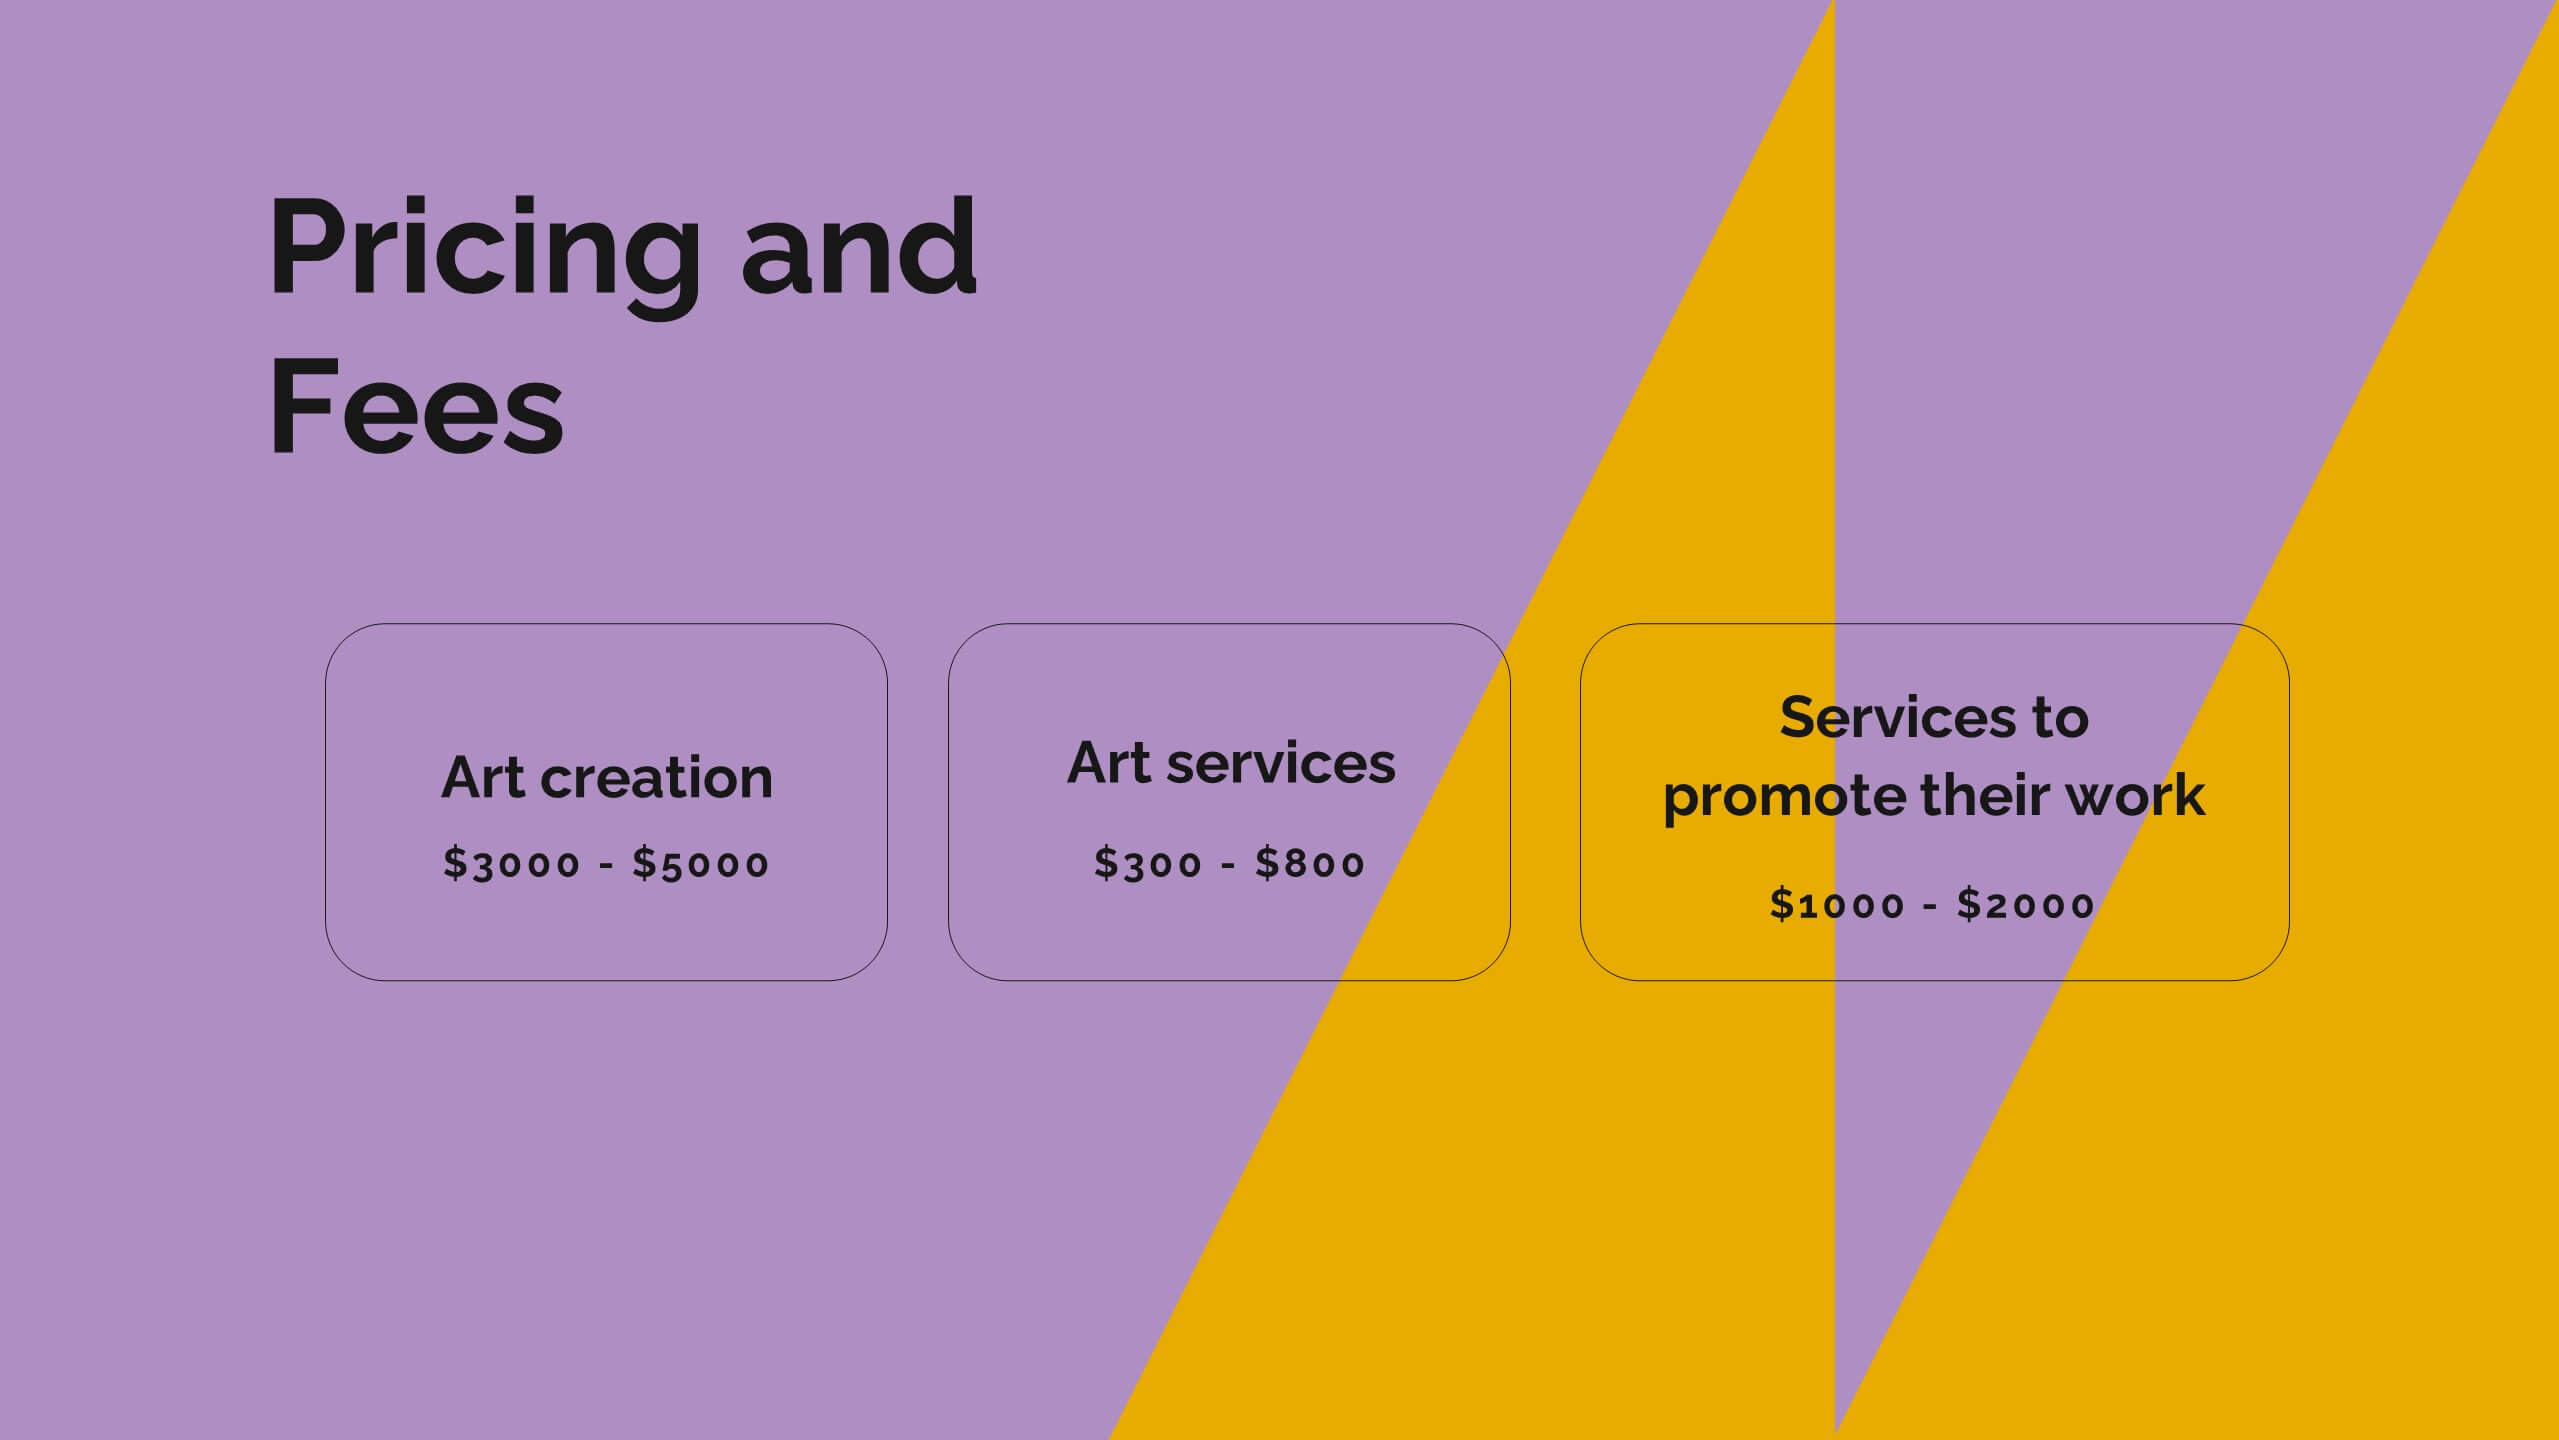
Vortex Artist Portfolio Template Presentation
Showcase your artistic brilliance with this eye-catching portfolio presentation template! Perfect for highlighting your projects, creative process, and awards, it features vibrant slides for your philosophy, collaborations, and client testimonials. Impress potential clients and collaborators with a stunning, well-organized portfolio. Compatible with PowerPoint, Keynote, and Google Slides for seamless presentations on any platform.


7 slides
Operational Workflow Chart Presentation
Turn complex operations into clear, engaging visuals with this clean, structured presentation design. Ideal for outlining procedures, systems, or process improvements, it helps your audience easily follow each stage from start to finish. Fully customizable and compatible with PowerPoint, Keynote, and Google Slides for effortless editing and professional results.


5 slides
Supply Chain Process Infographics
Unravel the complexities of logistics with supply chain process infographics. This vibrant template, splashed with energetic shades of orange, purple, and green, is designed to streamline the convolutions of supply chain management into an easily digestible format. Ideal for business analysts and logistics professionals, these vertical infographics offer a visually engaging narrative. The template features innovative graphics, intuitive icons, and versatile image placeholders, meticulously crafted to aid in visualizing the intricate processes within supply chain dynamics. These infographics are the tool you need to bring clarity to your audience.


6 slides
SEO Ads and Social Media Planning Presentation
Boost your online presence with the SEO, Ads, and Social Media Planning Presentation. This layout features engaging iconography and a central post mockup to highlight content strategy, paid advertising, engagement metrics, and platform-specific insights. Ideal for marketing teams and campaign proposals. Fully editable in PowerPoint, Keynote, and Google Slides.


5 slides
Business and Personal Goal Planning Presentation
Align your vision with action using the Business and Personal Goal Planning slide. This clean, professional layout helps break down up to four key objectives using flag-themed visuals, customizable text blocks, and supportive icons. Perfect for comparing business goals with personal development targets in a single view. Fully editable in PowerPoint, Keynote, and Google Slides—ideal for team meetings, coaching sessions, or strategic planning.


21 slides
Eldritch Product Roadmap Presentation
The Product Roadmap Presentation Template features 21 modern slides, including product overviews, features, pain points, technical specs, and marketing strategies. Its sleek gray-yellow design ensures professionalism. Perfect for startups or businesses, it’s fully customizable and compatible with PowerPoint, Keynote, and Google Slides, ideal for impactful product-focused presentations.


4 slides
Veterinary Practice Overview Presentation
Give your veterinary insights a professional touch with this clean, modern infographic layout. Designed to showcase workflows, patient care processes, and team structures, it helps present information clearly and visually. Fully customizable and compatible with PowerPoint, Keynote, and Google Slides for easy editing and seamless presentation design.


5 slides
Overlapping Venn Chart Presentation
Bring ideas together with a bold visual that highlights how multiple concepts overlap to form stronger insights. This presentation makes comparison and connection effortless using smooth layered shapes and clear labels. Fully editable and compatible with PowerPoint, Keynote, and Google Slides.


10 slides
Financial Dashboard Report Presentation
Stay on top of your financial metrics with the Financial Dashboard Report Presentation. Featuring clean visuals like line charts and icon-labeled KPIs, this layout makes complex data easy to understand. Perfect for monthly reviews, investor updates, or business reports. Fully editable in PowerPoint, Keynote, and Google Slides.


5 slides
4-Stage Gap Identification Presentation
A clear, engaging way to map progression, this presentation helps you illustrate each stage of identifying business gaps with structure and clarity. It guides audiences through challenges, priorities, and opportunities in a simple step-by-step flow that’s easy to follow and present. Fully compatible with PowerPoint, Keynote, and Google Slides.


5 slides
Cryptocurrency Market Trends Presentation
Navigate the dynamic world of digital finance with our "Cryptocurrency Market Trends" presentation templates. Perfect for analysts and enthusiasts alike, these templates provide a clear, visual representation of market movements and trends. They are fully compatible with PowerPoint, Keynote, and Google Slides, making them an excellent resource for anyone keen on the pulse of cryptocurrency markets.


19 slides
Philosium Design Strategy Proposal Presentation
Bring your creative vision to life with this sleek and structured design strategy proposal presentation. Covering key elements like concept development, wireframes, typography, and user research, this template helps you communicate a compelling design approach. Fully customizable and compatible with PowerPoint, Keynote, and Google Slides for a seamless and professional presentation experience.