


Features
- 5 Unique slides
- Fully editable and easy to edit in Microsoft Powerpoint, Keynote and Google Slides
- 16:9 widescreen layout
- Clean and professional designs
- Export to JPG, PDF or send by email


Do you have any questions?
Recommend


6 slides
Stages of Product Life Cycle Infographics
Visualize the stages of a product's life cycle with our customizable infographic template. This template is fully compatible with popular presentation software like PowerPoint, Keynote, and Google Slides, allowing you to easily customize it to illustrate and communicate the key phases of a product's life cycle. The Stages of Product Life Cycle infographic template offers a visually engaging platform to depict the various stages, including introduction, growth, maturity, and decline. Whether you're a product manager, marketer, business owner, or student, this template provides a user-friendly canvas to create informative presentations and educational materials. Enhance your understanding of product life cycles with this SEO-optimized infographic template, thoughtfully designed for clarity and ease of use. Customize it to showcase the characteristics, strategies, and challenges associated with each stage, helping you make informed decisions about your products and their market positioning. Start crafting your personalized infographic today to explore the dynamic nature of the product life cycle.


7 slides
South America Countries Map Infographic
This South America Countries Map infographic template is designed for detailed presentations on the geographical and statistical information of South American countries. Compatible with PowerPoint, Google Slides, and Keynote, the template set includes maps with data points indicating various statistics such as population percentages, and demographic information. Visual aids like pie charts, bar graphs, and icon representations help to depict data in an easily understandable manner. The color-coding and labels are clear, making it easy to differentiate between countries and regions. This template is ideal for educators, analysts, and business professionals needing to present country-specific data across South America.


6 slides
End-to-End Business Process Visualization Presentation
Present every stage of your operations clearly with the End-to-End Business Process Visualization Presentation. This structured layout is perfect for mapping out linear workflows across departments, from initiation to final delivery. Easily customizable and compatible with PowerPoint, Canva, and Google Slides for seamless editing.


10 slides
Milestone Roadmap Infographic Presentation
Track progress with clarity using this Milestone Roadmap Infographic template. Designed to highlight key achievements and project phases, it’s perfect for presentations, team updates, and strategic planning. Editable in PowerPoint, Keynote, and Google Slides, it's an efficient way to visualize goals, timelines, and accomplishments.


4 slides
Modern 3D Business Diagram
Bring a fresh, dimensional twist to your business strategy with this modern 3D layout. Featuring interlocking puzzle elements on a tilted grid, this slide is perfect for showcasing interrelated departments, processes, or multi-stage plans. Compatible with PowerPoint, Keynote, and Google Slides.


2 slides
Small Business Success Illustrations
Get your business on the right track with our small business success illustrations pack! These illustrations will help you with your next business presentation and make it more engaging and catchy. Fully compatible with Powerpoint, Keynote, and Google Slides. You can use these in your website, blog or social media posts. Turn your vision into a reality—download the small business success illustrations pack today!

22 slides
Hellenic Small Business Pitch Deck Presentation
Unleash the spirit of entrepreneurship with this captivating Hellenic-themed presentation! Designed specifically for small business pitches, this template allows you to showcase your business concept, market analysis, and financial plans with elegance and clarity. Its vibrant visuals will engage your audience and leave a lasting impression. Compatible with PowerPoint, Keynote, and Google Slides.


22 slides
Simple Pitch Deck Presentation
Streamline your pitch process with this no-frills Pitch Deck template, designed for clear communication and powerful impact. From the get-go, the cover slide clearly announces your purpose, inviting audiences into your business narrative. The template smoothly transitions from one slide to the next, each one a stepping stone in building your case — from problem to solution. It includes a neatly organized table of contents, thought-provoking mission and vision statements, and data-rich slides for a deep dive into your business metrics. Each section, marked with bold, numbered headers, keeps your presentation on track and your audience engaged. A final 'Thank You' slide adds a touch of professionalism, and the credits section ensures that your sources are transparently acknowledged. This pitch deck is ideal for startups and businesses looking to capture attention and convey their story succinctly.


21 slides
Parthenon Marketing Proposal Template Presentation
Create an impactful marketing proposal with this vibrant and modern presentation template! Covering key sections such as industry overview, consumer behavior, social media strategies, and emerging technologies, it helps you present your marketing insights with style. Fully customizable and perfect for data-driven marketing plans, this template is compatible with PowerPoint, Keynote, and Google Slides for seamless presentation delivery.


10 slides
Customer Demographic Breakdown Presentation
Give your insights a bold, modern look with a clear visual layout that turns customer data into an easy-to-follow story. This presentation helps you explain key demographic patterns, highlight audience behavior, and support smarter decisions with clean, structured visuals. Fully editable and compatible with PowerPoint, Keynote, and Google Slides.


7 slides
Business Credit Card Infographic
Navigating business credit cards can seem overwhelming, but with our vibrant infographic, it becomes effortless. Drenched in playful pinks and dynamic colors, this tool is more than just eye-catching—it's a roadmap to the intricate realm of corporate credit. Tailored for everyone from financial educators to seasoned business owners, this infographic offers a clear, concise breakdown of business card essentials, benefits, and best practices. Whether you're presenting, learning, or simply seeking clarity, this resource promises invaluable insights with a dash of flair. Dive in and demystify the world of business credit cards with us!


7 slides
Framework Documentation Infographic
A framework infographic presents a framework for organizing and understanding complex information, to provide an overview of the key elements and relationships between them. This template is designed to break down your large amounts of information into smaller, more manageable parts. This infographic can be used in fields such as business, marketing, and strategy, as well as in education and research. Use it to explain complex concepts, theories, and models, and to provide a visual representation of how elements fit together. This can take a variety of forms, including flowcharts and diagrams.


8 slides
Health Metrics and Wellbeing Dashboard Presentation
Visualize patient insights with this dashboard-style layout combining human figures, progress bars, and anatomical icons. Ideal for healthcare data, wellness reporting, or gender-based analysis, it balances stats and storytelling effectively. Customize it easily in PowerPoint, Keynote, or Google Slides for your next health-focused presentation.


4 slides
Sequential Roadmap Planning Timeline Presentation
Guide your audience through each milestone with the Sequential Roadmap Planning Timeline Presentation. This sleek layout is perfect for showing linear progress over time—ideal for strategic plans, product rollouts, or project phases. Each step is clearly marked with editable years and titles, ensuring clarity and easy customization. Fully compatible with PowerPoint, Google Slides, and Canva.


3 slides
Sustainabilitiy Management Plan Framework Presentation
Turn your sustainability goals into a clear, actionable plan with this dynamic presentation design. Ideal for showcasing environmental strategies, performance metrics, and corporate responsibility initiatives, it combines clarity with visual balance to engage audiences. Fully editable and compatible with PowerPoint, Keynote, and Google Slides for seamless customization and delivery.


6 slides
Audience Segmentation by Region Presentation
Discover where your audience truly connects with a visually engaging layout that highlights market insights across regions. This presentation helps businesses identify, compare, and target audiences by location for smarter decision-making. Fully customizable and compatible with PowerPoint, Keynote, and Google Slides for seamless professional use and presentation flexibility.


5 slides
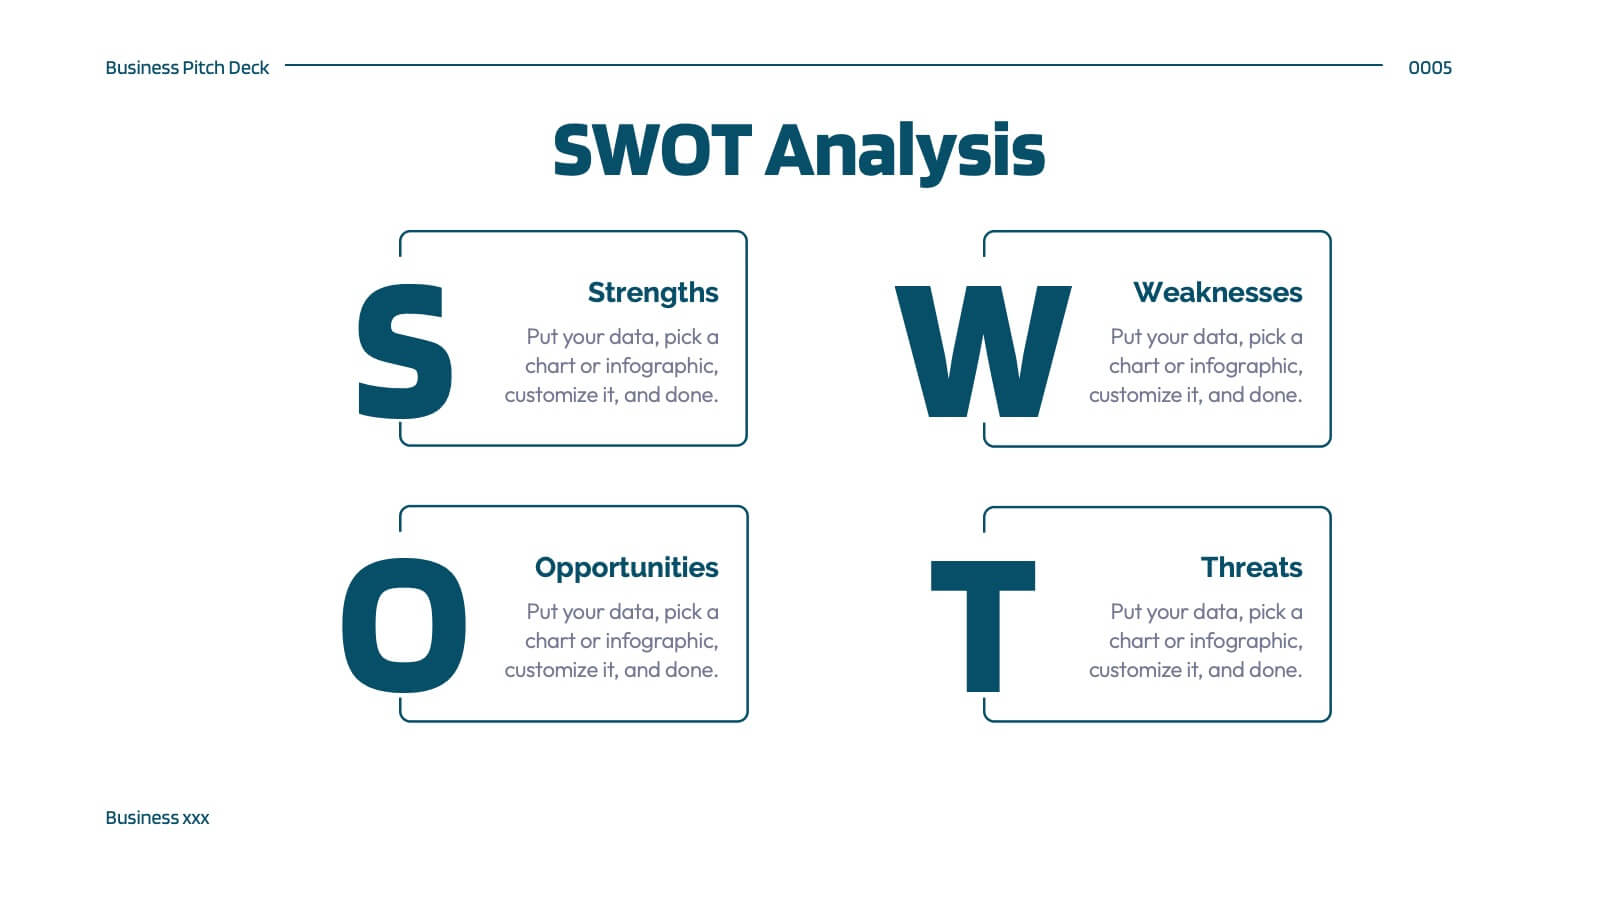
Creative Alphabet Display Template
Make your message memorable with the Creative Alphabet Display Template Presentation. This slide uses bold, interlocking letter shapes to showcase four key ideas in a linear, eye-catching format—perfect for step-by-step processes, value breakdowns, or themed concepts. Fully editable in PowerPoint, Keynote, and Google Slides.