


Features
- 5 Unique slides
- Fully editable and easy to edit in Microsoft Powerpoint, Keynote and Google Slides
- 16:9 widescreen layout
- Clean and professional designs
- Export to JPG, PDF or send by email


Do you have any questions?
Recommend


6 slides
Project Schedule Timeline Presentation
Plan, track, and showcase progress with this sleek timeline layout designed to visualize every milestone with clarity. Ideal for organizing project phases, deadlines, or deliverables, it helps communicate workflows efficiently and professionally. Fully editable and compatible with PowerPoint, Keynote, and Google Slides for easy customization and seamless presentation design.


5 slides
3D Element Infographics for Impact Presentation
Add a bold visual twist to your data with the 3D Element Infographics for Impact Presentation. Featuring eye-catching 3D dice-style cubes, this template is perfect for showcasing four key concepts, comparisons, or stages. Ideal for business strategies, risk breakdowns, or decision-making visuals. Fully editable and compatible with PowerPoint, Keynote, and Google Slides.


8 slides
Creative SWOT Breakdown for Business Insight
Analyze your business from every angle with the Creative SWOT Breakdown for Business Insight Presentation. This bold, suitcase-style layout visually separates Strengths, Weaknesses, Opportunities, and Threats with color-coded blocks and percentage highlights for quick comparisons. Designed to simplify strategic analysis, it’s ideal for planning meetings, team workshops, or executive reviews. Fully customizable in PowerPoint, Keynote, and Google Slides.


5 slides
Recycling Basics Infographics
Recycling is the process of converting waste materials into new products to reduce the consumption of raw materials, energy usage, and environmental pollution. These infographic templates are designed to educate and motivate individuals to embrace recycling as a sustainable practice. With its eye-catching design, concise information, and visually appealing graphics, this template will help raise awareness and inspire positive recycling behaviors in your audience. This template allows you to effectively communicate key information about recycling. This is compatible with Powerpoint, Keynote, and Google Slides.


6 slides
Leadership Program Infographic
A leadership program is a structured and intentional learning experience designed to develop and enhance leadership skills and qualities in individuals. This infographic template aims to provide a concise overview of the program's objectives, target audience, curriculum, and expected outcomes. This template includes icons, graphics, and color schemes that align with the organization's branding and make the infographic visually appealing. This infographic serves as an effective marketing tool to attract potential participants, showcase the value of the program, and communicate the positive outcomes of joining the leadership development journey.


7 slides
Alphabet Infographic Presentation Template
Our Alphabet Infographic features a well-designed set of icons, letters and numbers. This template is perfect for PowerPoint presentations and will allow you to enhance your business/school design. Make your data sets easily readable, attractive and concise with this template. This Alphabet Infographic template is perfect for making your pitch stand out, with a bold and catchy design. It features a modern look that captures viewer's attention, but also contains plenty of details for them to explore. The colors are bright and vibrant, so you know the message won't be forgotten easily.


5 slides
Smart Decision Making Models Presentation
Make complex choices simple with this modern and colorful template designed to visualize analytical thinking and structured planning. Ideal for presenting frameworks, strategies, or goal-setting models, it helps communicate logic and clarity effectively. Fully compatible with PowerPoint, Keynote, and Google Slides for smooth customization and presentation delivery.


5 slides
Business Pillars and Core Values Presentation
Showcase your organization's foundational strengths with our Business Pillars and Core Values presentation template. This versatile tool visually represents your key principles and commitments, ensuring your audience clearly understands the essence of your corporate identity.


4 slides
Comprehensive Business Project Pitch Presentation
Present a polished and structured message with the Comprehensive Business Project Pitch Presentation. Featuring a clean checklist format paired with bold icons and color-coded segments, this layout is perfect for showcasing core strategies, deliverables, or proposal points. Easily customizable for PowerPoint, Keynote, or Google Slides.


4 slides
Resource Mapping in African Regions Presentation
Visualize regional distribution clearly with the Resource Mapping in African Regions Presentation. This engaging slide highlights key areas using color-coded map segments, helping you present data like resource allocation, project focus, or regional analysis with clarity. Ideal for NGOs, researchers, or government briefings. Compatible with PowerPoint, Keynote, Canva, and Google Slides.


4 slides
Service Plan Pricing Matrix Presentation
Present your pricing options clearly with this Service Plan Pricing Matrix Presentation. Designed for easy comparison, this layout highlights four tiers—Basic, Standard, Professional, and Expert—with bold pricing, checklists, and CTA buttons. Ideal for service providers, SaaS, and agencies. Fully editable in Canva, PowerPoint, Keynote, and Google Slides.


20 slides
Elementra Marketing Proposal Presentation
Elevate your marketing initiatives with this professional and well-structured proposal template. Covering essential sections such as objectives, goals, budget breakdown, timeline, and pricing structure, this presentation helps you effectively communicate your strategy to stakeholders and clients. Its clean, modern design ensures clarity and engagement, making it ideal for pitching ideas and securing approvals. Fully customizable and compatible with PowerPoint, Keynote, and Google Slides.


4 slides
Incident Prevention and Safety Culture Presentation
Promote a proactive approach to workplace wellbeing with the Incident Prevention and Safety Culture presentation. This visually structured slide uses bold safety icons—such as warning signs, first aid, and hazard symbols—to represent core pillars of a safety-first environment. Ideal for outlining safety protocols, risk mitigation strategies, training initiatives, and cultural values, each section includes editable placeholders for concise messaging. The clean layout supports quick communication in HR briefings, onboarding, or compliance meetings. Fully customizable and compatible with PowerPoint, Keynote, and Google Slides.


5 slides
A to Z Slide Concept Presentation
Bring your ideas to life with a bold, block-style visual that makes complex concepts feel simple and structured. This slide is perfect for breaking down processes, frameworks, or step-by-step explanations in a clear, memorable way. Fully editable and compatible with PowerPoint, Keynote, and Google Slides.


10 slides
Organizational Hierarchy Infographic Presentation
Clearly define your Organizational Hierarchy with this structured infographic template. Designed for business presentations, HR teams, and corporate strategy, this visual layout simplifies reporting structures, leadership roles, and team organization. Fully customizable and easy to edit in PowerPoint, Keynote, and Google Slides, making it perfect for internal communications and management reports.


6 slides
SEO Strategy and Keyword Mapping Presentation
Streamline your digital strategy with this SEO mapping layout that blends structure and simplicity. Designed to help visualize keyword clusters, content priorities, and search intent stages, this infographic makes complex strategies feel approachable. It’s easy to edit and perfect for presentations in PowerPoint, Keynote, or Google Slides.


23 slides
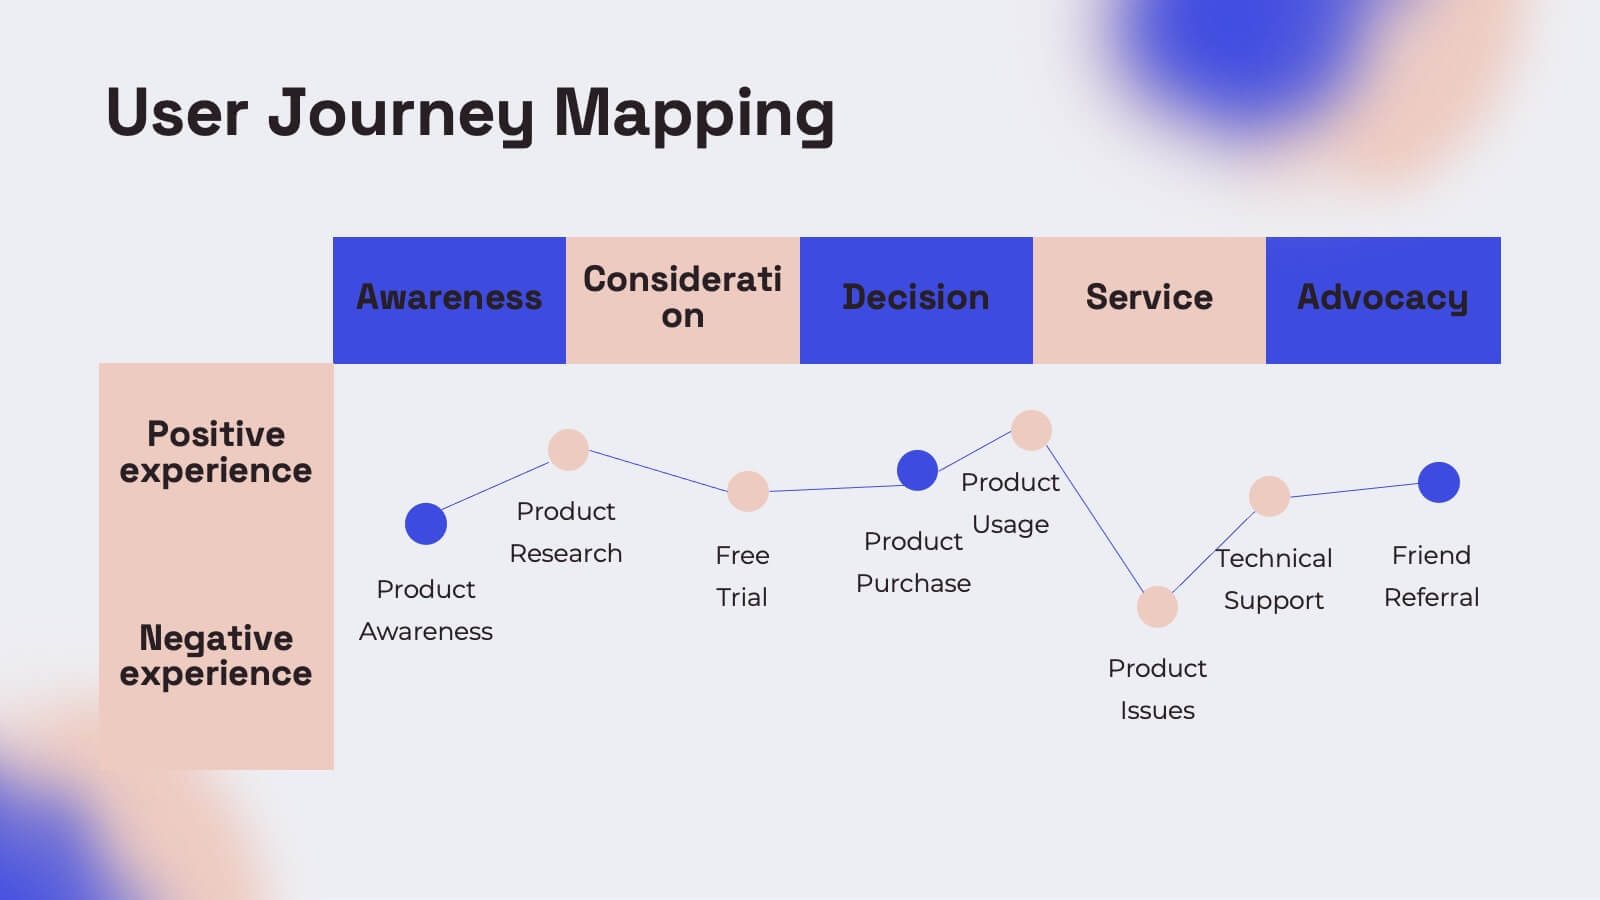
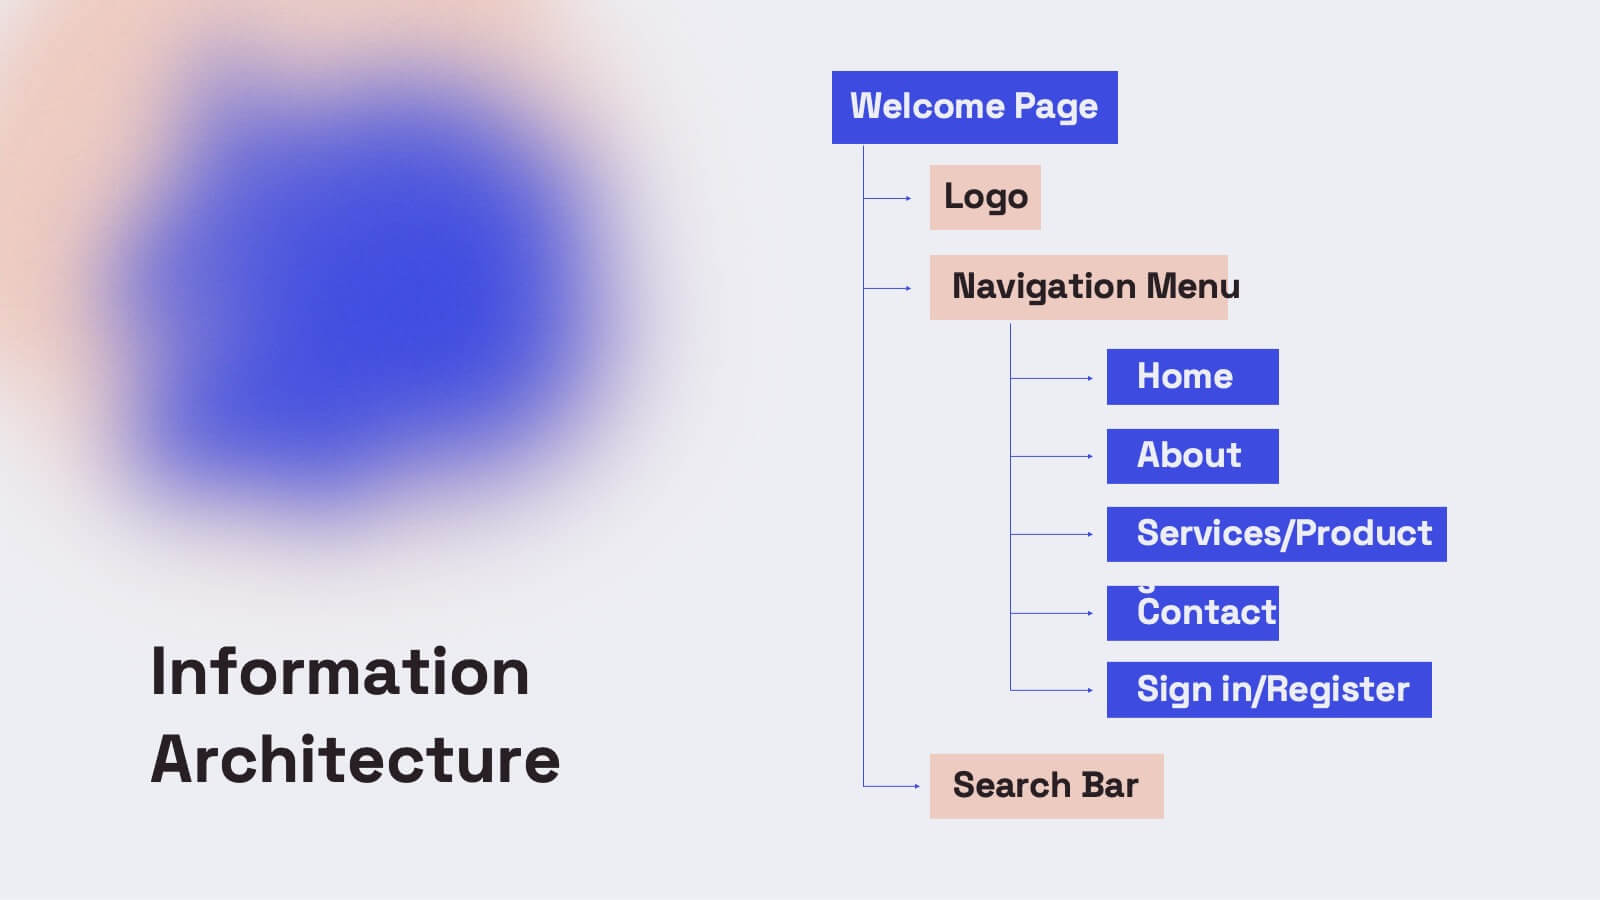
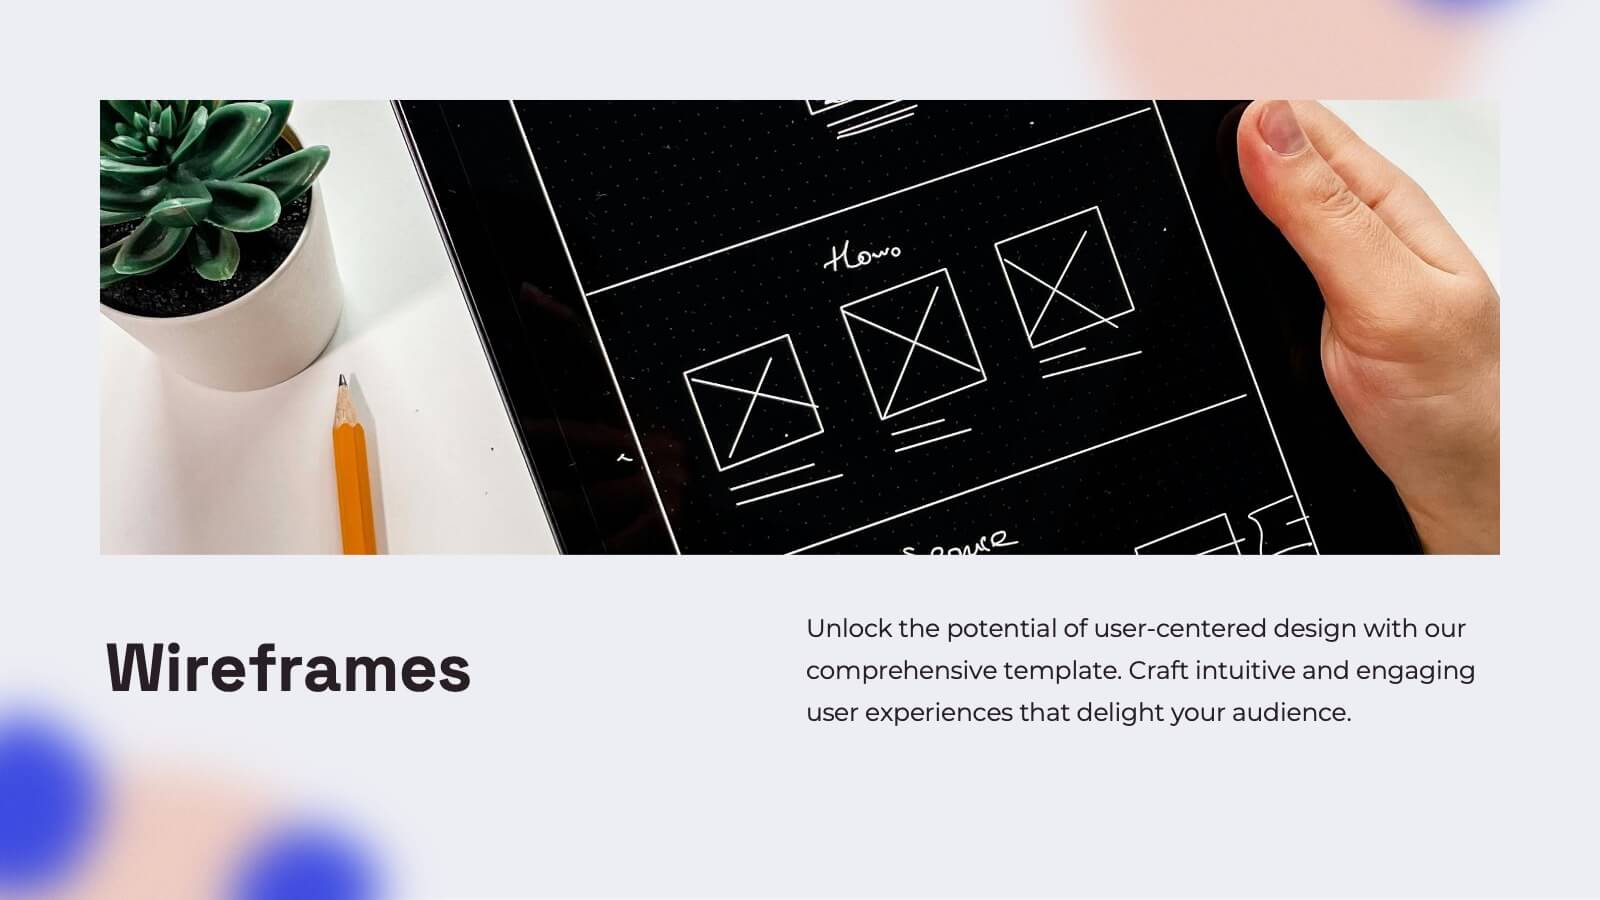
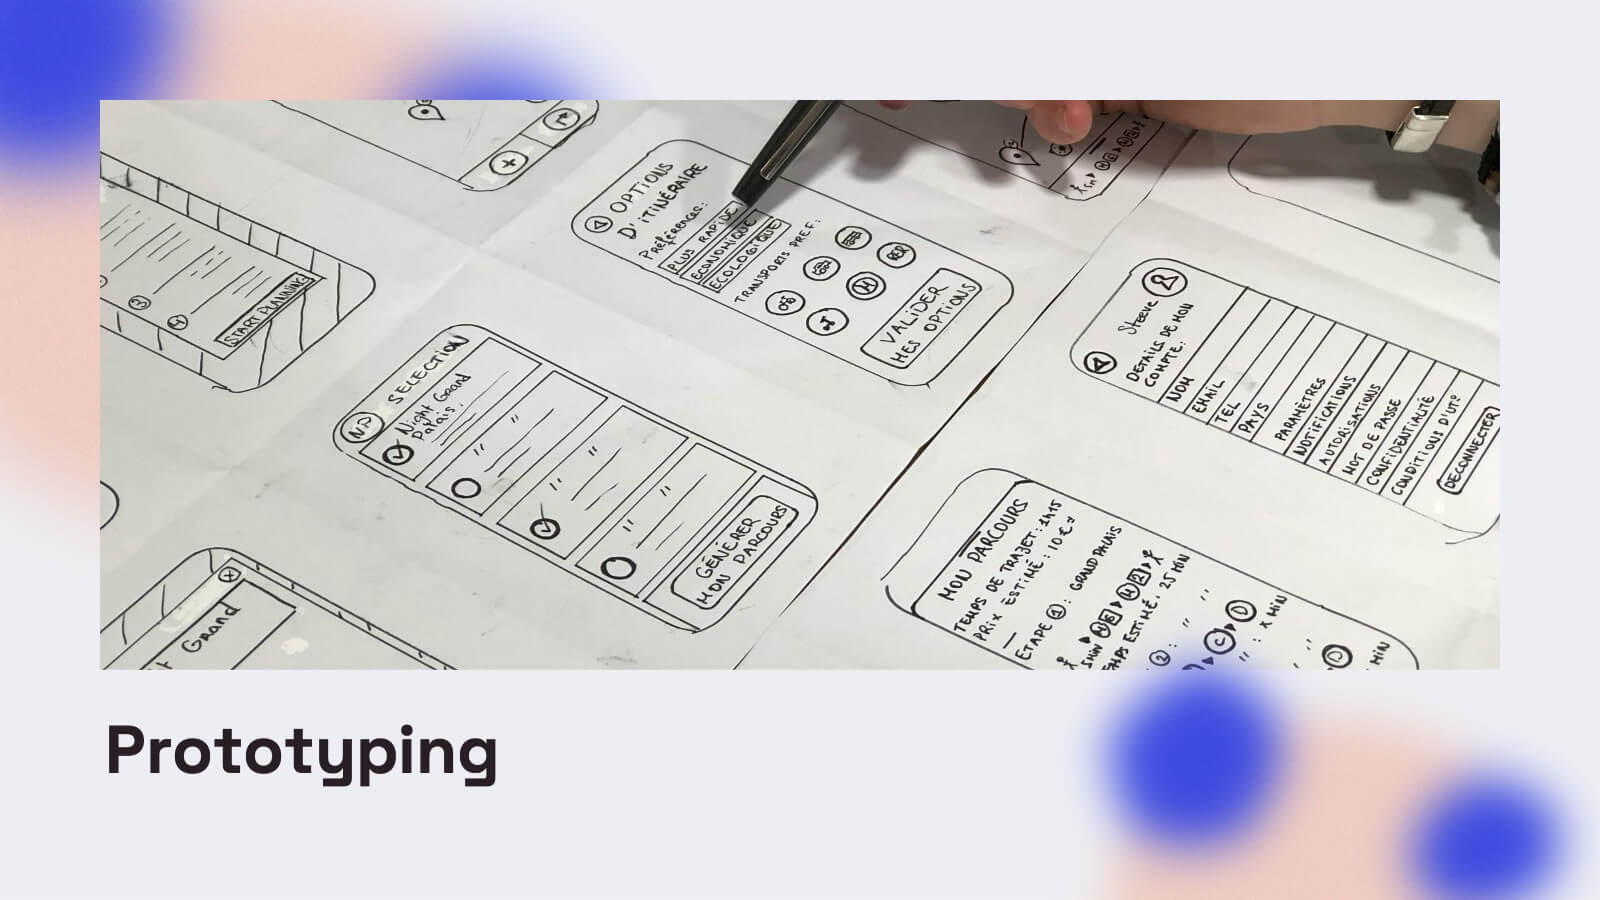
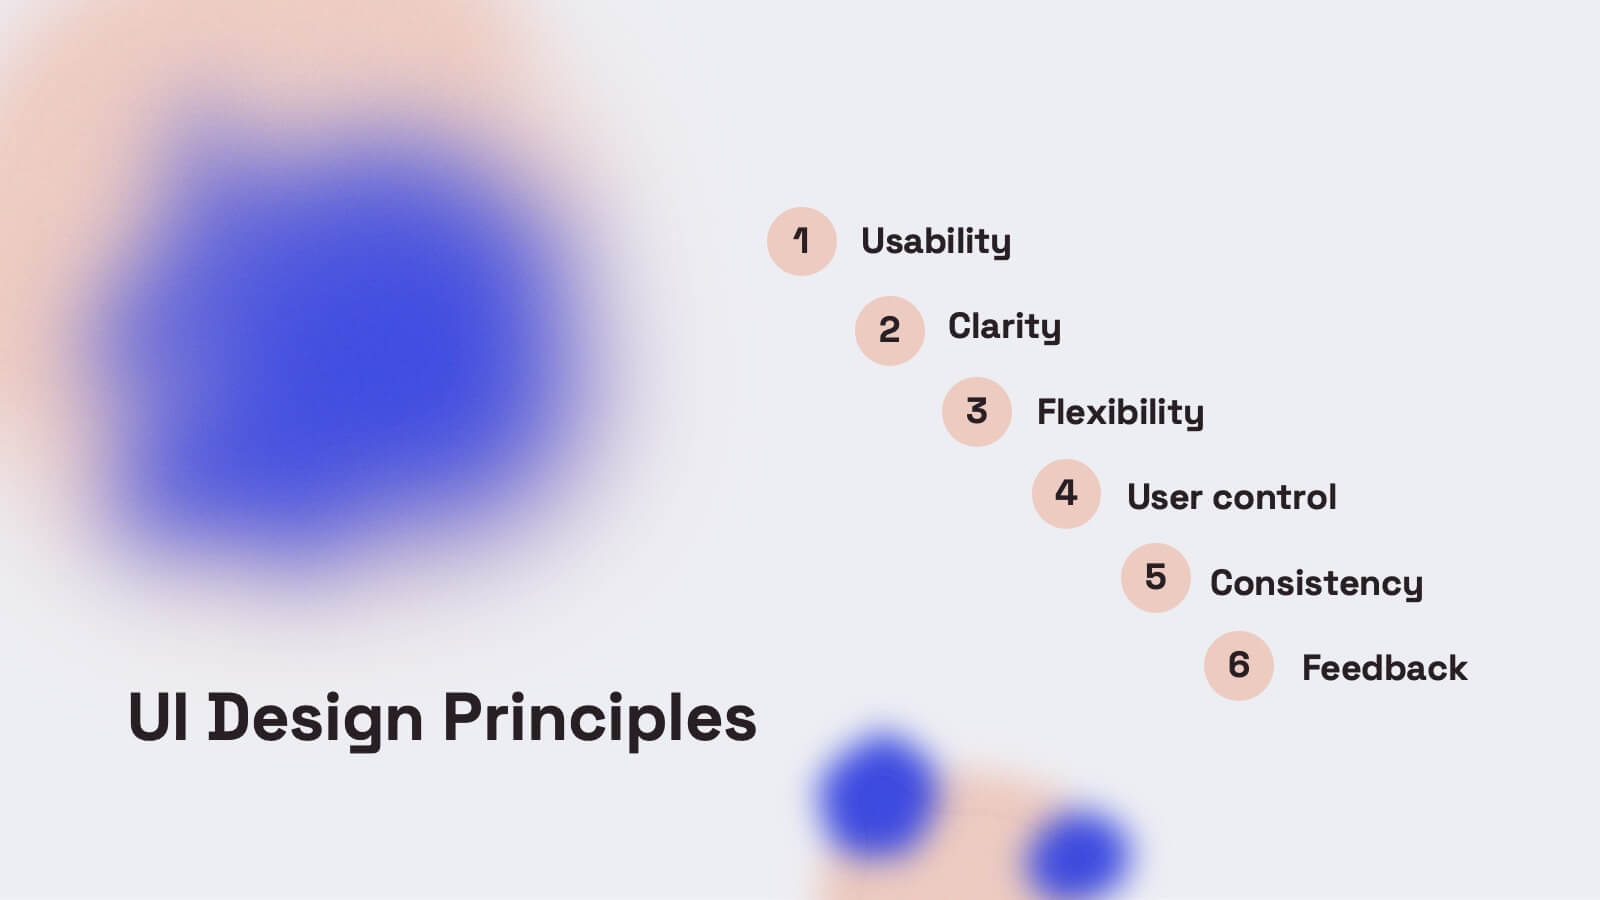
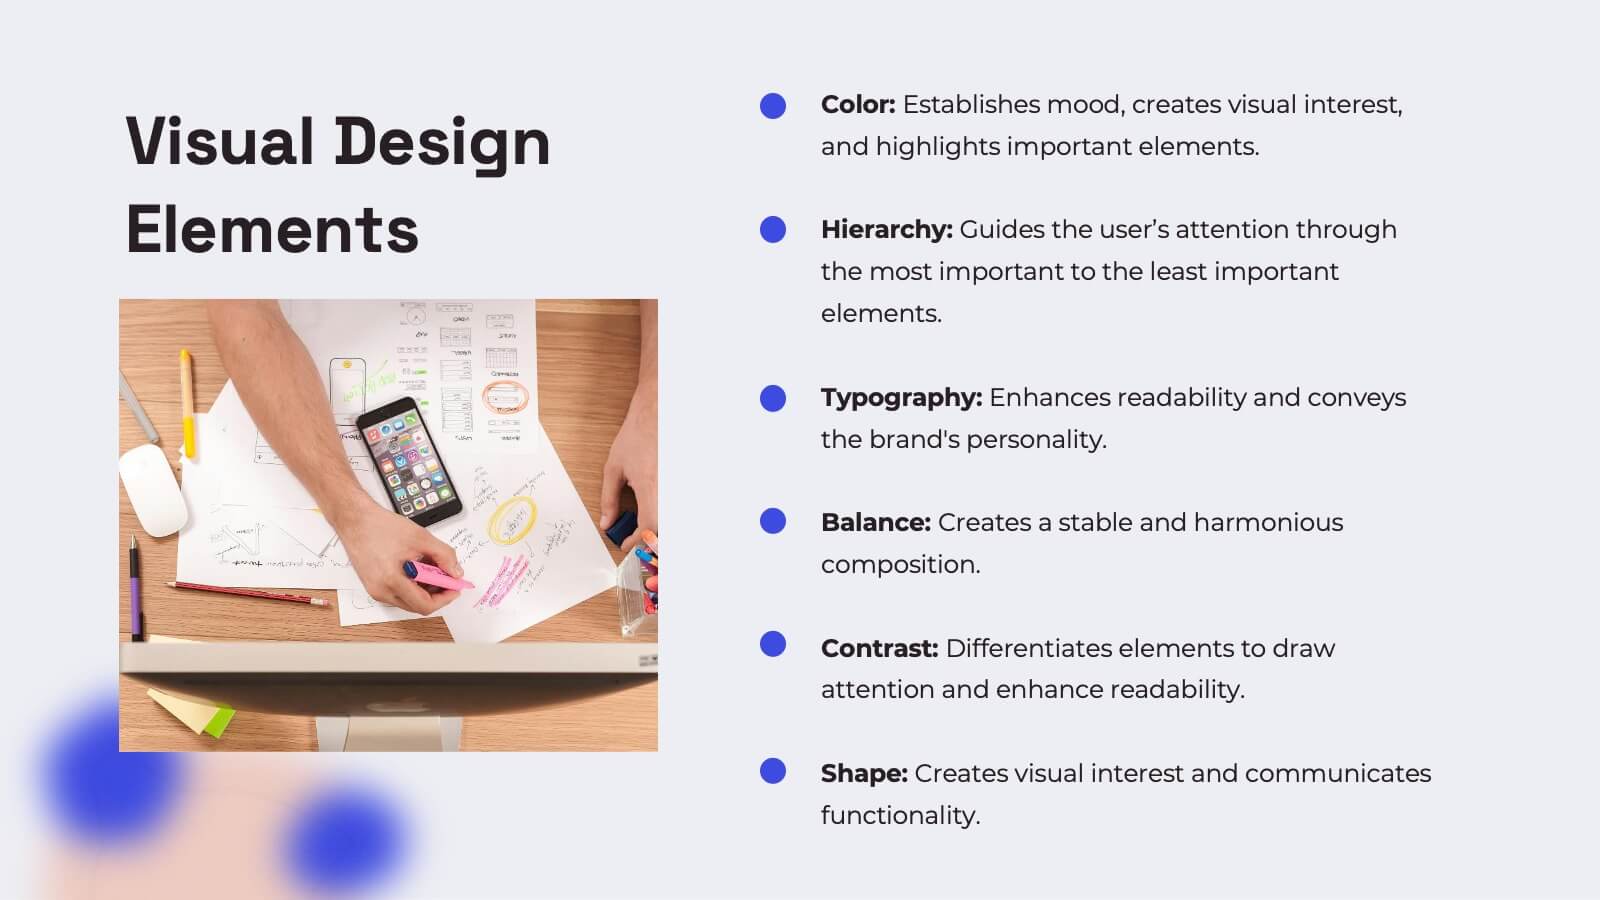
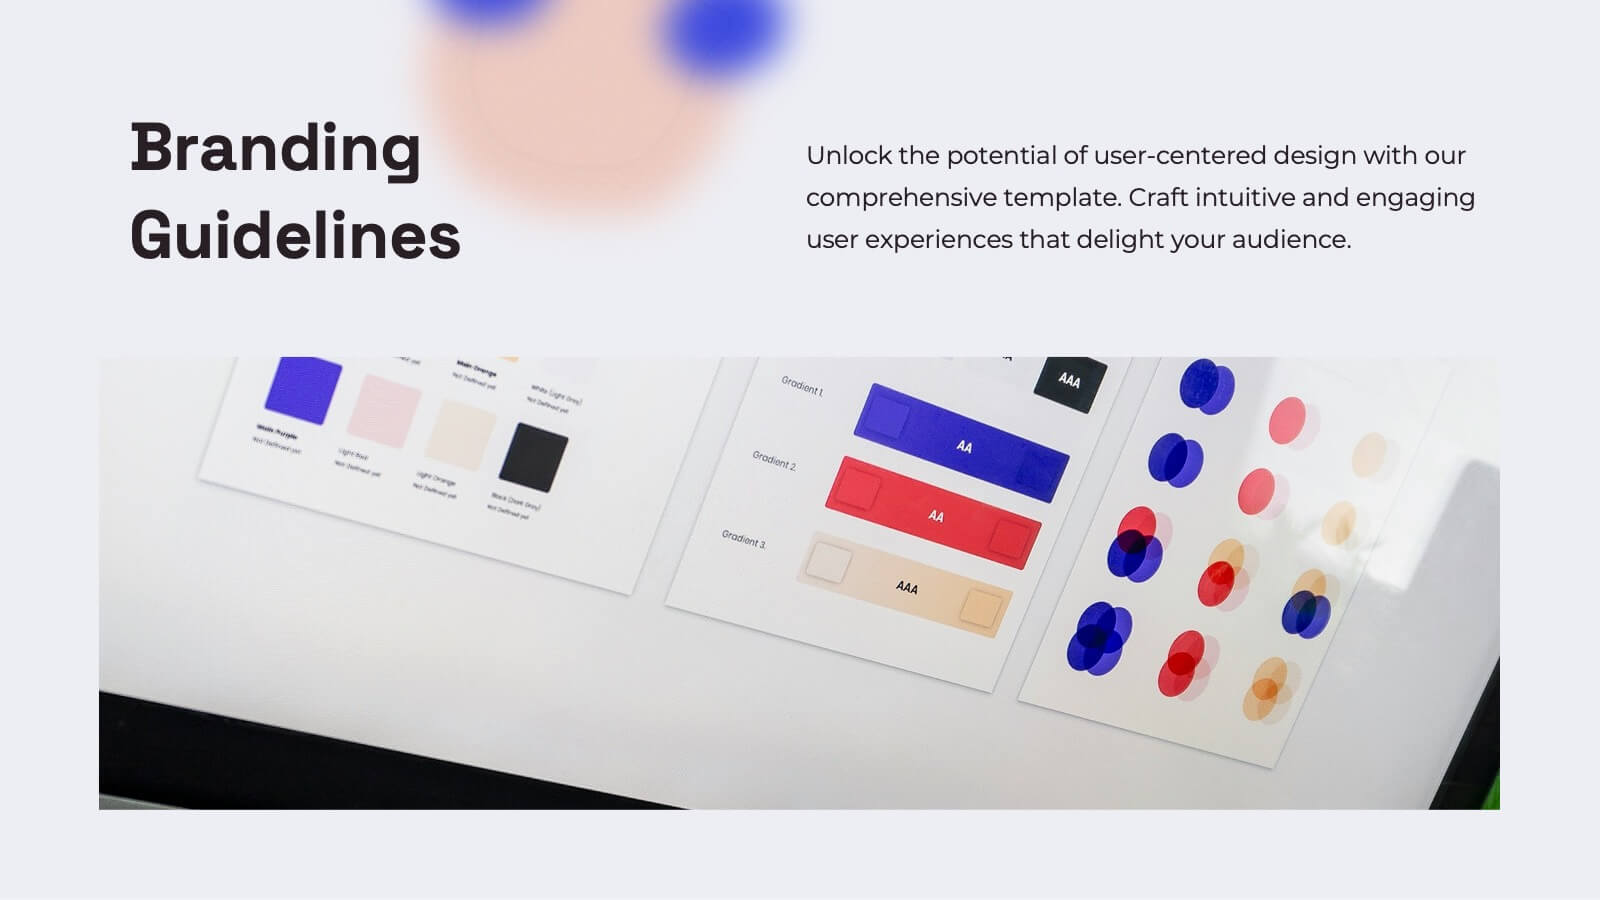
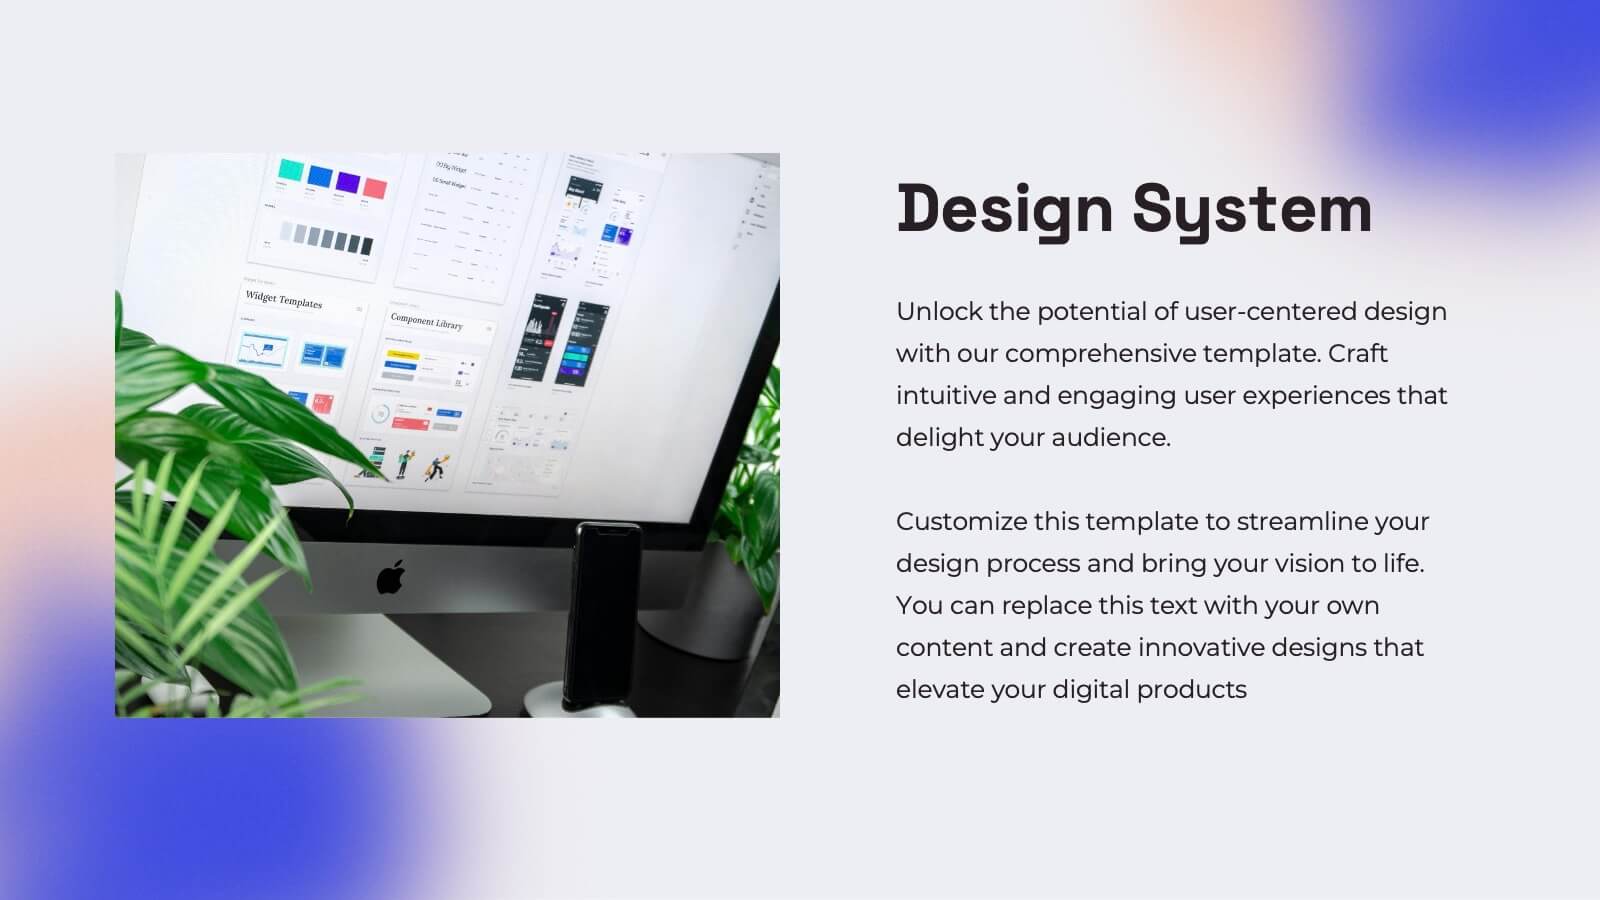
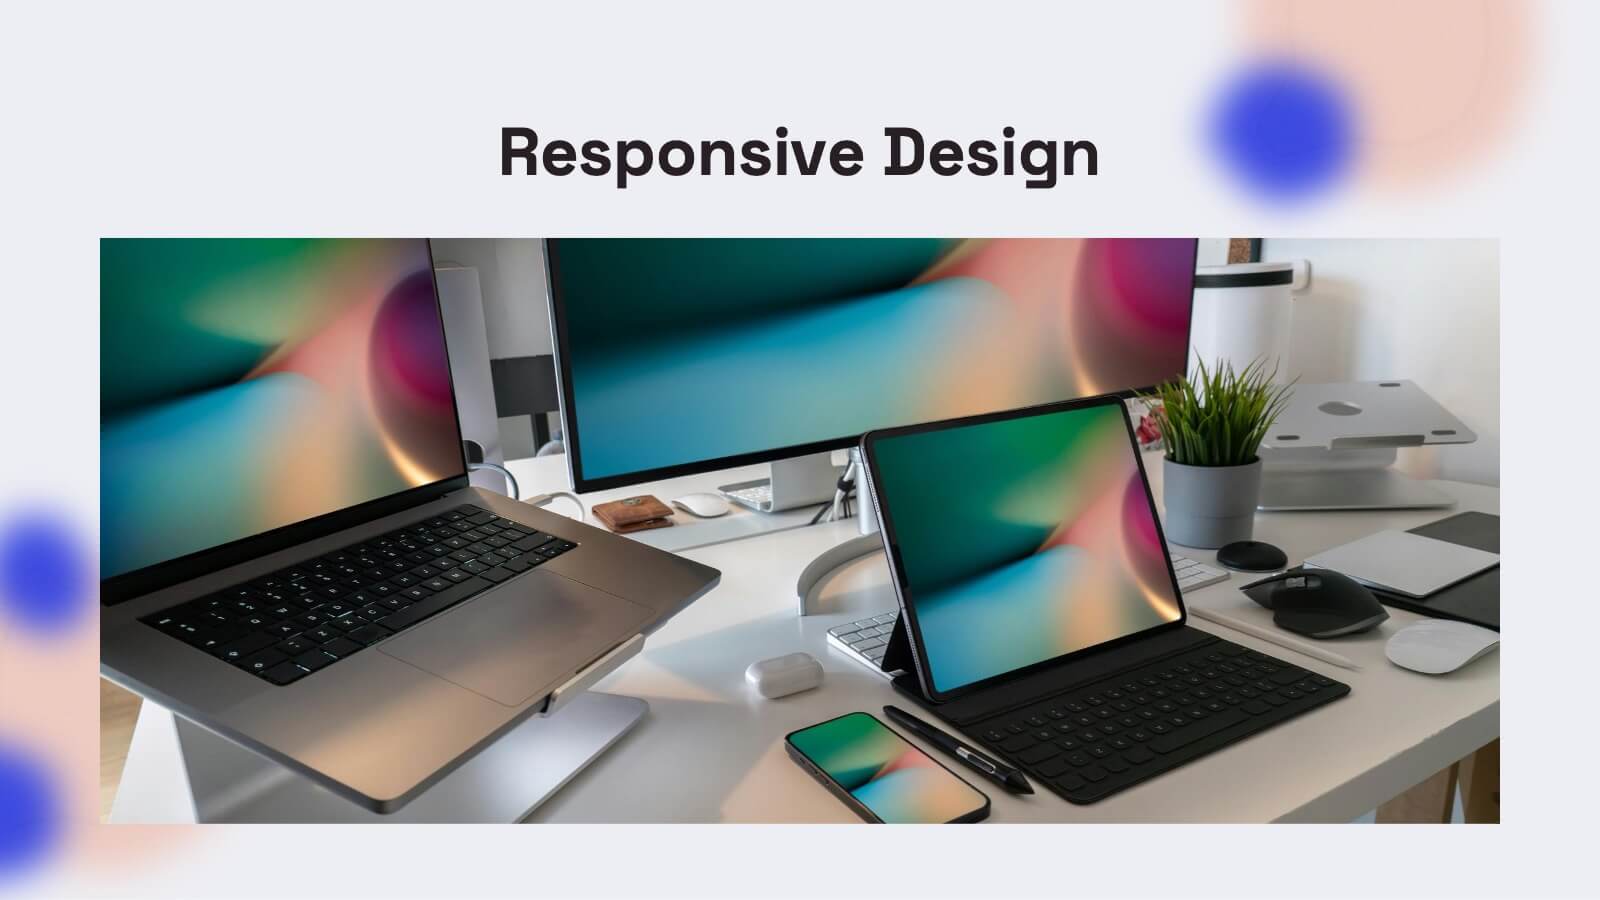
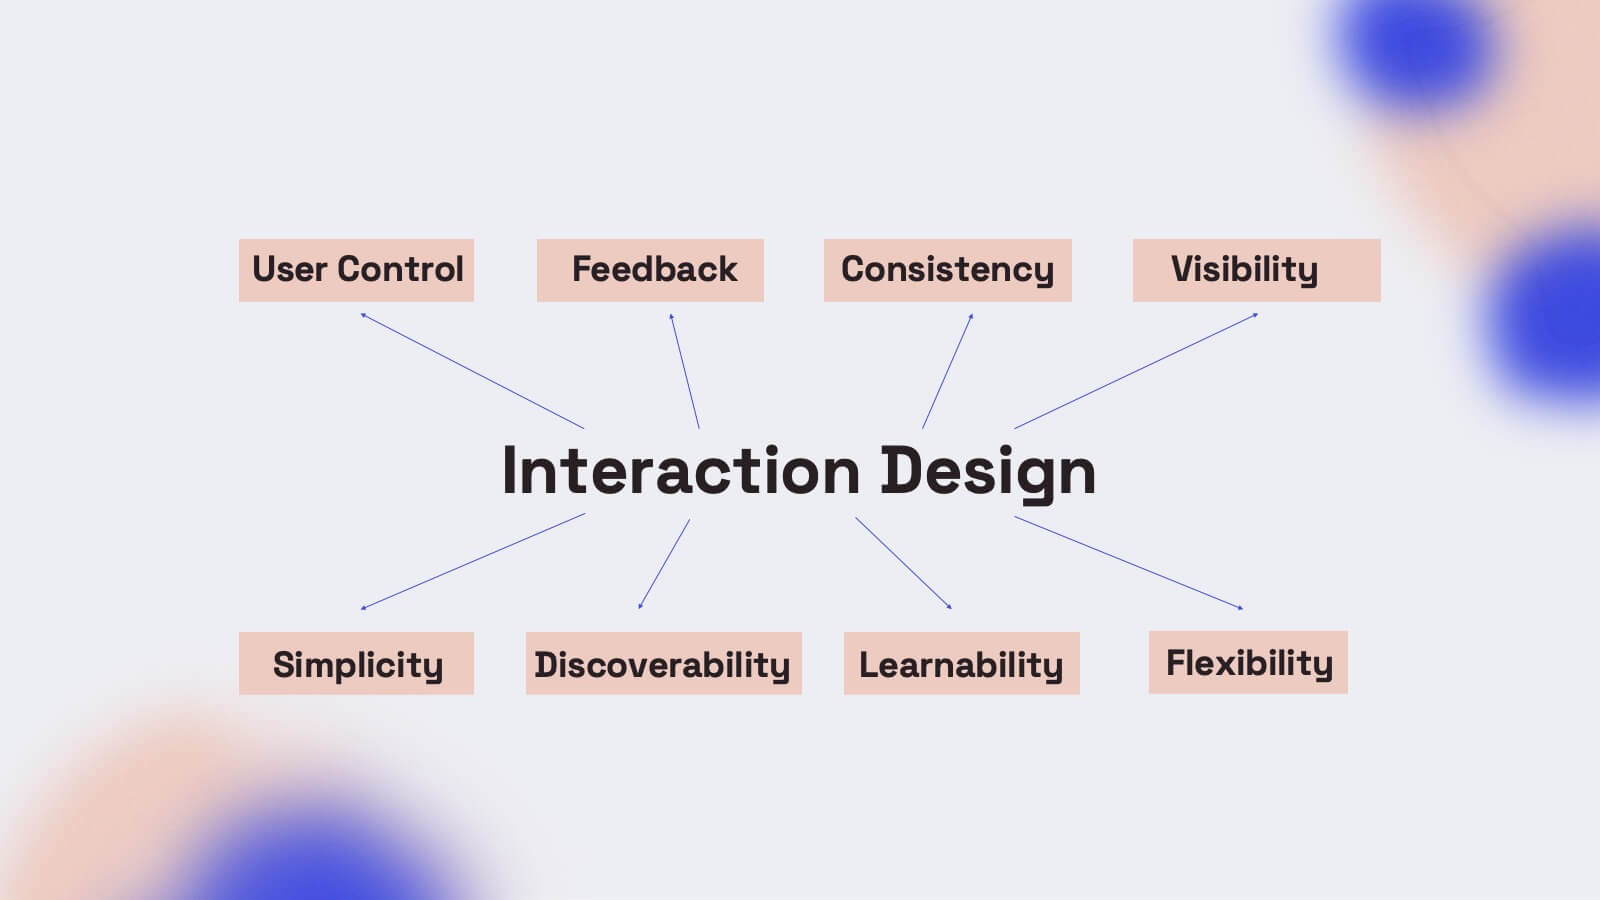
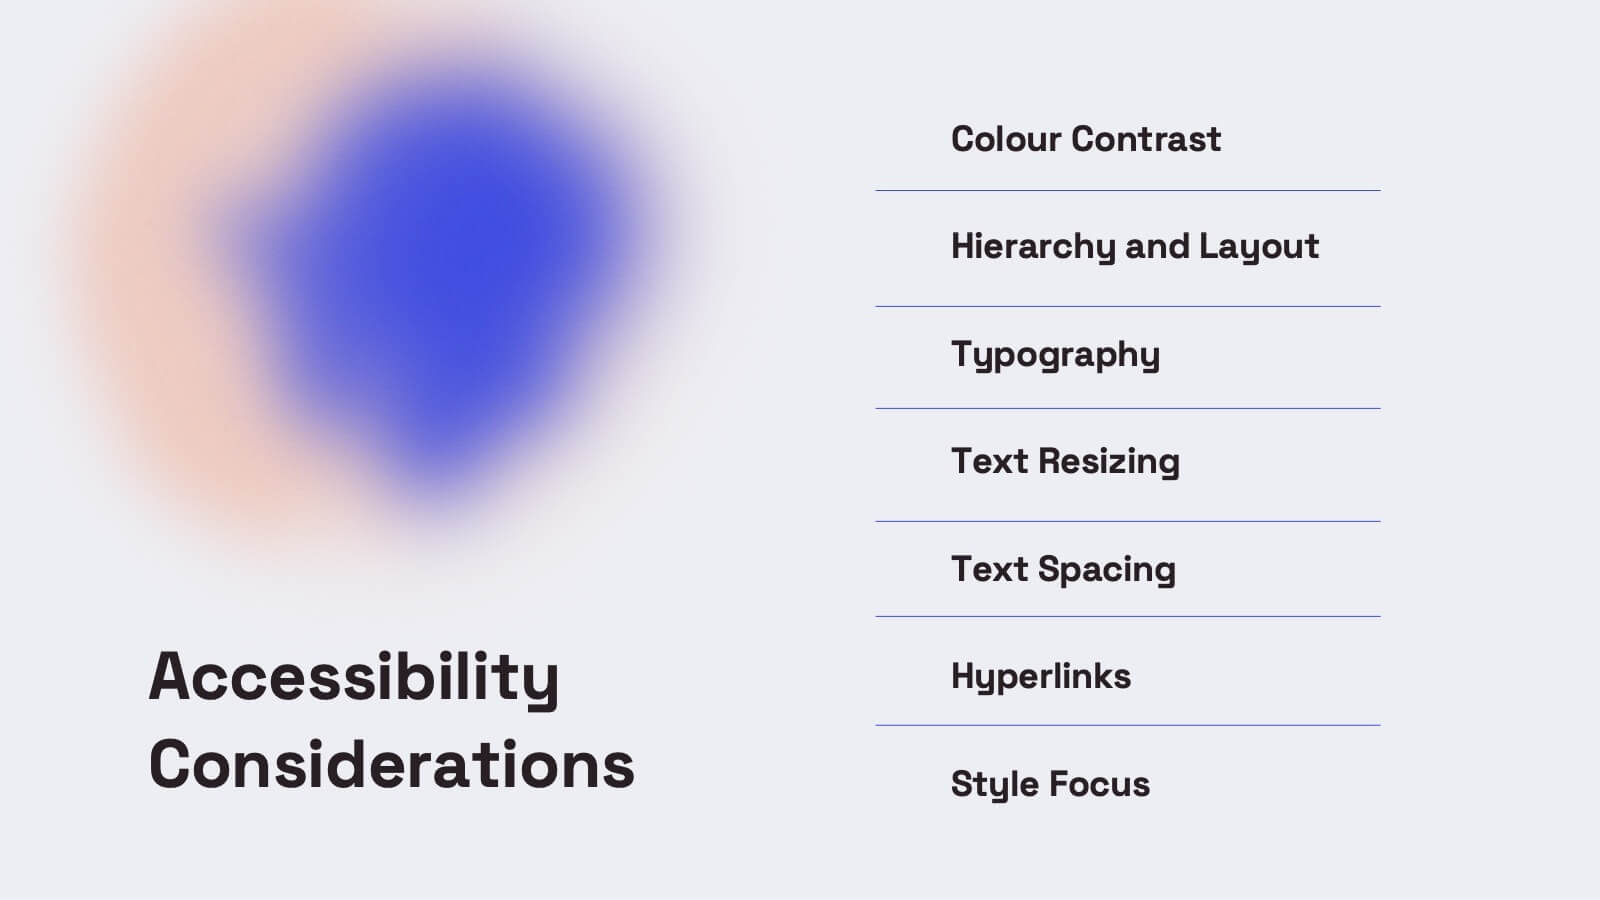
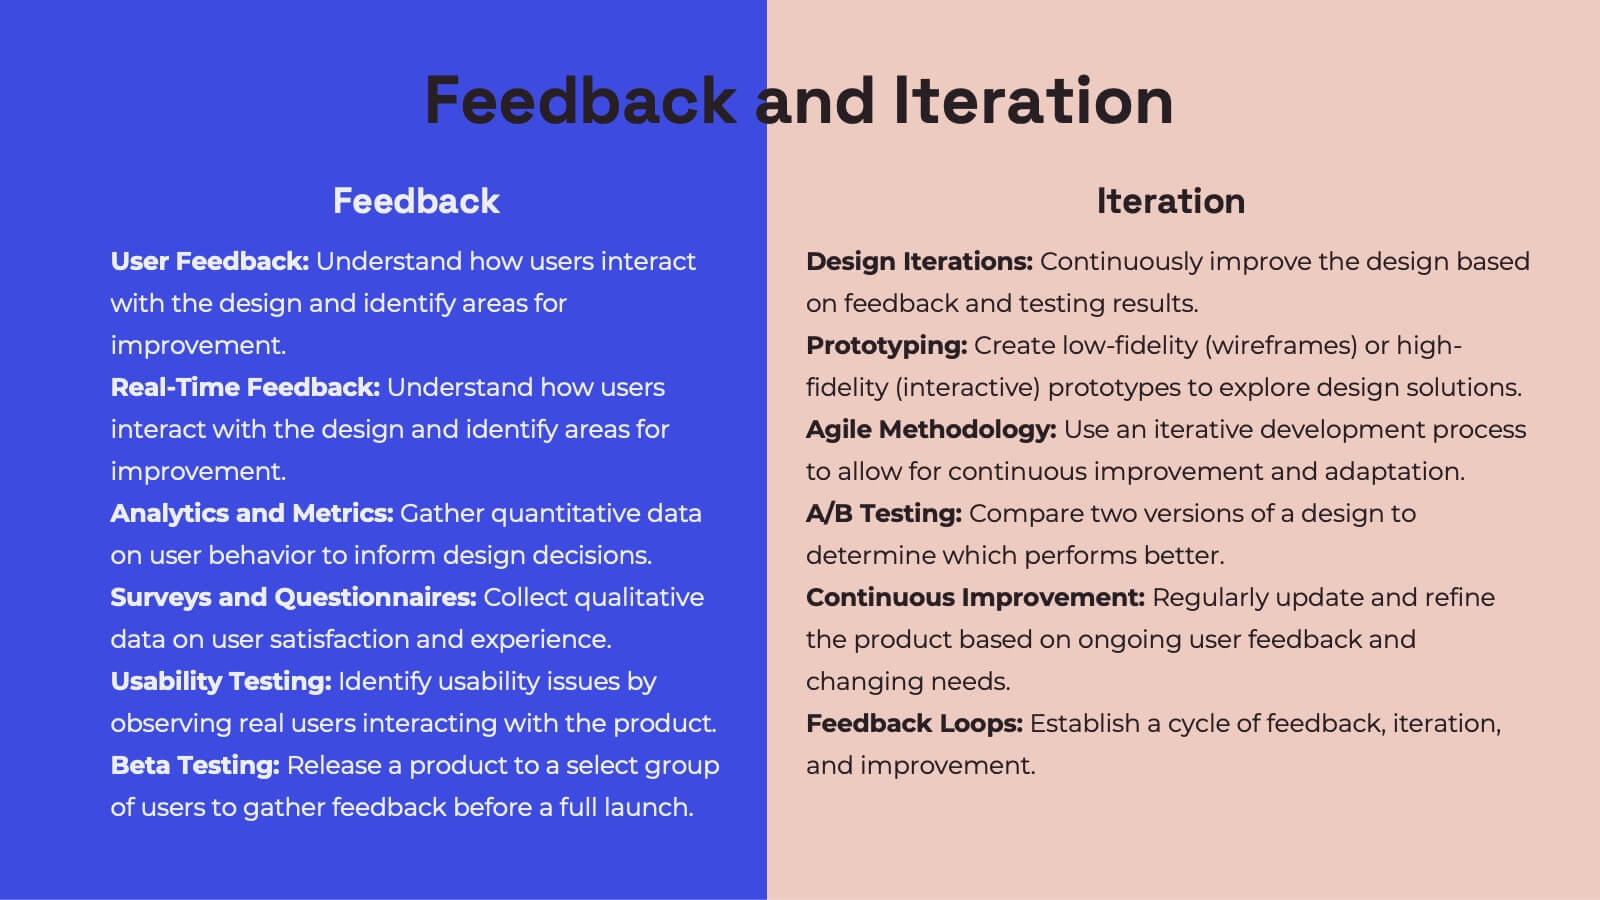
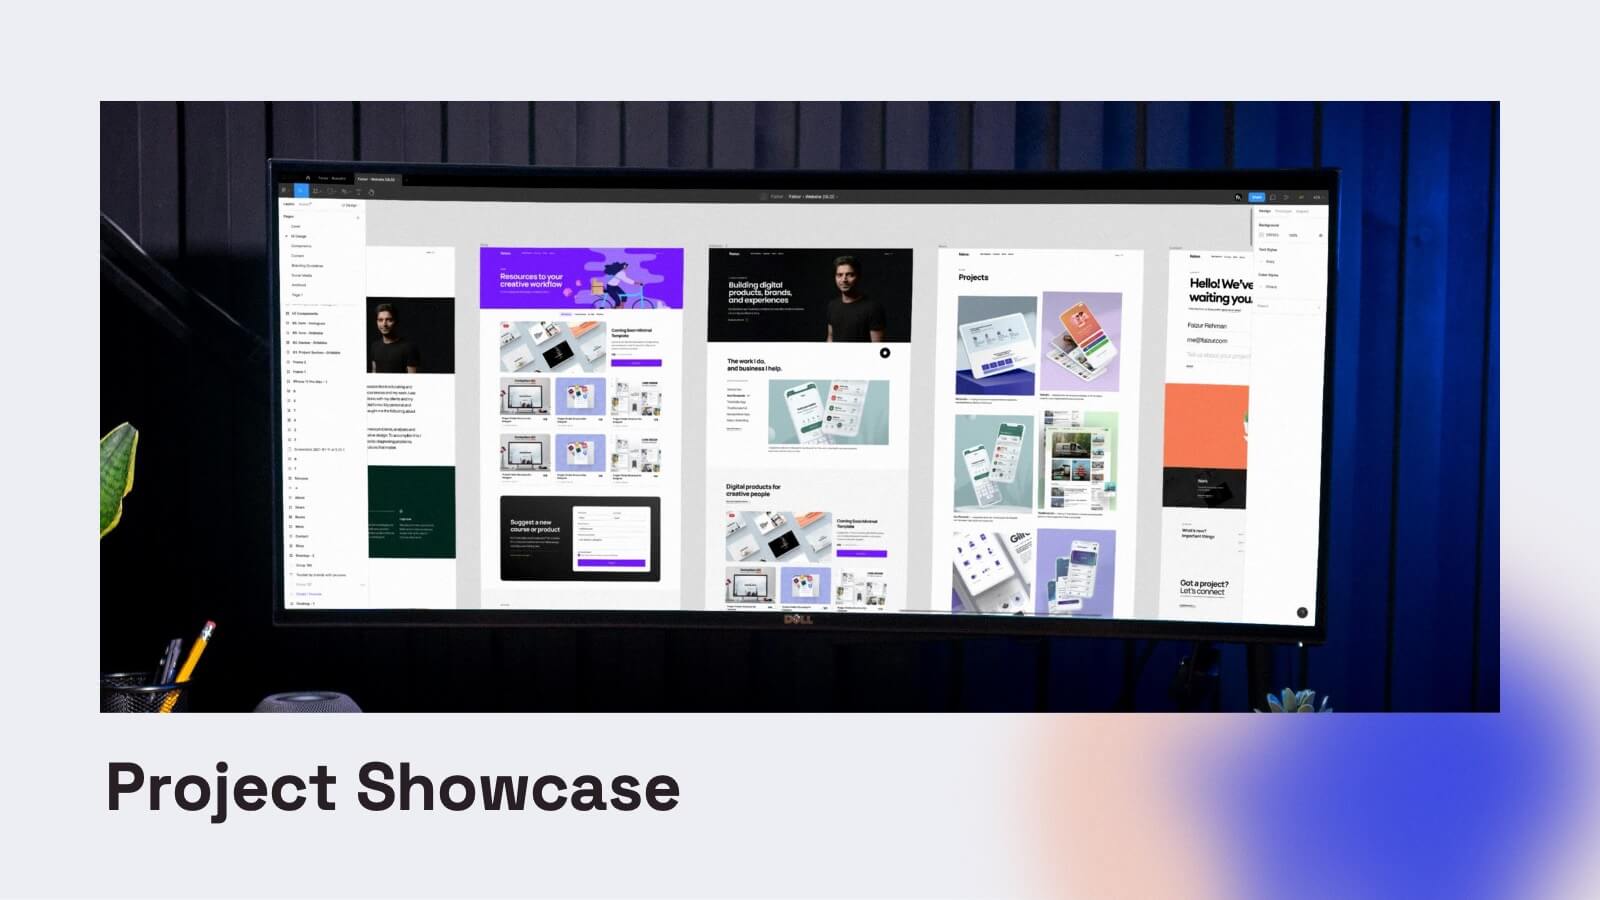
Gemini UX Design Presentation
Enhance your UX presentations with this vibrant and user-friendly template. Designed to cover every aspect of UX design, from user research and personas to wireframes and prototyping, this template ensures a comprehensive and engaging delivery. Its modern design and structured layout make your insights clear and impactful. Compatible with PowerPoint, Keynote, and Google Slides, it's perfect for any platform.