


Features
- 6 Unique slides
- Fully editable and easy to edit in Microsoft Powerpoint, Keynote and Google Slides
- 16:9 widescreen layout
- Clean and professional designs
- Export to JPG, PDF or send by email


Do you have any questions?
Recommend


26 slides
Creative Cryptocurrency Investment Presentation
The growth of Cryptocurrency has been significant over the past few years. It is very important to do your own research, understand the risks involved, and only invest what you can afford to lose. This template is designed with a focus on cryptocurrencies and includes customizable photo layouts, charts, a gold coin pattern and unique cryptocurrency-themed icons and illustrations. You can use this template for any topic related to Cryptocurrency or Blockchain. Create your own presentation within minutes using Powerpoint, Keynote, or Google slides, it is fully editable to suit your needs.


4 slides
Preventive Health Services Layout Presentation
Make health data more human with this modern infographic layout for service-based reporting. This preventive health slide design clearly maps wellness categories to body parts, making it easy to communicate medical insights and early intervention strategies. Fully editable and compatible with PowerPoint, Keynote, and Google Slides for smooth integration into any deck.


10 slides
Effective Team Building Presentation
Spark stronger teamwork with a clean, engaging layout that makes group objectives easy to explain and even easier to remember. This presentation highlights key actions, shared responsibilities, and collaborative strategies in a simple visual flow that supports any team discussion. Fully compatible with PowerPoint, Keynote, and Google Slides.


10 slides
Customer Market Segmentation Strategy Presentation
Define and visualize your audience with the Customer Market Segmentation Strategy Presentation. This slide layout helps you categorize customer types using clean iconography and a central persona model. Ideal for marketing teams, sales strategists, or startup pitches. Customize easily in Canva, PowerPoint, Google Slides, or Keynote.


4 slides
3-Level Pyramid Diagram Presentation
Visualize priorities, strategies, or business structures with the 3-Level Pyramid Diagram Presentation. This slide design features a clear tiered layout—ideal for showcasing step-by-step processes, hierarchy levels, or goal-setting frameworks. Each level is color-coded for easy understanding, and the accompanying text areas keep messaging concise. Fully editable and compatible with PowerPoint, Keynote, and Google Slides.


5 slides
United States States Outline Presentation
Make your data pop with a vibrant, easy-to-read snapshot of U.S. state insights. This presentation helps you highlight regional trends, compare performance, and showcase key information using a clean state-by-state outline. Perfect for reports, geography topics, or analytics. Fully compatible with PowerPoint, Keynote, and Google Slides.


22 slides
Pearl Product Launch Pitch Deck Presentation
Make your product launch shine with this sleek, pearl-inspired presentation! Perfect for pitching your product’s unique value, market positioning, and growth potential, this template is designed to captivate investors and stakeholders. Its elegant, minimalist layout keeps your message front and center. Compatible with PowerPoint, Keynote, and Google Slides.


4 slides
AI Trends and Use Cases Presentation
Step into the future with a clean, modern layout that makes complex technology easy to grasp and exciting to explore. This presentation helps you break down emerging innovations, real-world applications, and industry opportunities using clear visuals and structured sections. Fully customizable and compatible with PowerPoint, Keynote, and Google Slides.


5 slides
Effective Time Management Strategies Presentation
Master productivity with structured time management strategies using this Effective Time Management Strategies template. Featuring a dynamic stopwatch visual, this slide is perfect for presenting key productivity techniques, time-blocking methods, and efficiency-boosting strategies. Ideal for business professionals, project managers, and personal development trainers, this template is fully customizable and compatible with PowerPoint, Keynote, and Google Slides.


5 slides
Step-by-Step Planning Roadmap Presentation
Clarify each phase of your strategy with the Step-by-Step Planning Roadmap Presentation. This engaging slide design uses a staircase-style layout with labeled checkpoints (A–E) and matching text boxes to clearly communicate sequential goals or stages. Great for project roadmaps, implementation plans, or business timelines. Fully customizable in PowerPoint, Keynote, and Google Slides.


6 slides
Environmental Ecology Report Presentation
Bring sustainability to life with a clear, refreshing design that makes complex environmental insights easy to share. This presentation helps you explain key ecological data, conservation efforts, and resource impact using simple visuals and structured points. Perfect for reports or awareness talks. Fully compatible with PowerPoint, Keynote, and Google Slides.


34 slides
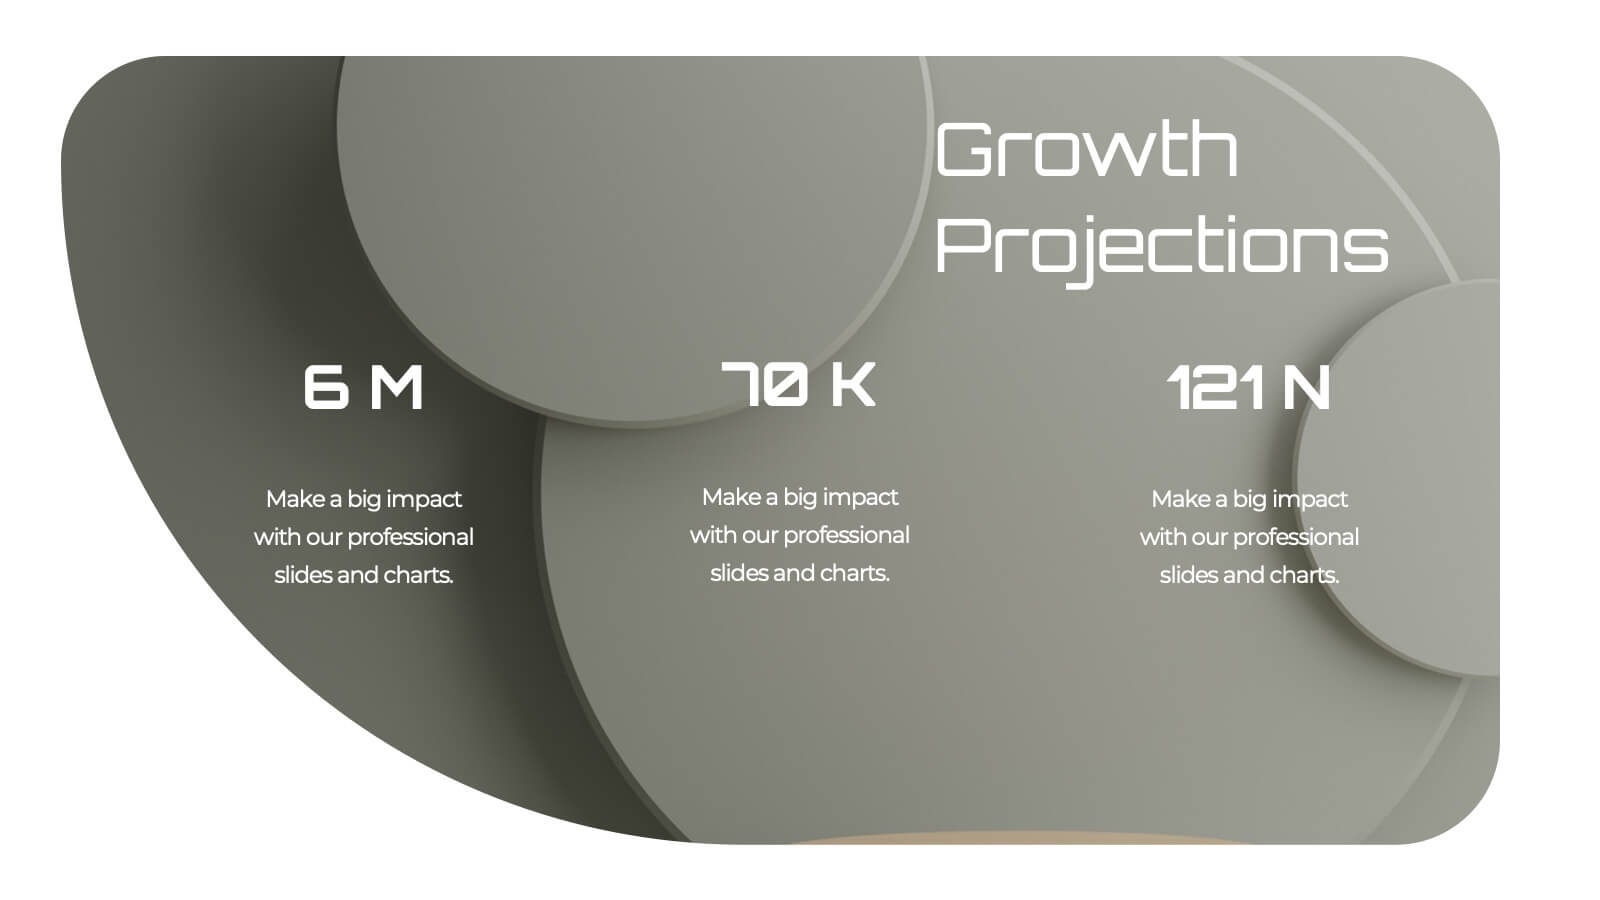
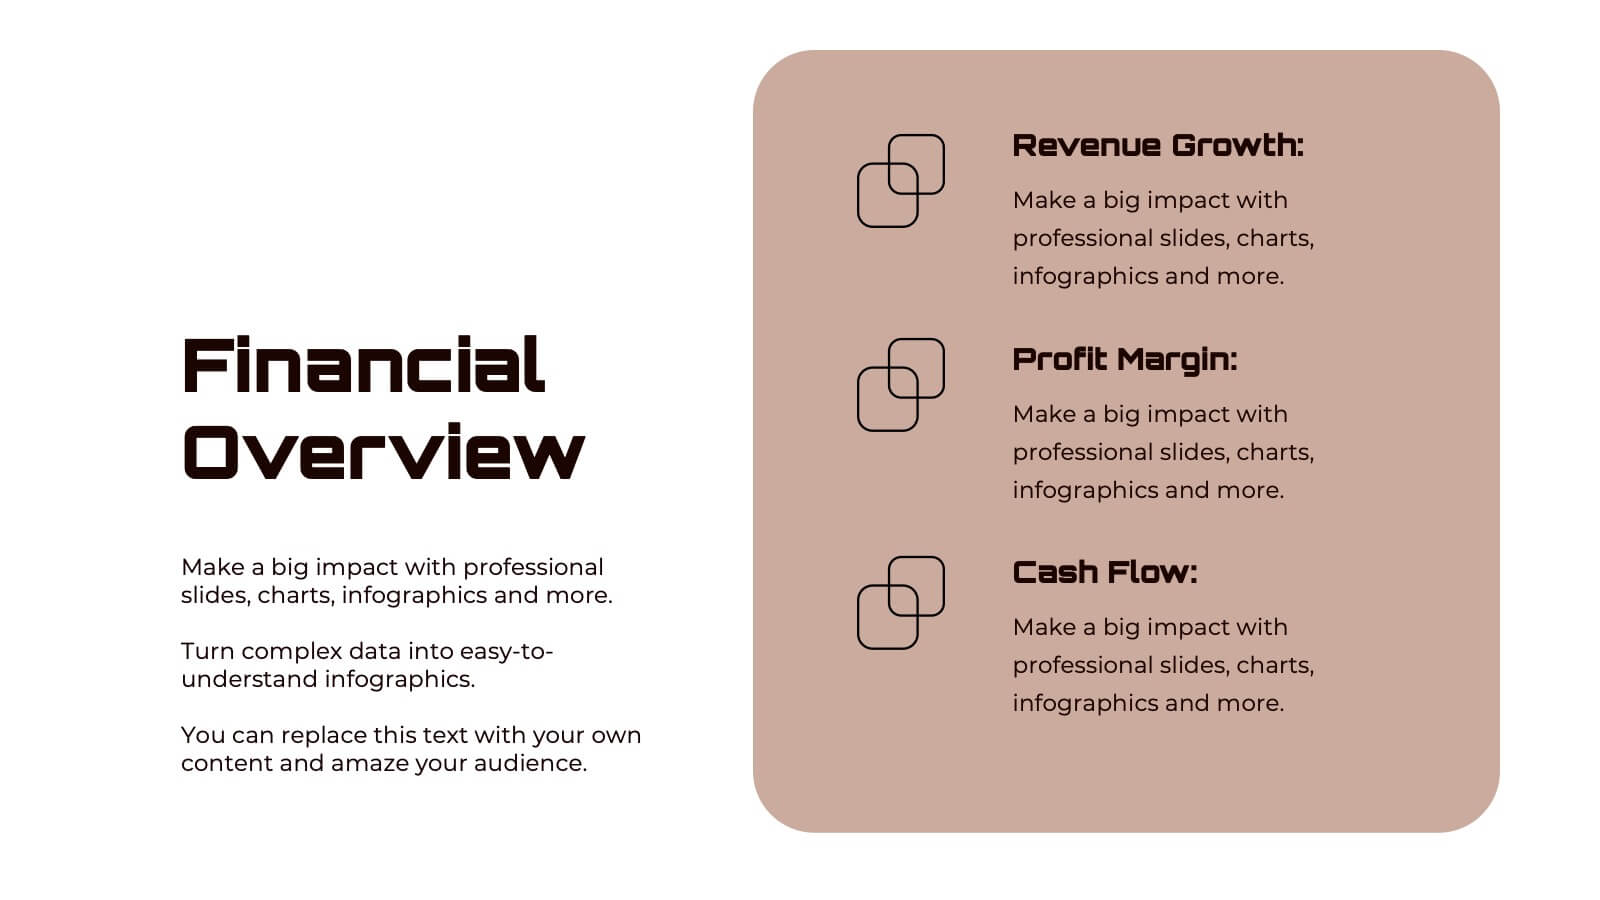
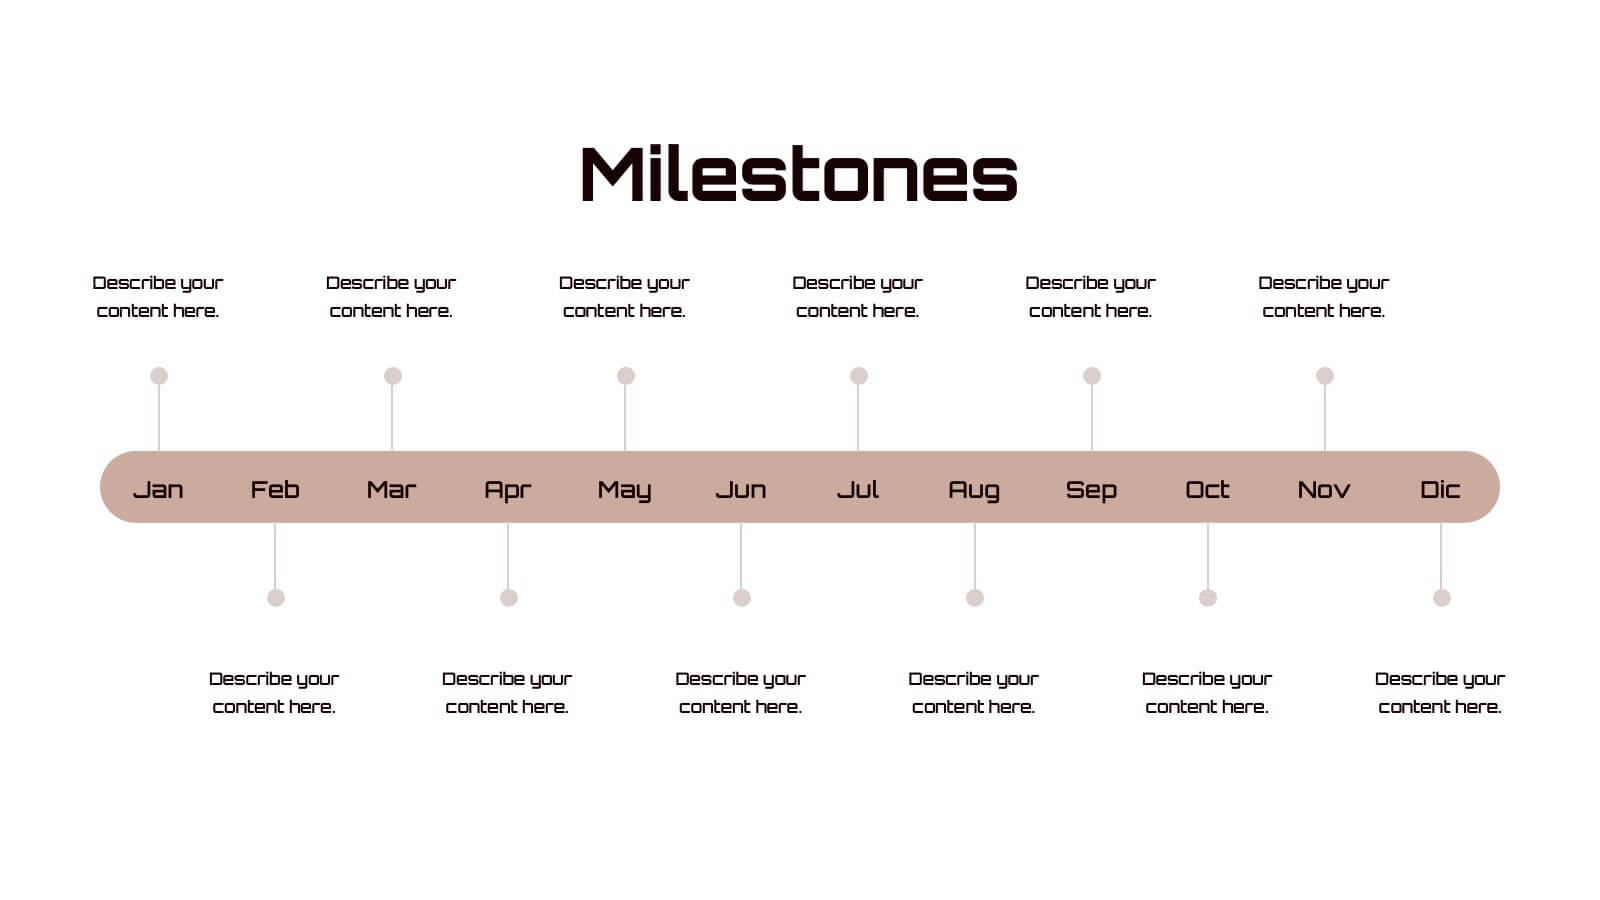
Pitch Deck Startup
Introducing our Pitch Deck Startup! Whether you are pitching to investors, partners, or customers, this template will help you create a persuasive presentation that showcases your company, growth plans, and financial projections. Customize the template to suit your needs and deliver a successful pitch that highlights the unique value of your startup and attracts potential investors or customers. This template includes sections for introducing your startup, explaining your business idea and market opportunity, showcasing your products or services, highlighting your financial projections, and outlining your growth plans.


6 slides
Corporate Health Metrics Dashboard Presentation
Take the pulse of your workplace with this dynamic health dashboard presentation layout. Designed to visualize employee wellness data, activity levels, and corporate health KPIs, this template blends clarity and creativity for impactful reporting. Easily customizable and fully compatible with PowerPoint, Keynote, and Google Slides to fit your presentation needs.


7 slides
Asia Countries Map Infographic
This Asia Countries Map infographic template is ideal for presentations requiring a detailed breakdown of geographic and statistical data across Asia. Compatible with PowerPoint, Google Slides, and Keynote, it features a collection of map styles and data visualization tools including icons, bar charts, and color-coded points for easy data comparison and interpretation. The template is perfect for visualizing diverse metrics such as demographic details or social statistics, with each slide tailored to display information in a clear, engaging manner. This tool is exceptionally suited for educators, and business professionals who need to convey complex data about Asian countries.


4 slides
Report Recap and Summary Section Presentation
Summarize key takeaways clearly with this Report Recap and Summary Section slide. Featuring a step-by-step horizontal layout with bold numbering, icons, and text boxes, this design helps emphasize three main points or stages in your report. Ideal for executive briefs or performance reviews. Fully editable in Canva, PowerPoint, or Google Slides.


5 slides
Business Hierarchy Pyramid Presentation
Present your business structure or priorities with clarity using our "Business Hierarchy Pyramid Presentation" template. This infographic elegantly segments different layers or levels within your organization, project, or planning strategy, with a pyramid design that visually emphasizes the foundational to advanced stages. Each level of the pyramid is distinctly colored and labeled, allowing you to easily insert key points or data relevant to each segment. Ideal for corporate presentations, strategic meetings, and management training, this template ensures your key concepts are organized and clearly communicated. Compatible with PowerPoint, Keynote, and Google Slides, it integrates effortlessly into your professional toolkit.


7 slides
Agenda Company Infographic
Optimize your corporate meetings with our premium collection of company agenda slide templates. Each slide is precisely designed to streamline and enhance the presentation of meeting agendas within a corporate setting. These templates are perfect for laying out the sequence of discussions, key points, and decision-making processes planned for corporate gatherings. The designs range from minimalistic layouts to more detailed ones, incorporating various graphical elements like charts, icons, and timelines to aid in visualizing the meeting’s structure. This not only helps in keeping the meeting on track but also enhances participant engagement by clearly outlining expectations and topics. These agenda slides are fully customizable, enabling adjustments in color schemes, text placement, and design elements to suit your corporate identity and specific meeting needs. Whether it's weekly team meetings, executive briefings, or annual general meetings, these templates provide the necessary structure to conduct efficient and effective corporate discussions.