


Features
- 4 Unique slides
- Fully editable and easy to edit in Microsoft Powerpoint, Keynote and Google Slides
- 16:9 widescreen layout
- Clean and professional designs
- Export to JPG, PDF or send by email


Do you have any questions?
Recommend


7 slides
Skills Gap Analysis Infographic Presentation Template
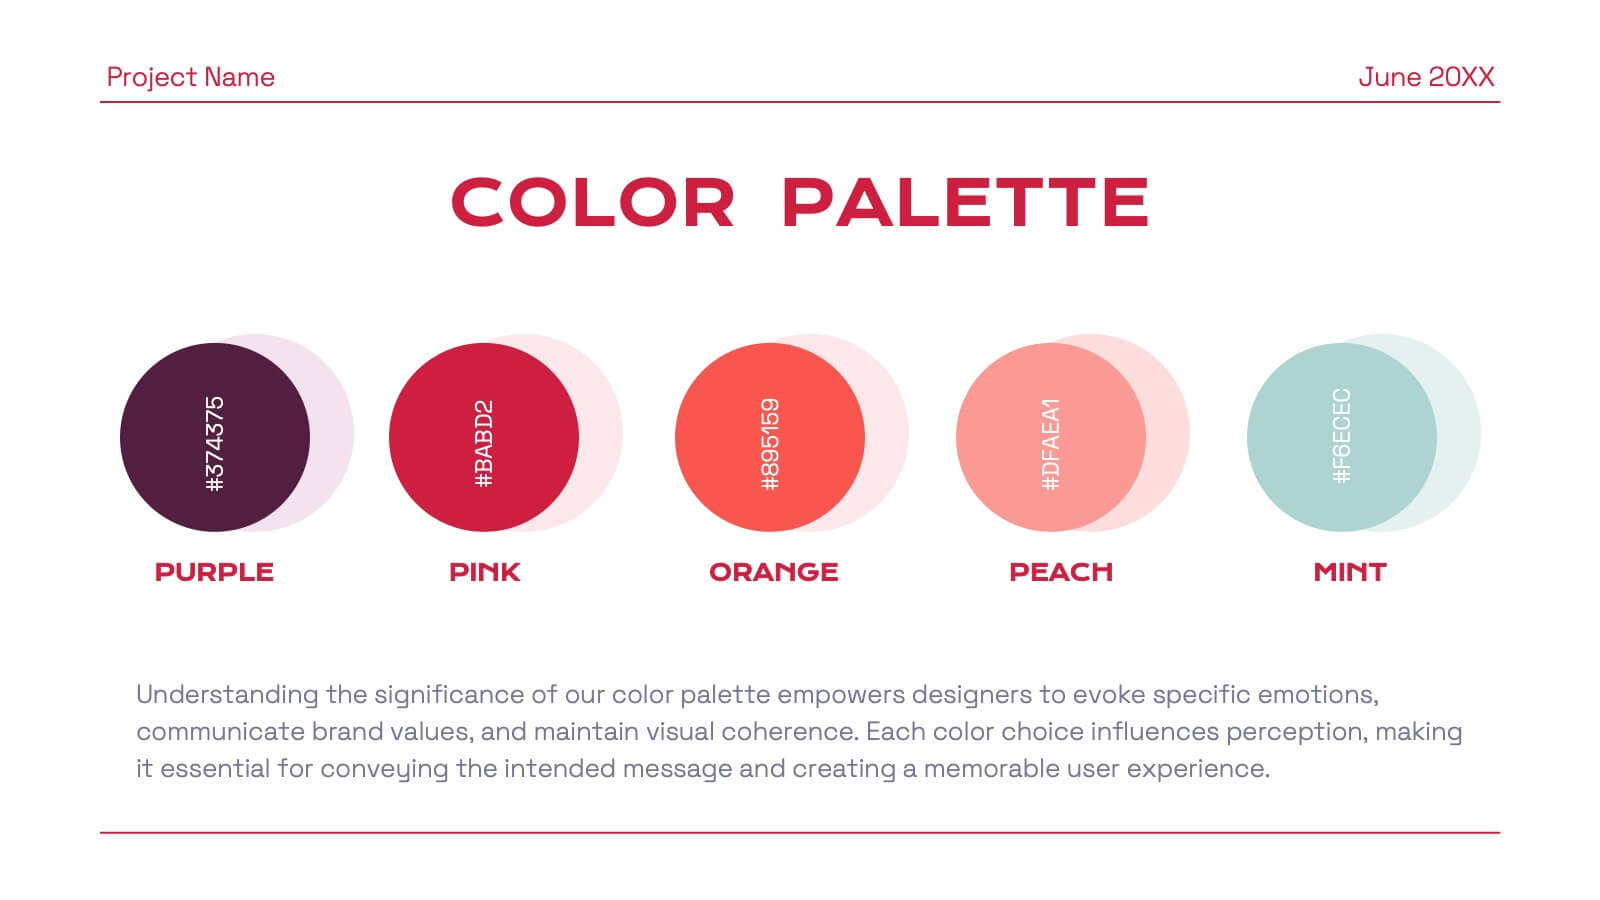
A skills gap analysis is a process that identifies organizational skill gaps and develops a plan to fill them. Employers use this process when they are trying to gauge their current skill sets, identify future needs and understand the best ways to meet those needs. This is an important part of your organization's recruiting strategy. Use this customizable template to gather your own insights into the skills gap in your organization. With this template you can analyze the current state of your company and team, identify areas for improvement, and create a roadmap for growing your team.


3 slides
Agriculture Sector Insights Presentation
Bring data to life with a presentation that captures the essence of growth and sustainability. Ideal for showcasing trends, production metrics, or environmental insights, this design blends visual storytelling with professional clarity. Fully editable and compatible with PowerPoint, Keynote, and Google Slides for effortless customization and impactful delivery.


8 slides
3-Layered Circular Logic Presentation
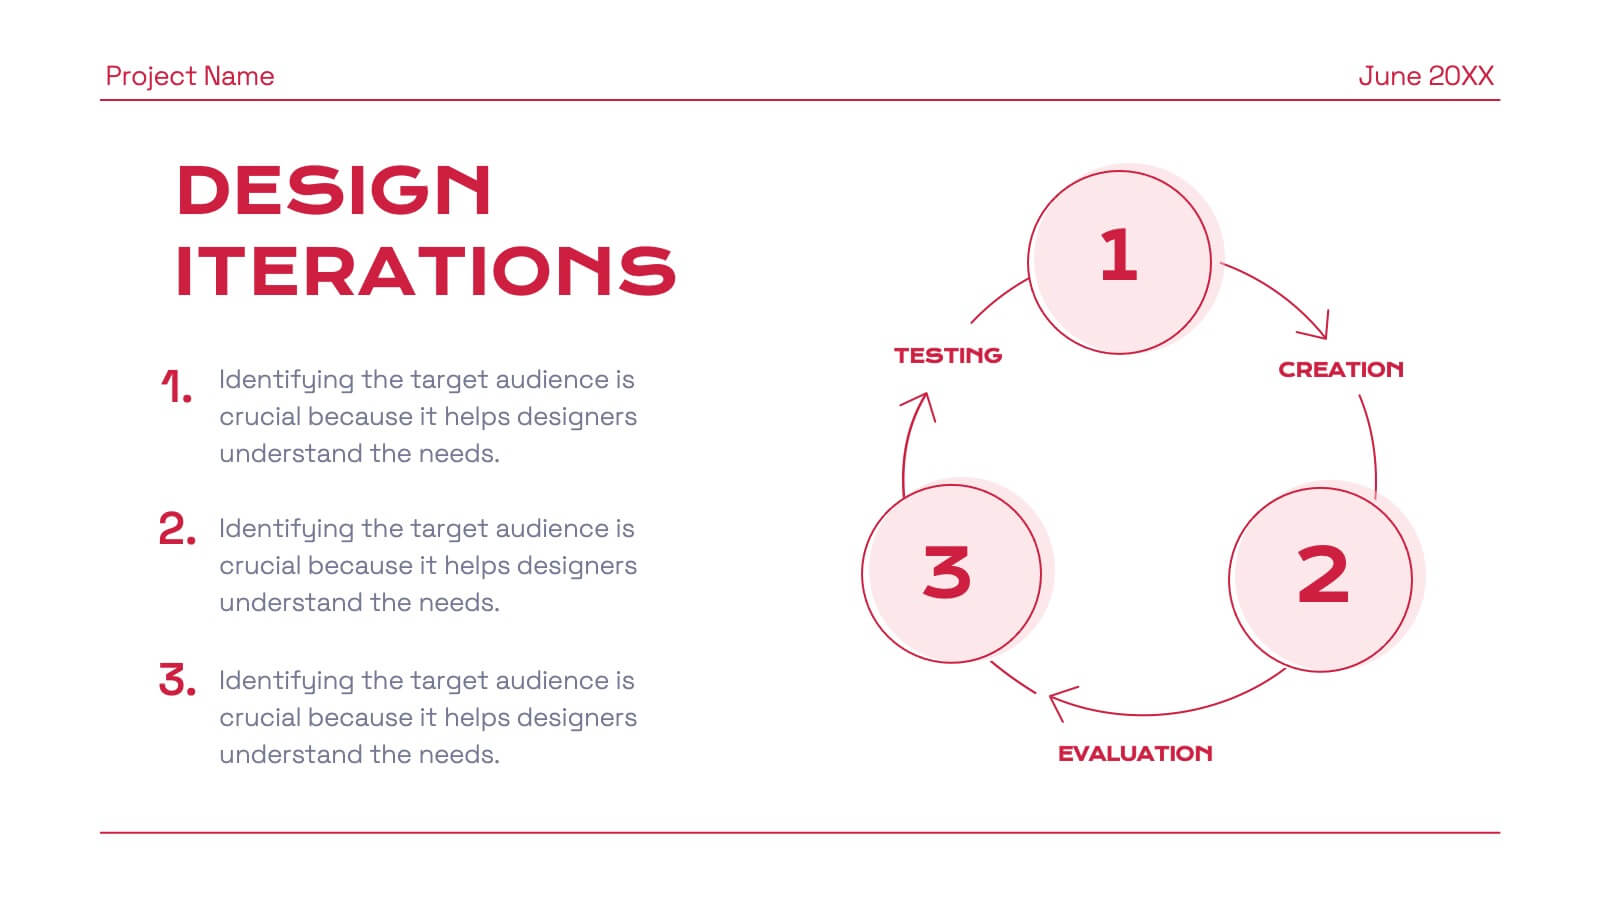
Visualize layered processes with this 3-step circular logic diagram. Perfect for illustrating progressive systems, tiered strategies, or interrelated components. Each ring represents a distinct phase, complete with editable icons and text. Compatible with PowerPoint, Keynote, and Google Slides—ideal for business models, strategic frameworks, or simplified logic breakdowns.


7 slides
Aviation School Infographic Presentation
If you're in search of striking visuals for your upcoming aviation school presentation, we've got just the solution for you. Our expertly crafted infographic template is designed to captivate and engage your audience, ensuring that your message is conveyed with maximum impact. Our template covers a diverse range of aviation topics, including airport and runway security. This guarantees that your information is presented in a clear, concise, and visually compelling manner. With our aviation infographic template, you'll be able to deliver an outstanding presentation that resonates with your audience and leaves a lasting impression.


6 slides
Corporate Hierarchy Structure
Visualize your organization’s leadership and team structure with this clean, modern hierarchy chart. Ideal for corporate overviews, HR planning, or team introductions in company profiles and proposals. Fully editable in PowerPoint, Keynote, and Google Slides.


21 slides
Eldritch Product Roadmap Presentation
The Product Roadmap Presentation Template features 21 modern slides, including product overviews, features, pain points, technical specs, and marketing strategies. Its sleek gray-yellow design ensures professionalism. Perfect for startups or businesses, it’s fully customizable and compatible with PowerPoint, Keynote, and Google Slides, ideal for impactful product-focused presentations.

22 slides
Eclipse Graphic Design Project Plan Presentation
Develop a winning marketing strategy with this dynamic template. Dive into current trends, consumer behavior, and innovative techniques. Perfect for social media, influencer marketing, and data-driven campaigns. Fully compatible with PowerPoint, Keynote, and Google Slides.


5 slides
Company Hierarchical Structure
Easily map out your company's reporting lines and team organization with this clean, photo-friendly hierarchy slide. Perfect for presenting departments, roles, or leadership structures. Fully editable in PowerPoint, Keynote, and Google Slides for effortless customization.


7 slides
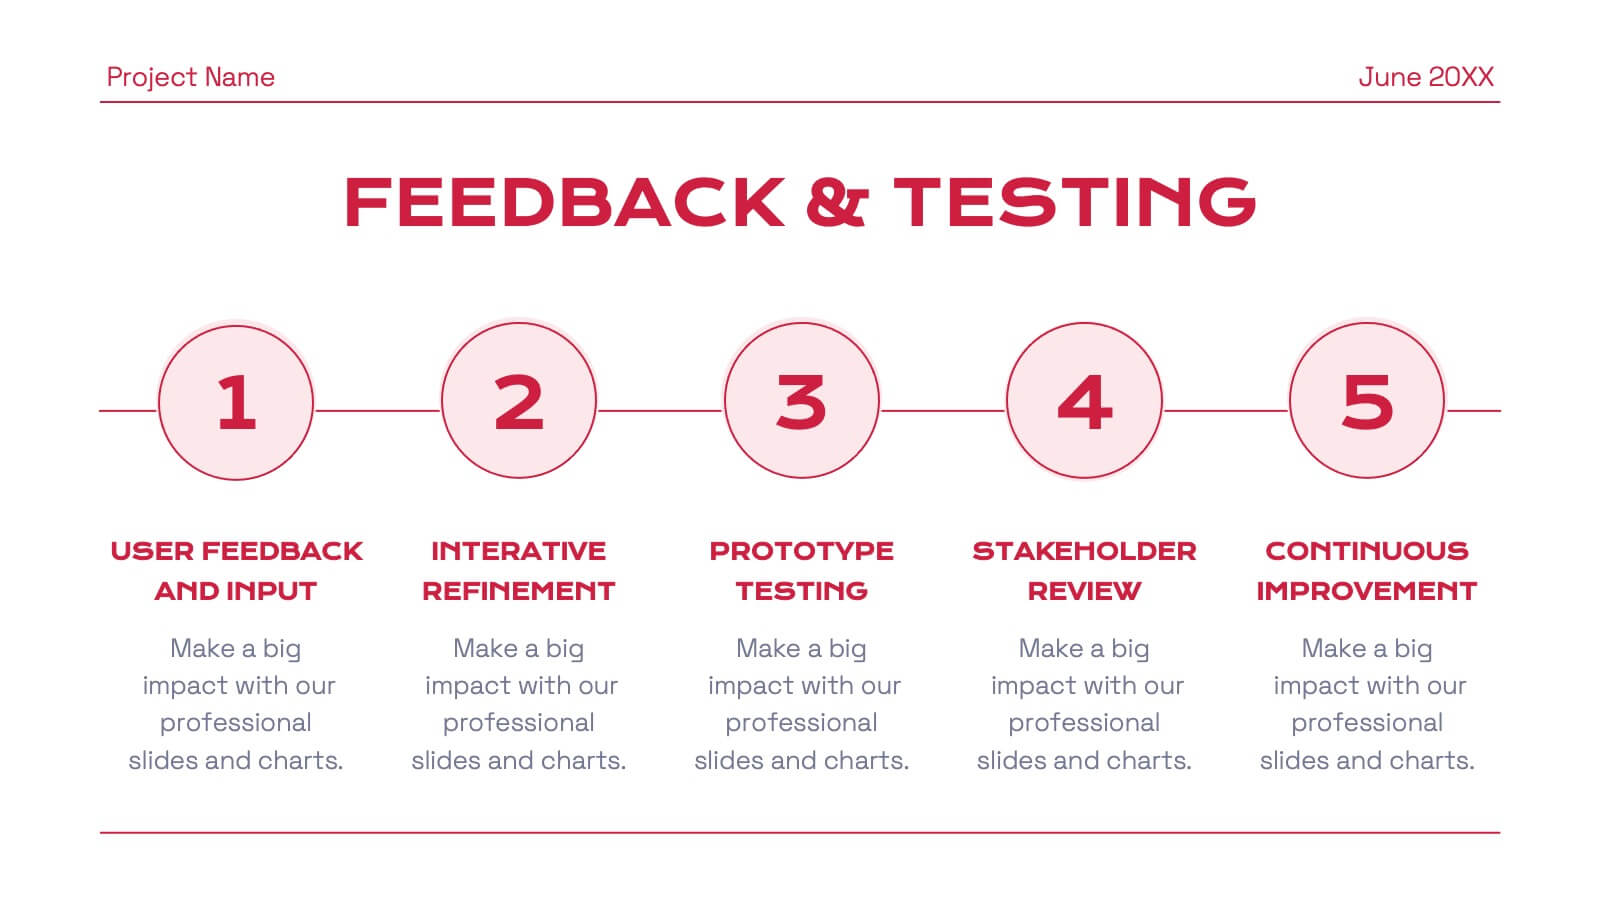
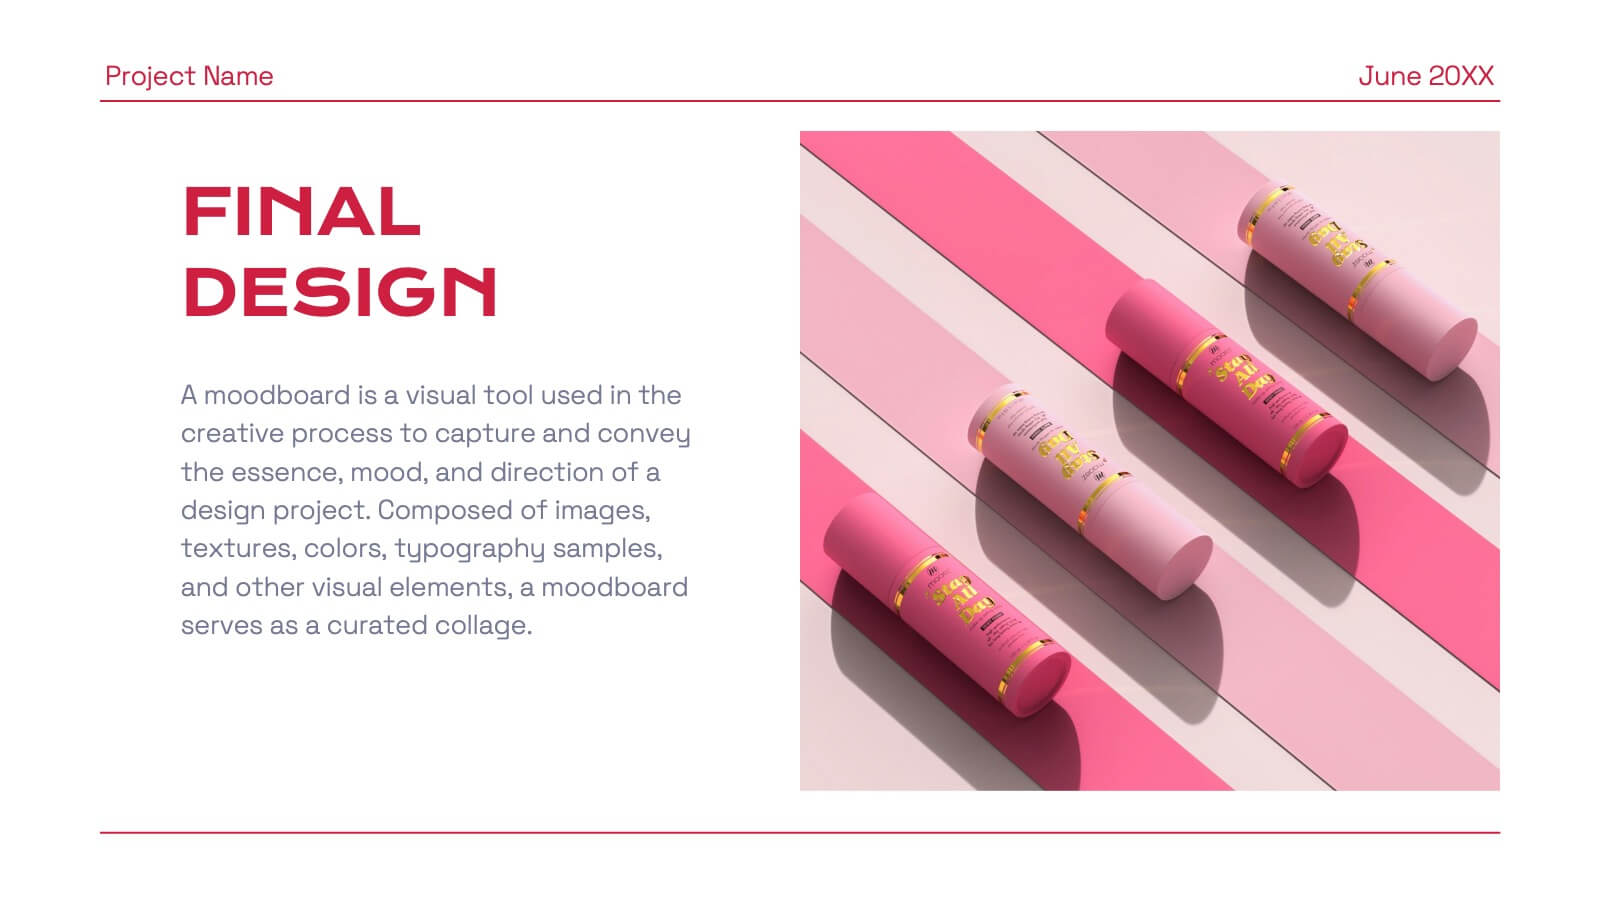
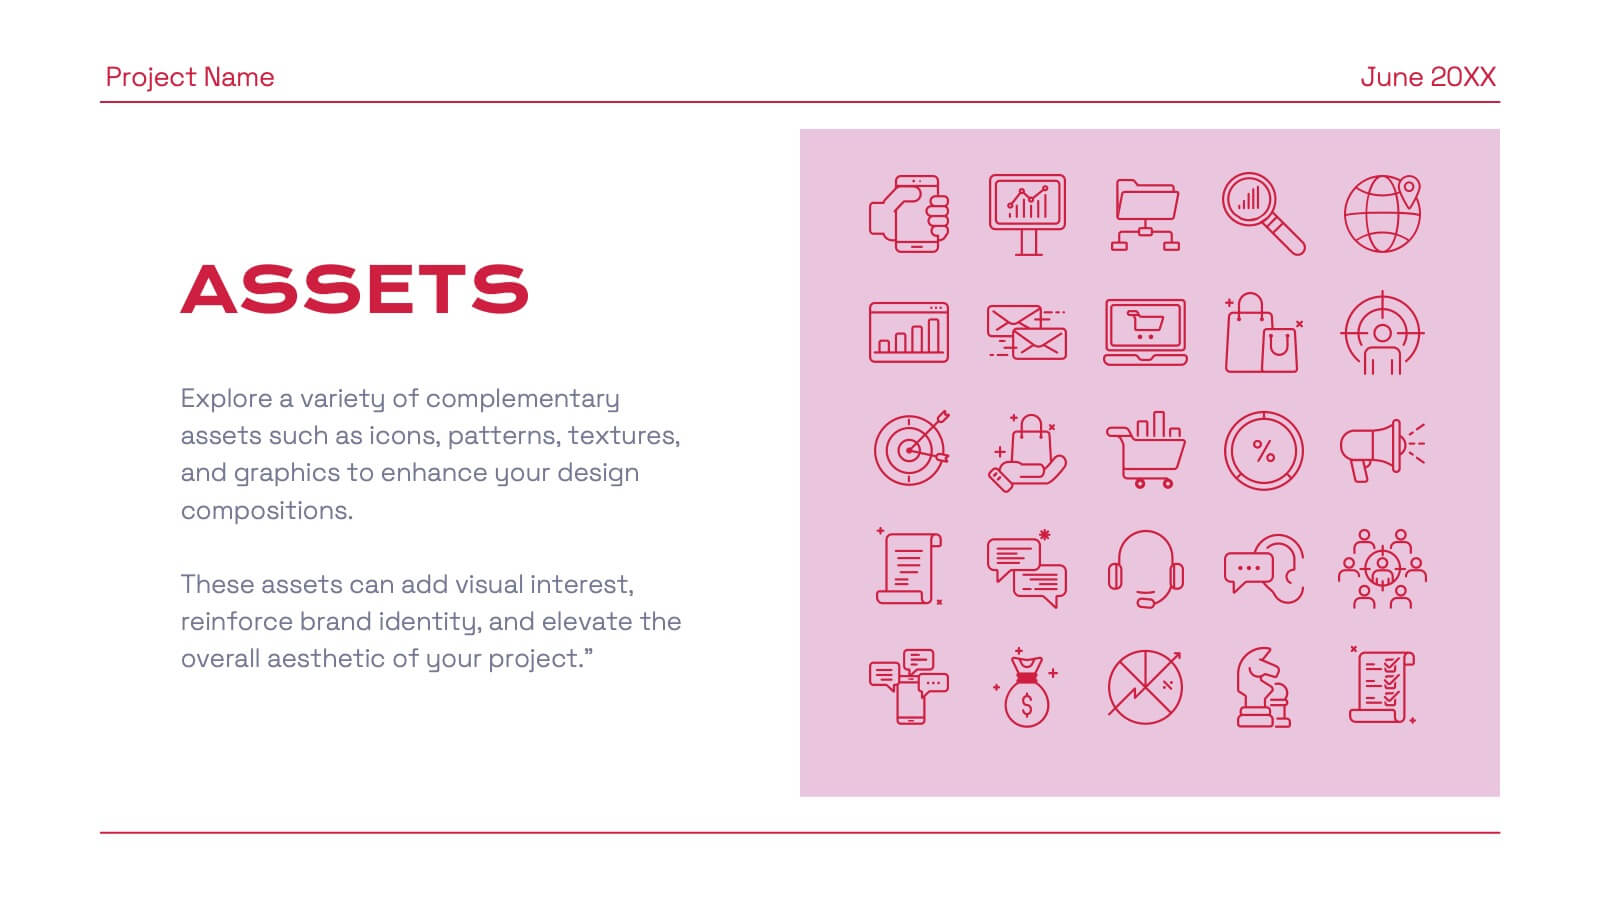
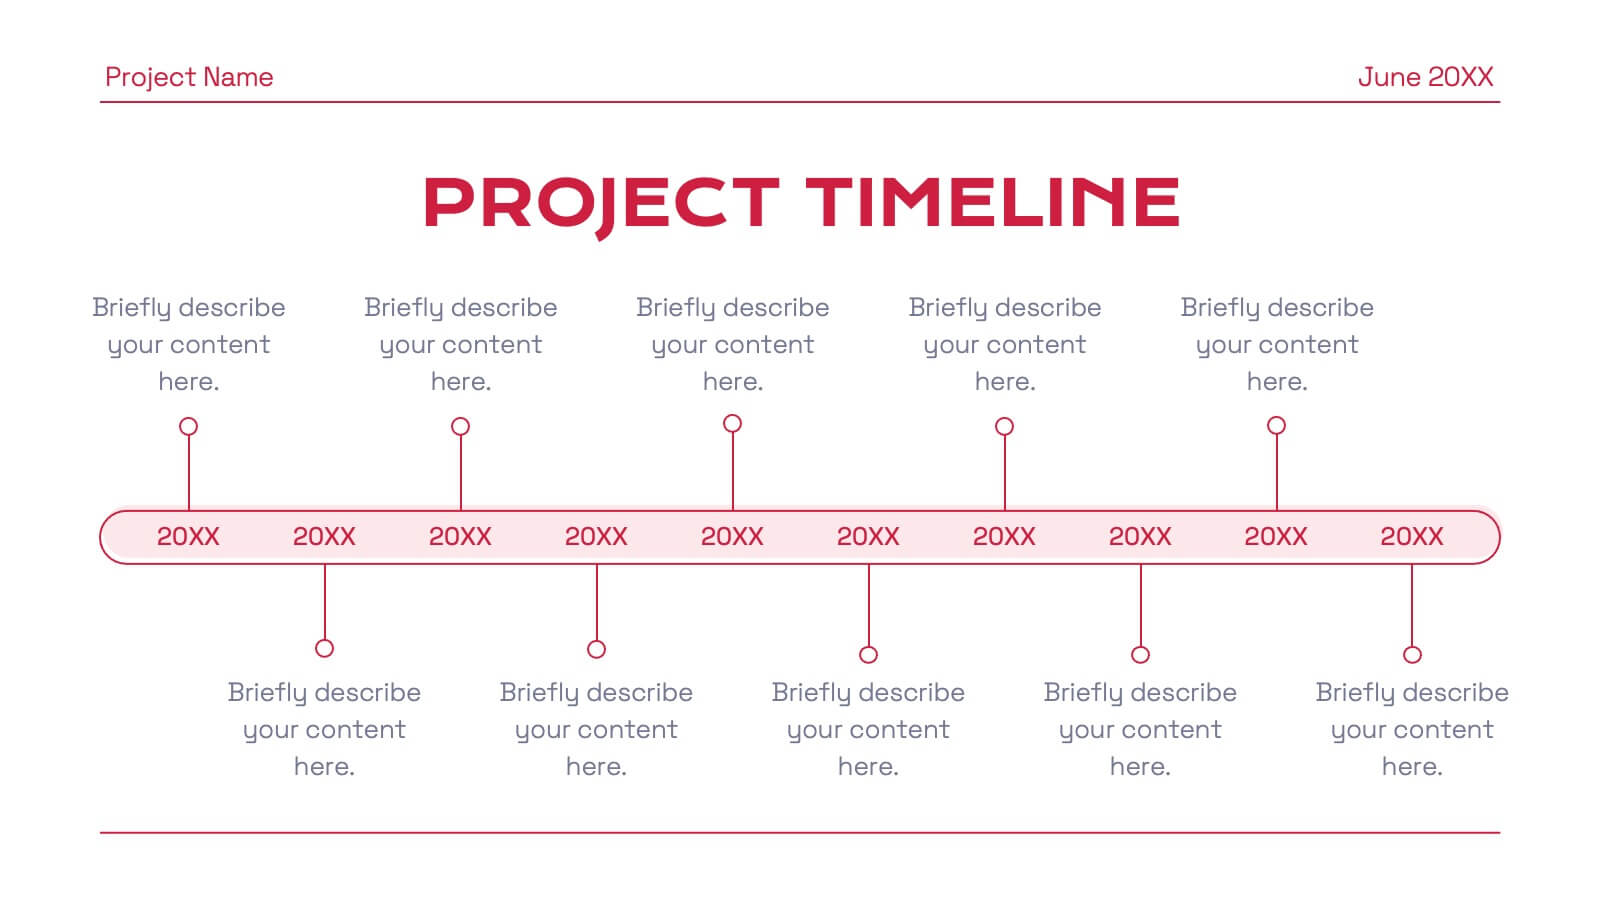
Project Timeline Presentation
Visualize key milestones with this project timeline presentation template. Designed to highlight each phase with clarity, it's perfect for project managers, planners, and teams tracking progress. The horizontal layout, color-coded steps, and year indicators make it easy to customize in PowerPoint, Keynote, or Google Slides for any industry.


8 slides
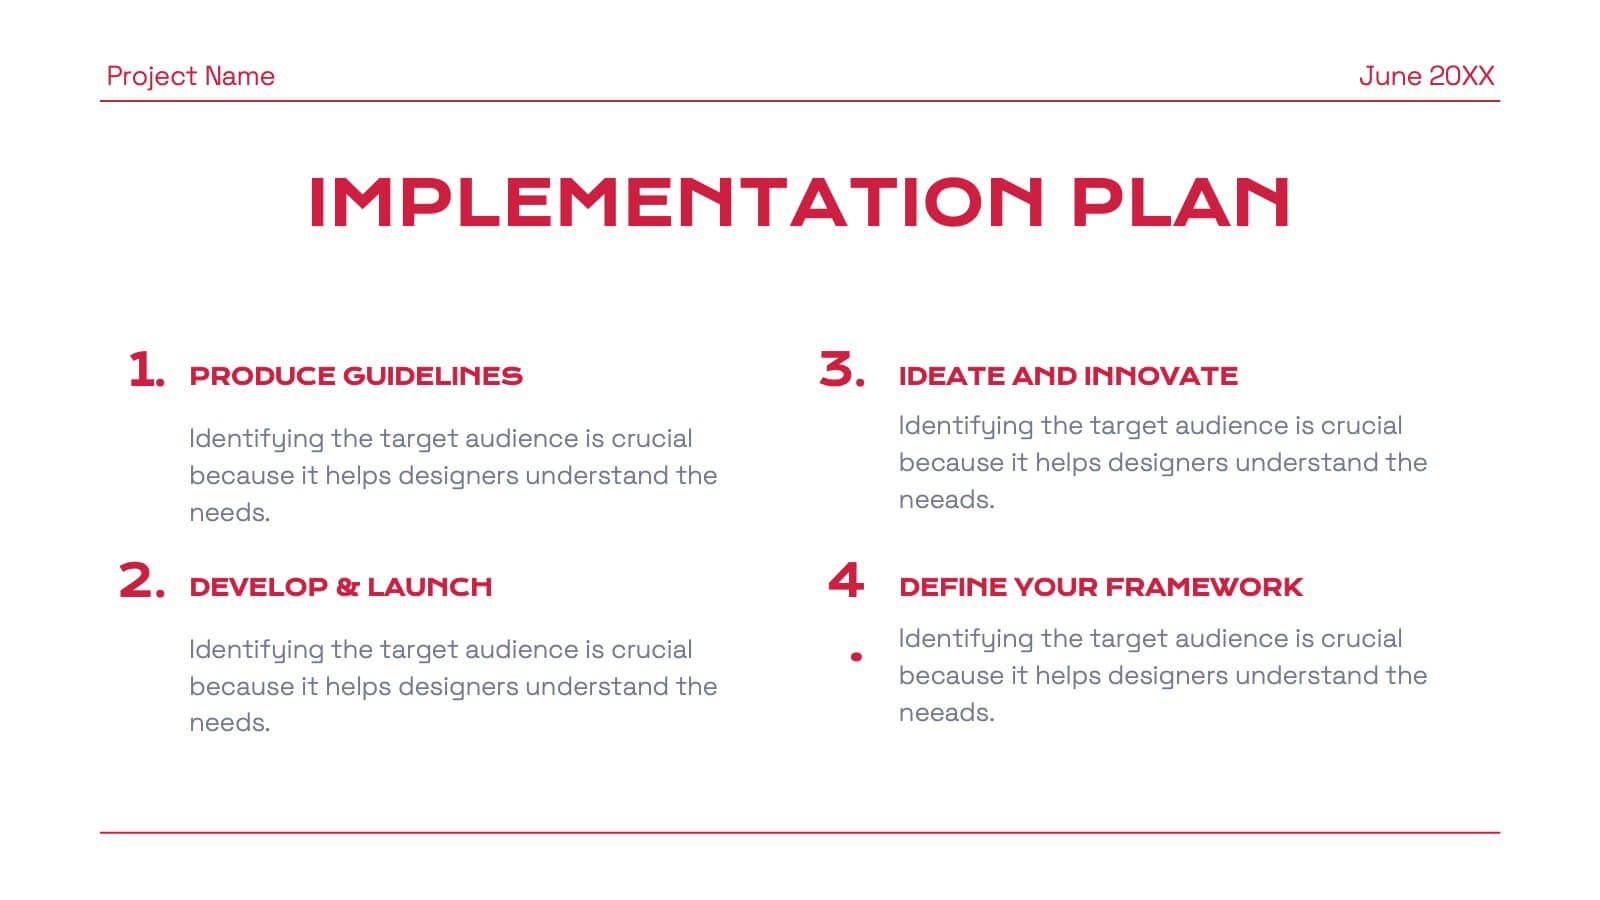
Business Framework Strategy
Simplify your strategy breakdown with this layered, step-by-step infographic. Ideal for presenting three core pillars or stages of a business model, this layout highlights each section with a bold letter identifier (A, B, C), vivid icons, and space for supporting content. Fully editable in PowerPoint, Keynote, and Google Slides.


5 slides
Investor-Ready Business Pitch Plan Presentation
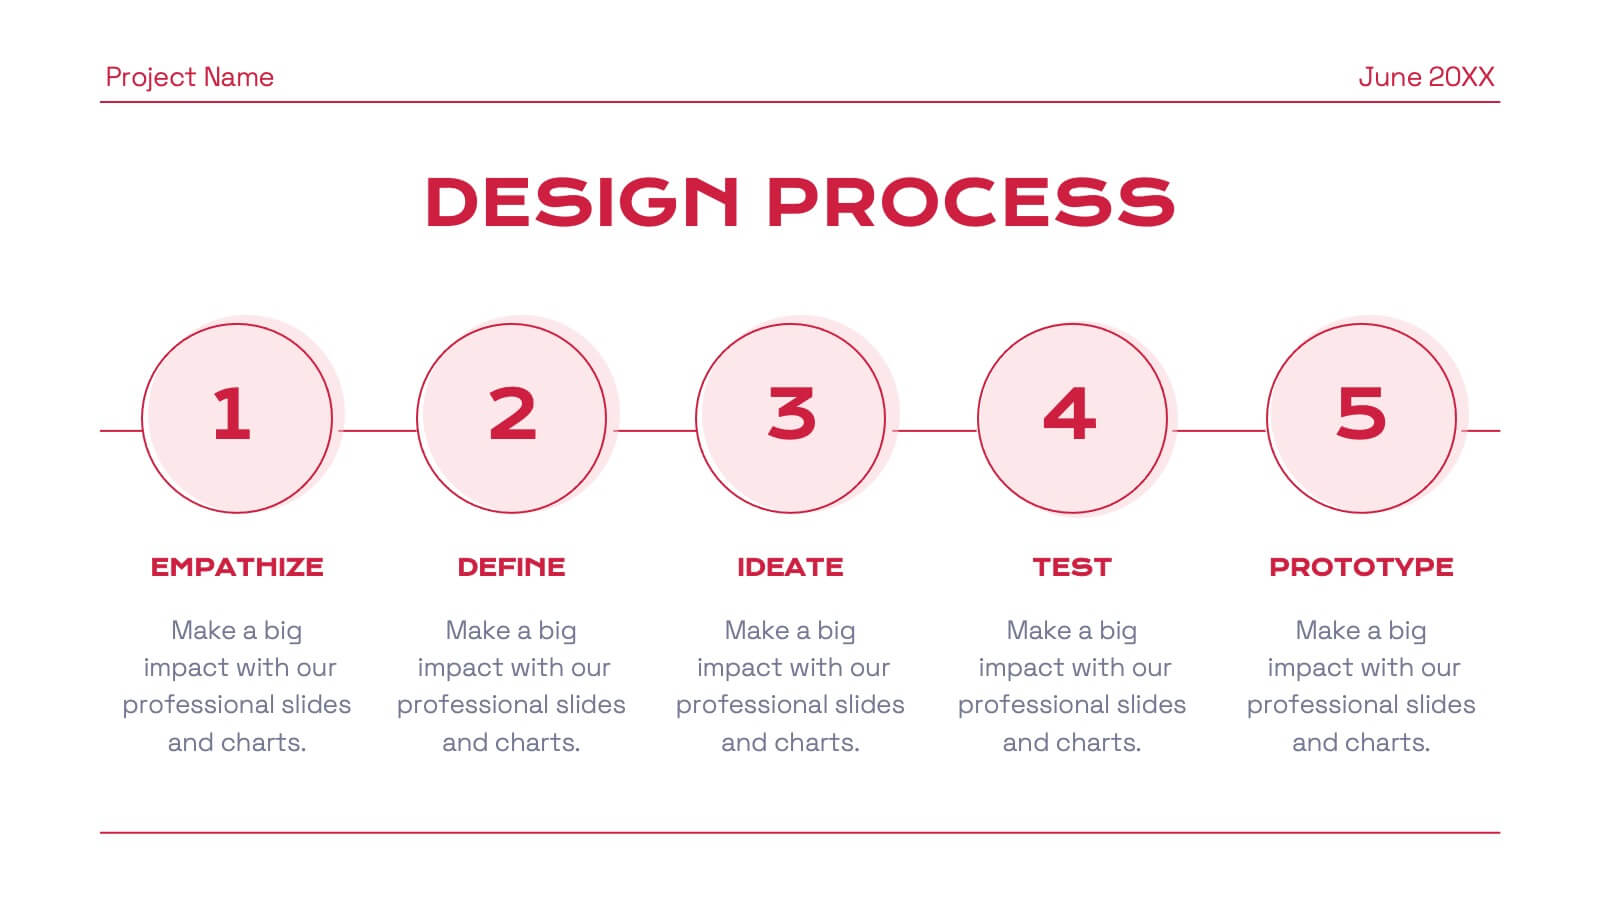
Make your business roadmap stand out with this dynamic visual journey, perfect for impressing investors from the first slide. This infographic-style pitch deck helps clearly outline your business strategy across five milestones, using vibrant colors and icons for easy comprehension. Fully compatible with PowerPoint, Keynote, and Google Slides.


5 slides
Big Data Interpretation and Metrics Presentation
Break down complex data into digestible segments with the Big Data Interpretation and Metrics Presentation. Featuring a puzzle-inspired layout, this template is ideal for illustrating interconnected data points, analytics strategies, or metric-based frameworks. Fully customizable in PowerPoint, Keynote, and Google Slides.


4 slides
Sales Funnel Data Presentation
Turn your data into a clear story with a visual flow that shows exactly how leads move from one stage to the next. This presentation helps explain conversion steps, highlight drop-off points, and simplify complex marketing insights. It’s easy to customize and fully compatible with PowerPoint, Keynote, and Google Slides.


24 slides
Veritas UX Research Report Presentation
This UX research report template is designed for clarity and modern style, using a sleek color palette and structured layouts to showcase insights. It includes sections for project overview, user research, personas, wireframes, prototyping, and user testing results. Compatible with PowerPoint, Keynote, and Google Slides, it’s ideal for presenting findings effectively.


5 slides
Strategic Matrix Grid Analysis Presentation
Clarify your strategic insights with the Strategic Matrix Grid Analysis Presentation. This layout uses a 2x2 quadrant design to showcase four key categories or scenarios—ideal for SWOT, risk vs. reward, product positioning, or capability mapping. Clean labels, icons, and text areas help break down each quadrant’s significance. Fully editable in PowerPoint, Google Slides, Keynote, and Canva.


5 slides
Smart Decision Making Models Presentation
Make complex choices simple with this modern and colorful template designed to visualize analytical thinking and structured planning. Ideal for presenting frameworks, strategies, or goal-setting models, it helps communicate logic and clarity effectively. Fully compatible with PowerPoint, Keynote, and Google Slides for smooth customization and presentation delivery.


7 slides
Innovation Technology Infographics
Innovation technology refers to the application of technology or the use of innovative approaches to create new products, services, processes, or business models. This infographic template is designed to showcase the cutting-edge technologies shaping our future. Let the vibrant visuals and insightful content guide you through the exciting realm of innovation and technology. Compatible with Powerpoint, Keynote, and Google Slides. Fully customizable, explore this infographic and step into the future. The visuals are designed to ignite your imagination and enlighten your audience about the limitless potential of innovation and technology.