


Features
- 7 Unique slides
- Fully editable and easy to edit in Microsoft Powerpoint, Keynote and Google Slides
- 16:9 widescreen layout
- Clean and professional designs
- Export to JPG, PDF or send by email


Do you have any questions?
Recommend


6 slides
Iceberg Business Infographic
Delve beneath the surface with our Iceberg Business Infographic, perfect for Powerpoint, Google Slides, and Keynote. This infographic is designed to illustrate the underlying factors that impact an organization's success. The iceberg metaphor visually represents the concept that only a small part of a company's situation is visible above the surface, while much more is hidden below. The customizable segments can be used to detail various aspects of business operations, risks, and opportunities that are not immediately apparent. By employing this Iceberg Business infographic, you can effectively communicate the complexities of business strategies.


19 slides
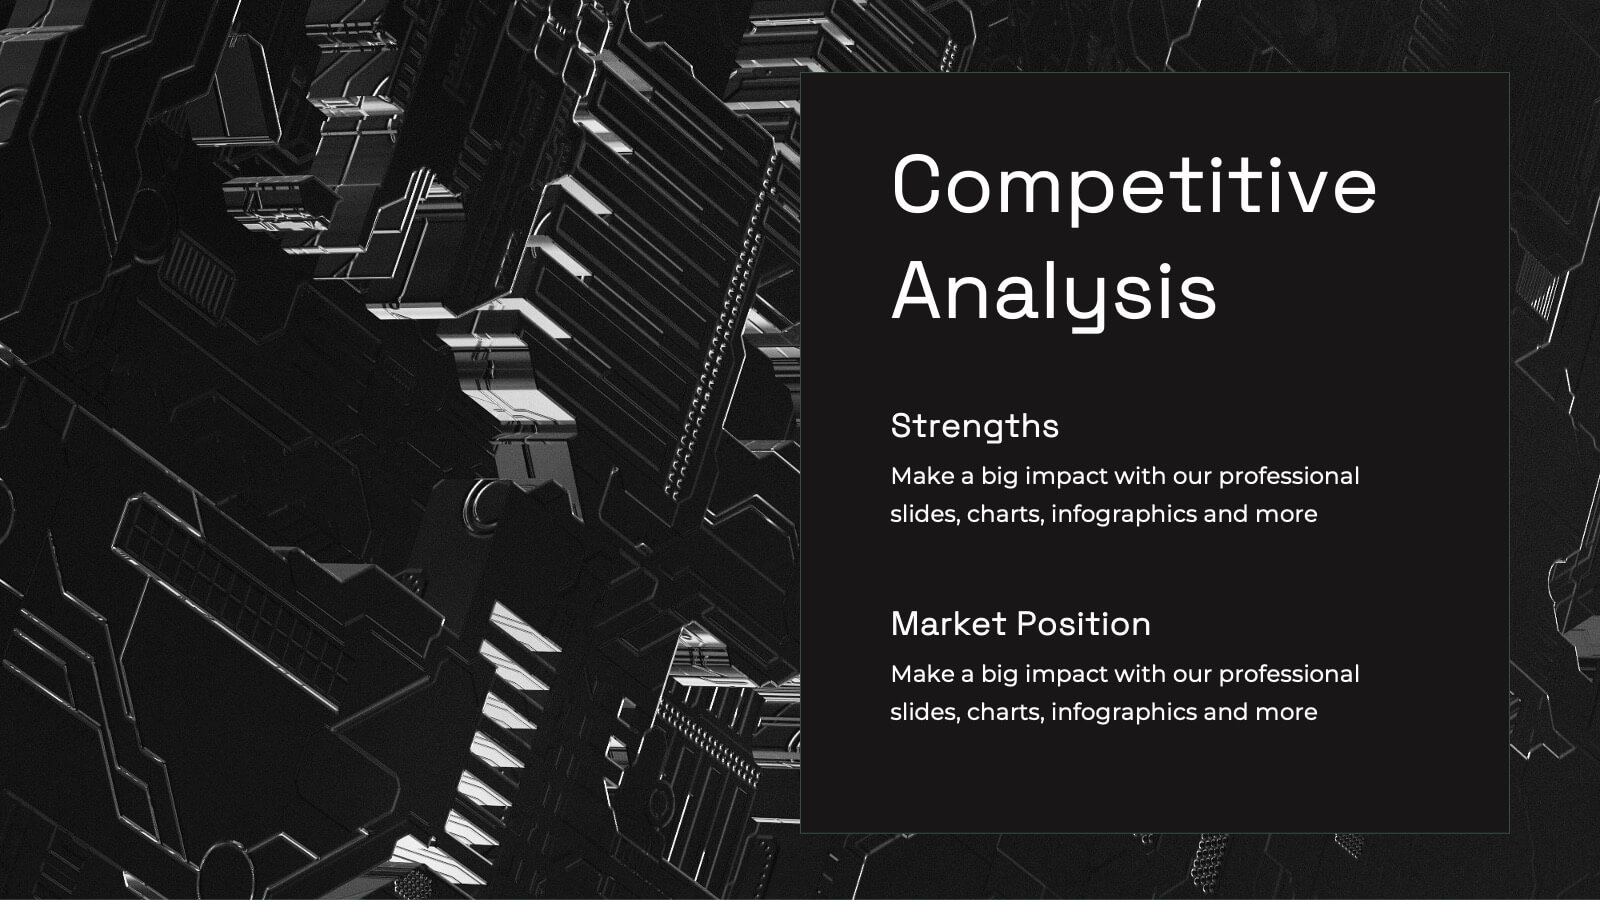
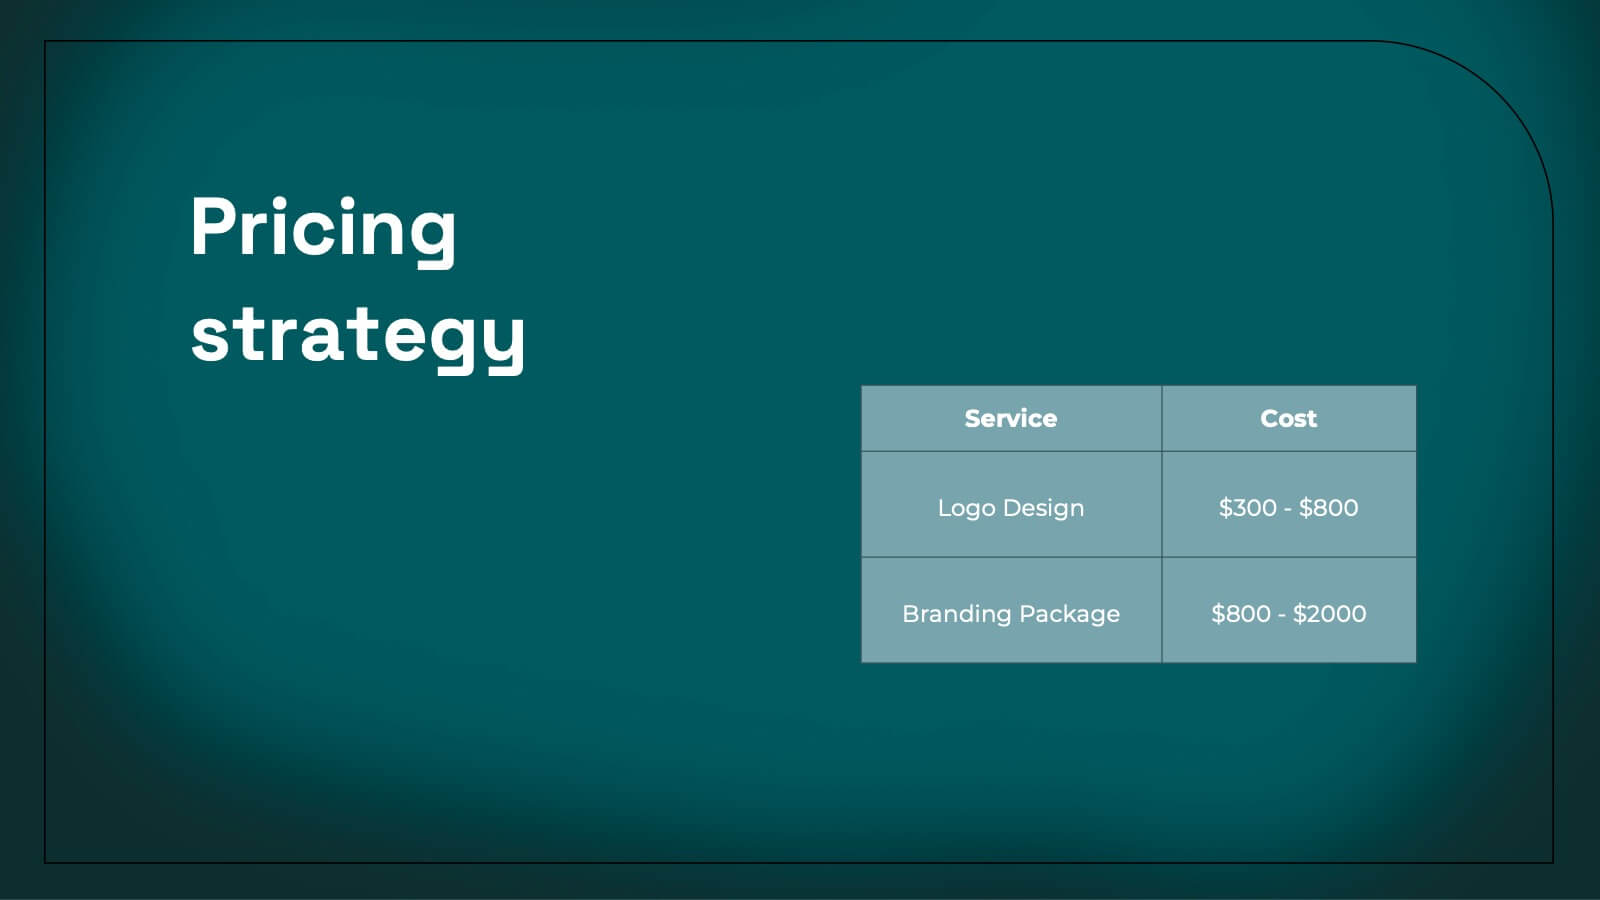
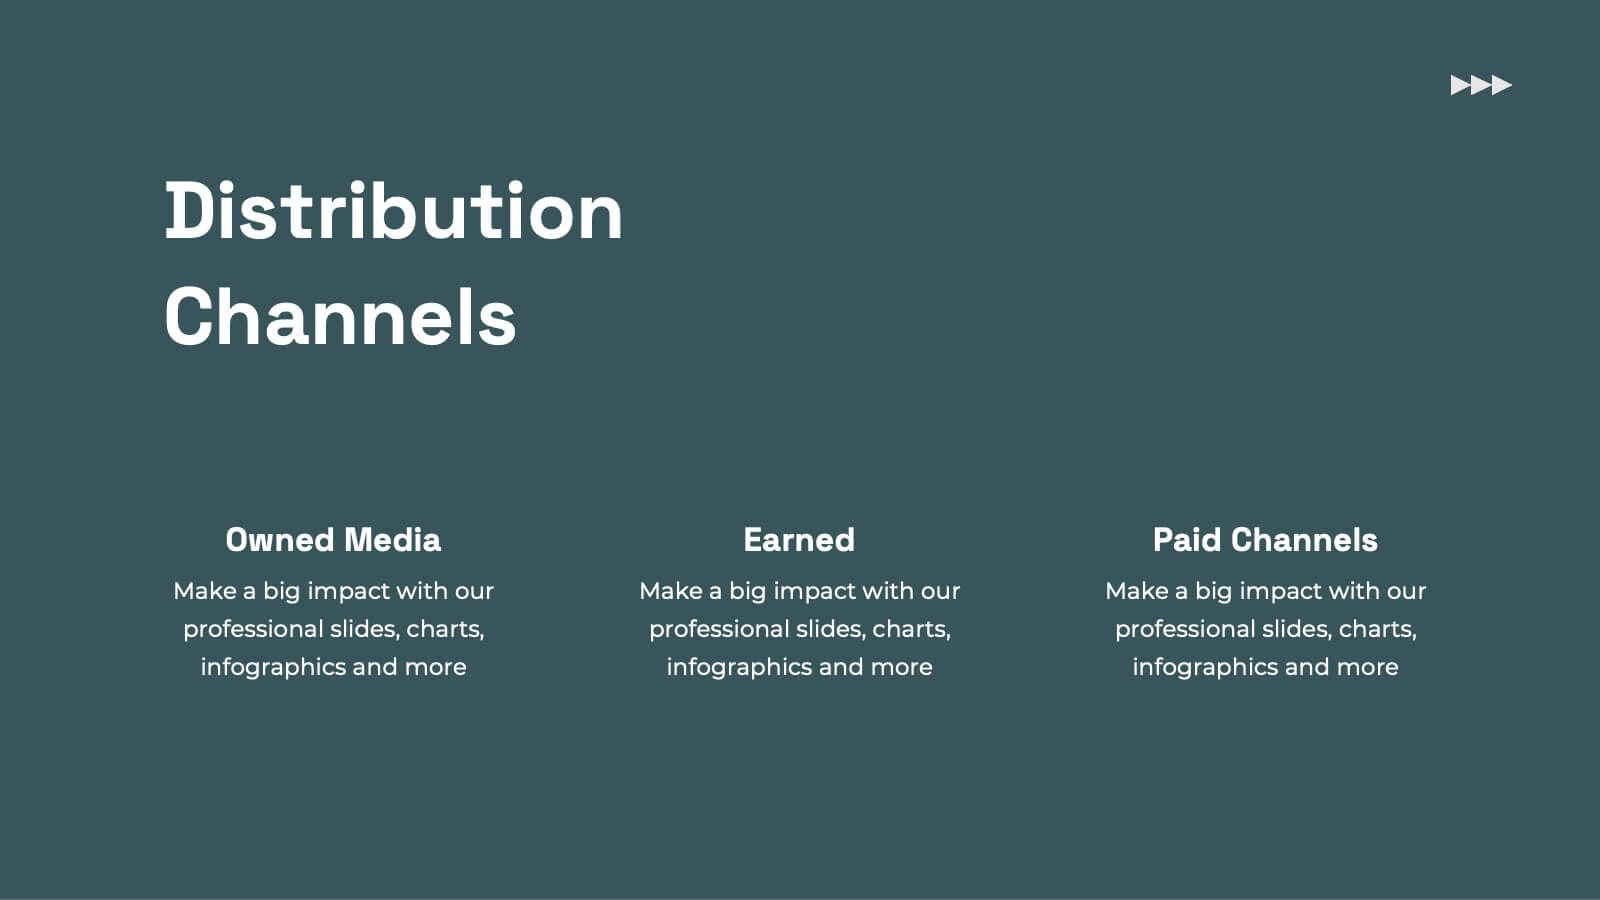
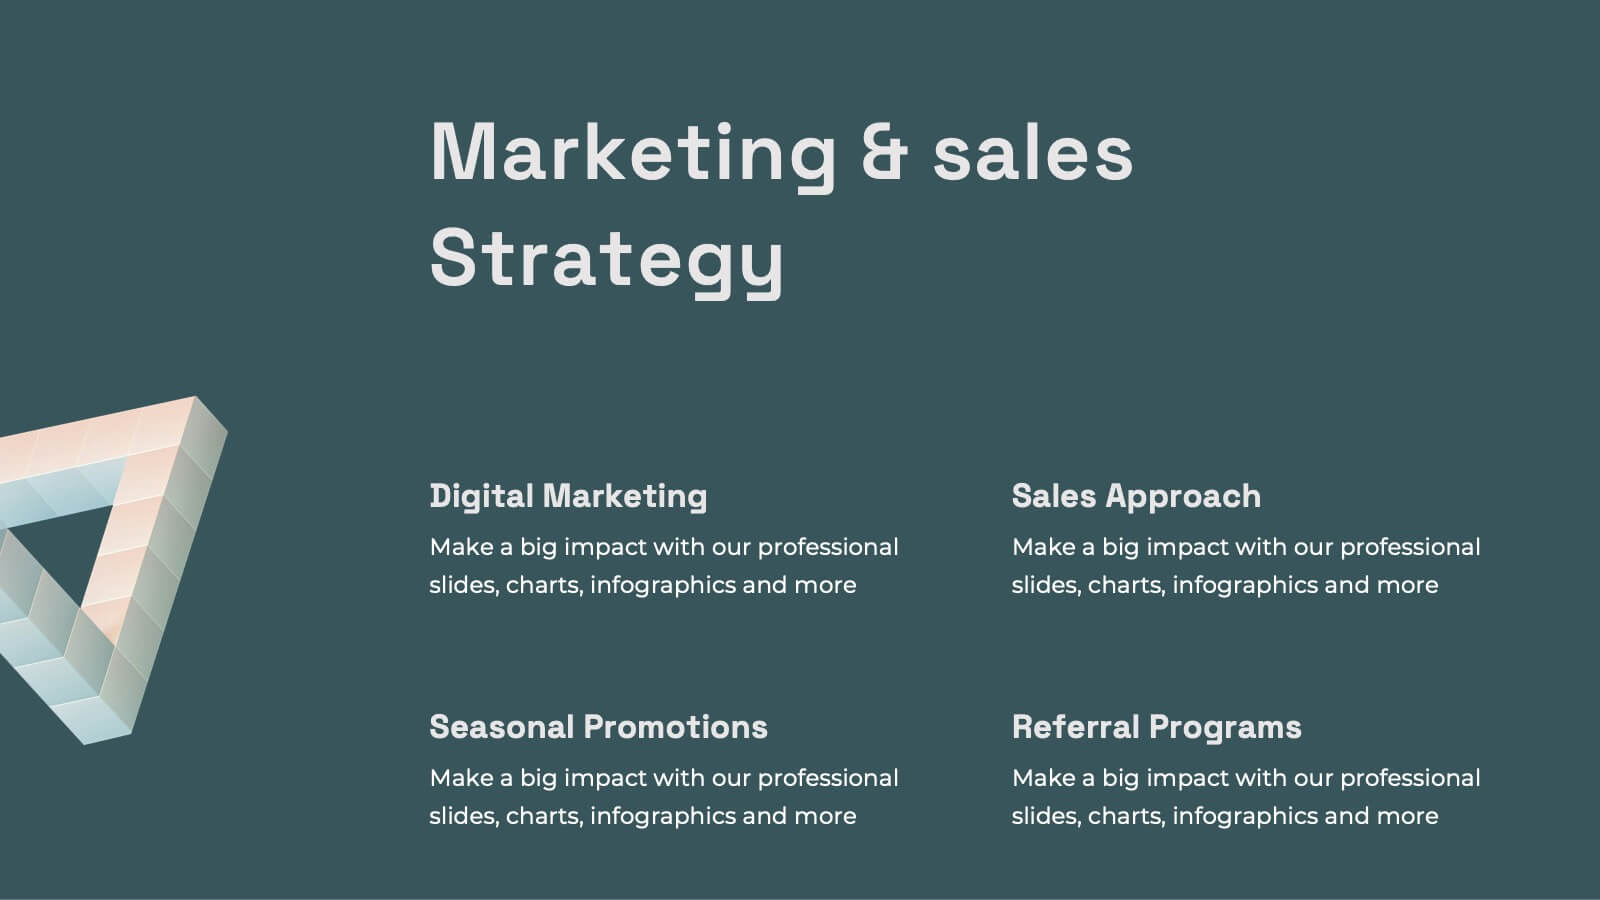
Kale Product Strategy Report Presentation
Unleash the power of your product with this bold and dynamic product strategy report template! Elevate your presentation with eye-catching designs that showcase product features, competitive analysis, and pricing strategies like never before. Captivate your audience from start to finish and leave a lasting impression. Fully compatible with PowerPoint, Keynote, and Google Slides!


7 slides
Success Business People Infographic Presentation
A Business People Infographic is a visual representation of data and information related to various aspects of business and the people involved in it. This infographic is a great way to illustrate your topic, point by point. This is an ideal template for making professional business presentations. This template is fully editable, perfect for business presentations and meetings. It includes all of the graphics you need to shows your audience interesting statistics and data. Compatible with Powerpoint, Keynote and Google Slides, your audience will be impressed by the dynamic slides!


7 slides
PESTEL Analysis Infographic Presentation Template
A PESTEL Analysis Infographic is a great tool to highlight the risks and opportunities of a market. Based on the needs of your customers, this Infographic can help you communicate key information about competition, regulatory environment and economic outlook. This template can also be used for stocks of any company from any industry. This is a comprehensive pestel analysis infographic that will show you the factors that are driving and restraining the growth of your industry. This template can help companies to identify their weaknesses and drive their strengths with the pestel analysis.


5 slides
Product Life Cycle Diagram Presentation
Bring your business insights to life with this dynamic visual layout designed to simplify complex growth stages. Ideal for showcasing product performance, innovation timelines, or strategic planning, it transforms data into a clear, engaging narrative. Fully editable and compatible with PowerPoint, Keynote, and Google Slides for professional use.


7 slides
Weight Challenge Infographic Presentation
Challenges are essential for personal and professional growth, and they play an important role in our lives in several ways. This template is designed for any and all use. You can use it in business, academic presentations, or home. This template is designed to give you flexibility in your presentations and allow you to create dynamic content that stands out from the crowd. This is compatible with Powerpoint, Keynote, and Google Slides so you can easily edit your presentation. This template can be used for a variety of projects, including team building, goal setting and brainstorming!


5 slides
Business Influence Stakeholder Analysis Presentation
Enhance your project's success with our Business Influence Stakeholder Analysis Presentation template, designed to identify and prioritize stakeholders based on their influence and impact. This template is ideal for strategic planning and ensuring all key stakeholders are considered. Compatible with PowerPoint, Keynote, and Google Slides."


7 slides
Product Life Cycle Infographic Presentation Template
The product life cycle is a theoretical model that describes the stages a product goes through during its lifetime, from its introduction to the market until its eventual decline and removal from the market. Use this presentation template as a visual aid to help explain the characteristics and impact of each stage, including introduction, growth, maturity and decline. Our product life cycle template can be use to teach students the concepts of product design, sales and marketing as well. This is a simple and informative way to explain the four basic stages of product development in a simple way.


5 slides
Big Data Infrastructure Planning Presentation
Build your big data strategy step-by-step with this clean and visual planning template. Designed to map out the key gears of infrastructure—from hardware to storage and cloud integration—it’s a powerful tool for IT leaders and tech teams. Fully editable and works with PowerPoint, Keynote, and Google Slides.


10 slides
Customer Conversion Funnel Presentation
Optimize your customer journey presentations with our "Customer Conversion Funnel Presentation" template. This infographic elegantly depicts the conversion process across distinct stages, using a funnel design that visually narrows from awareness to action. Each segment is clearly labeled, simplifying the task of presenting strategies to enhance each phase of the customer experience. Ideal for marketers, sales teams, and strategists, this template helps clarify customer behavior and improve conversion rates. It’s a vital tool for any business focused on customer engagement and optimization. Fully compatible with PowerPoint, Keynote, and Google Slides, this template is crucial for effective communication and strategic planning.


21 slides
Sonicwave Market Analysis Report Presentation
A vibrant, modern template designed for market analysis presentations. Covers agenda, key highlights, metrics, financial summaries, competitor insights, and strategic initiatives. Ideal for professionals presenting data-driven insights on trends and performance. Fully customizable in PowerPoint, Keynote, and Google Slides for business, marketing, and analytical reporting needs.


7 slides
Home Buyer Checklist Infographic
Step into your dream home with confidence using our Home Buyer Checklist Infographic Template. This visually engaging guide is meticulously designed to streamline the home-buying process, making it transparent and manageable for first-time buyers and seasoned investors alike. This template provides a comprehensive checklist that covers every important aspect of home buying, from budgeting and financing to inspecting and closing. Its intuitive layout and vibrant design elements make complex tasks approachable and easy to understand, ensuring you don’t miss a beat on your journey to homeownership. Tailor each slide to your specific needs by customizing colors, text, and graphics to reflect your personal style or brand identity. Ideal for real estate agents, mortgage advisors, and educational workshops, this template empowers users to navigate the maze of real estate transactions with ease and assurance.


21 slides
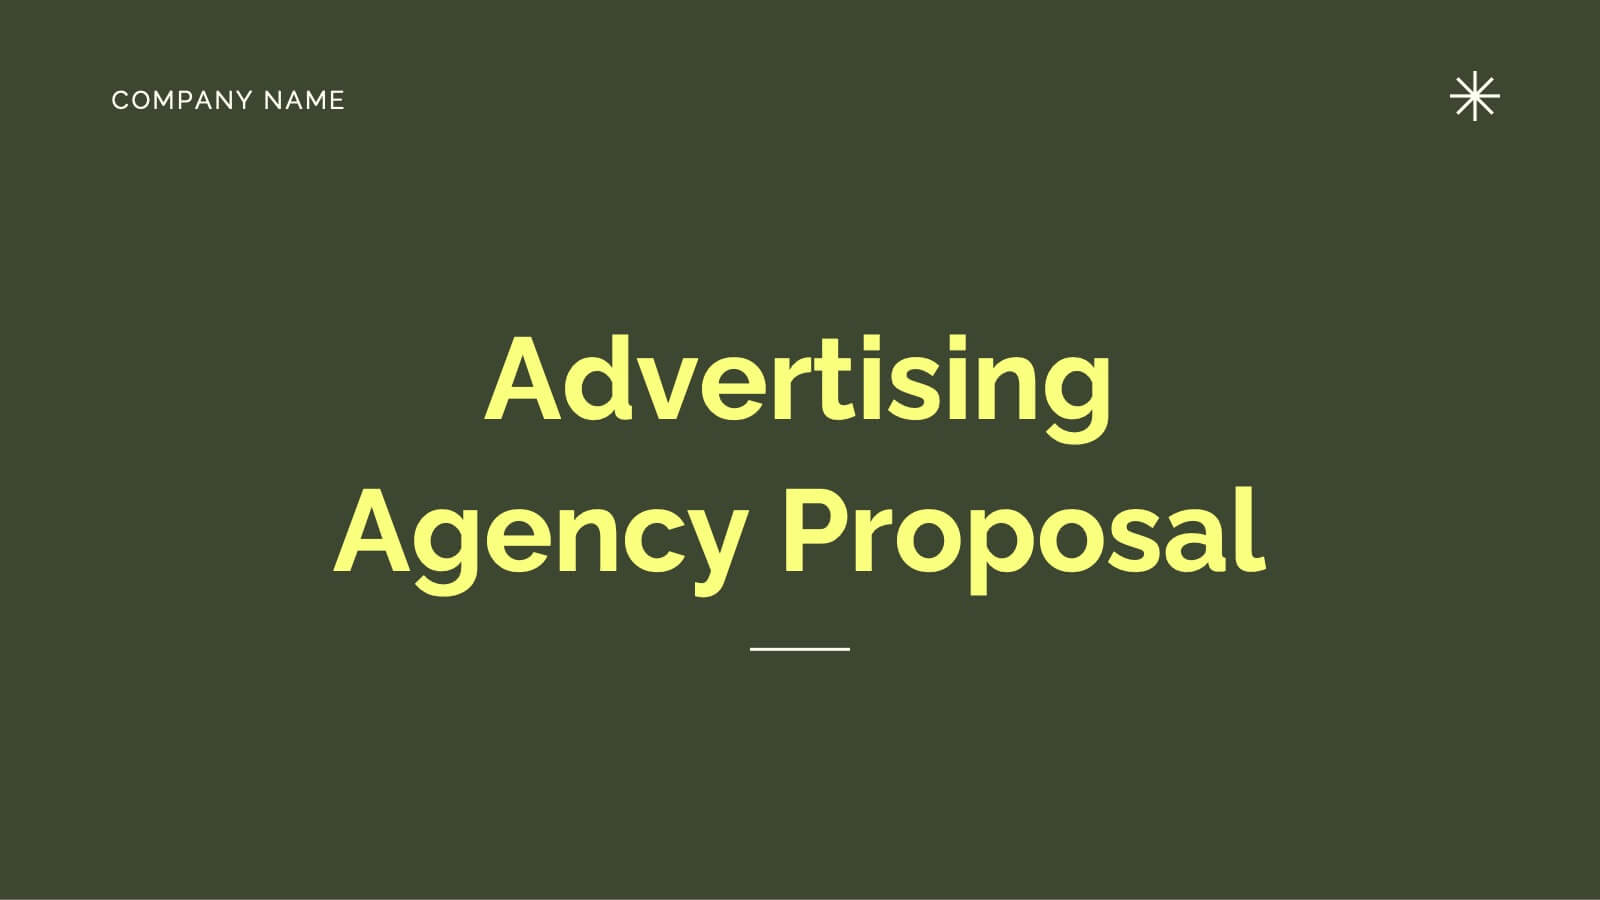
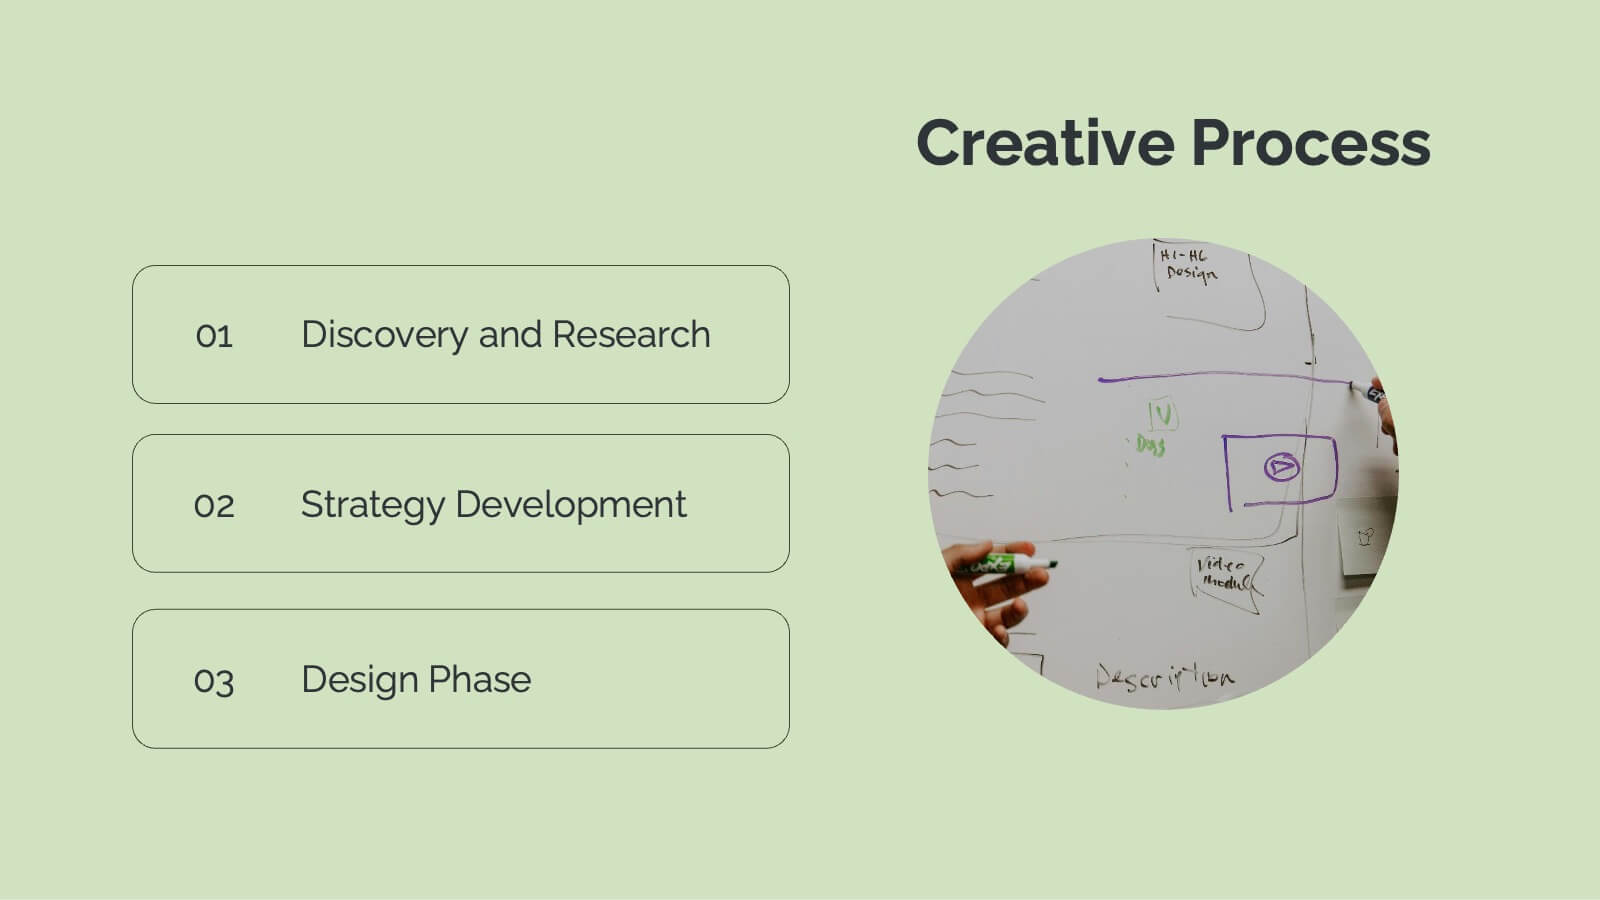
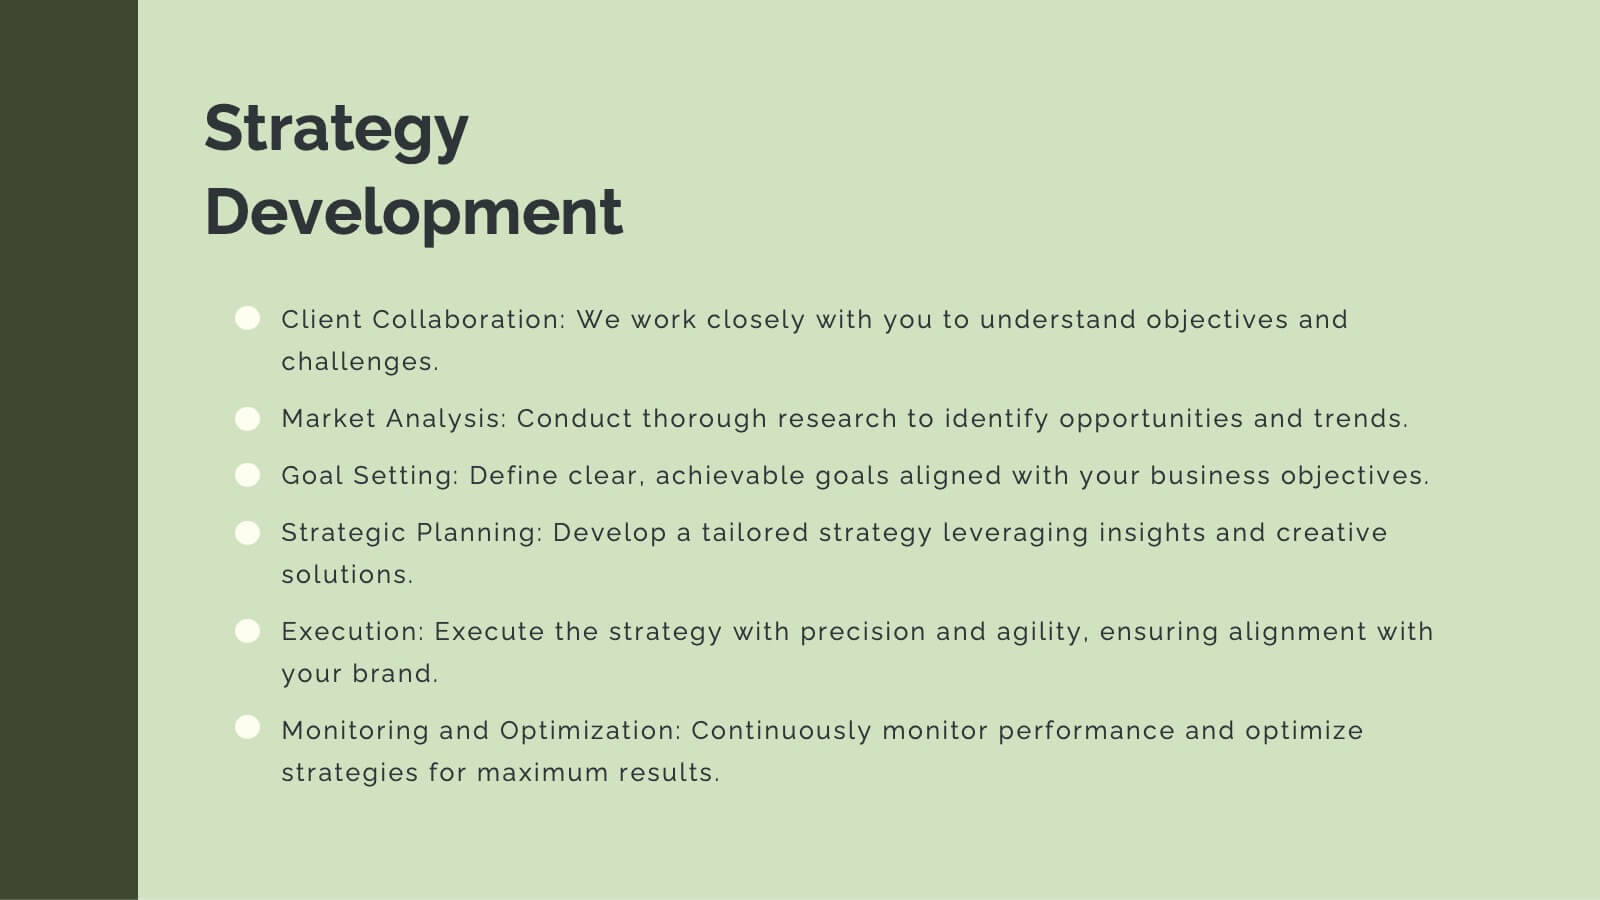
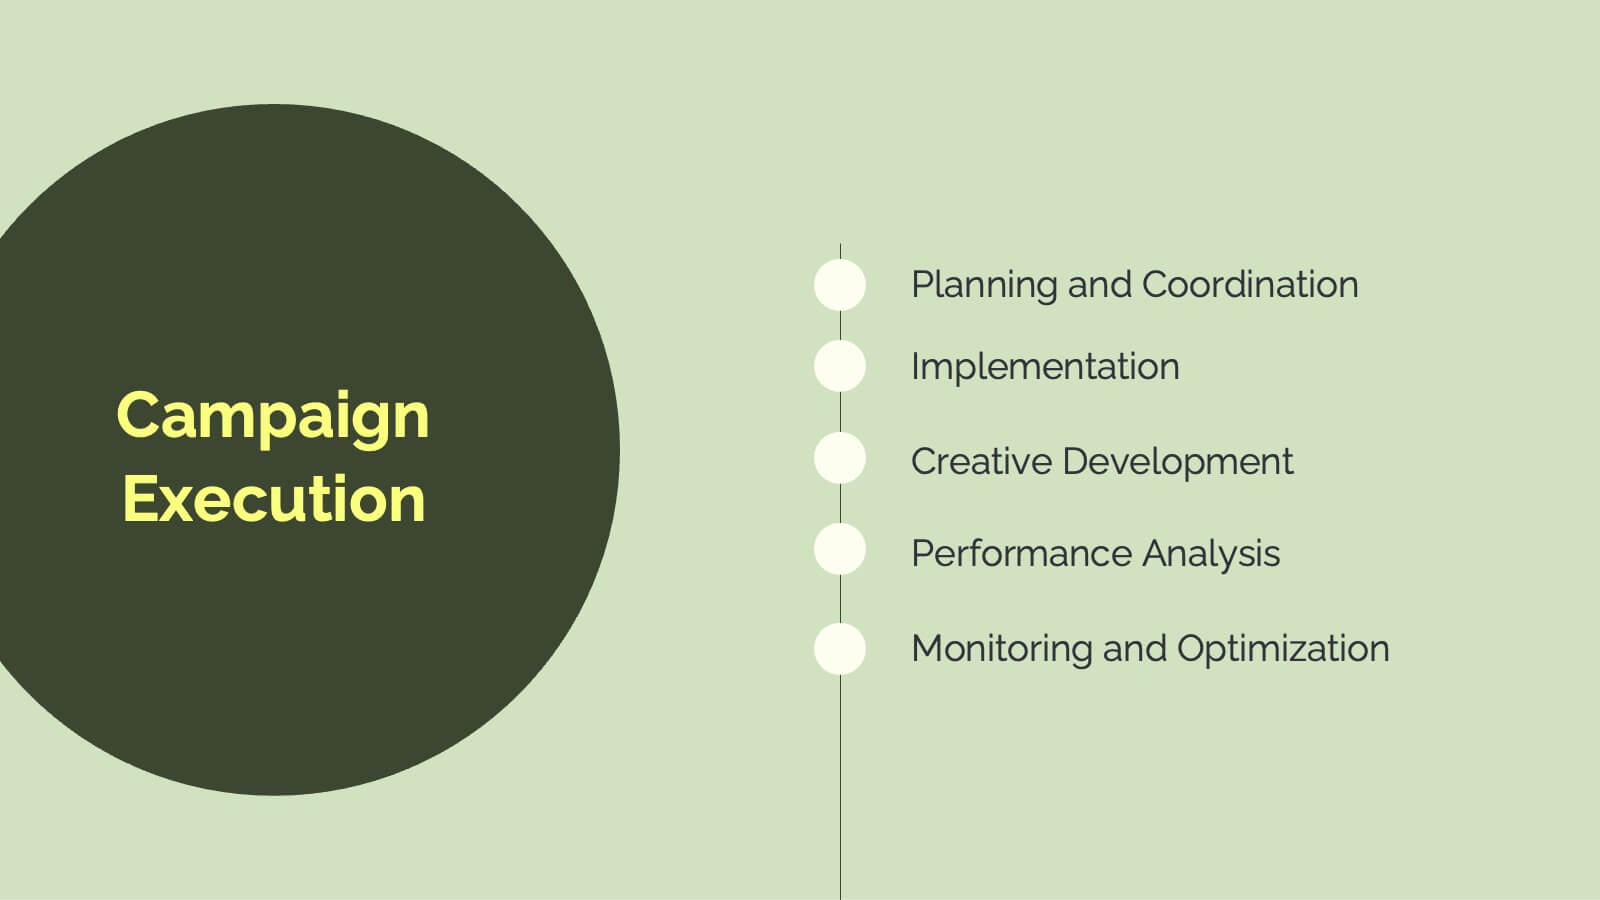
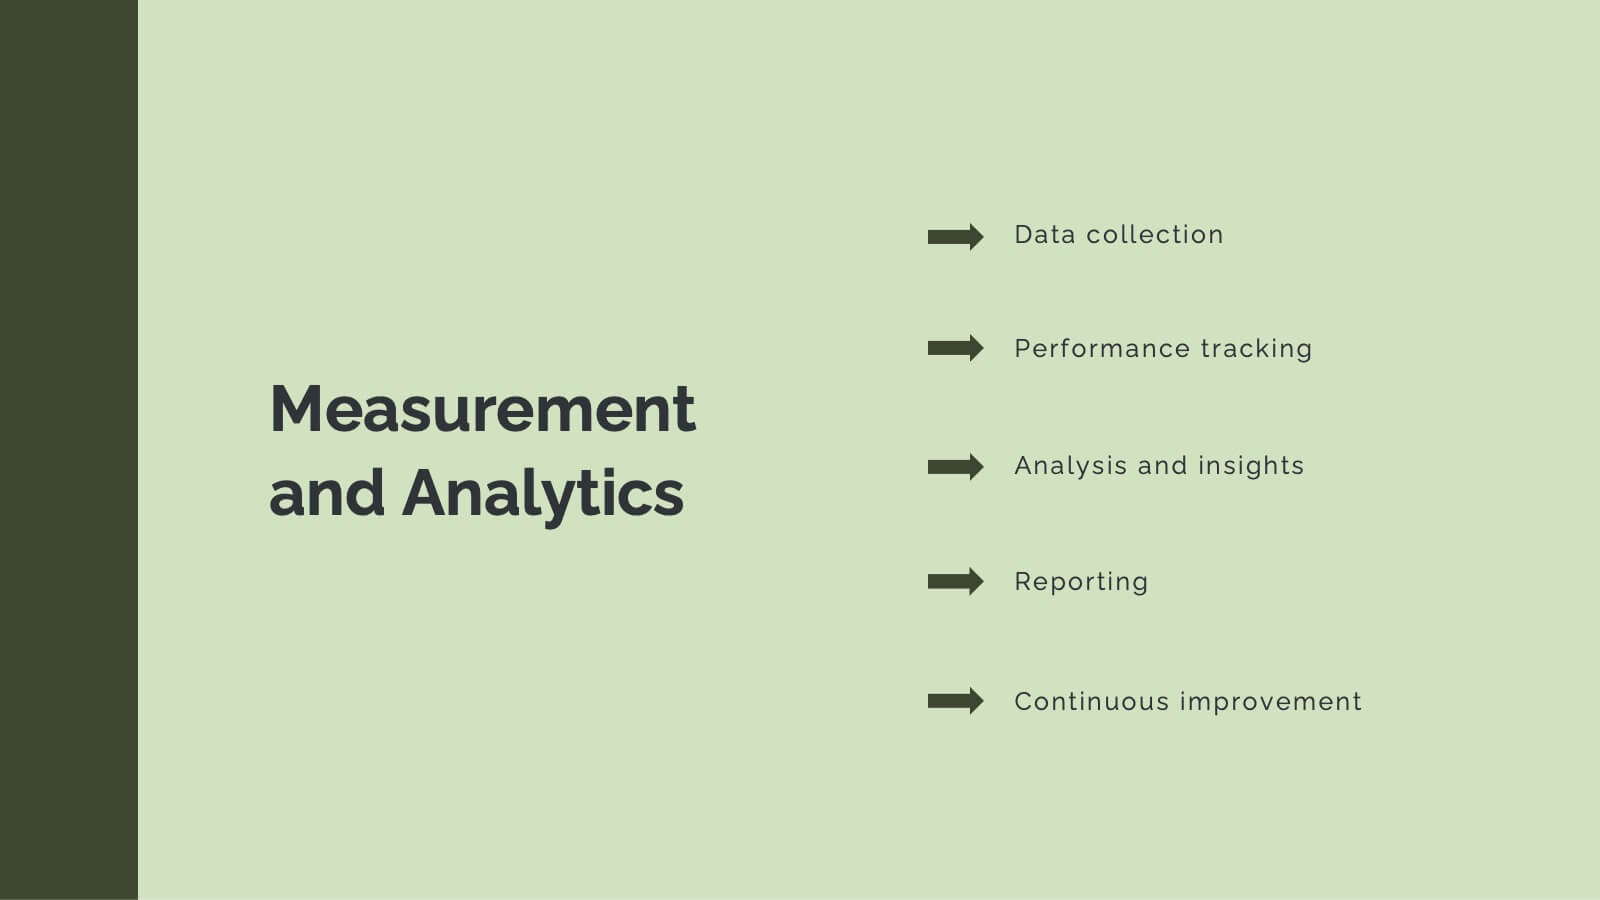
Horizon Advertising Agency Proposal Presentation
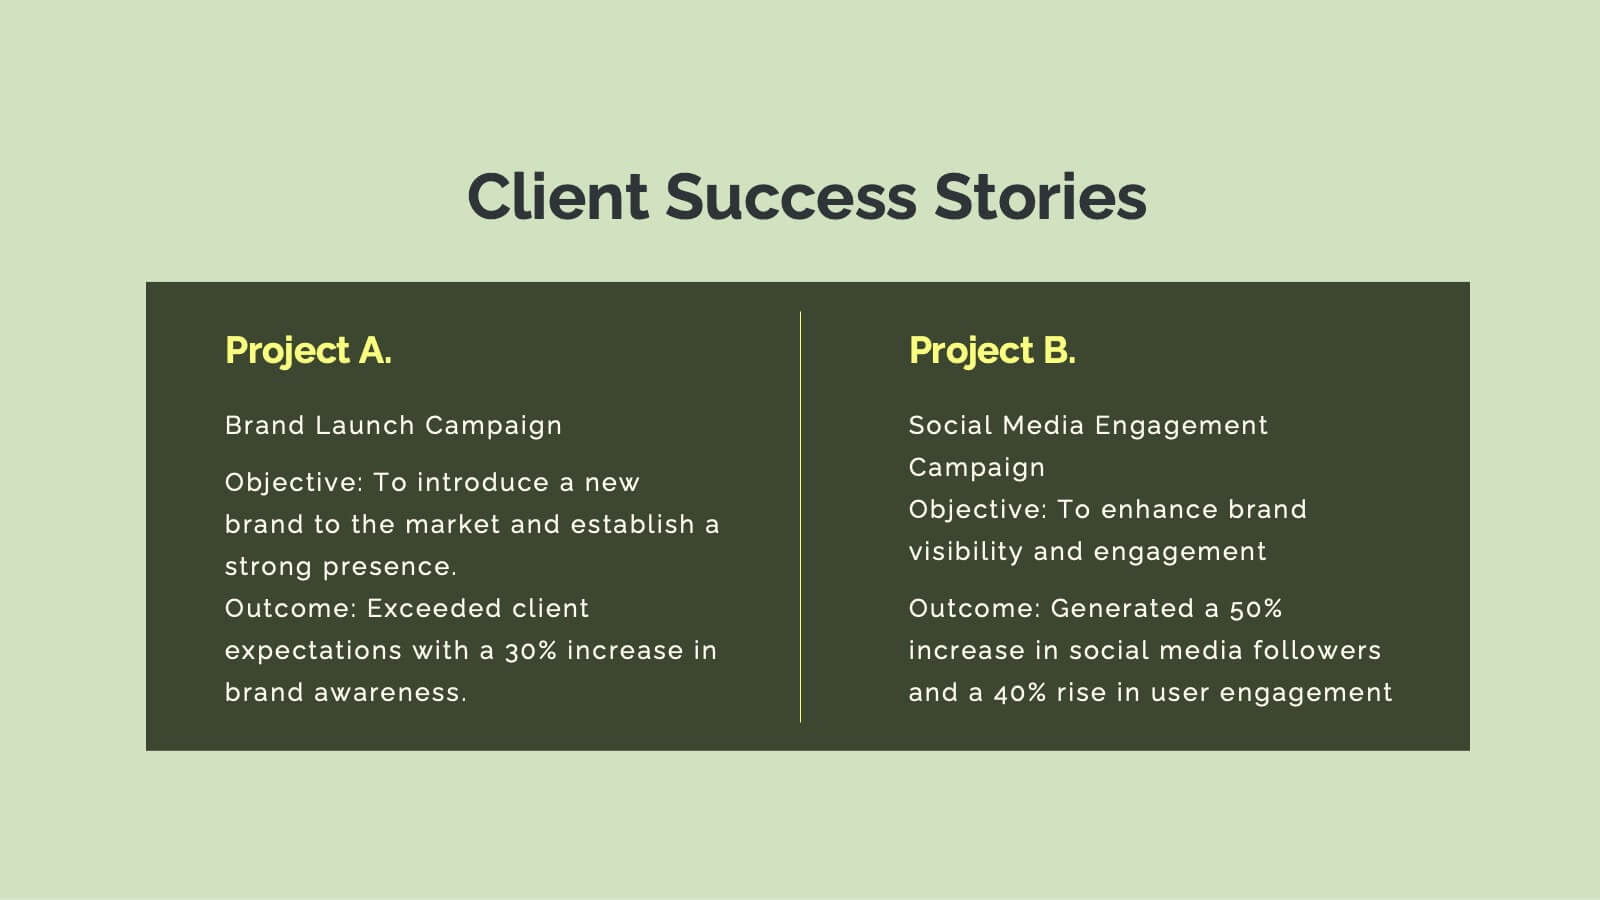
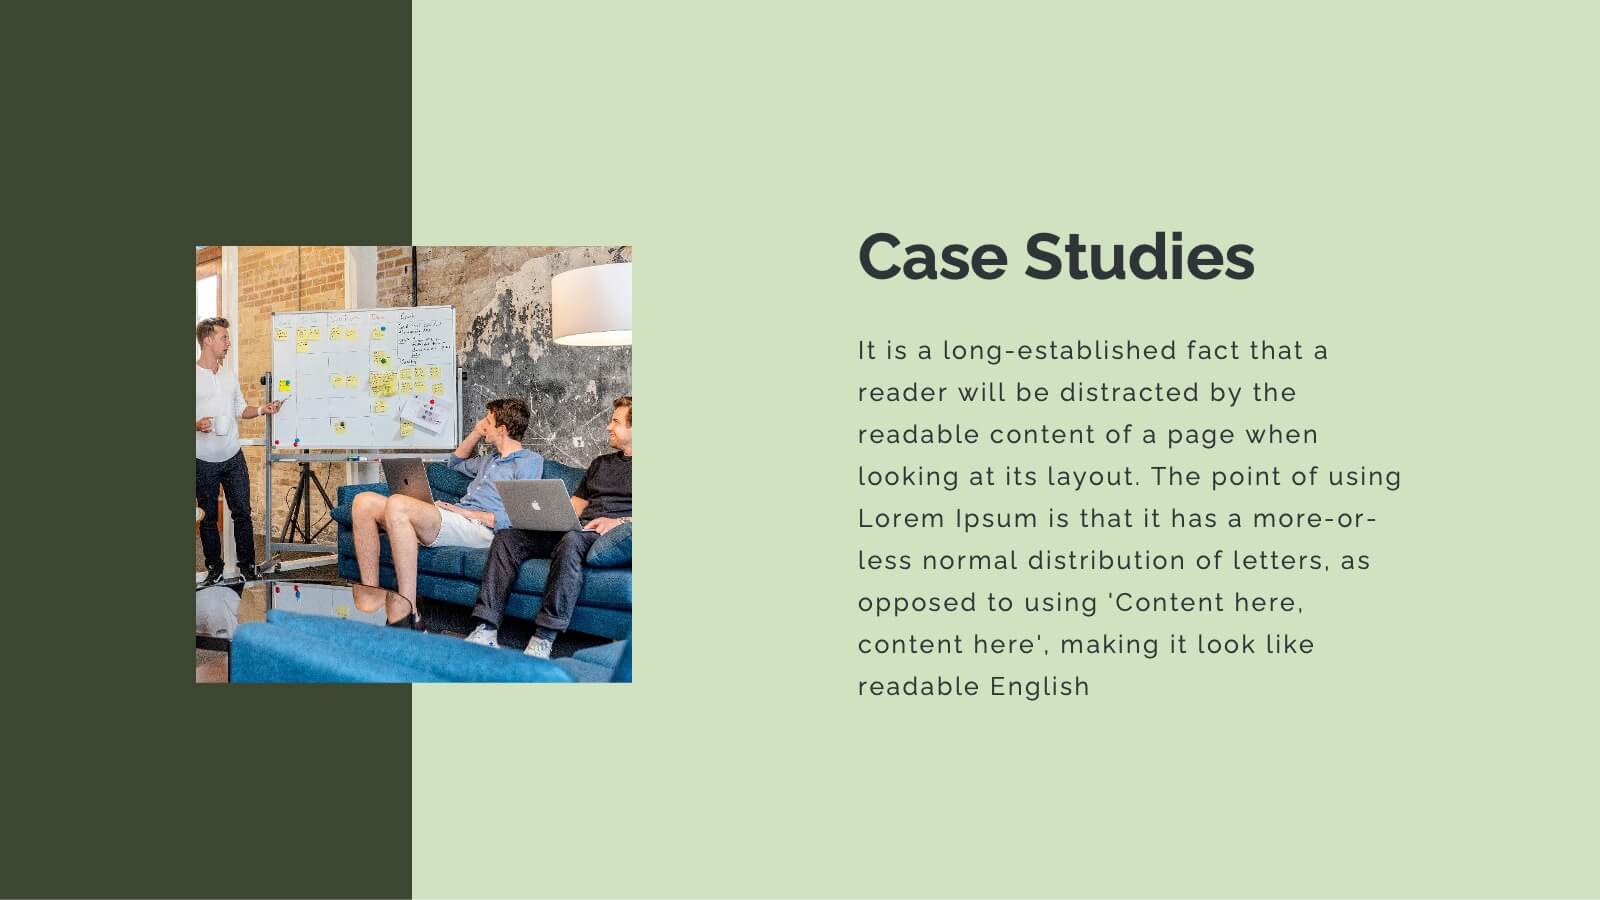
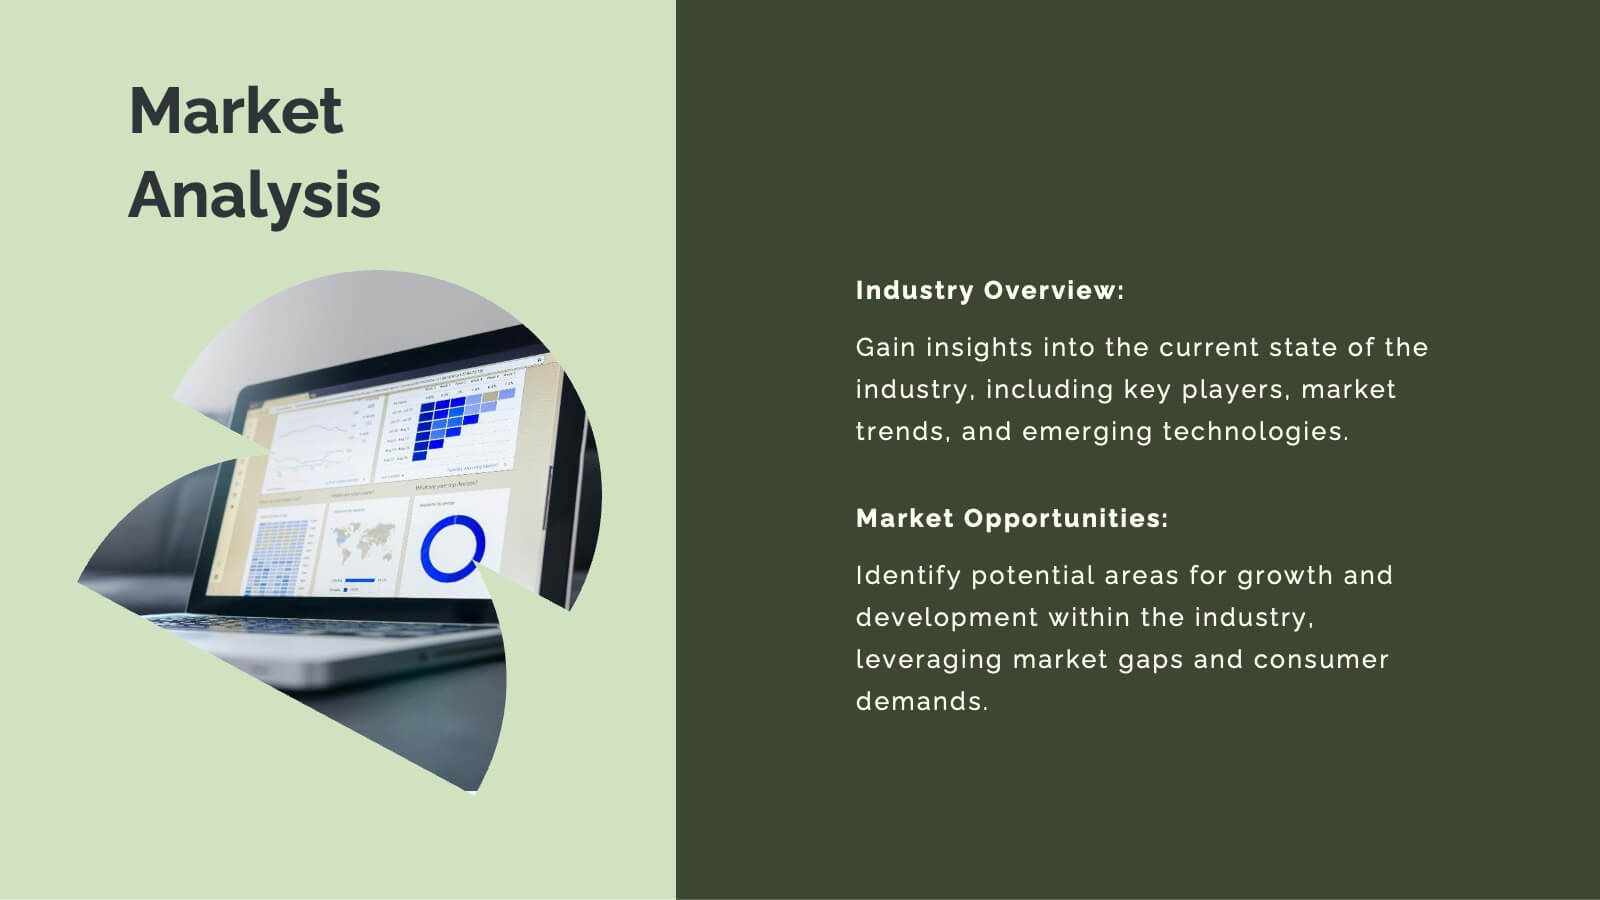
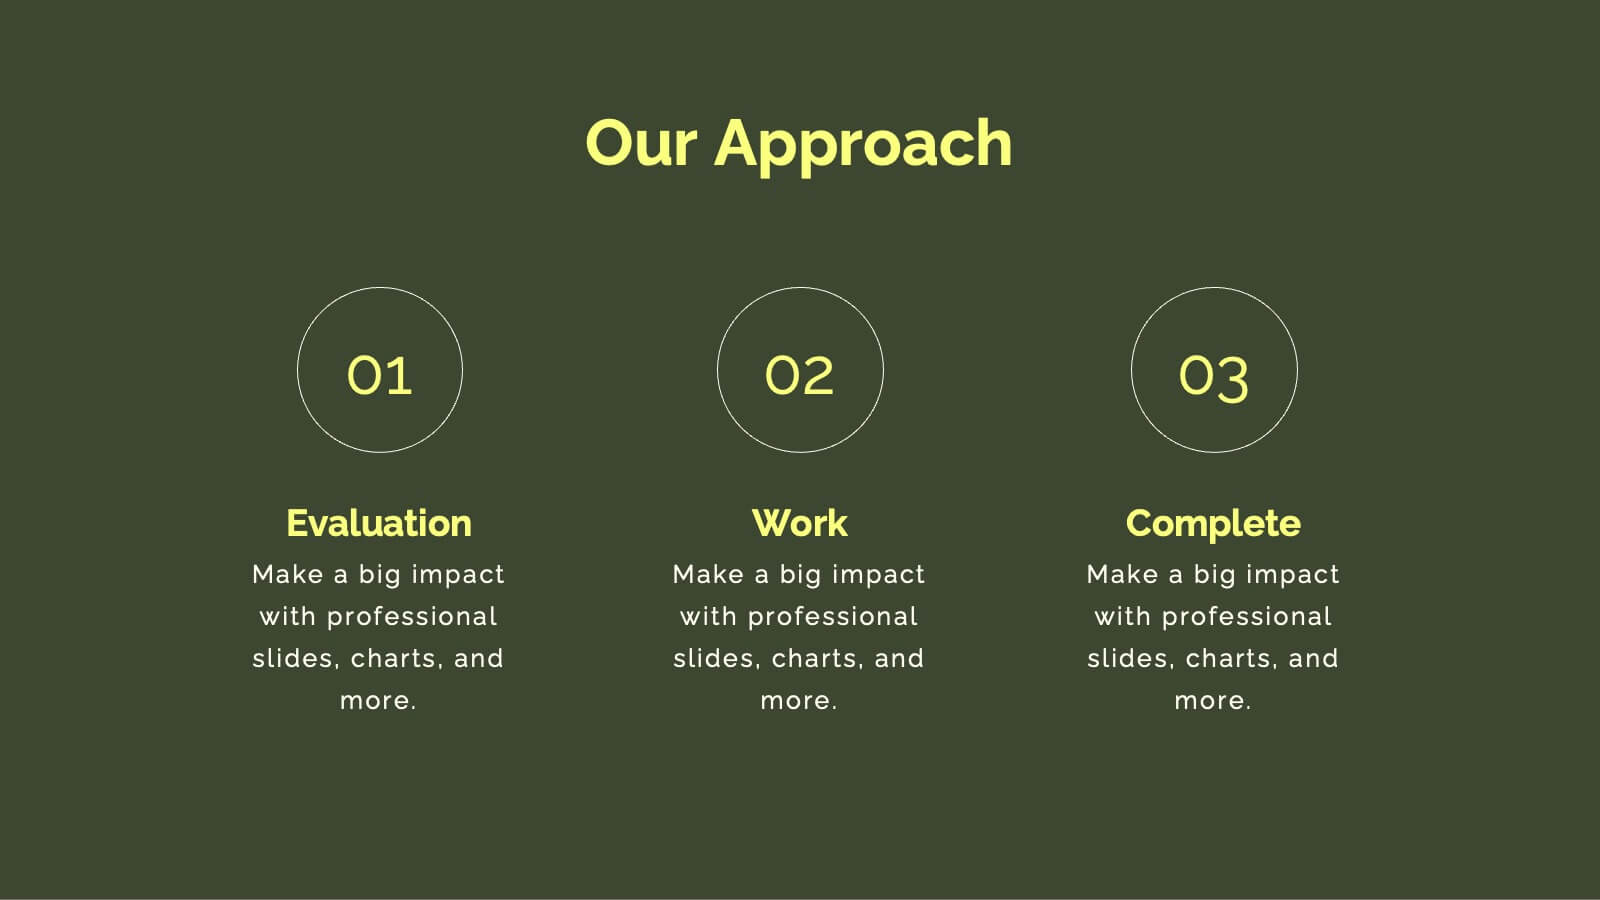
Elevate your advertising impact with this comprehensive agency proposal template. It’s meticulously designed to showcase your agency’s capabilities from strategic planning to creative execution, ensuring a persuasive presentation of services like market analysis, campaign strategies, and client success stories. Each slide is formatted to facilitate understanding and engagement, making it perfect for highlighting your team's expertise and unique approach. Compatible with major presentation platforms like PowerPoint, Google Slides, and Keynote, this template supports your efforts to secure new clients and projects seamlessly across various devices.


6 slides
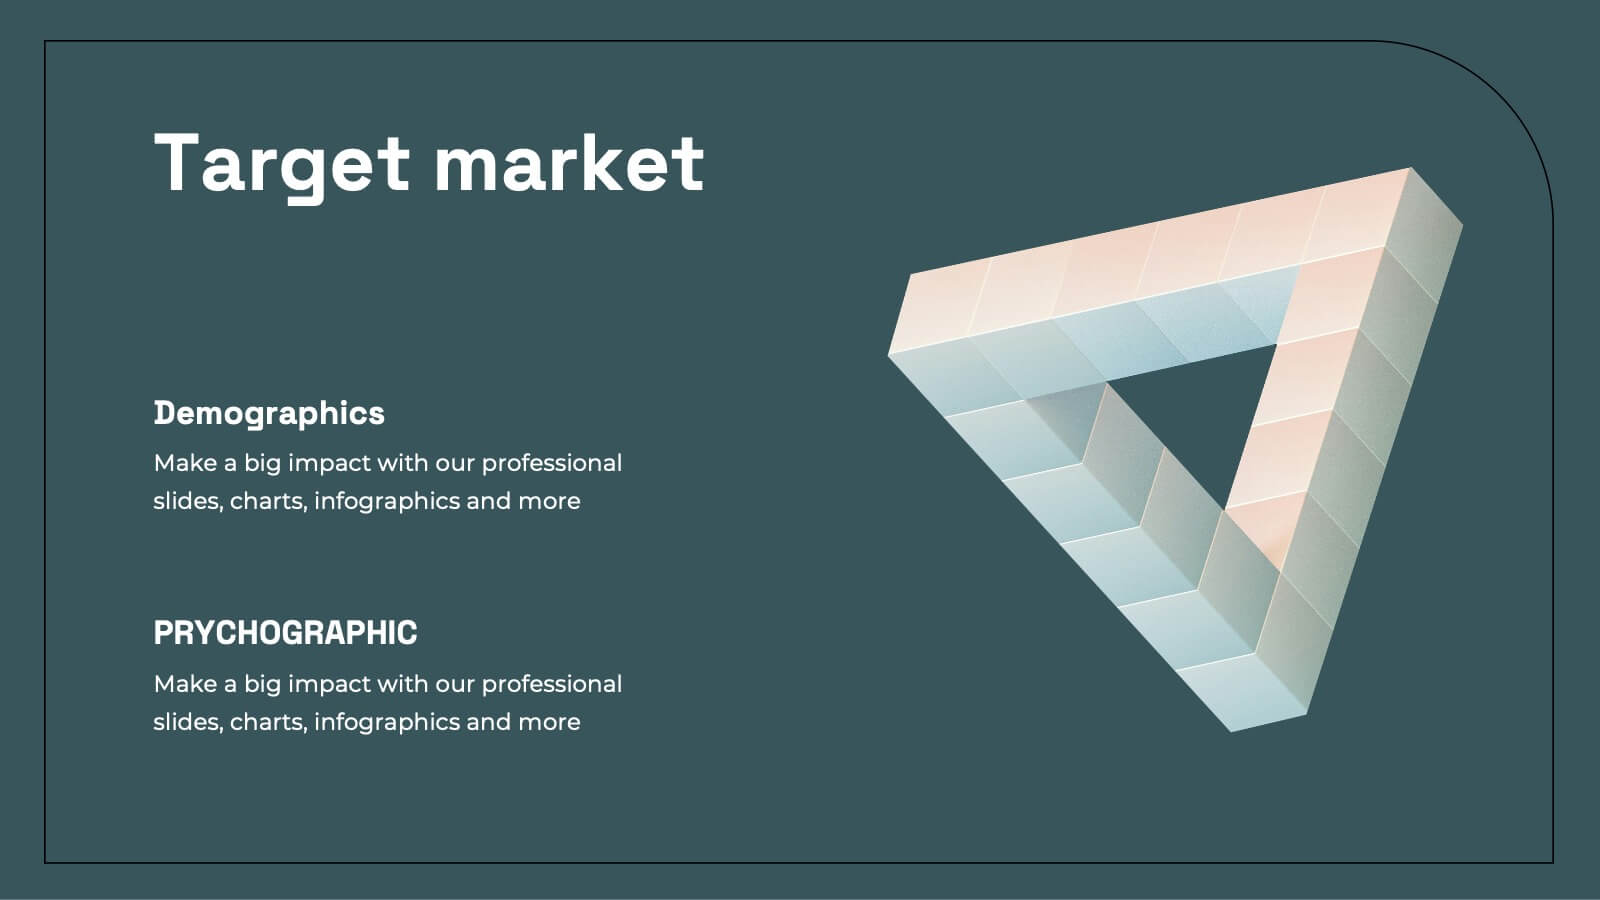
Demographic and Psychographic Segmentation Presentation
Bring your audience insights to life with a clear, data-driven design that highlights who your customers are and what drives their decisions. This presentation helps you analyze audiences by lifestyle, behavior, and demographics. Fully customizable and compatible with PowerPoint, Keynote, and Google Slides for effortless professional presentations.


6 slides
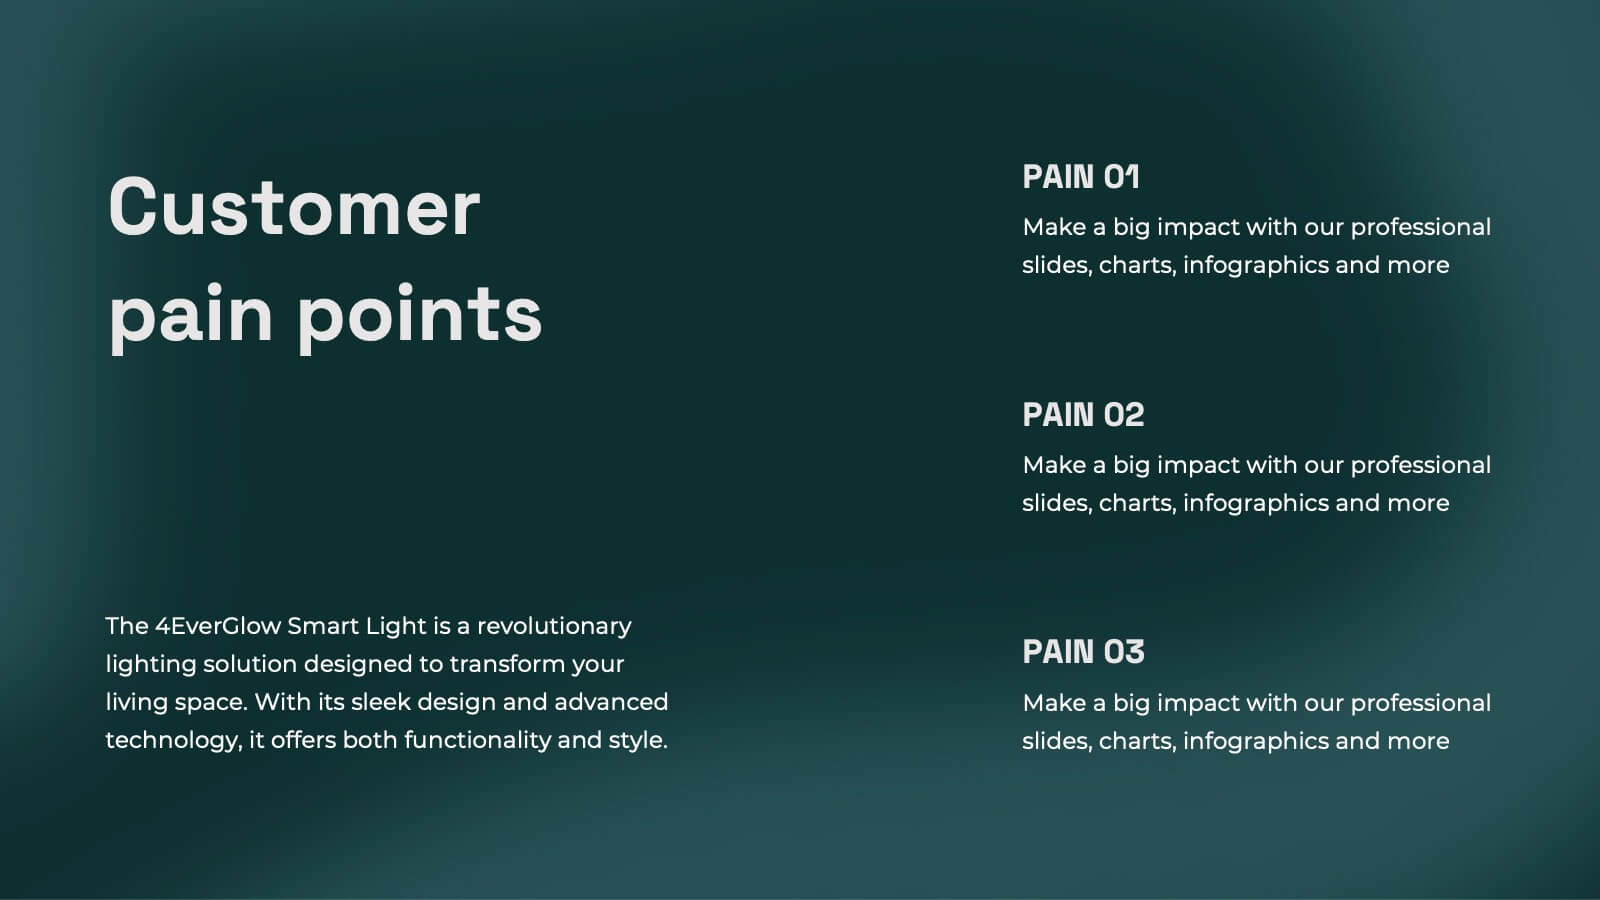
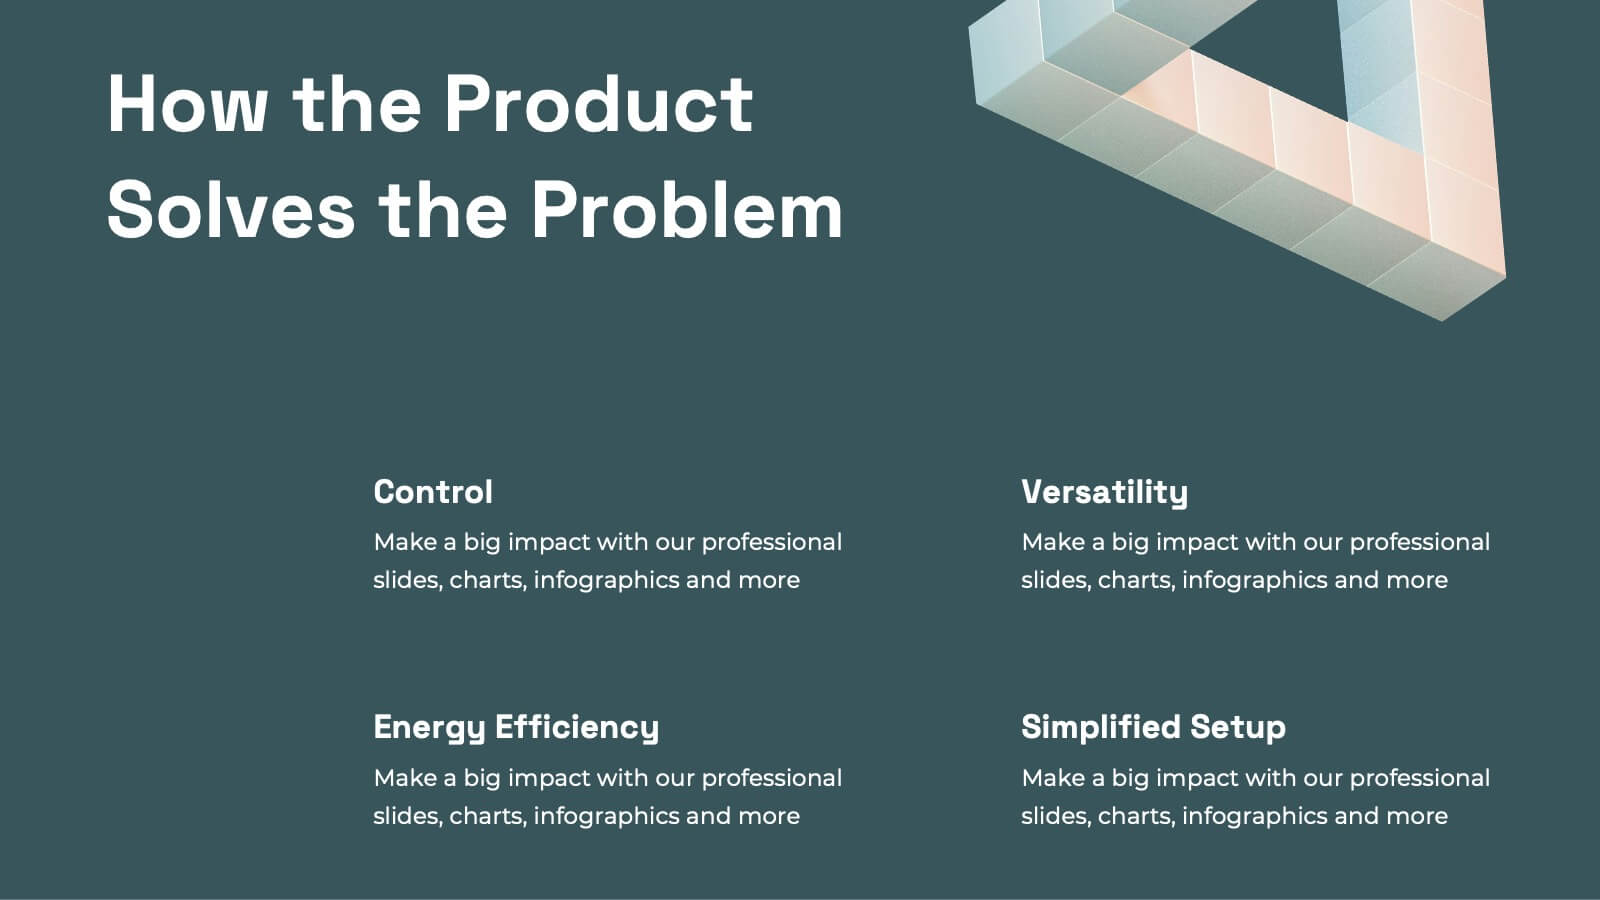
Key Points Overview Presentation
Bring your message to life with a slide that makes every key point feel clear, organized, and easy to follow. This presentation helps you highlight essential ideas, compare insights, and simplify complex information for any audience. Perfect for meetings, reports, or strategy updates. Fully compatible with PowerPoint, Keynote, and Google Slides.


10 slides
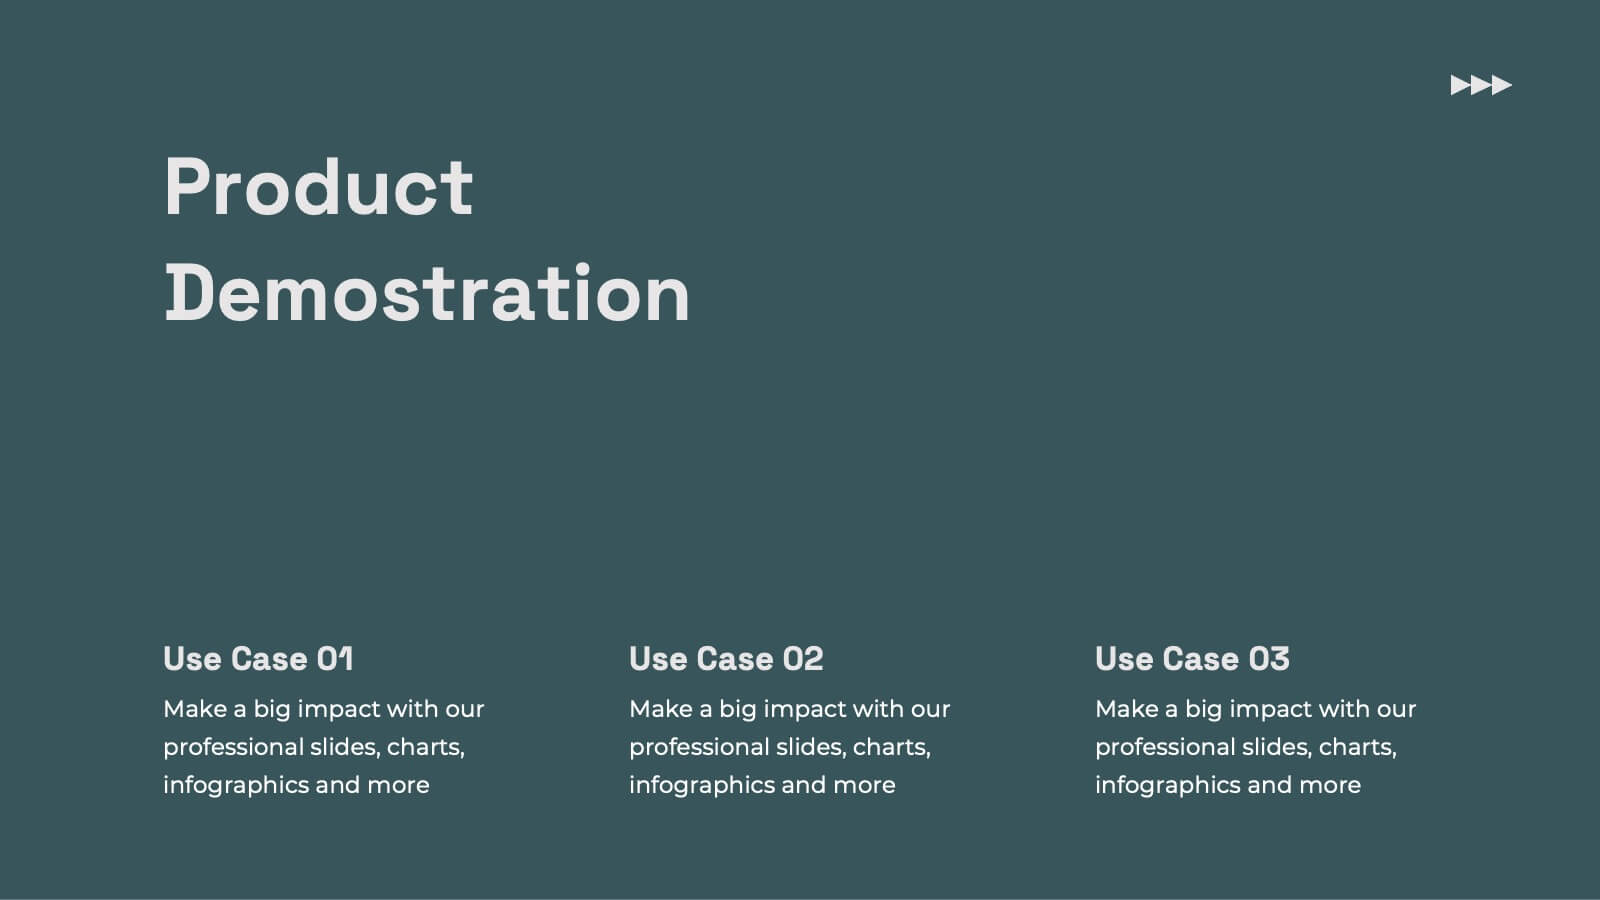
Digital Device Showcase Presentation
Bring your content to life with a bold, modern slide that spotlights digital devices in a clean, eye-catching layout. This presentation helps you introduce product features, showcase app designs, or highlight tech concepts with clarity and style. Fully editable and easy to use, it works seamlessly in PowerPoint, Keynote, and Google Slides.


8 slides
Professional Title Slide Presentation
Start your presentation with impact using a bold, modern cover design that captures attention instantly. Perfect for introducing reports, creative projects, or business pitches, this layout combines professional typography with clean visuals for a polished first impression. Fully editable in PowerPoint, Keynote, and Google Slides for seamless customization.