


Features
- 5 Unique slides
- Fully editable and easy to edit in Microsoft Powerpoint, Keynote and Google Slides
- 16:9 widescreen layout
- Clean and professional designs
- Export to JPG, PDF or send by email


Do you have any questions?
Recommend


22 slides
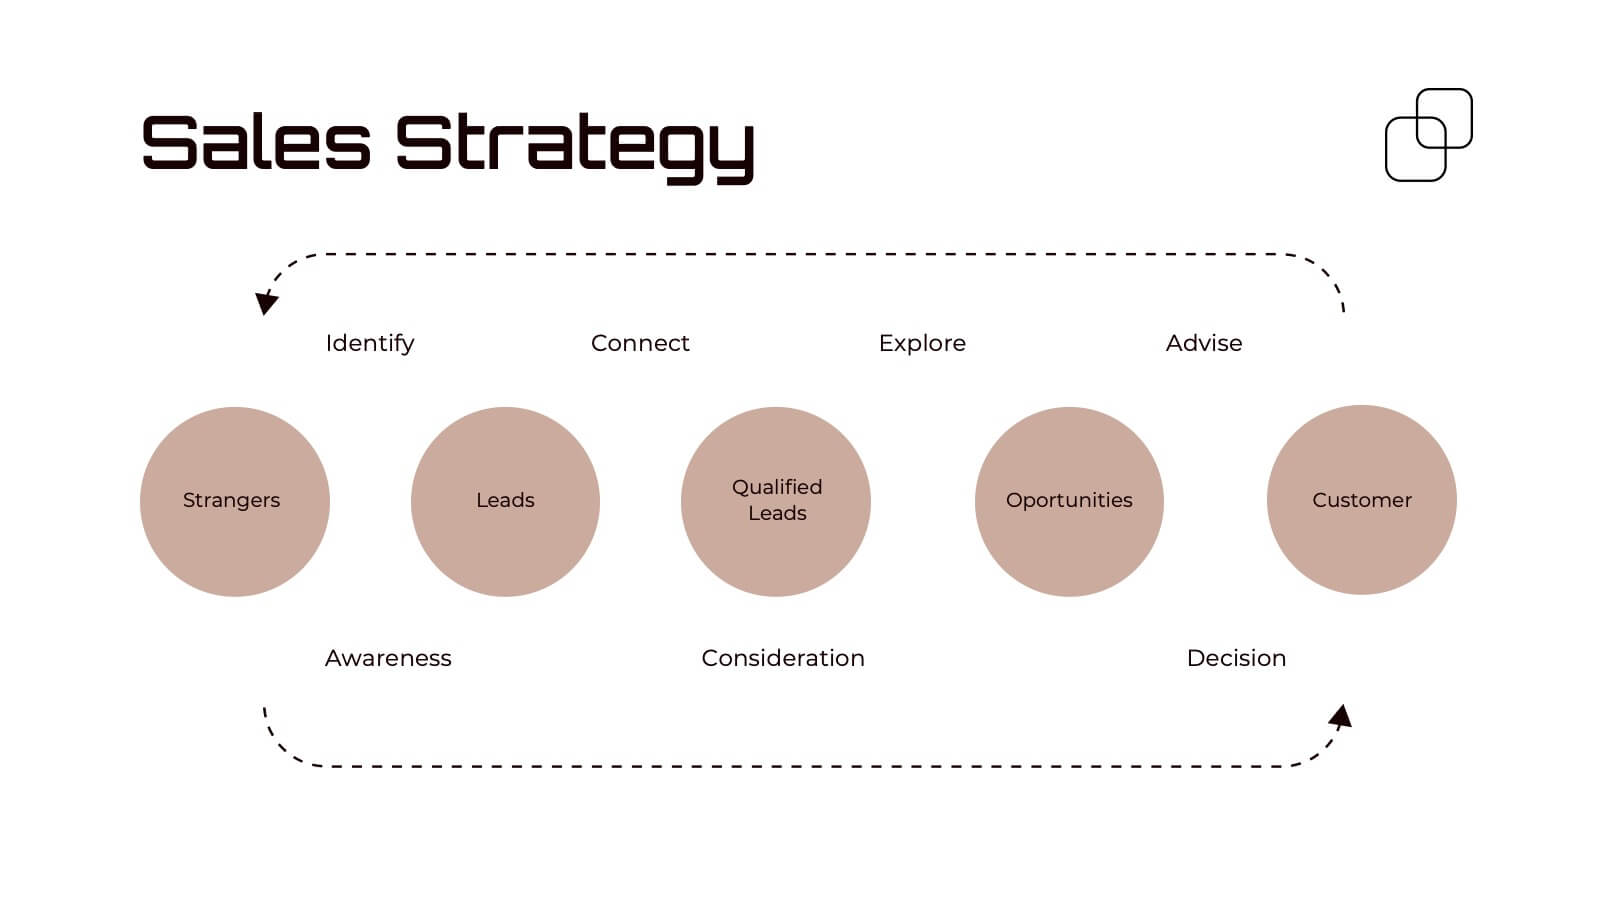
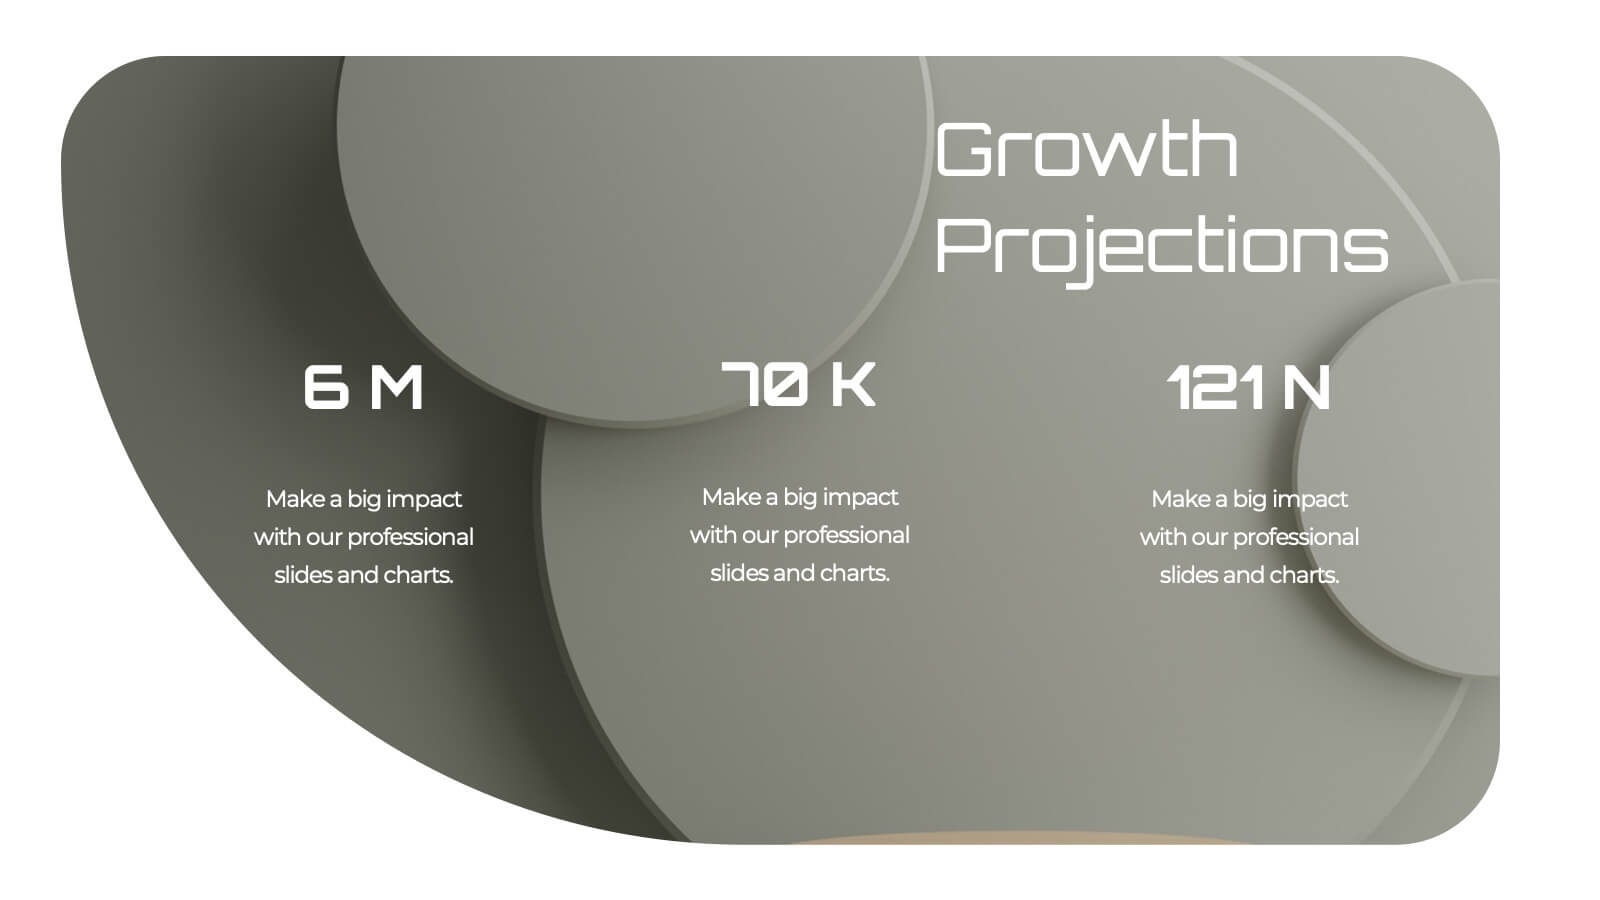
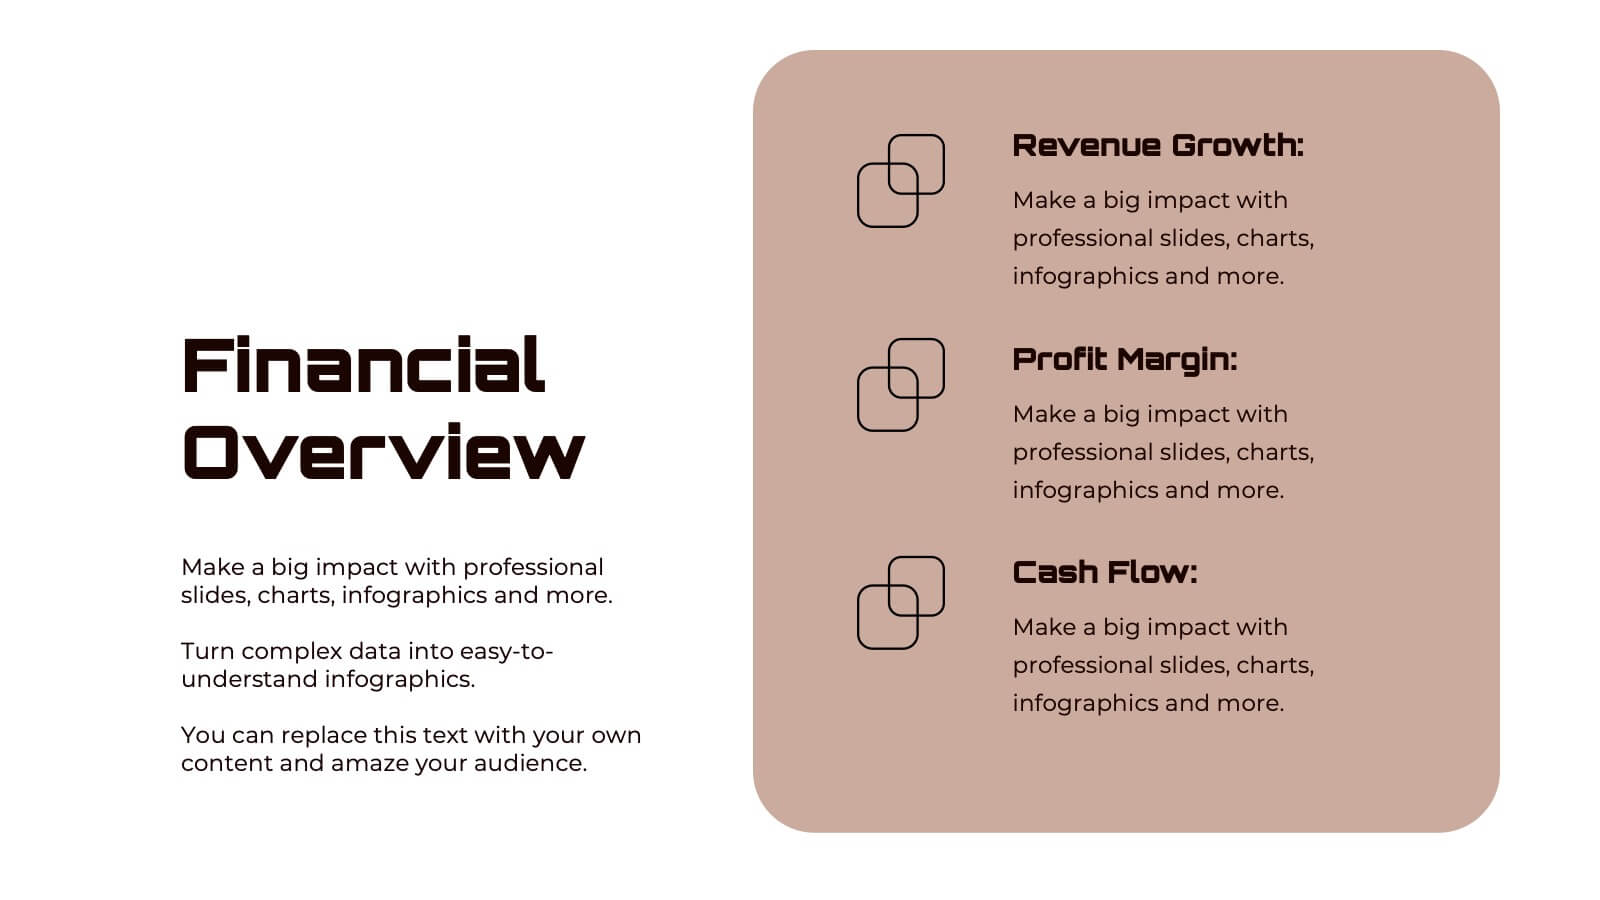
Glidebeam Content Marketing Pitch Deck Presentation
Capture your audience’s attention and showcase your marketing strategy with confidence using this polished and thoughtfully designed marketing pitch deck. It covers key elements like company history, target audience, competitive landscape, financial highlights, and growth strategies. Ideal for pitches or meetings, it’s compatible with PowerPoint, Keynote, and Google Slides.


8 slides
Insurance Market Trends Presentation
Stay Ahead in the Insurance Industry with this Insurance Market Trends Presentation template. Designed with a modern roadmap layout, this slide helps illustrate key trends, policy changes, and industry insights in an engaging and structured way. Ideal for insurance professionals, financial analysts, and business strategists, this fully customizable template is compatible with PowerPoint, Keynote, and Google Slides, making it easy to adapt to your specific needs.


7 slides
Communication Infographic Presentation Template
Communication Infographics are a more professional way of presenting facts and a great way to share your marketing strategy and goals with your team. Our template includes a variety of infographic elements, including bullet points, call to actions and persuasive slogans. This template design is ideal for presentations on subjects such as content marketing, sales, social media strategy, and many more. Our Communication Template includes graphic illustrations, slides and text boxes for your topics. In this template you can easily add your own text and images to create a meaningful presentation.


6 slides
Process Cycle Wheel Slide Presentation
Give your workflow a visual rhythm with this clean, circular layout designed to highlight every stage of a process with clarity and style. Perfect for showcasing cycles, systems, or strategies, it keeps your message organized and engaging. Fully editable and compatible with PowerPoint, Keynote, and Google Slides.


4 slides
Data Table Infographic Presentation
Organize complex information clearly with the Data Table Infographic Presentation. This slide design features a structured table layout paired with icon-labeled column headers for visual clarity. Ideal for presenting statistics, performance metrics, survey data, or structured comparisons. Highlighted headers draw attention to key sections, making your data easy to digest. Fully editable in PowerPoint, Keynote, and Google Slides.


6 slides
Psychology Mind Map Template Presentation
Unlock the brain’s potential with this smart and sleek visual! Perfect for organizing complex concepts, this mind map template helps you visualize psychological theories, thoughts, or data connections in a head-shaped layout using colored hexagons. Easily editable and professionally designed, it works seamlessly in PowerPoint, Keynote, and Google Slides.


6 slides
RAPID Decision Infographic
The RAPID matrix is a decision-making framework used to clarify roles and responsibilities within a project or organization, especially when it comes to decision-making processes. The RAPID acronym stands for Responsible, Accountable, Consulted, Informed, and Decider. This infographic template is a visual tool that helps clarify roles and responsibilities within a project or process. This template is designed to define who is involved in each step of a task, who has decision-making authority, and who needs to be informed or consulted. Compatible with Powerpoint, Keynote, and Google Slides. Apply a color-coding scheme to visually distinguish different roles.


3 slides
Decision-Making Bowtie Framework
Clarify choices and consequences with the Decision-Making Bowtie Framework Presentation. This slide design uses the bowtie model to organize factors before and after a decision, helping audiences visualize causes, potential outcomes, and risk management strategies. Ideal for leadership, business strategy, or operations meetings. Customize each side with key points, contributing factors, and mitigation actions. Includes editable labels, flexible layout options, and is fully compatible with PowerPoint, Keynote, and Google Slides.


4 slides
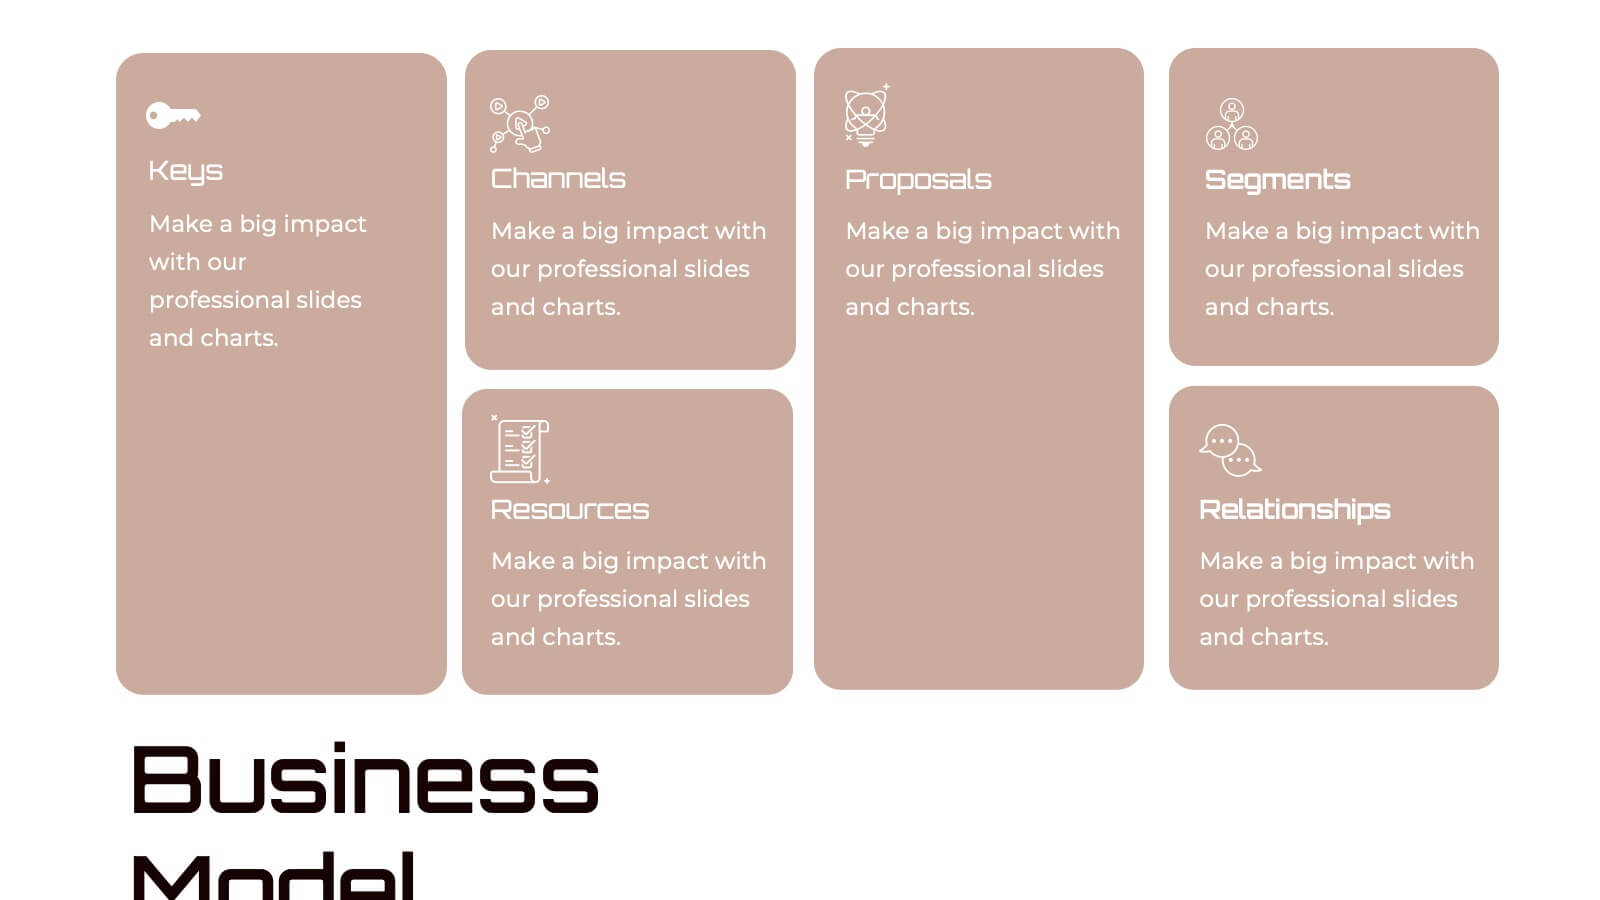
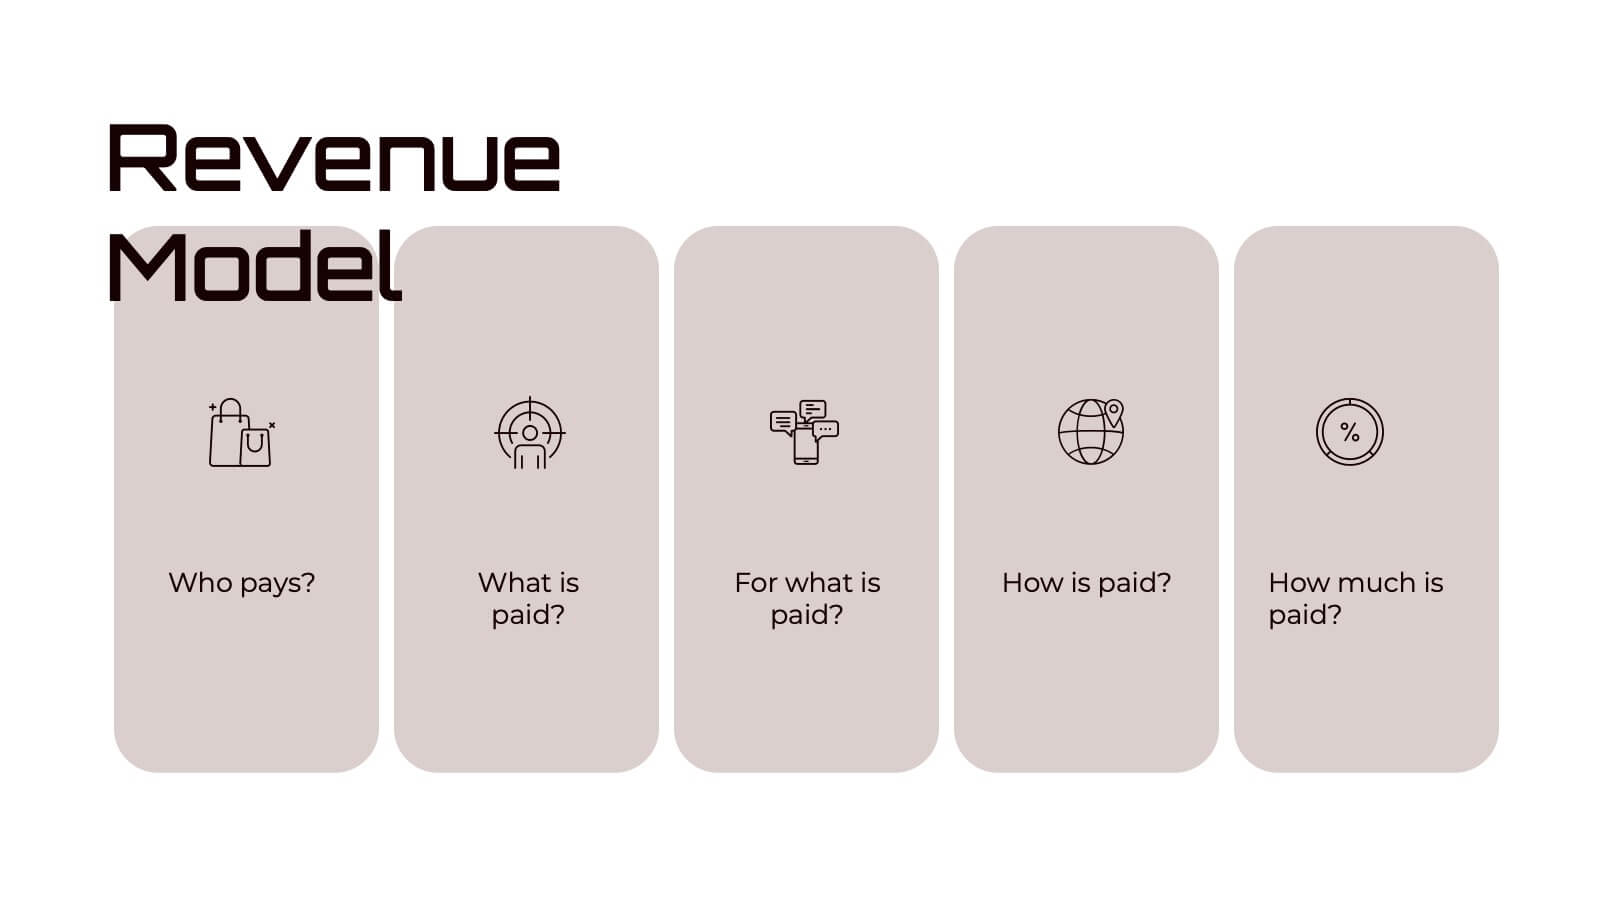
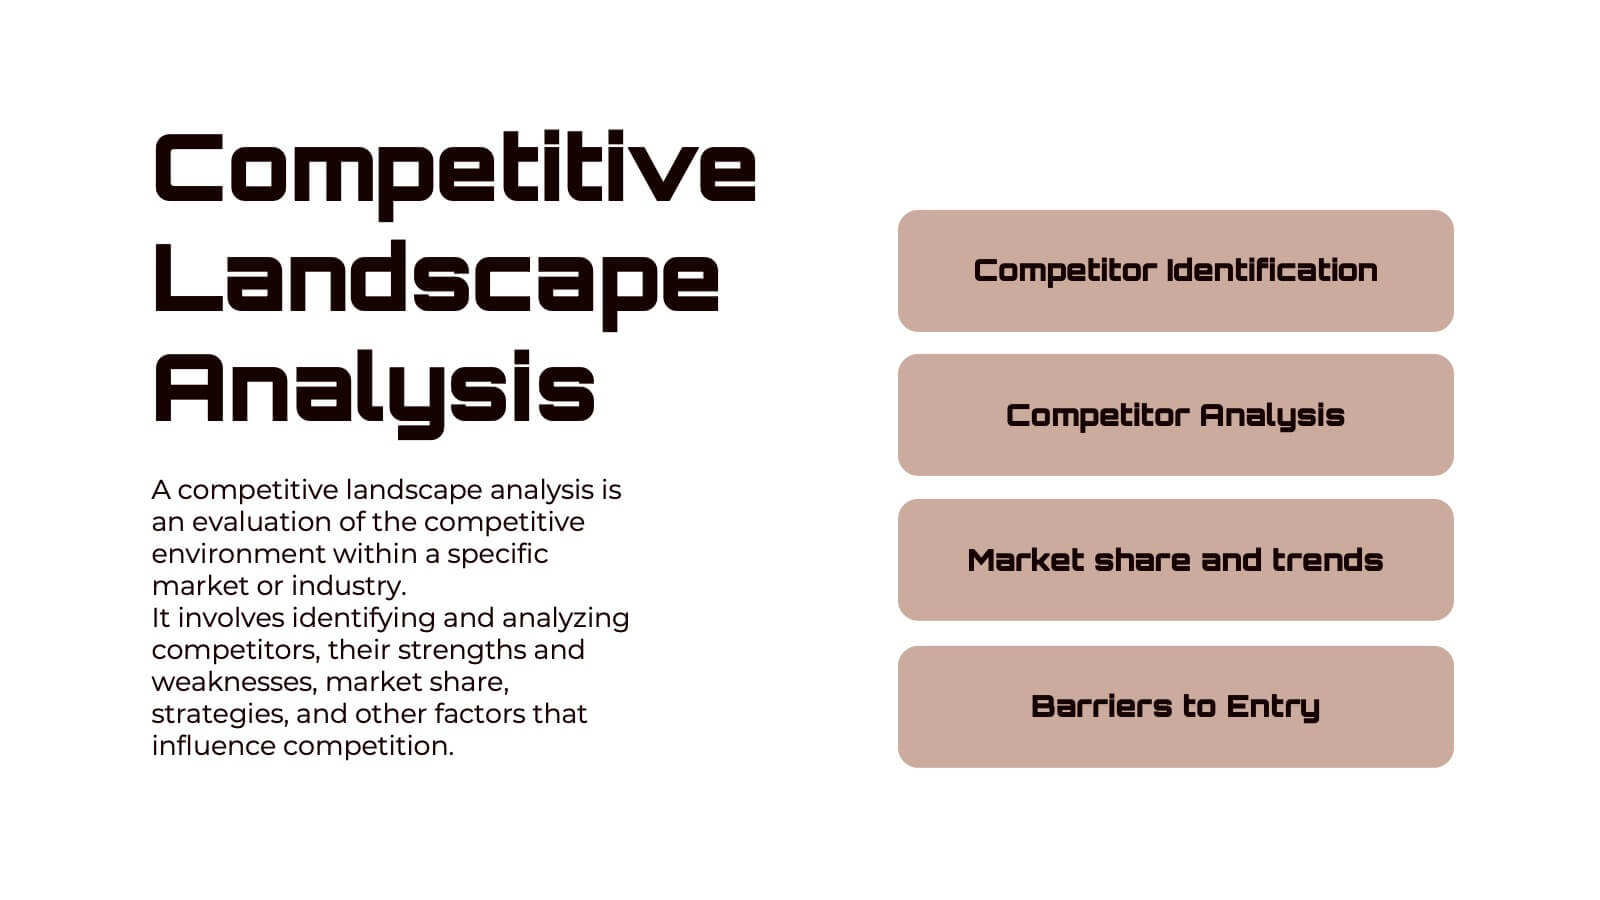
Business Decision-Making Framework Presentation
Visualize your path to smarter choices with this key-themed decision-making template. Ideal for strategy sessions, executive planning, or consulting presentations, it breaks down three core steps leading to actionable results. The layout emphasizes clarity and progression, with editable text zones and sleek icons. Works with PowerPoint, Keynote, and Google Slides.


7 slides
Innovation Infographics Presentation Template
Our innovation Infographic template is a trendy and professional way to present innovation to your audience in a way that keeps them engaged. This design features simple yet striking elements which will deliver your message, while the font and color scheme gives you that flexibility to personalize this template to your brand’s identity. We have designed this presentation template to help you create and deliver engaging content for your audience. It is a powerful tool that helps you build interest, generate leads and position yourself as an authority on the subject of innovation.


12 slides
Corporate Sustainability Strategy Presentation
Achieve your sustainability goals with the Corporate Sustainability Strategy Presentation template. This modern, visually engaging layout helps businesses showcase their environmental, social, and governance (ESG) initiatives, sustainability roadmaps, and corporate responsibility plans. Featuring clear, structured sections, this fully customizable design is perfect for corporate leaders, consultants, and eco-conscious organizations. Compatible with PowerPoint, Keynote, and Google Slides for effortless editing and presentation.


6 slides
Real Estate Investment Portfolio Presentation
Bring your presentation to life with a clean, engaging layout that makes complex property portfolios easy to understand. This slide helps you break down key investments, showcase performance, and highlight essential insights with clarity and flow. Perfect for real estate reports or pitch decks, and fully compatible with PowerPoint, Keynote, and Google Slides.


6 slides
Oceania Biome Map Infographics
Explore our versatile Oceania Biome Map infographic template, a powerful tool for visualizing the diverse ecosystems in the Oceania region. This template is compatible with popular presentation software such as PowerPoint, Keynote, and Google Slides, allowing you to effortlessly customize it to meet your specific needs. The Oceania Biome Map infographic template serves as a foundational framework for displaying information about various biomes, including rainforests, deserts, coral reefs, and more. Whether you're an educator, environmentalist, or simply interested in Oceania's ecology, this template provides a user-friendly platform for creating informative presentations and educational materials. Impress your audience with this SEO-optimized Oceania Biome Map infographic template, thoughtfully designed for clarity and ease of use. Customize it to showcase the unique characteristics and biodiversity of Oceania's biomes, making it an invaluable resource for your projects and presentations. Begin crafting your personalized infographic today!


7 slides
Porters Five Forces Model Infographic Presentation
Porter's Five Forces Model is a structured framework used to analyze the competitive forces within an industry and their impact on a company's profitability. With template you can create an appealing and informative infographic about Porter's Five Forces Model. Featuring helpful illustrations and easy-to-read text, this template is perfect for breaking down the complex concepts of Porter's Five Forces Model into simple, understandable terms. Designed for use with Powerpoint, Keynote, and Google Slides, you can easily add your own content and tailor the template to fit your specific needs.


4 slides
Employee Training and Development
Train smarter, not harder—with this bold funnel-style visual that maps your employee development journey from initial training to measurable impact. It's perfect for illustrating progress, performance shifts, or development stages across teams or roles. Fully customizable in PowerPoint, Keynote, and Google Slides for smooth integration into any professional presentation.


7 slides
Human Resources Administration Infographic
Human Resources Administration involves managing and overseeing various aspects of an organization's human capital and related processes. Our HR administration Infographic is your compass in the vast realm of HR, guiding you through essential aspects, best practices, and strategies crucial for successful HR management. This template is your guide to navigating the HR terrain. Compatible with Powerpoint, Keynote, and Google Slides. Discover best practices, strategies, and essential aspects of HR, empowering you to lead with expertise, empathy, and efficiency in the exciting world of human resources.

22 slides
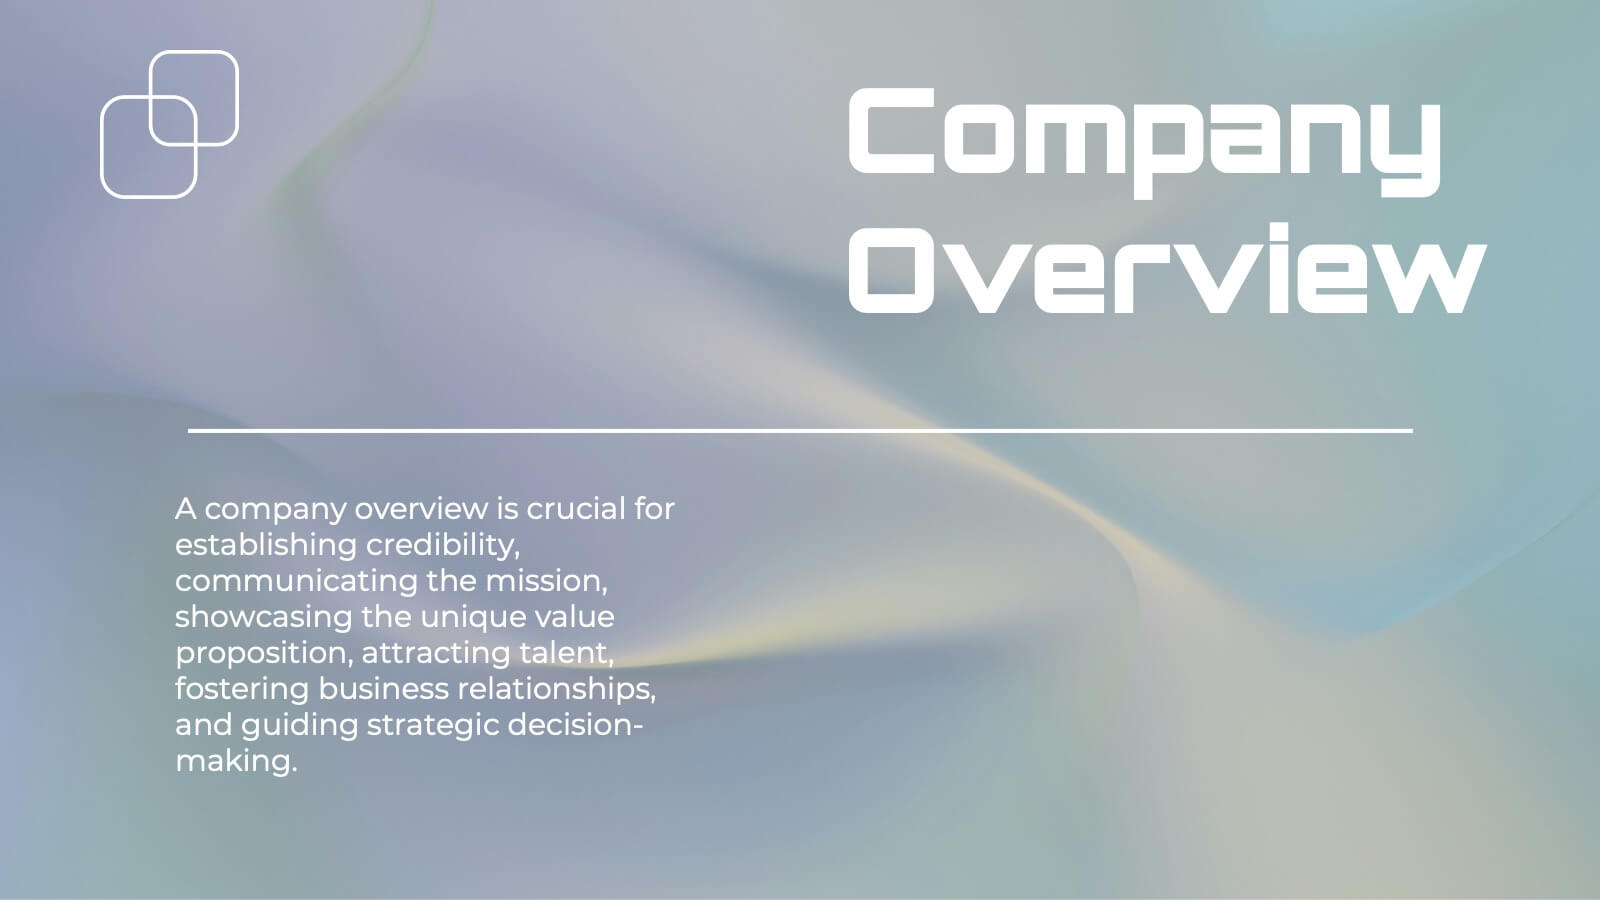
Pearl Product Launch Pitch Deck Presentation
Make your product launch shine with this sleek, pearl-inspired presentation! Perfect for pitching your product’s unique value, market positioning, and growth potential, this template is designed to captivate investors and stakeholders. Its elegant, minimalist layout keeps your message front and center. Compatible with PowerPoint, Keynote, and Google Slides.