


Features
- 23 Unique Slides
- Fully editable and easy to edit in Microsoft Powerpoint, Keynote and Google Slides
- 16:9 widescreen layout
- Clean and professional designs
- Export to JPG, PDF or send by email


Do you have any questions?
Recommend


5 slides
Visual Mind Connections Bubble Chart Presentation
Visualize interconnected concepts with clarity using the Visual Mind Connections Bubble Chart Presentation. This engaging layout centers around a core idea, surrounded by supporting points in a clean, circular flow. Ideal for mapping strategies, team roles, or processes. Fully editable in PowerPoint, Keynote, or Google Slides—perfect for business, education, or coaching.


3 slides
Visual Breakdown with Tree Diagram Format Presentation
Illustrate growth stages, concepts, or layered development with the Visual Breakdown with Tree Diagram Format Presentation. This creative design uses three tree icons—seedling, sapling, and mature tree—to represent progression or hierarchy. Ideal for timelines, product evolution, or strategic planning. Fully editable in PowerPoint, Keynote, and Google Slides.


6 slides
Organizational Change Process Presentation
Make complex transitions look simple with this modern visual template. Perfect for illustrating every stage of organizational change, this infographic-style design helps communicate key steps with clarity and focus. Easily editable and professionally designed, it's compatible with PowerPoint, Keynote, and Google Slides for seamless integration into your workflow.


6 slides
Framework for Business Hierarchies Presentation
Clearly define organizational layers with the Framework for Business Hierarchies Presentation. This pyramid-style layout is perfect for illustrating chain-of-command, leadership structures, or functional roles from executive to operational levels. The template features color-coded tiers, editable icons, and fully customizable text to suit your business model. Ideal for PowerPoint, Canva, Keynote, and Google Slides.


4 slides
RACI Responsibility Assignment Matrix
Streamline your project roles with this clear and customizable RACI Matrix template. Easily define who's Responsible, Accountable, Consulted, and Informed across tasks or phases. Perfect for project managers, team leads, and business strategists. Fully editable in PowerPoint, Keynote, and Google Slides.


5 slides
Strengths, Weaknesses, Opportunities & Threats Presentation
Visualize your SWOT analysis with clarity using the Strengths, Weaknesses, Opportunities & Threats Presentation. This editable puzzle-style slide makes it easy to present key insights and strategic positioning in a visually engaging format. Compatible with PowerPoint, Canva, and Google Slides for seamless customization and professional business planning.


30 slides
Quintara Rebranding Project Plan Presentation
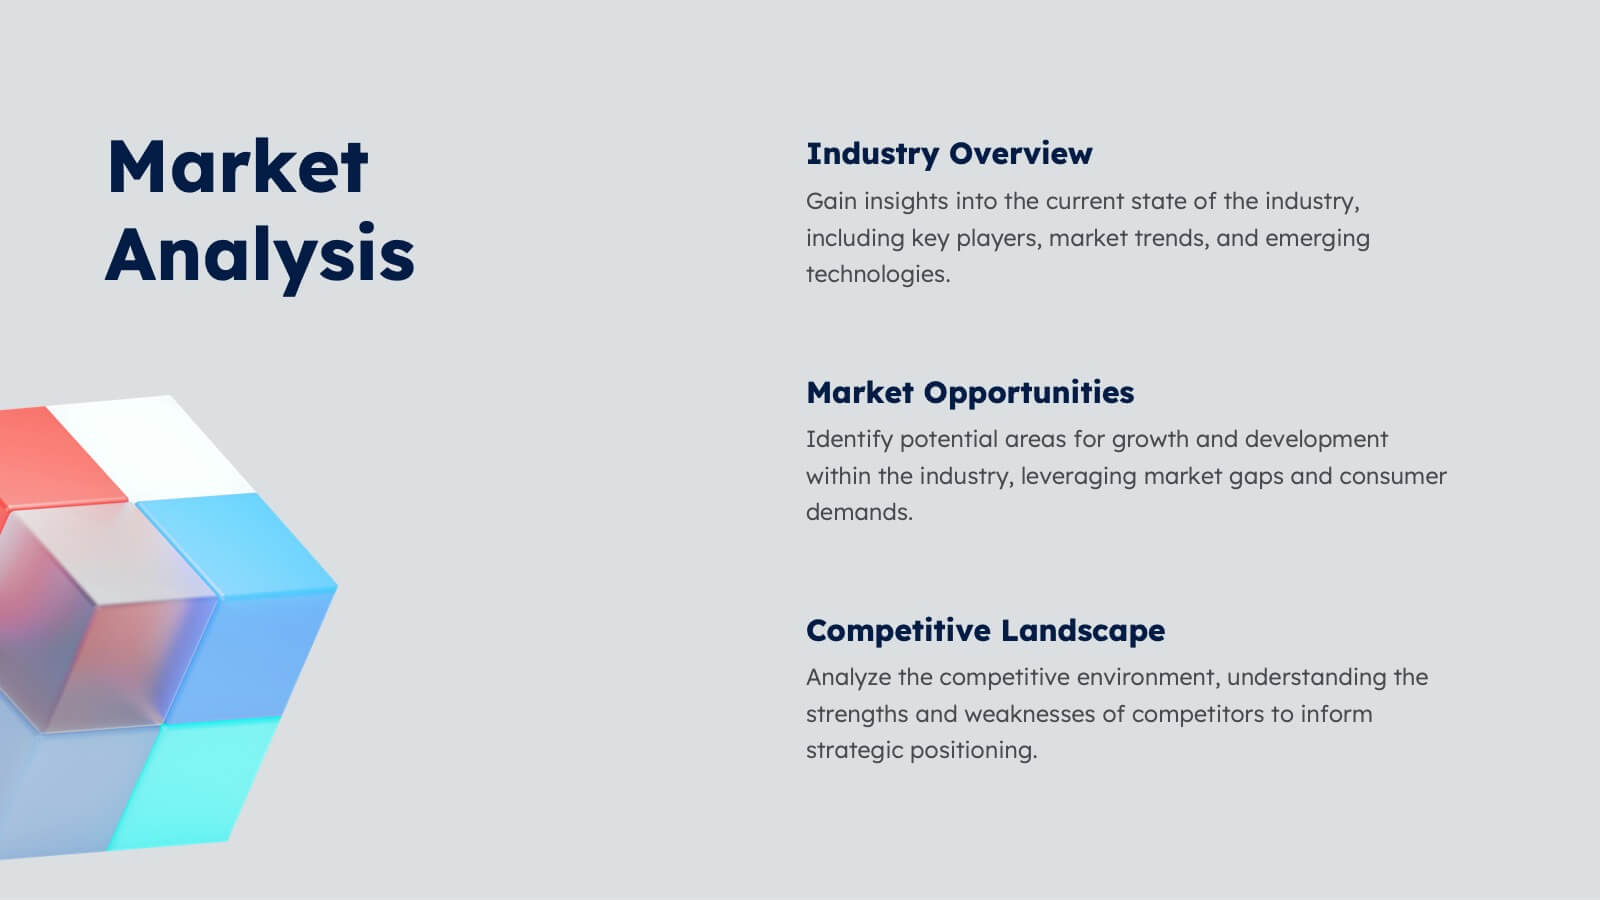
Revamp your brand with confidence using this dynamic rebranding project plan presentation. Covering key aspects like brand positioning, market analysis, visual identity, and unique selling propositions, this template helps you craft a compelling brand strategy. Fully customizable and compatible with PowerPoint, Keynote, and Google Slides for a seamless, professional presentation experience.


34 slides
Validation Pitch Deck
A Validation Pitch Deck, is a visual presentation that provides an overview of a startup company's business idea, market opportunity, value proposition, and progress towards validation of its concept or product. This template consists of a series of slides that are designed to convey the key elements of your business model in a concise and persuasive manner. Use this template as a tool to communicate your vision, market opportunity, and progress to potential investors or other stakeholders. Compatible with PowerPoint, Keynote, and Google Slides. The color scheme and design elements can be easily customized to match your brand or business.


6 slides
Bubble Chart Data Visualization Presentation
Make your data pop with visuals that tell a story at a glance. This modern presentation transforms raw numbers into clear, engaging bubble charts that simplify complex insights and comparisons. Fully editable and compatible with PowerPoint, Keynote, and Google Slides for effortless customization and professional results.


26 slides
Understanding the Stock Market Presentation
Step into the exciting world of finance with our dynamic and sleek presentation template, perfect for understanding the stock market! This comprehensive guide simplifies complex financial concepts, making it an ideal resource for beginners, students, and professionals. Featuring a sophisticated collection of slides, this template covers key topics such as market trends, investment strategies, and financial analysis. The design integrates bold colors, sharp graphics, and well-organized layouts to keep your audience engaged and informed. Infographics and charts break down intricate data, while mockups offer realistic previews of stock market tools. Fully customizable and versatile, this template can be adapted to suit various presentation needs and styles. It is compatible with PowerPoint, Keynote, and Google Slides, ensuring smooth and professional presentations across different platforms. Perfect for financial workshops, educational seminars, or anyone looking to deepen their understanding of the stock market.


22 slides
Aura Agency Portfolio Presentation
Showcase your agency's brilliance with this vibrant portfolio presentation template! Ideal for highlighting your mission, vision, case studies, and market analysis, it brings your achievements to life with colorful, engaging slides. Impress clients and partners with a well-structured, visually appealing narrative. Compatible with PowerPoint, Keynote, and Google Slides for easy use on any platform.


3 slides
Corporate Law and Regulation Guide Presentation
Clarify legal structures with the Corporate Law and Regulation Guide Presentation. This visually balanced design uses legal scale and book icons to symbolize authority, compliance, and fairness. Perfect for illustrating legal frameworks, policy breakdowns, or governance models. Fully editable for PowerPoint, Keynote, and Google Slides.


10 slides
Corporate Governance Model Presentation
Bring clarity and structure to complex leadership systems with this clean, modern slide, perfect for explaining how key responsibilities flow across an organization. It helps simplify roles, decisions, and oversight for any business audience. Fully editable and easy to use in PowerPoint, Keynote, and Google Slides.


4 slides
Butterfly Graph for Diverging Metrics Presentation
Easily compare opposing values with the Butterfly Graph for Diverging Metrics Presentation. Ideal for visualizing split opinions, pros vs. cons, or pre- and post-metrics across multiple categories. The clean, mirrored layout helps audiences grasp key differences at a glance. Compatible with PowerPoint, Google Slides, Canva, and Keynote.


22 slides
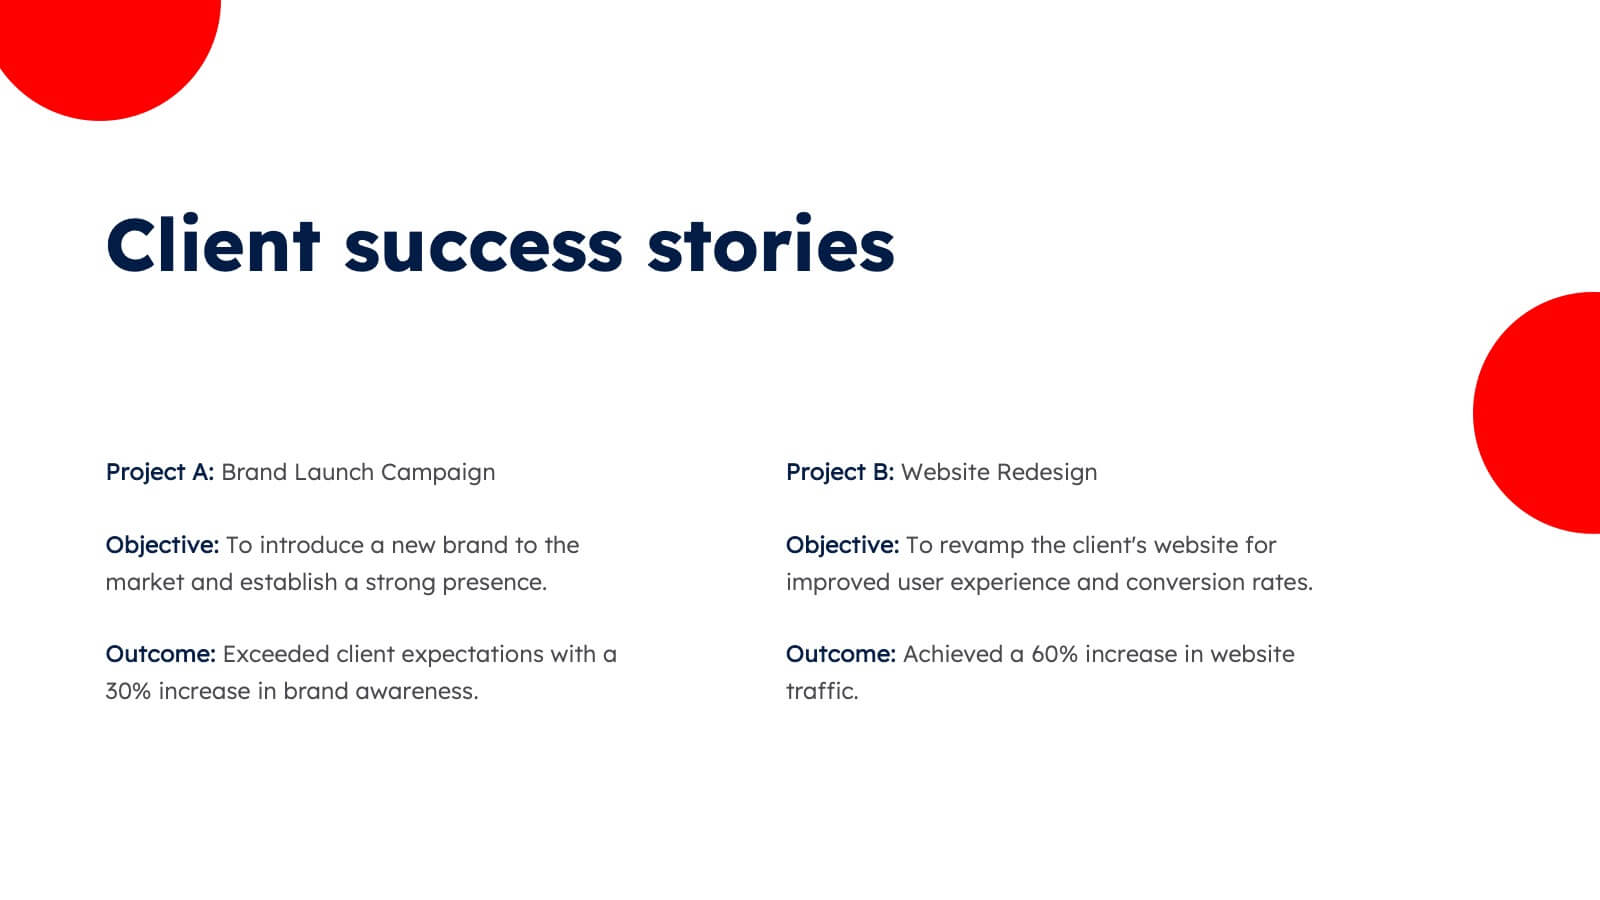
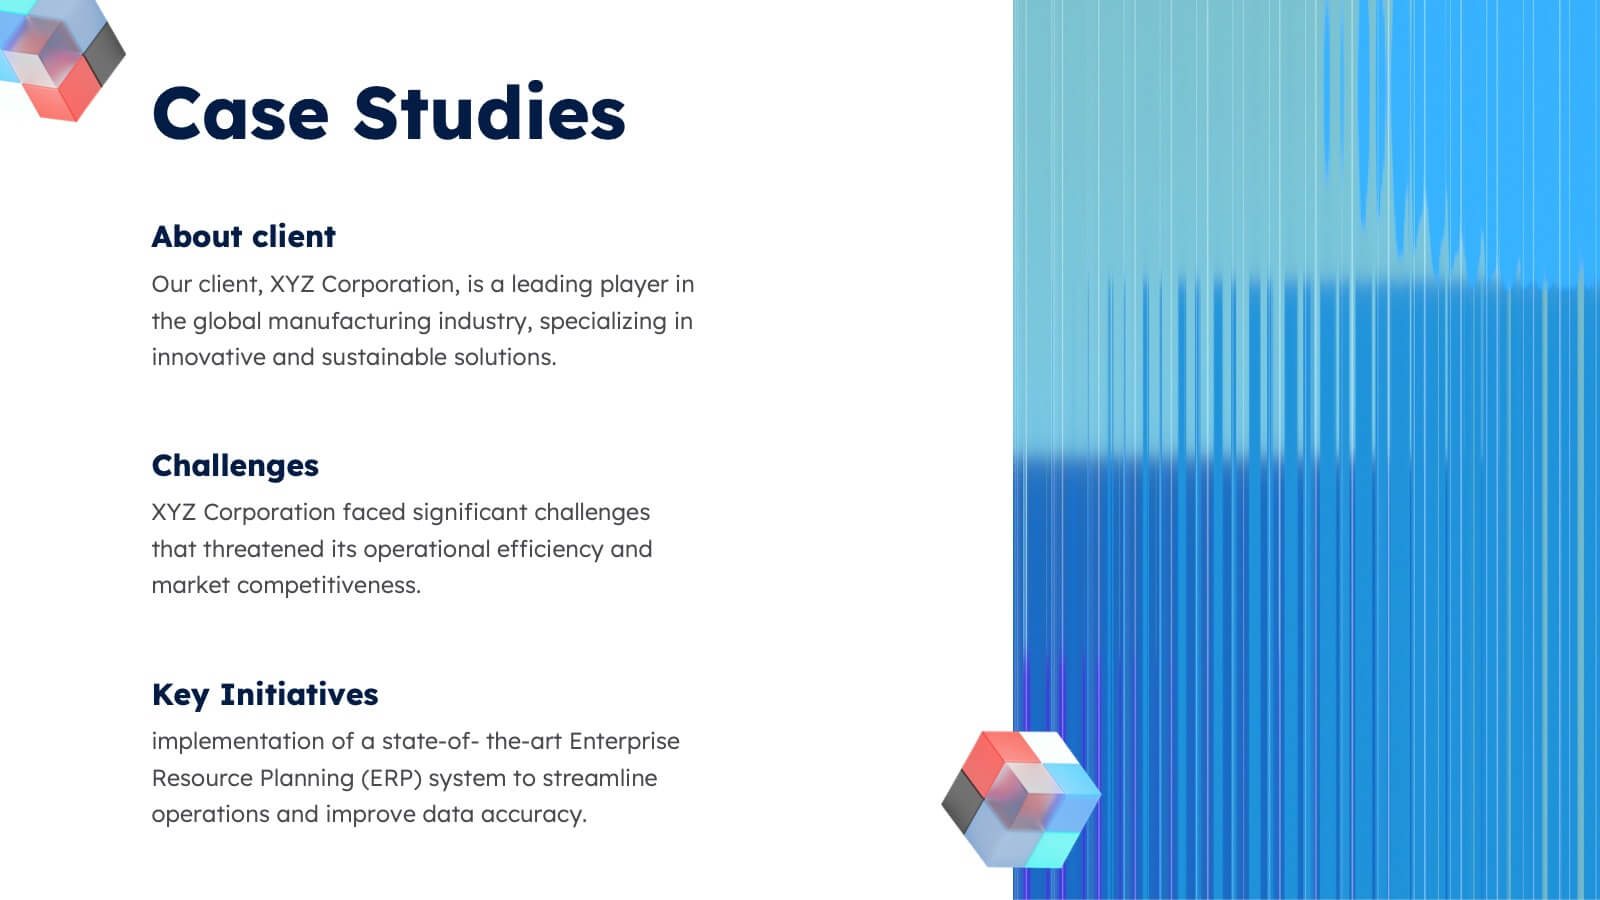
Thistlewisp Advertising Agency Proposal Presentation
Win clients and showcase your agency’s capabilities with this sleek and comprehensive proposal presentation! It highlights essential sections like mission and vision, client success stories, case studies, market trends, and creative processes to create a compelling pitch. Ideal for client presentations, this template is fully compatible with PowerPoint, Keynote, and Google Slides.


4 slides
Budget Projection with Predictive Analysis Presentation
Visualize future financial outcomes with clarity using the Budget Projection with Predictive Analysis Presentation. This modern funnel-style layout helps break down key stages of budget forecasting, making it easy to communicate progressions and data-driven insights. Perfect for financial planning, reporting, or strategic reviews. Fully editable in PowerPoint, Google Slides, Keynote, and Canva.


5 slides
Product Development to Decline Model Presentation
Showcase the full journey of a product from its inception to phase-out with the Product Development to Decline Model presentation. This circular diagram clearly outlines the four core stages, ideal for product managers, business analysts, and strategic planners. Each section features clean icons and editable text zones to highlight key insights and milestones. Fully customizable in PowerPoint, Keynote, and Google Slides.