


Features
- 22 Unique Slides
- Fully editable and easy to edit in Microsoft Powerpoint, Keynote and Google Slides
- 16:9 widescreen layout
- Clean and professional designs
- Export to JPG, PDF or send by email


Do you have any questions?
Recommend

21 slides
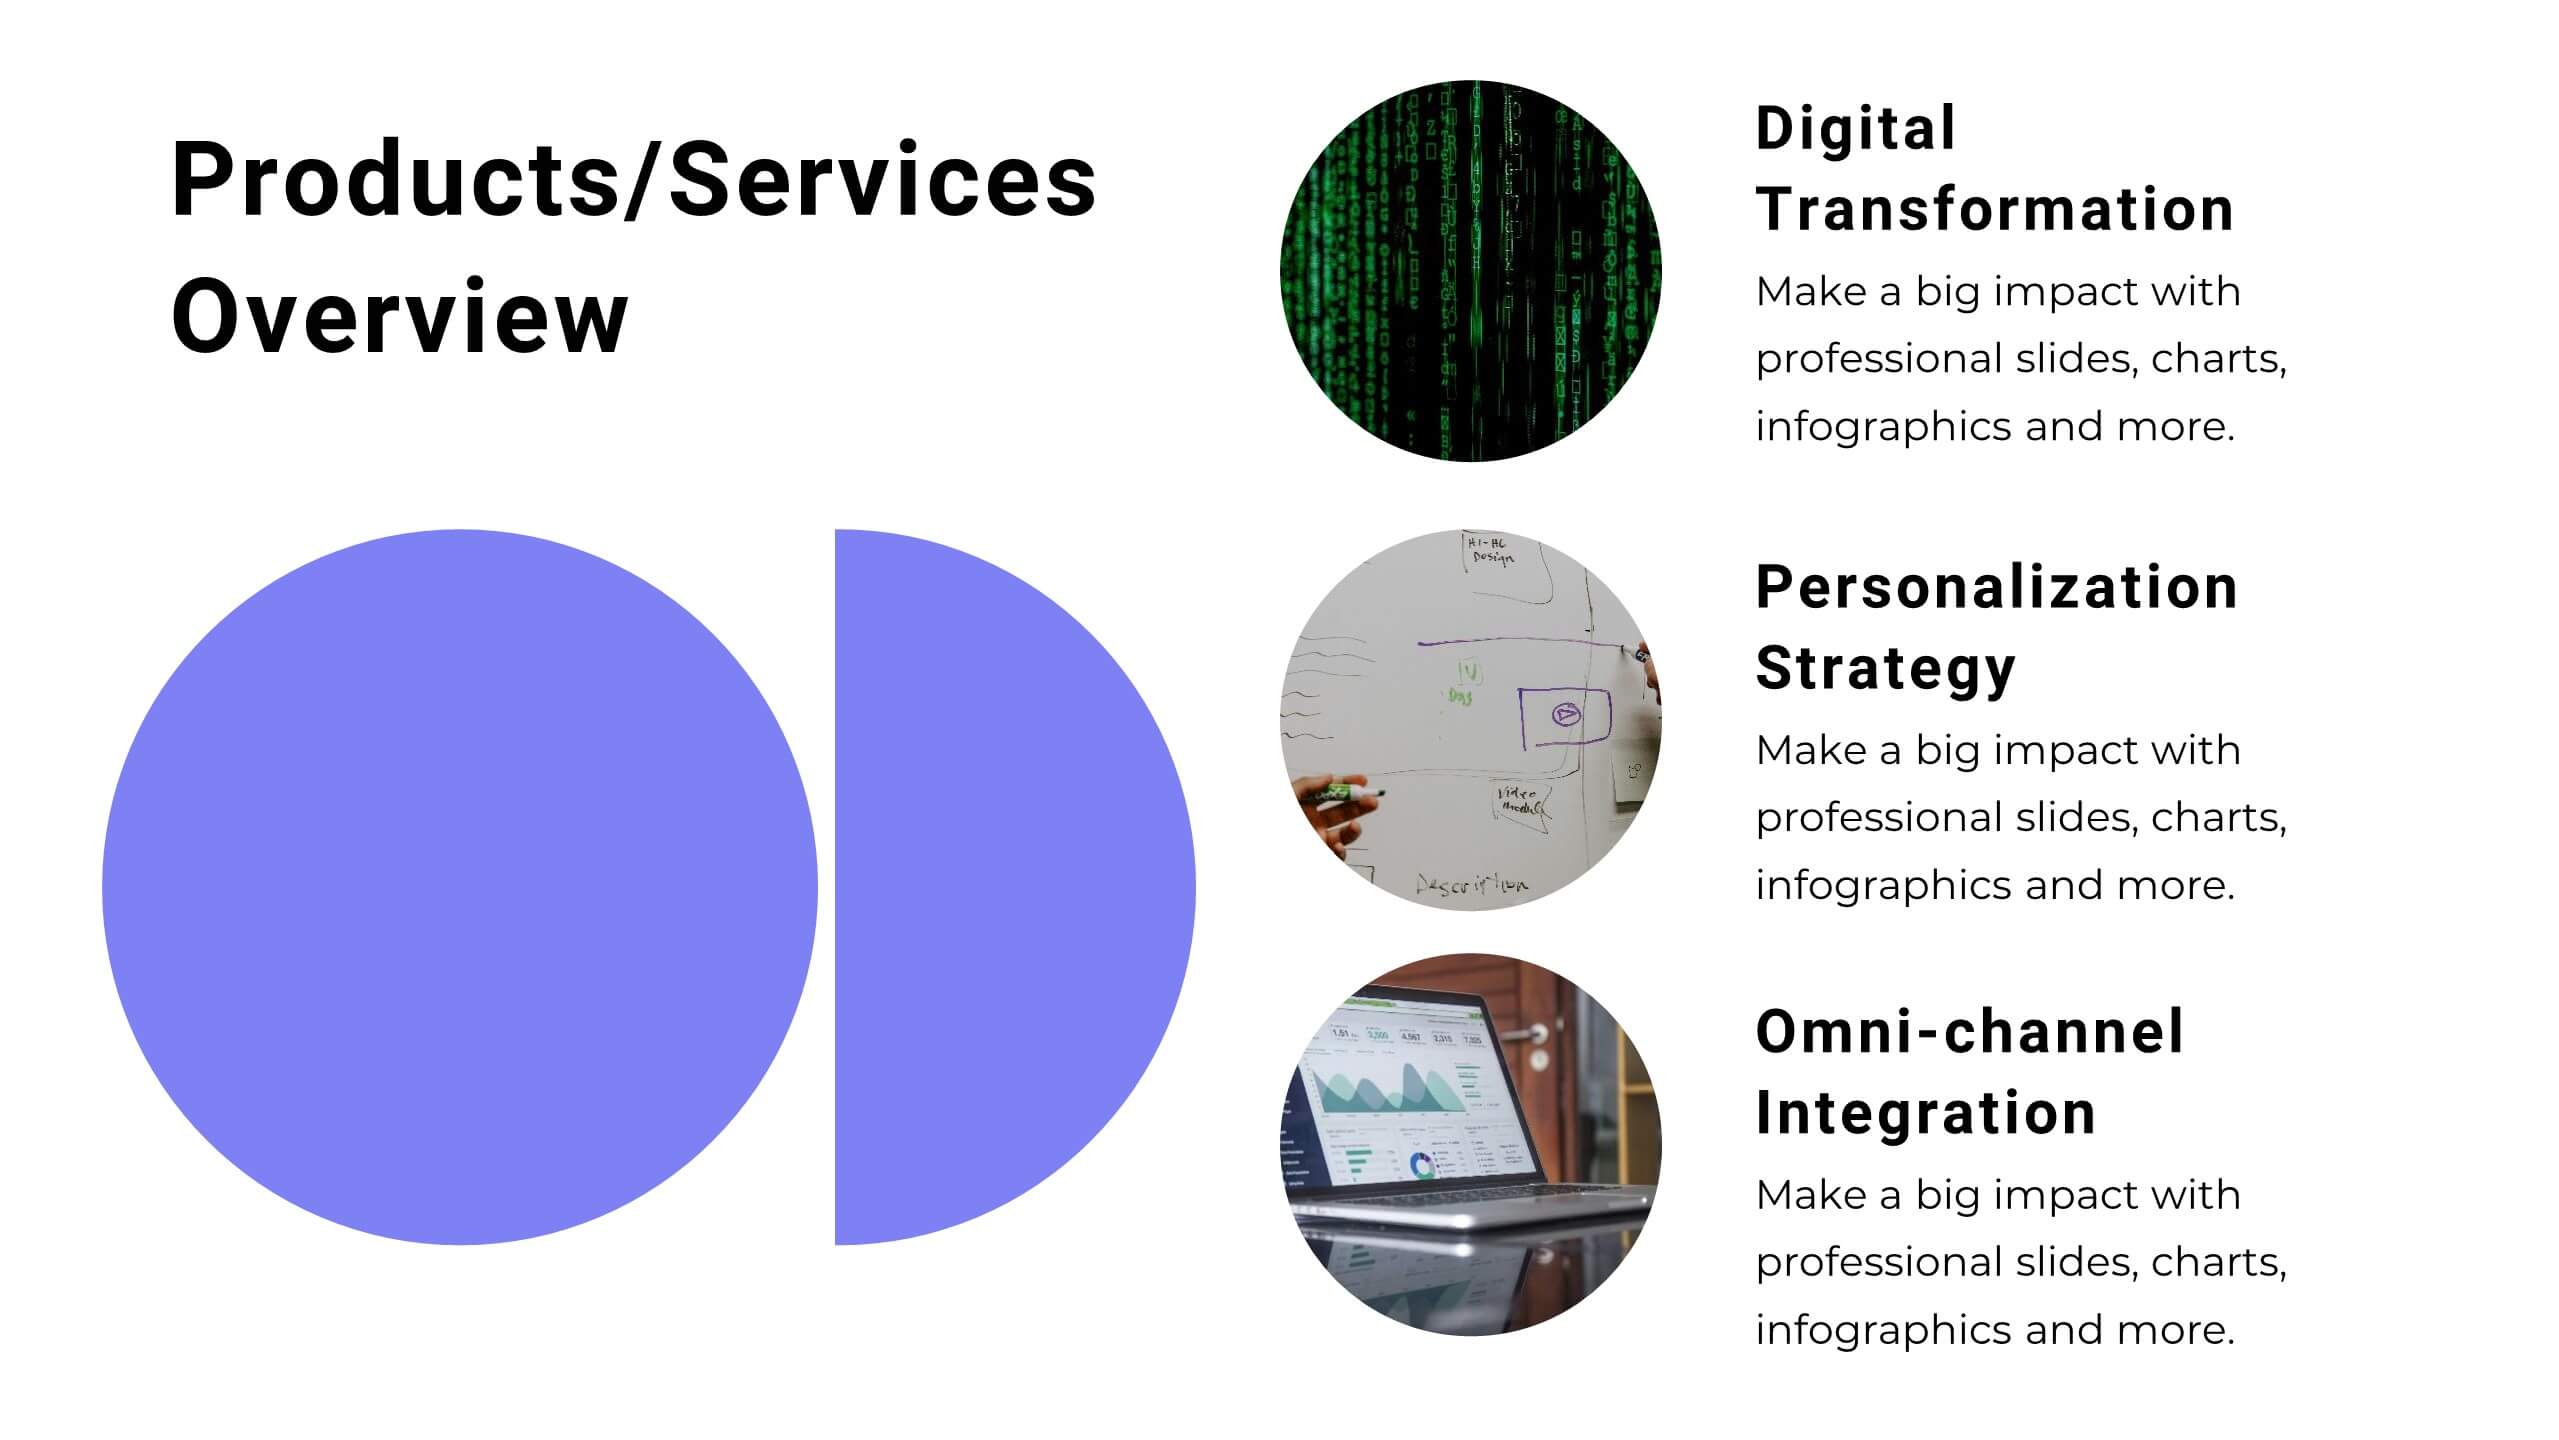
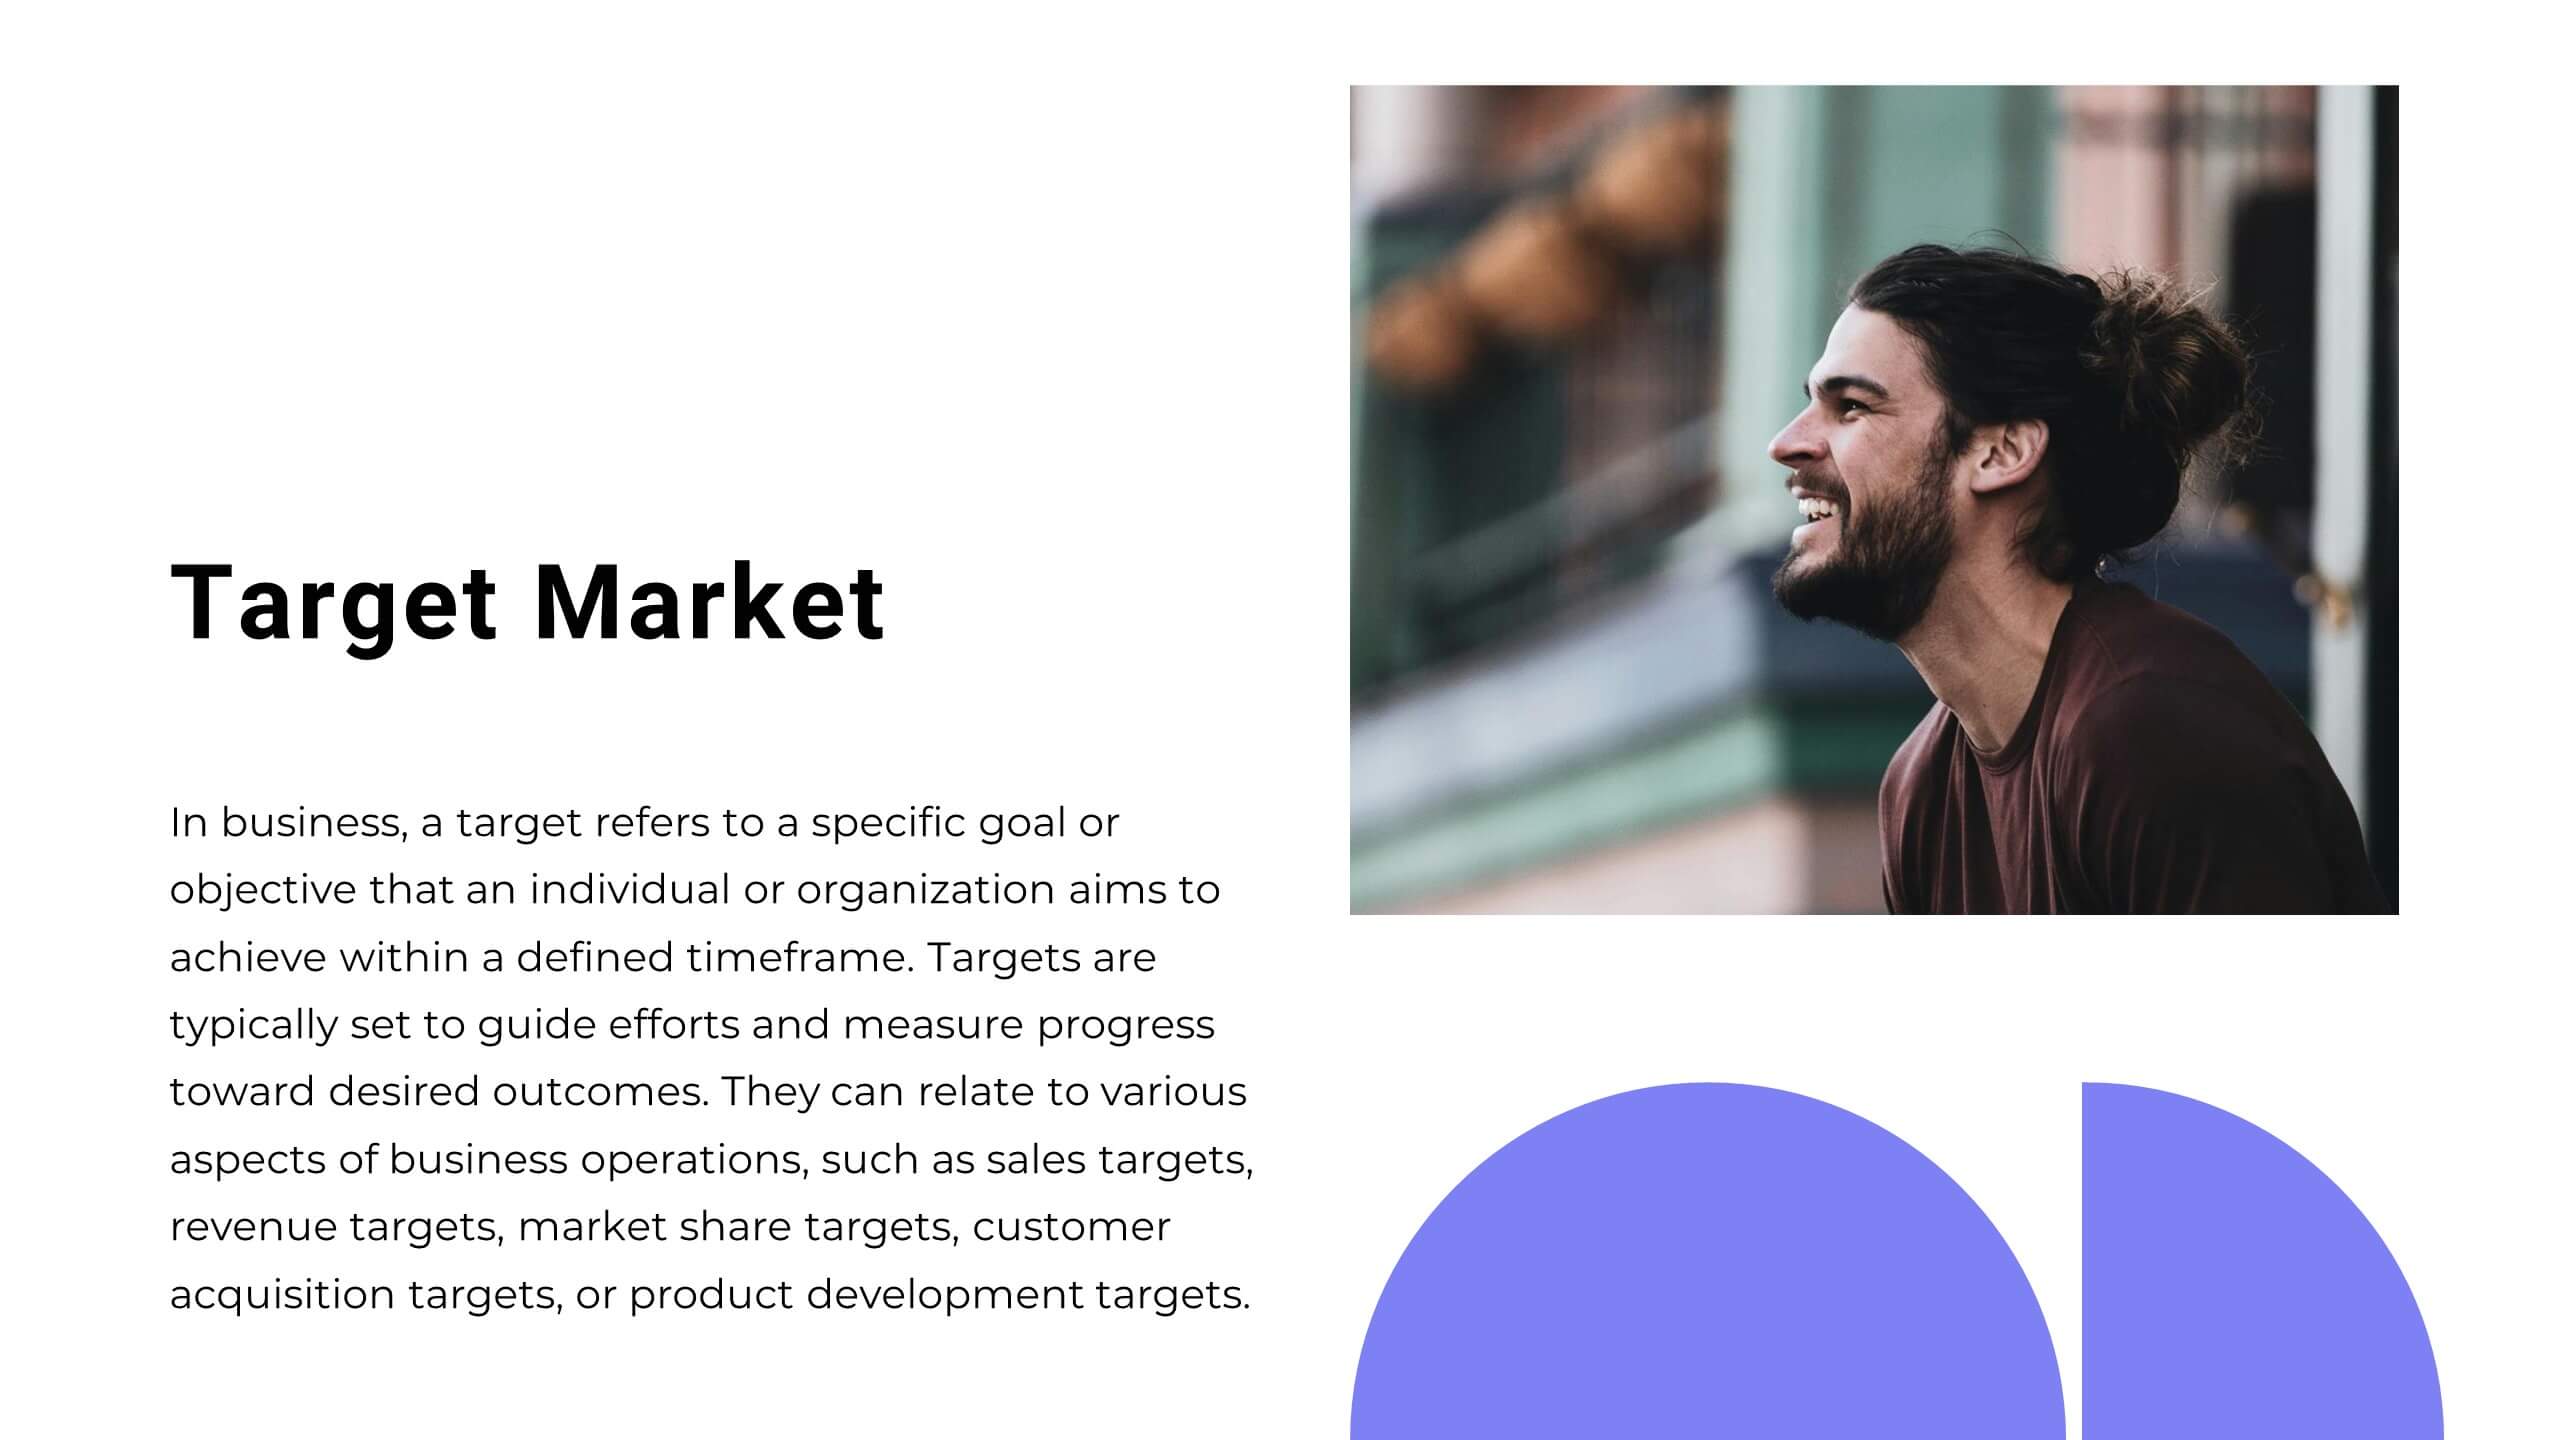
Vibrant Startup Pitch Deck Presentation
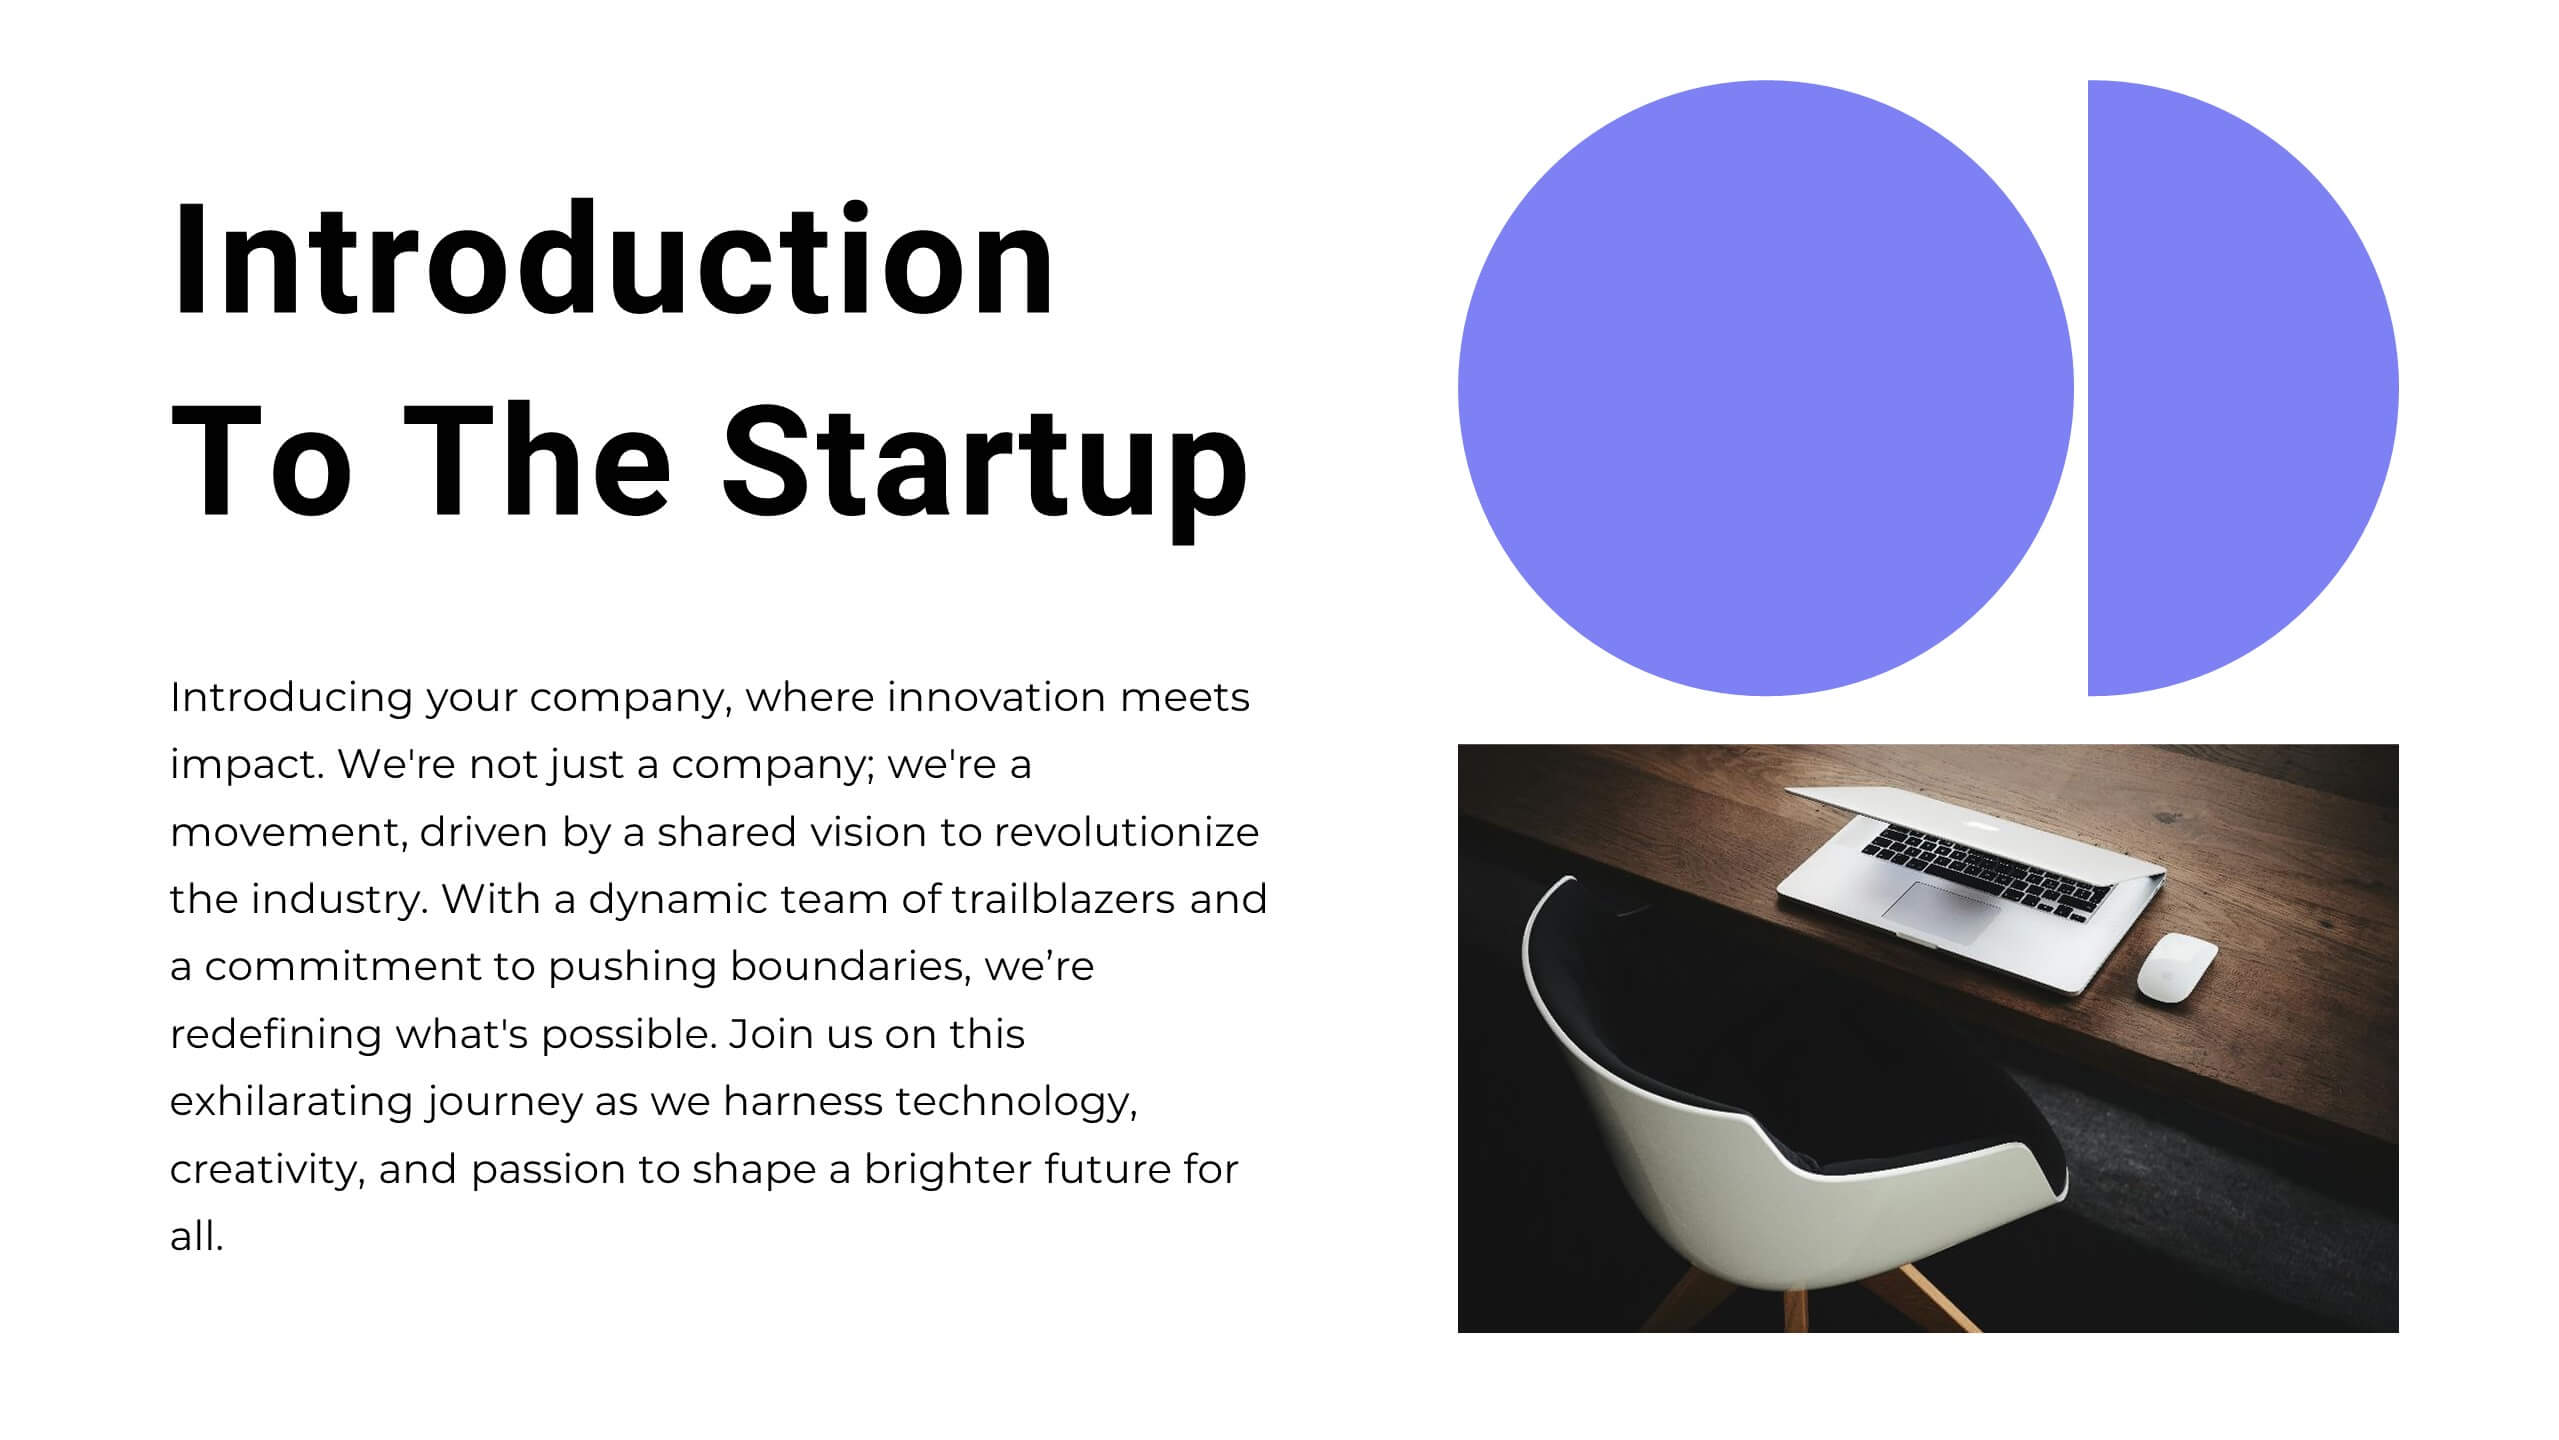
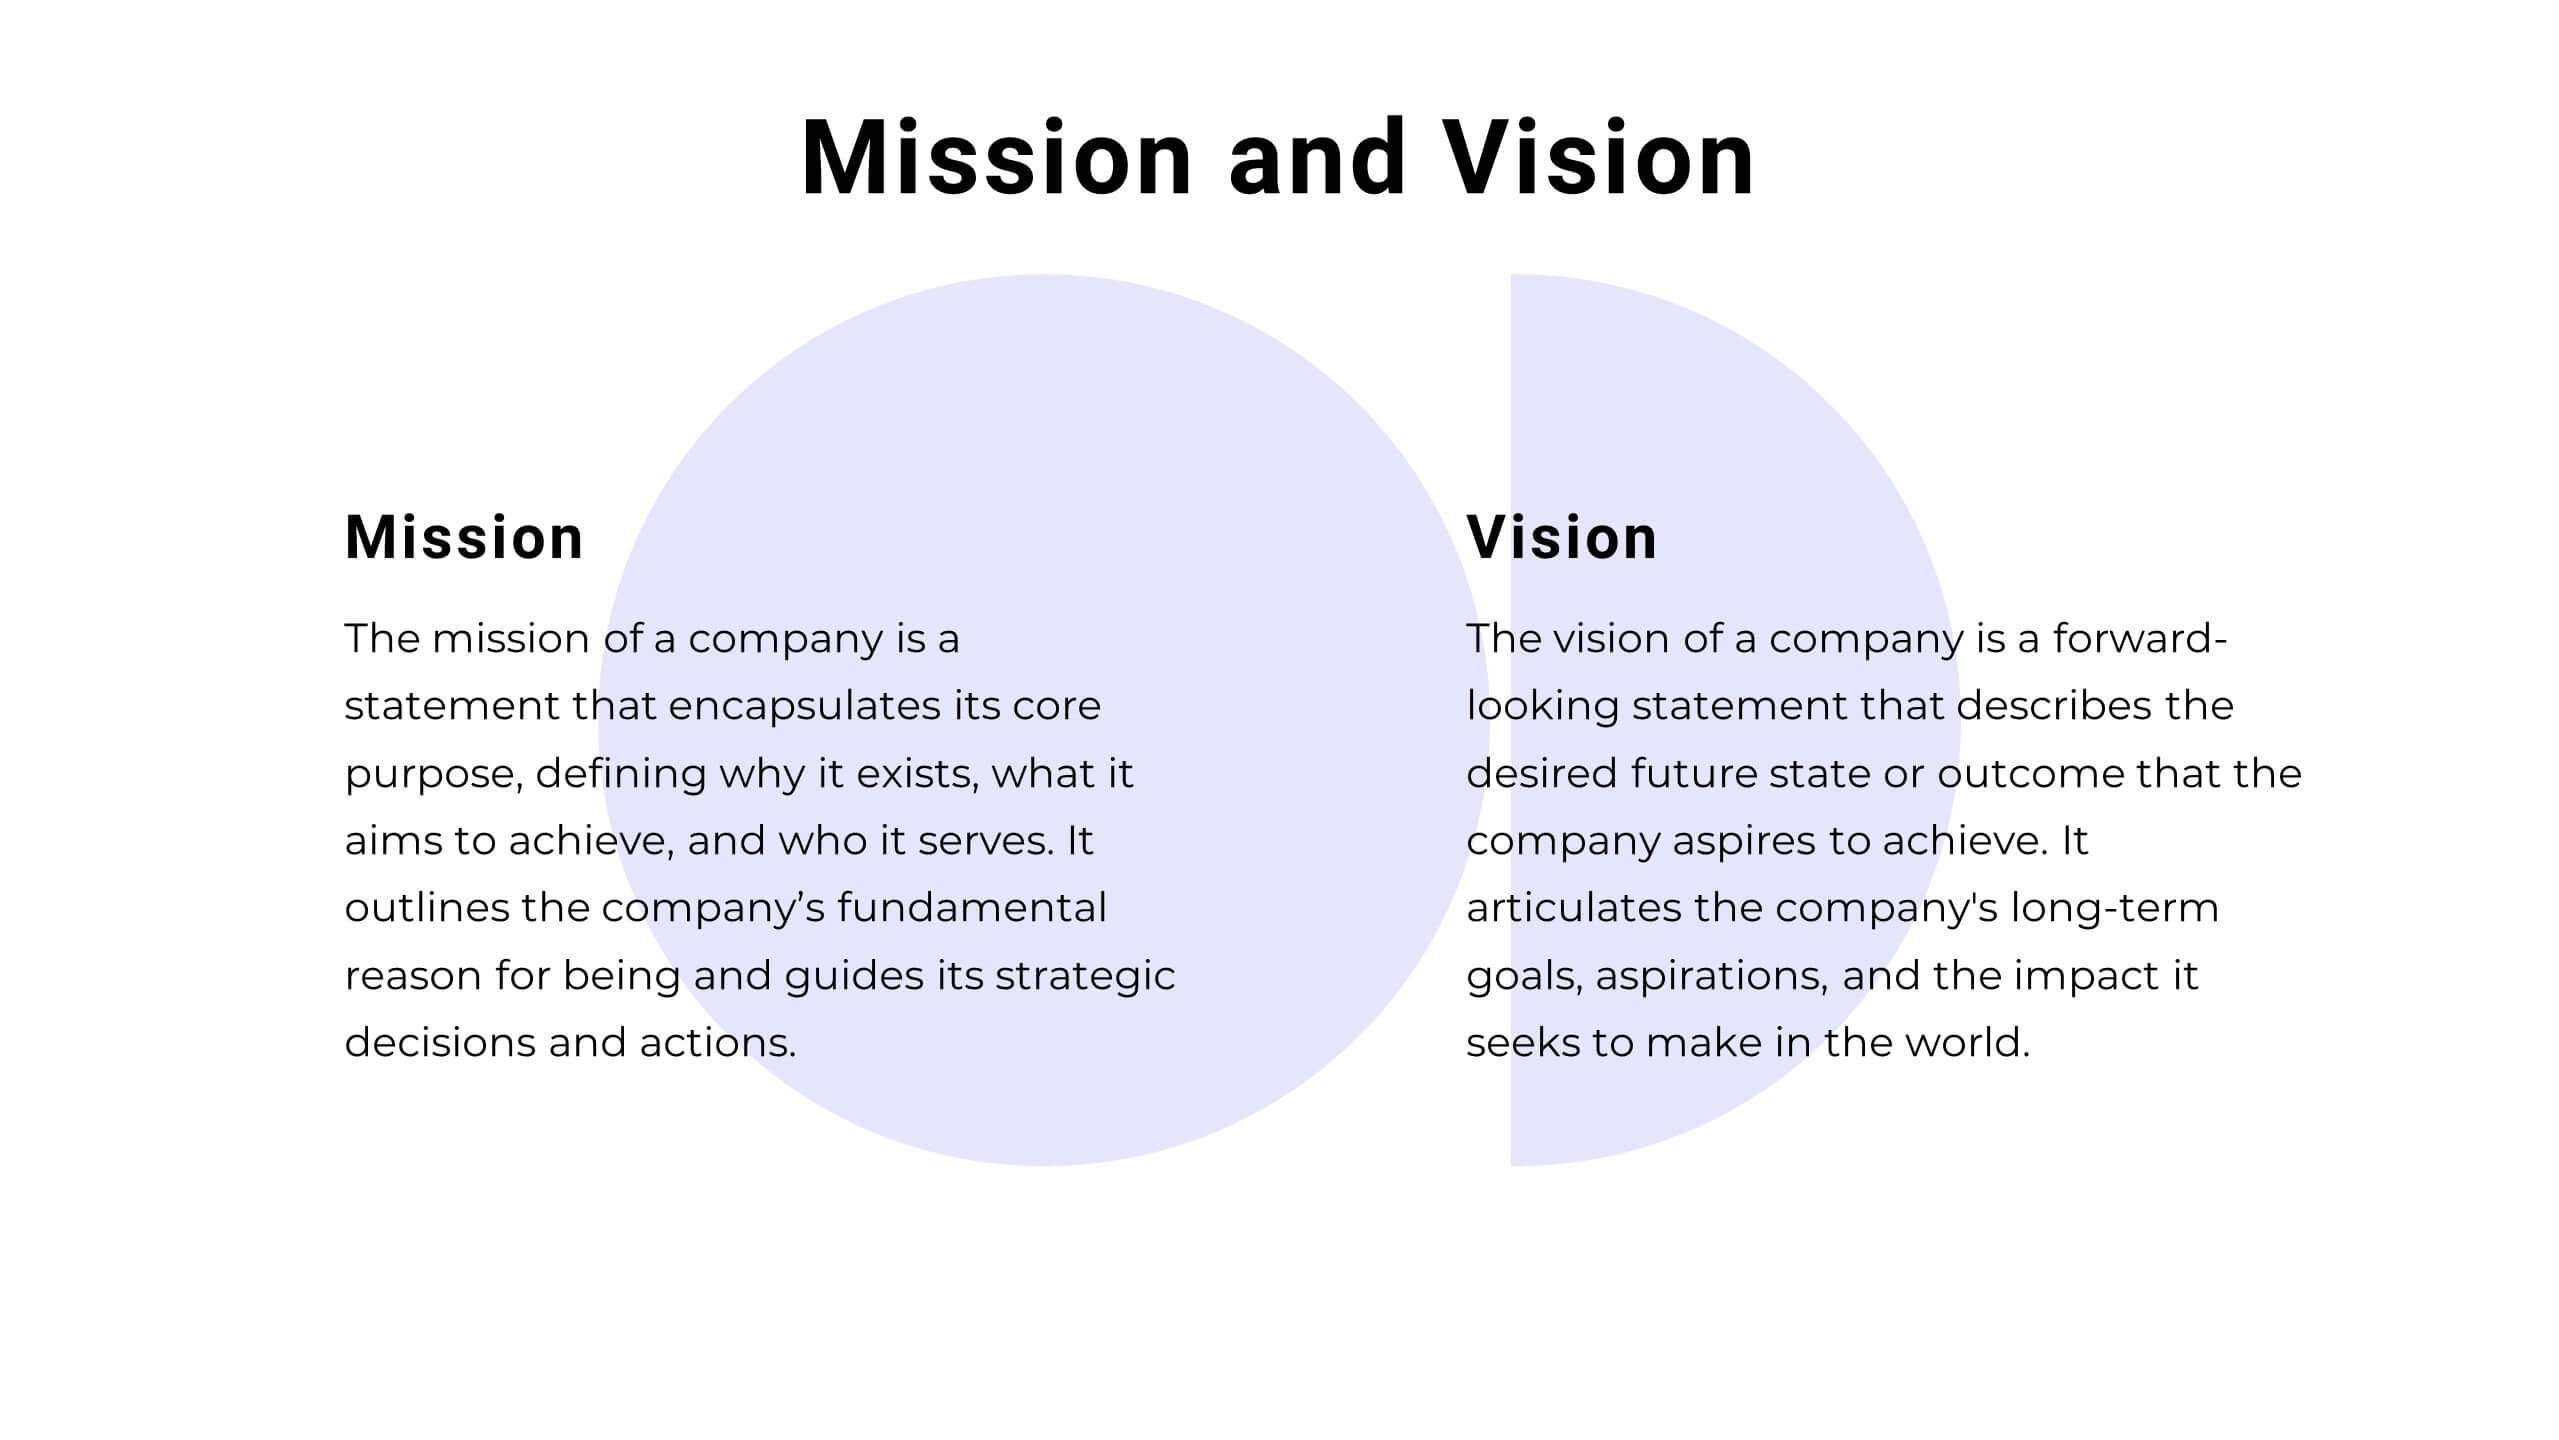
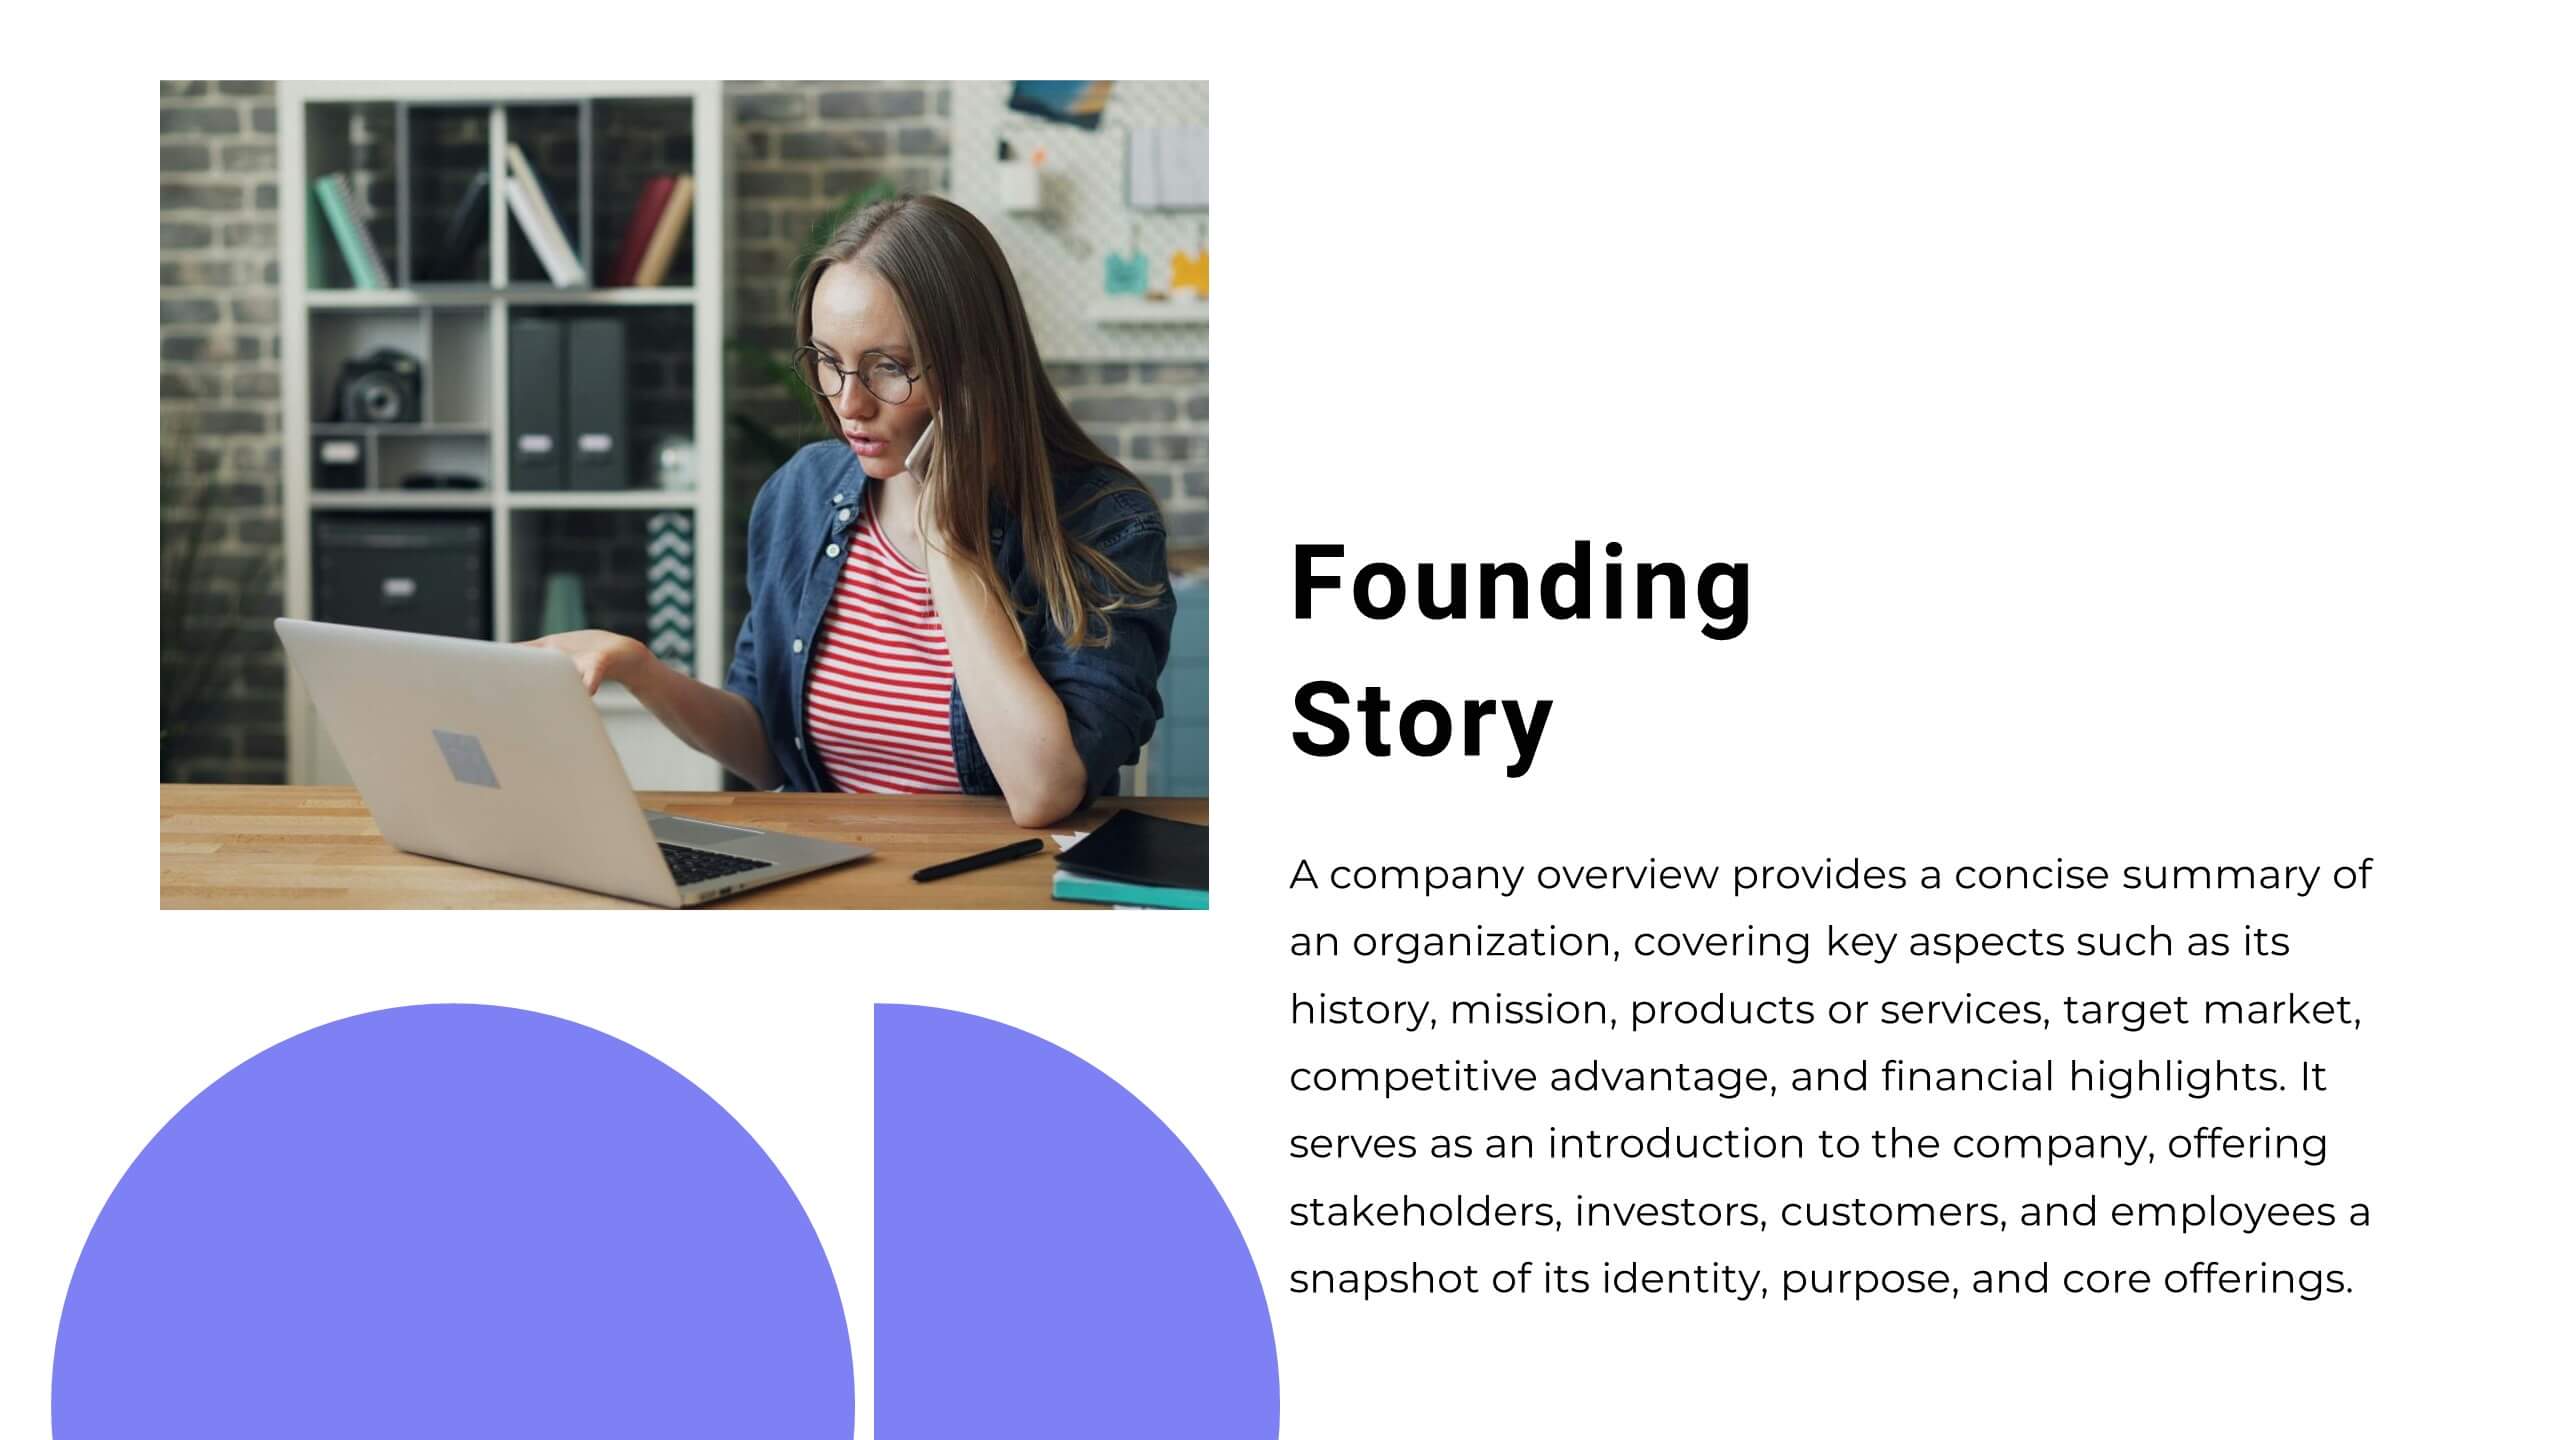
This dynamic and modern Startup Pitch Deck template is perfect for showcasing your startup's vision, strategy, and growth potential. Featuring a sleek design with bold visuals, this template guides you through key sections such as mission and vision, product/service overview, target market, and financial projections. It’s tailored to help you tell a compelling story that resonates with investors and stakeholders. The template is fully customizable in PowerPoint, Keynote, or Google Slides, ensuring you can adapt it to your specific needs and create a memorable presentation that leaves a lasting impression.


6 slides
Alphabet Infographic and Typography Layout Presentation
Showcase key information with visual flair using this Alphabet Infographic and Typography Layout. The bold letter "A" is constructed from geometric shapes, each linked to editable text areas—ideal for presenting 6 grouped ideas or segmented data. Fully compatible with PowerPoint, Canva, and Google Slides. Perfect for modern, clean presentations.


21 slides
Duskflare Corporate Strategy Proposal Presentation
Present your corporate strategy effectively with this comprehensive template, featuring sections on market trends, SWOT analysis, strategic initiatives, and risk management. Designed for clarity and impact, it’s ideal for outlining high-level goals and action plans. Compatible with PowerPoint, Keynote, and Google Slides for seamless presentations.


20 slides
Fenrir Investor Pitch Presentation
Deliver a compelling and persuasive pitch with this sleek and professional investor pitch deck! It covers essential sections like problem and solution, market opportunity, business model, financials, and growth strategy to ensure your vision is clearly communicated. Ideal for startup fundraising or business presentations, this template is fully compatible with PowerPoint, Keynote, and Google Slides.


5 slides
4 Steps Travel Itinerary Slide Presentation
Plan every adventure with a slide that makes travel feel effortless and exciting. This presentation helps you map out destinations, activities, and budgets in four clear, intuitive steps—perfect for trip planning or presenting itinerary options. Designed for smooth customization and fully compatible with PowerPoint, Keynote, and Google Slides.


5 slides
Lean Startup Business Presentation
A fresh, energetic layout brings your ideas to life, making it easy to present streamlined processes and early-stage strategies with clarity. This presentation highlights key steps, insights, and goals in a clean, modern flow designed for fast-moving teams. Fully compatible with PowerPoint, Keynote, and Google Slides.


22 slides
Event Agenda Presentation
Organize your event with precision using this Event Agenda presentation template. Designed for clarity and impact, it includes slides for conference overviews, speaker introductions, session descriptions, and networking opportunities. Perfect for business conferences or workshops, this template is compatible with PowerPoint, Keynote, and Google Slides, ensuring your event runs smoothly and professionally.


10 slides
Startup Pitch Deck Presentation
Make your big idea impossible to ignore with a sleek, investor-ready design that tells your startup’s story with clarity and confidence. This presentation helps you outline your vision, market potential, and business strategy in a compelling way. Fully compatible with PowerPoint, Keynote, and Google Slides for effortless customization.


26 slides
Luxury Hotel Professional Company Profile Presentation
Step into the opulent embrace of luxury hospitality, where every detail whispers elegance and exclusivity. Cast in a sophisticated palette of rich brown and pristine white, our template exudes the bold allure of luxe. Adorned with high-end graphics, elite icons, and evocative image placeholders, it's the embodiment of grandeur and comfort. Flawlessly tailored for Powerpoint, Keynote, or Google Slides. A prime choice for luxury hoteliers, event planners, hospitality consultants, or any brand aiming to showcase their exquisite offerings. Elevate your narrative; immerse your audience in the world of premium hospitality.


10 slides
Corporate Framework and Structure Presentation
Clearly define your corporate framework and structure with this professional infographic template. Ideal for executives, team leaders, and project managers, this slide visually organizes organizational hierarchy, roles, and key responsibilities in a clean and structured layout. Fully editable in PowerPoint, Keynote, and Google Slides, allowing seamless customization for your company's needs.


5 slides
North America Business Landscape Map Presentation
Explore the business terrain with the "North America Business Landscape Map" template, which delivers a comprehensive visualization of business data across various regions. Designed for strategic presentations, it enables clear communication of market insights and data points, crucial for decision-making. This template is compatible with PowerPoint, Keynote, and Google Slides, enhancing its utility for professionals in diverse fields.


26 slides
Jewelry Elegant Company Profile Presentation
Immerse yourself in the dazzling world of jewelry, where gems and craftsmanship create timeless elegance. Our template, exuding luxury in shades of brown and orange, embodies the modern elegance and aesthetic charm of fine jewelry. Enhanced with chic graphics, bespoke icons, and evocative image placeholders, it mirrors the allure of precious metals and stones. Seamlessly adapted for Powerpoint, Keynote, or Google Slides. A shimmering choice for jewelry brands, boutique owners, designers, or anyone seeking to showcase the sparkle and artistry of jewelry. Illuminate your brand; let each jewel tell its story.


10 slides
Adapting to Business Transformation Presentation
Guide your audience through change with this dynamic, step-by-step layout tailored for showcasing transformation journeys. The slide features a curved flow design with five customizable stages, perfect for visualizing digital shifts, organizational restructuring, or innovation roadmaps. Best for corporate strategists, consultants, and change managers. Fully editable in PowerPoint, Keynote, and Google Slides.


4 slides
EU Business Coverage Map Presentation
Highlight your European business presence with the EU Business Coverage Map Presentation. This slide layout uses pinpoint markers and color-coded regions to showcase operations, regional offices, or market coverage across Europe. Ideal for quarterly reports, sales updates, or investor briefings. Fully editable in PowerPoint, Keynote, Google Slides, and Canva.


5 slides
TAM SAM SOM Markets Analysis Presentation
Turn complex market insights into clear, visual storytelling with this dynamic layered presentation. Ideal for demonstrating market potential, target segments, and opportunity scope, it helps you communicate data with structure and impact. Fully compatible with PowerPoint, Keynote, and Google Slides for effortless editing and professional, presentation-ready results.


6 slides
Porter’s Value Chain Analysis Presentation
Give your strategy story a powerful lift with a clean visual layout that makes every activity in your organization feel connected and purposeful. This presentation explains primary and support processes in a way that helps teams identify strengths, gaps, and opportunities for improvement. Fully compatible with PowerPoint, Keynote, and Google Slides.


4 slides
Project Responsibility Assignment Matrix Presentation
Visualize team roles and task accountability at a glance with this Project Responsibility Assignment Matrix. This structured layout categorizes assignments using the RACI model—Responsible, Accountable, Consulted, and Informed—organized by team and position. Ideal for project managers, team leads, and operations planners, it helps ensure clarity, reduce overlap, and promote accountability across departments. Easily editable in PowerPoint, Keynote, and Google Slides for seamless customization and cross-platform use.