


Features
- 6 Unique slides
- Fully editable and easy to edit in Microsoft Powerpoint, Keynote and Google Slides
- 16:9 widescreen layout
- Clean and professional designs
- Export to JPG, PDF or send by email


Do you have any questions?
Recommend


5 slides
Cloud Security and Data Storage Presentation
Visually explain your cloud architecture and data protection strategy with this sleek horizontal diagram. Each layered icon represents different aspects of storage, access, and security control—perfect for IT audits, cloud infrastructure briefs, and risk management reports. Fully editable in PowerPoint, Keynote, and Google Slides.


6 slides
Agenda Network Infographic
Elevate your networking events with our sophisticated collection of agenda slide templates. These slides are crafted to structure and present the flow of activities at networking events, making them essential for coordinators who aim to foster professional connections among attendees. Each template is designed with clarity and style, featuring clean lines and modern graphics to outline key segments of your event, such as welcome remarks, networking sessions, panel discussions, and closing statements. The thoughtful layout includes designated spaces for time slots, session titles, and speaker details, ensuring that participants can easily follow the event's progression and plan their participation accordingly. These slides are fully customizable, allowing you to match the visual design with your event’s theme or corporate branding. The adaptable format makes it simple to insert or remove sections based on the specific needs of your event. Ideal for business conferences, industry meet-ups, or any professional gathering, these agenda slides help you manage and execute a seamless networking experience.


6 slides
Canvas Breakdown for Startup Strategy Presentation
Break down your startup strategy with this streamlined canvas layout. Designed for clarity and flow, this slide presents six core components in a visually engaging format. Ideal for early-stage founders, innovation teams, and pitch decks, it simplifies complex business models into clear, actionable sections for strategic alignment and storytelling.


5 slides
SEO Strategies Infographics
Immerse yourself in the dynamic world of digital marketing with our SEO strategies infographics. Rendered in bold black, vibrant orange, and various eye-catching colors, this creative and vertical template serves as a beacon for marketing professionals, digital strategists, and entrepreneurs who aim to conquer the digital space. Each element, from engaging graphics to interpretative icons, is specifically tailored to present SEO methodologies with clarity and charisma. This infographic template is not only a visual treat but a reservoir of insights, facilitating users to communicate influential SEO tactics effectively and drive their brand's online visibility forward.


20 slides
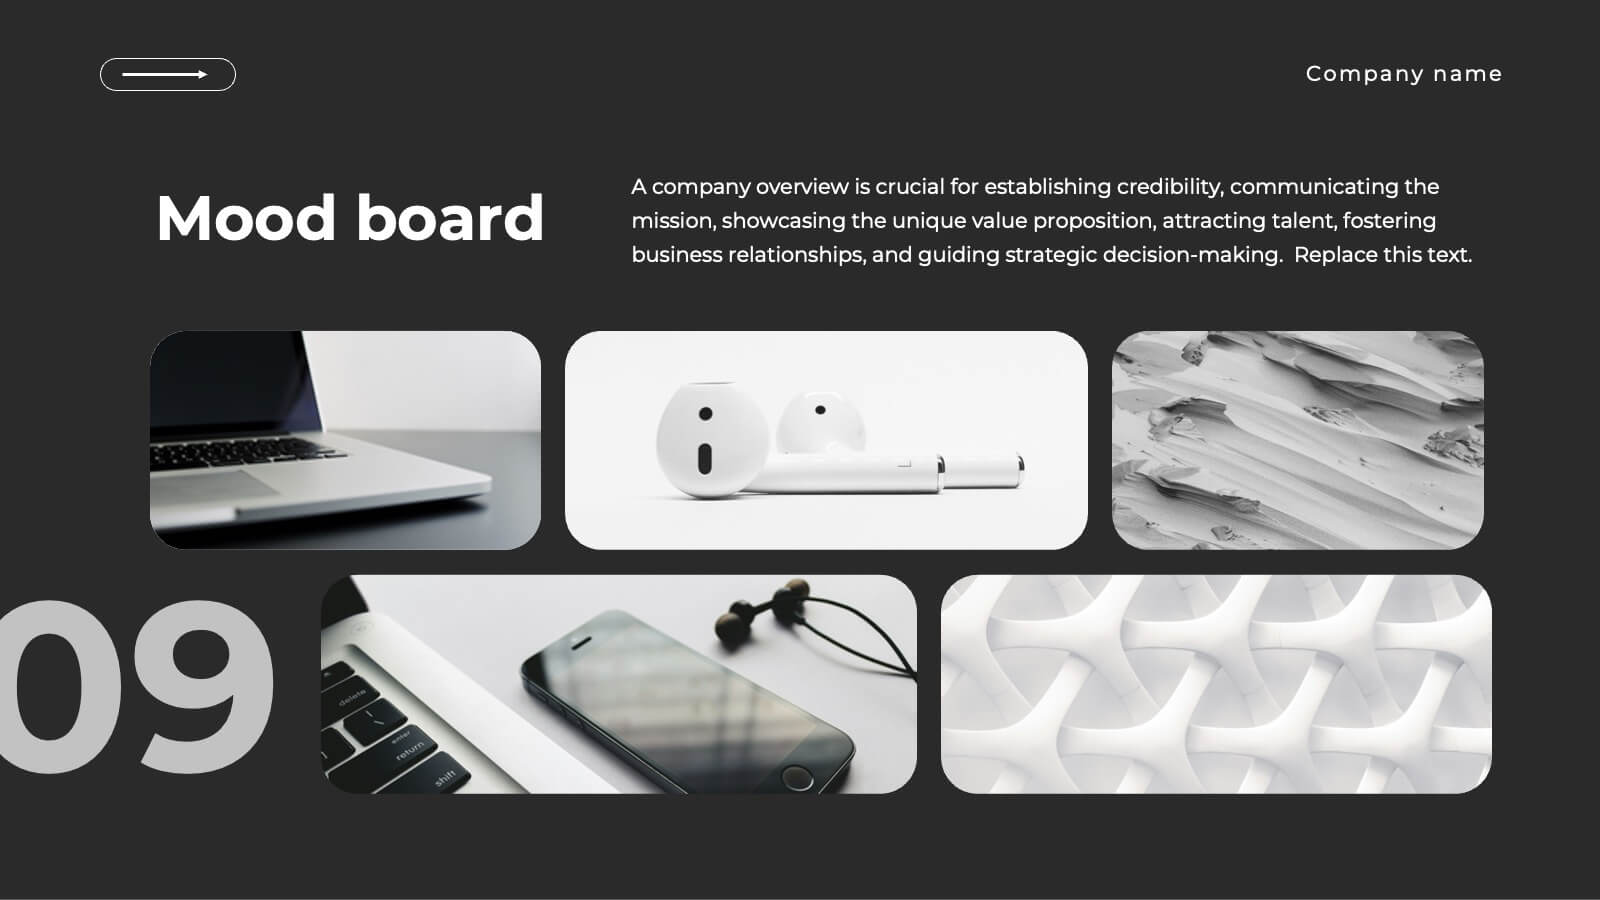
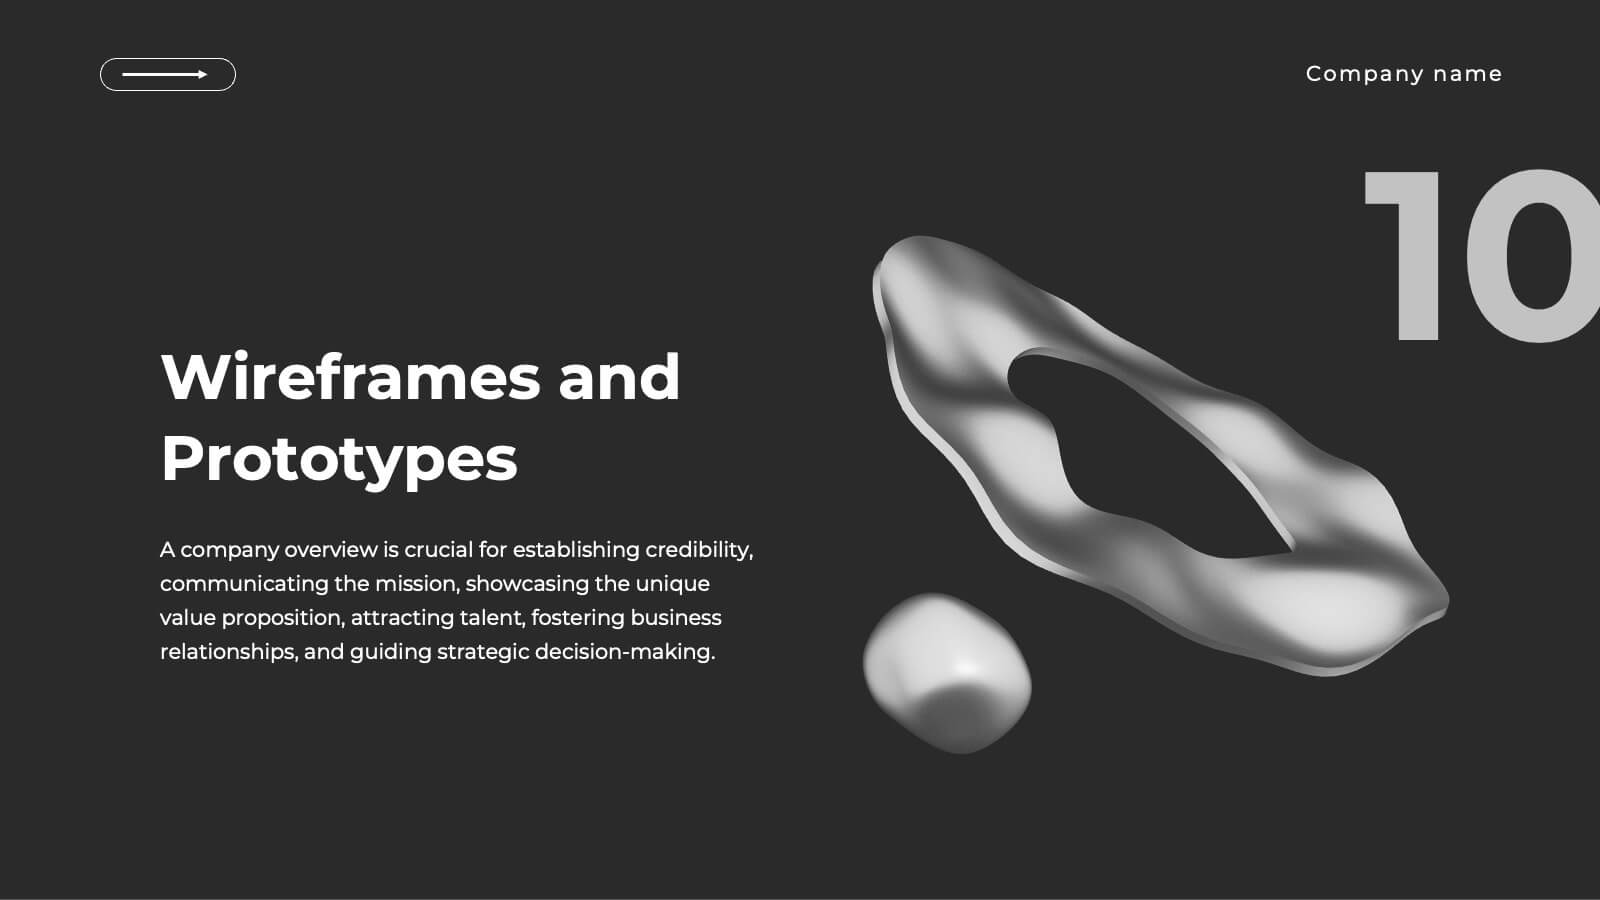
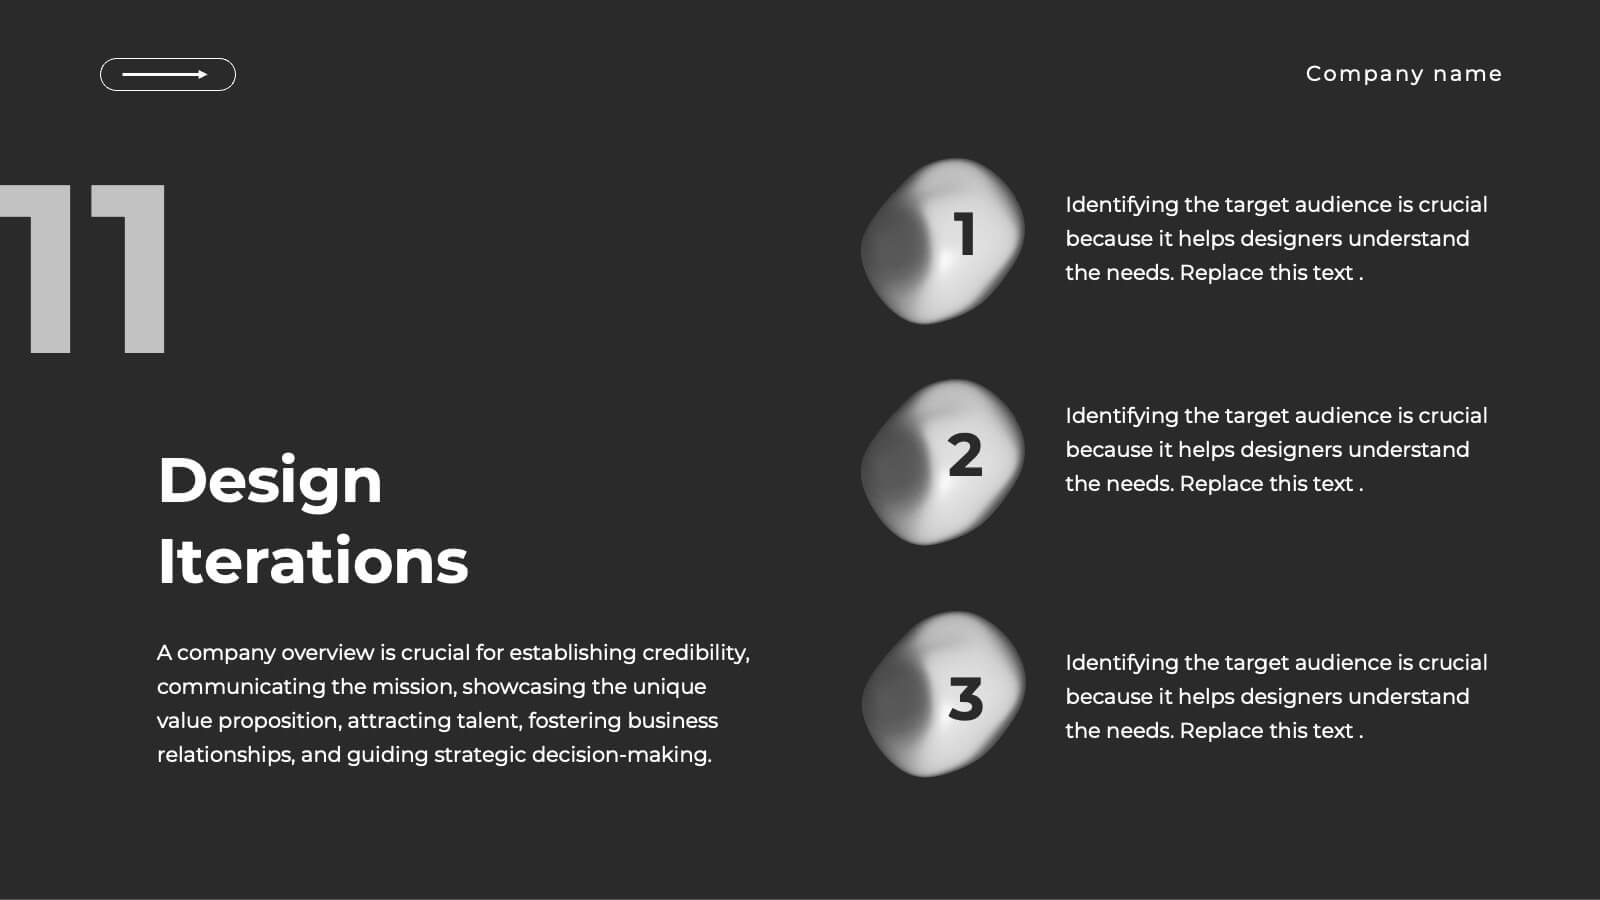
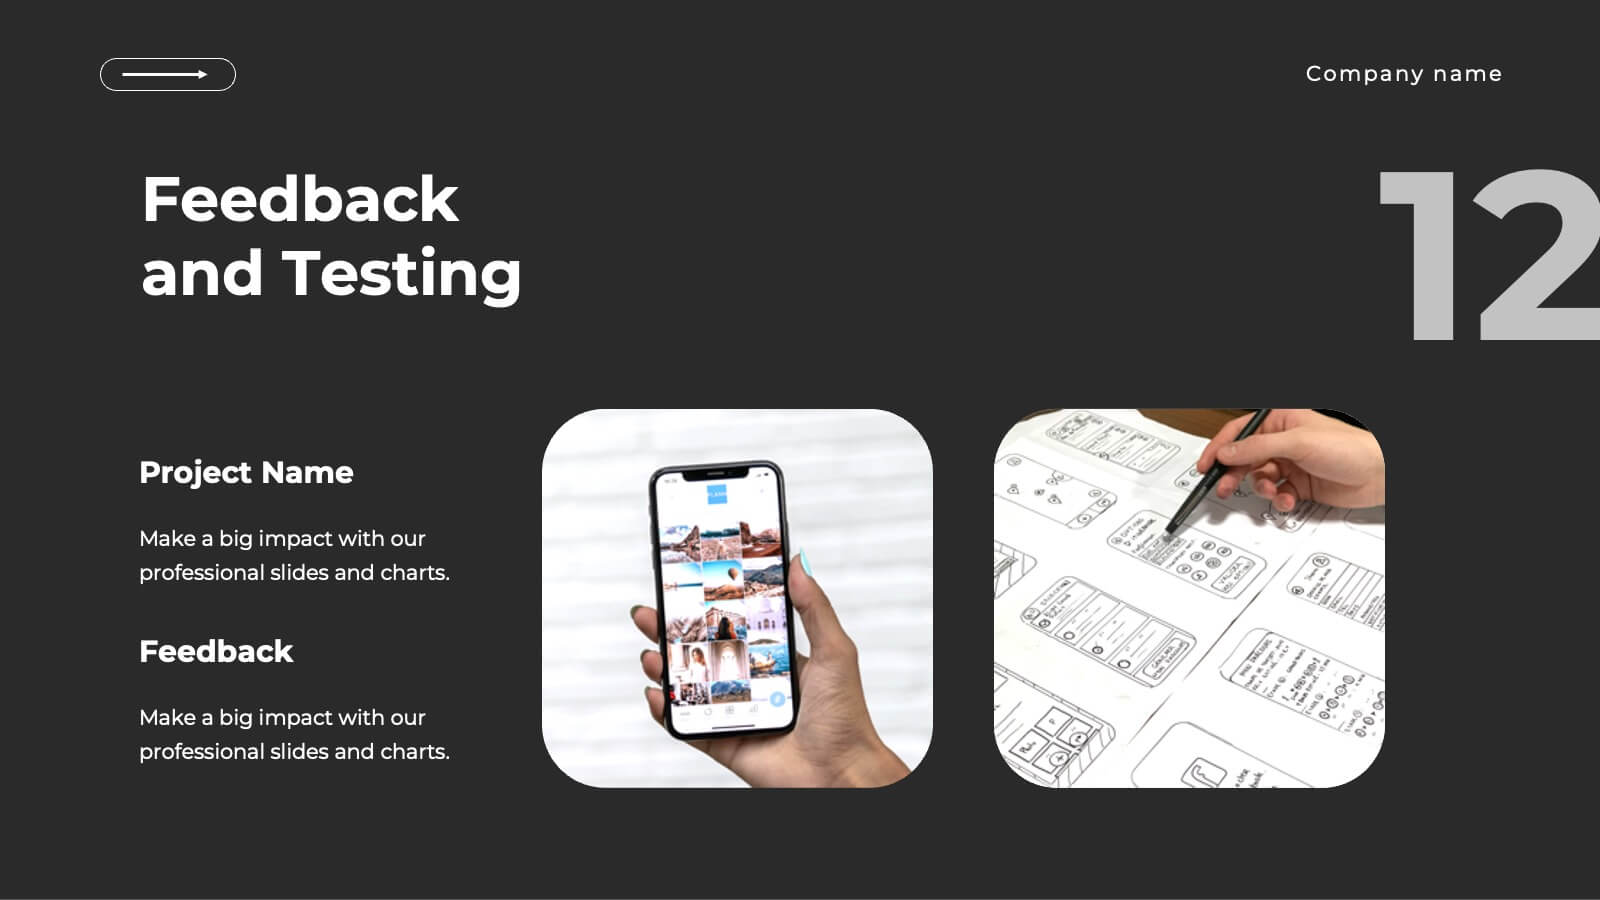
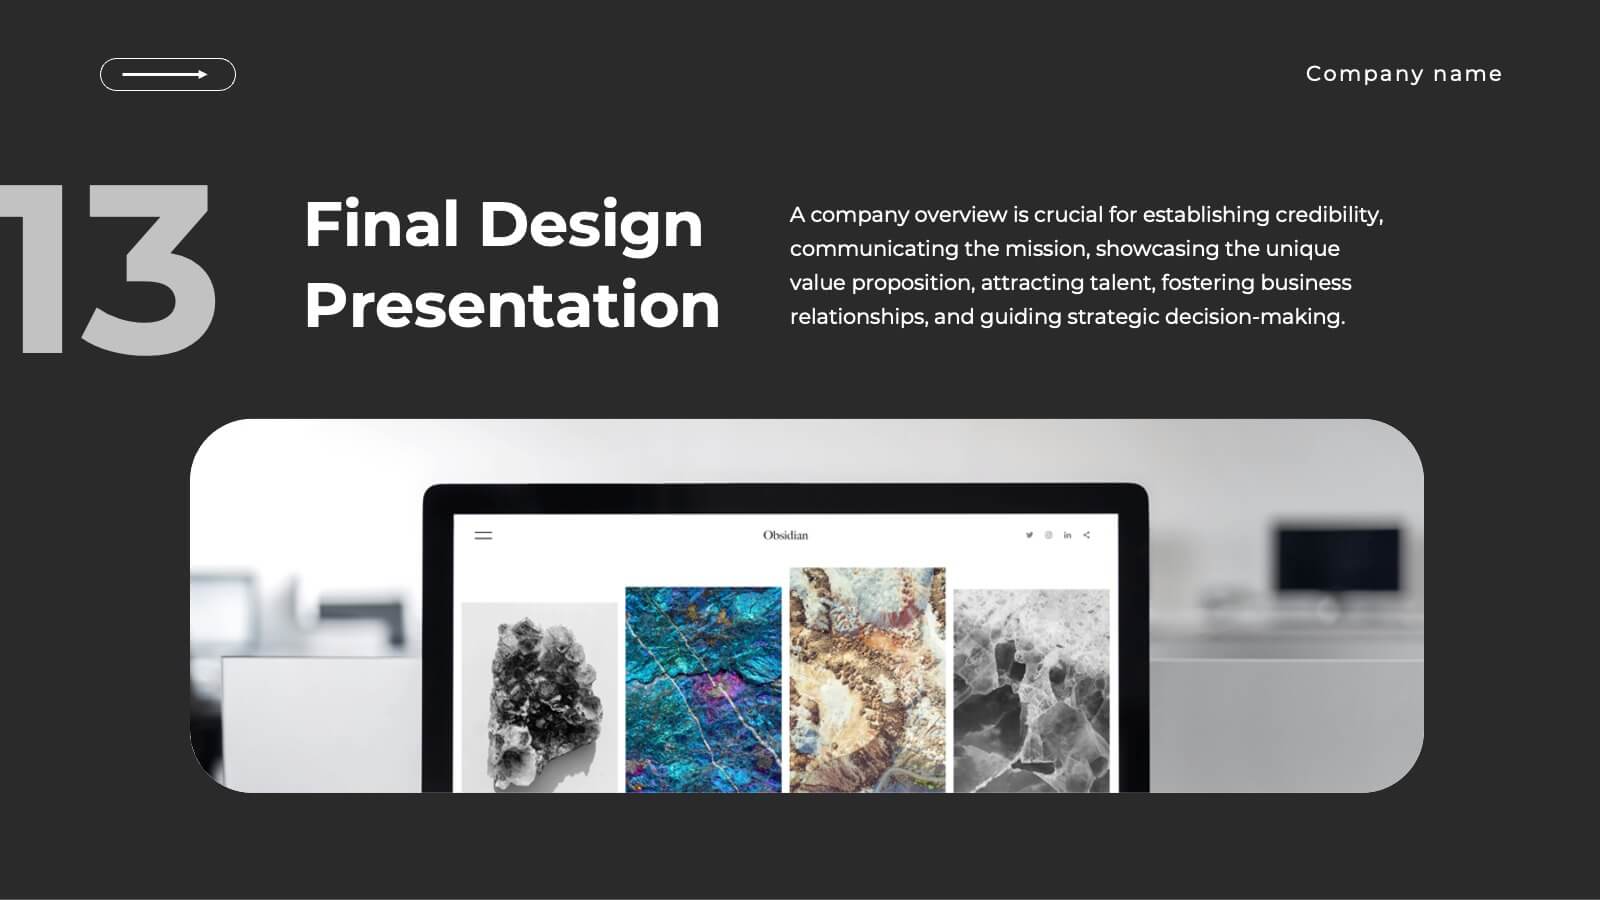
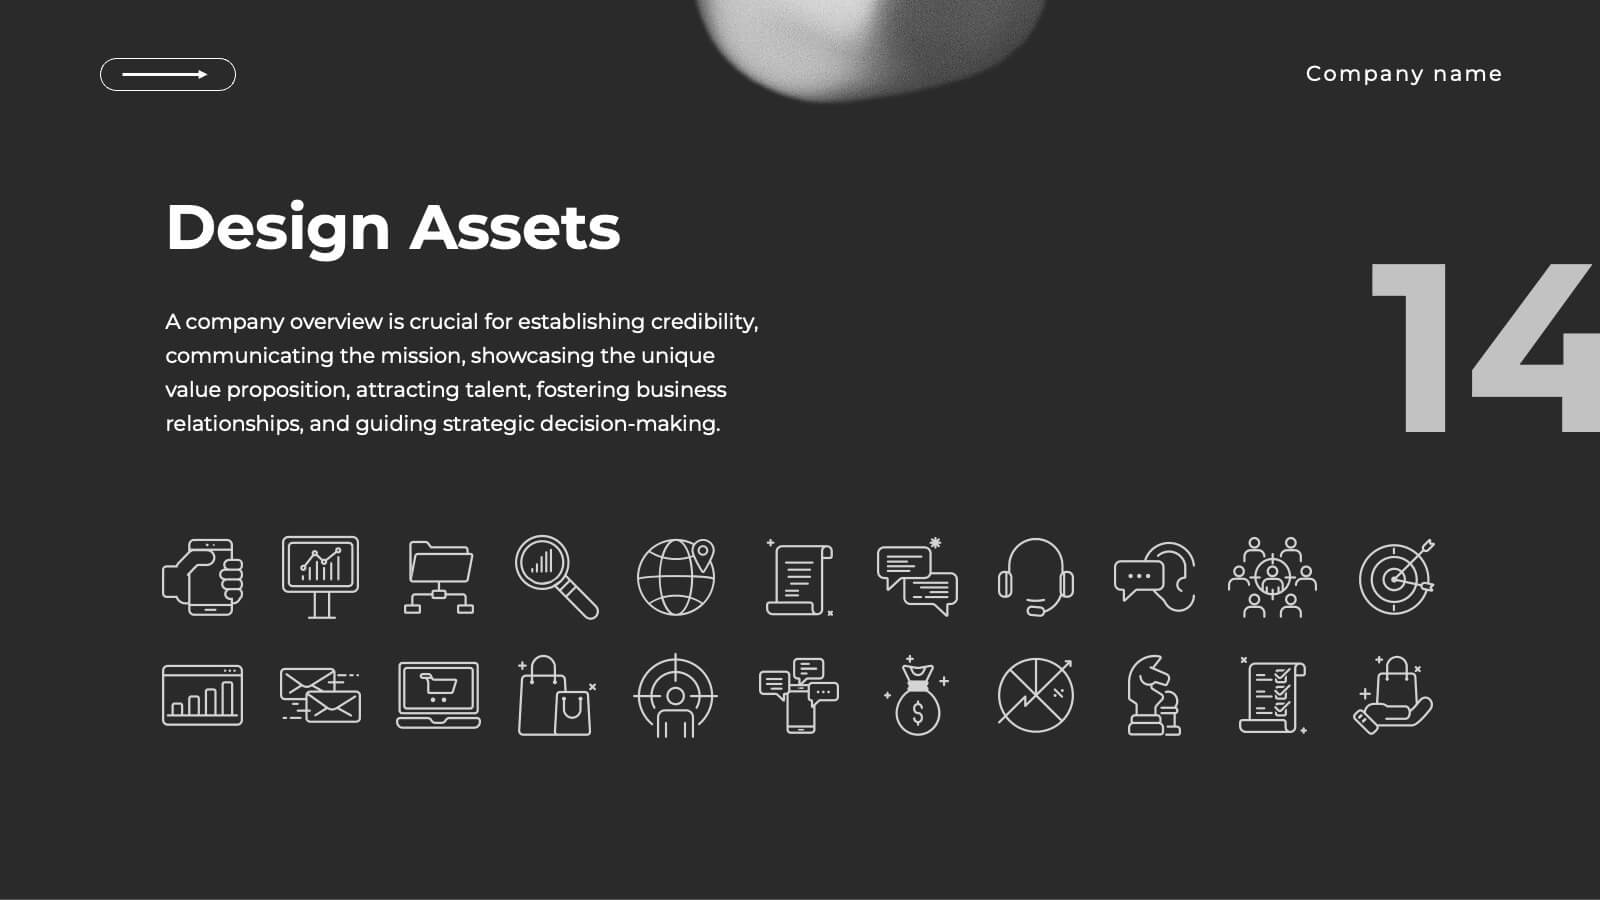
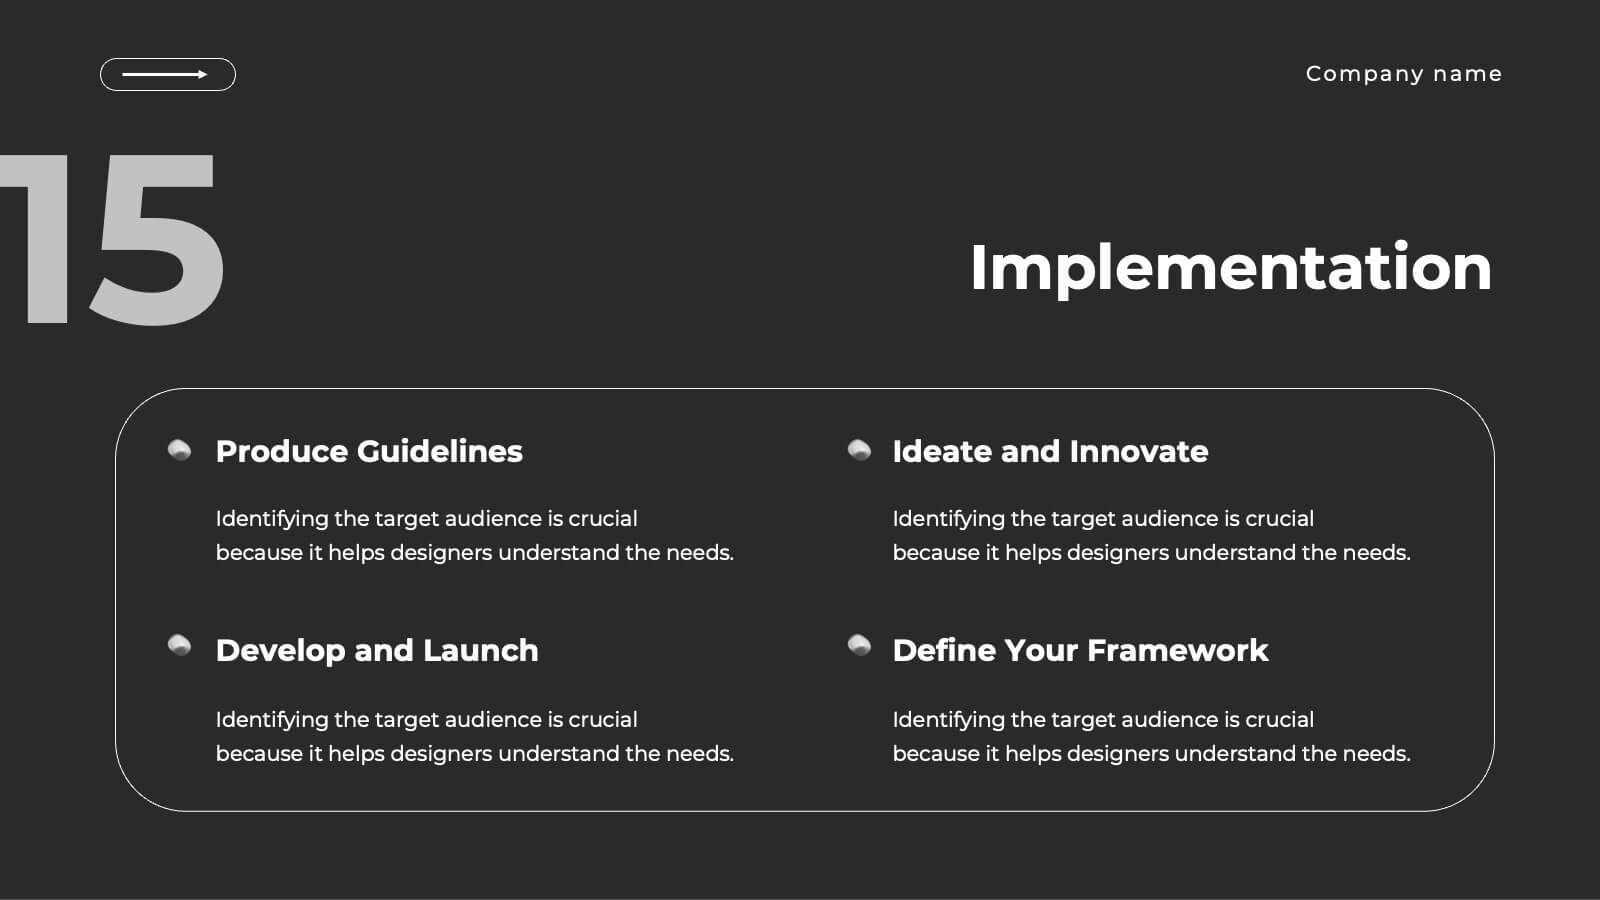
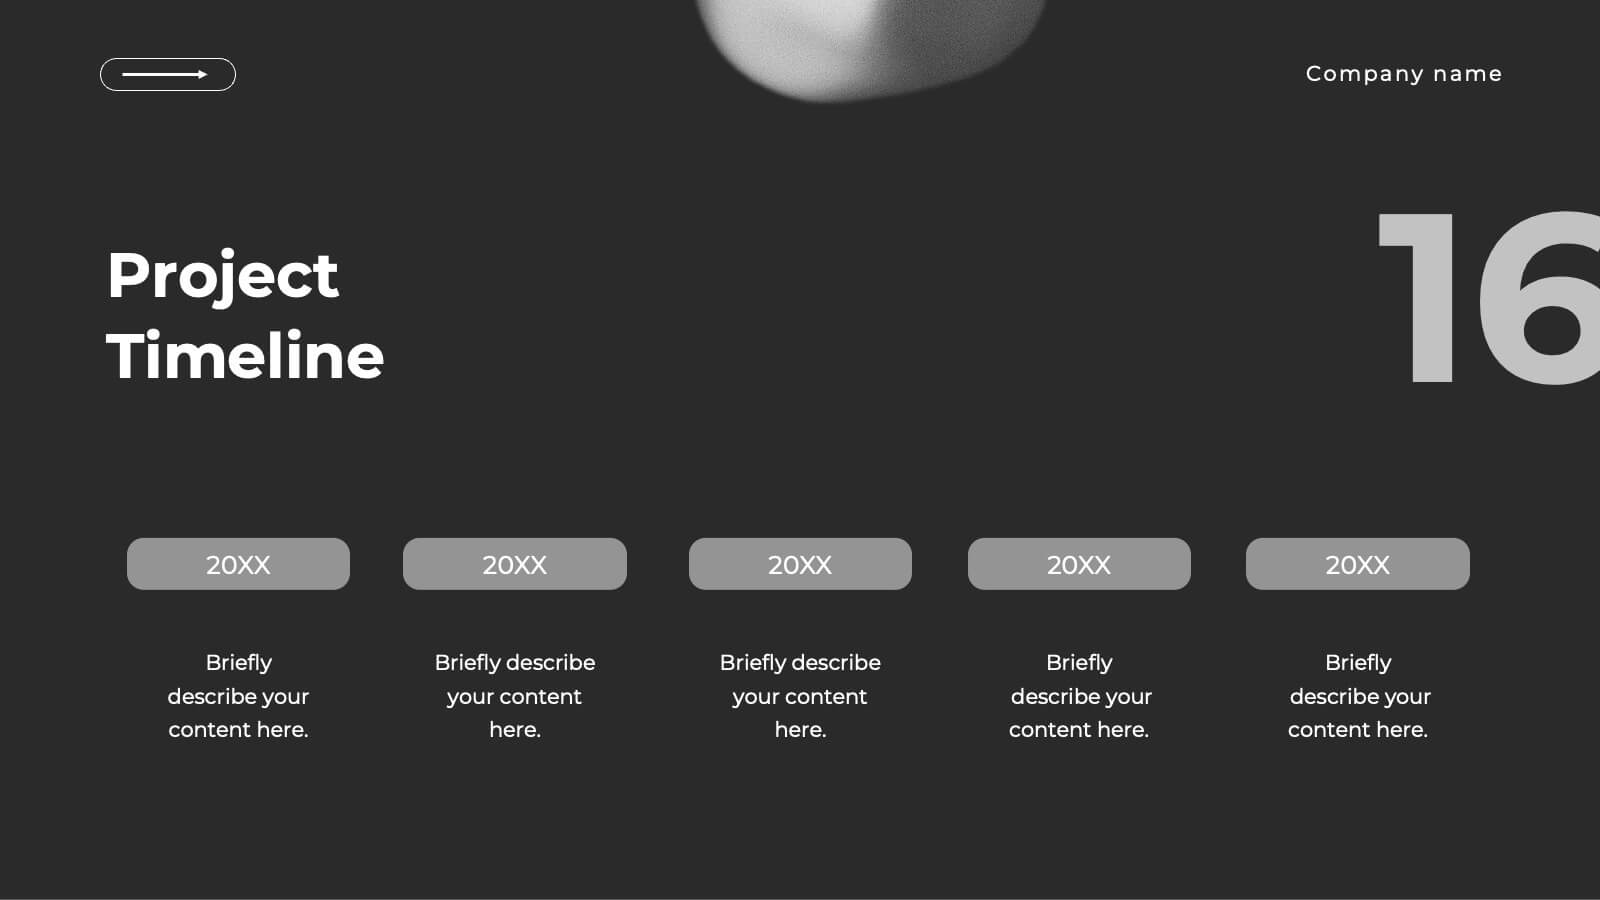
Realm UX UI Design Pitch Deck Presentation
Present your UX/UI design process with this sleek and modern design template! It covers everything from concept development to wireframes, prototypes, design iterations, and final design presentation. Fully customizable and compatible with PowerPoint, Keynote, and Google Slides, it’s perfect for design teams and professionals looking to showcase their creative process effectively.


6 slides
Market Expansion Strategy with Asia Map Presentation
Explore new business frontiers with the Market Expansion Strategy with Asia Map template, your strategic platform for analyzing and expanding market presence across Asia. This presentation is designed to guide businesses through the complexities of Asian market landscapes. Featuring an integrated Asia map and designated spaces for in-depth insights, this template is ideal for corporate strategists and market analysts. It supports PowerPoint, Keynote and Google Slides for versatile presentation options.


26 slides
Dante Presentation Template
Featuring our new Dante Sportswear template this is a great way to present your products and ideas in an attractive, easy-to-read and easily understanding presentation. It includes all the elements you need to create a marketing presentation with style that will stand out. This template has plenty of space for displaying statistics and other data with images that complement your product/service information. You can use this template for valuable sportswear content or information to educate or entertain your audience. This template is fully and easily editable in powerpoint as well!


5 slides
Value Chain Business Model Presentation
Spark fresh insight into how your organization creates value with this clean, arrow-based layout that makes every step feel intuitive and action-ready. This presentation breaks down key activities, support processes, and improvement opportunities in a clear visual flow perfect for strategy discussions. Fully compatible with PowerPoint, Keynote, and Google Slides.


6 slides
Marketing Business Plan Infographics
The "Marketing Business Plan" infographic template is a strategic and detailed resource, perfect for PowerPoint, Keynote, and Google Slides. Designed for marketing professionals, business strategists, and entrepreneurs, this template is an effective tool for planning and presenting marketing strategies. This template includes key components of a marketing business plan, such as market analysis, marketing strategies, target audience identification, and budget allocation. Its structured layout helps users clearly present their marketing approach, making it invaluable for business plan presentations, strategy meetings, and marketing courses. The design is professional and focused, with a dynamic color scheme that uses shades of blue, green, and orange. This palette not only makes the template visually appealing but also symbolizes important aspects of marketing planning, such as creativity, growth, and organization. Whether used in business pitches, strategy workshops, or educational settings, this template ensures that your marketing business plan is conveyed with clarity and visual impact.


6 slides
Business Decision Venn Diagram Presentation
Make complex decision-making simple and visually impactful with this Business Decision Venn Diagram Presentation. Featuring a bold triangular layout with six segmented areas, this slide is ideal for presenting overlapping factors, interconnected strategies, or priority zones. Perfect for business planning, competitive analysis, or project evaluation. Fully editable in PowerPoint, Keynote, and Google Slides for seamless integration into your presentations.


5 slides
Organic Search Growth Plan Presentation
Grow your visibility the natural way with this sleek and easy-to-follow organic strategy slide. Perfect for outlining SEO goals, keyword clusters, and growth tactics, this visual layout makes your presentation clean and compelling. Fully compatible with PowerPoint, Keynote, and Google Slides for flexible editing across platforms.


6 slides
Simple TOC Layout for Deck Navigation Presentation
Guide your audience effortlessly with this Simple TOC Layout for Deck Navigation template. Featuring a clean, vertical flow with numbered icons and clear section markers, it’s ideal for organizing multi-part presentations. Fully customizable in Canva, PowerPoint, and Google Slides to match your brand colors and ensure professional, seamless navigation.


5 slides
Big Data Infrastructure Planning Presentation
Build your big data strategy step-by-step with this clean and visual planning template. Designed to map out the key gears of infrastructure—from hardware to storage and cloud integration—it’s a powerful tool for IT leaders and tech teams. Fully editable and works with PowerPoint, Keynote, and Google Slides.


6 slides
Six Sigma Process Infographic
Dive into the world of process improvement with our six sigma process infographic. Crafted with a harmonious blend of blue, yellow, and white, this infographic elucidates the principles of Six Sigma methodology in an engaging manner. Ideal for business analysts, quality assurance teams, and corporate trainers, it delineates the DMAIC process in vivid detail. The design encapsulates the rigorous methodology of Six Sigma, providing clarity and fostering knowledge retention. This versatile template is a perfect fit for PowerPoint, Keynote, and Google Slides, making your presentations both captivating and insightful.


4 slides
Construction Project Planning
Streamline your workflow and improve clarity with this vibrant project planning wheel designed for construction professionals. This slide helps visualize key phases—such as planning, team coordination, and logistics—using color-coded segments and editable icons. Perfect for architects, contractors, and project managers. Fully customizable in PowerPoint, Keynote, and Google Slides.


6 slides
Credit Card Features Overview Presentation
Bring your audience into the world of smart spending with a clean, visual layout that explains key credit card features in a simple, engaging way. This presentation helps you break down benefits, terms, and essential details with clarity and confidence. Fully editable and compatible with PowerPoint, Keynote, and Google Slides.


4 slides
Blue Ocean Innovation Approach Presentation
The Blue Ocean Innovation Approach Presentation offers a clear and modern layout for visualizing strategic innovation. Featuring layered diamond shapes representing Cost, Value Innovation, and Buyer Value, this slide helps explain how businesses can move beyond competition by creating new market spaces. Each section includes editable titles and text boxes, ideal for outlining strategies, key concepts, or benefits. Designed for consultants, strategists, and business leaders, the template is fully customizable in PowerPoint, Keynote, and Google Slides. Perfect for presenting blue ocean thinking in a polished, professional format.