First-Time Buyer Tips Infographic
PowerPoint Template and Google Slides Theme


Features
- 6 Unique slides
- Fully editable and easy to edit in Microsoft Powerpoint, Keynote and Google Slides
- 16:9 widescreen layout
- Clean and professional designs
- Export to JPG, PDF or send by email
- Remove from favorites
Powerpoint Template
5 MB
Google Slides Template
External link
Keynote Template
5 MB
Recommend
- Remove from favorites
Powerpoint Template
1 MB
Google Slides Template
External link
Keynote Template
1 MB
6 slides
Biology Tree Diagram Infographic
Tree diagrams in biology are graphical representations that show the hierarchical relationships and evolutionary history of different organisms, species, or biological traits. This infographic template is designed to simplify complex biological information and show the interconnectedness between different biological topics or classifications. This infographic is a visual representation of various biological concepts and relationships in a hierarchical tree structure. This template color codes the different branches to distinguishing between the different categories and make the infographic easier to navigate.
- Remove from favorites
Powerpoint Template
1 MB
Google Slides Template
External link
Keynote Template
1 MB
6 slides
Ishikawa Diagram Analysis Presentation
Break down complex problems and identify root causes with this Ishikawa Diagram Analysis template. Ideal for quality control, project management, and strategic planning. Clean, editable design allows easy customization to fit your needs. Compatible with PowerPoint, Keynote, and Google Slides for seamless workflow integration.
- Remove from favorites
Powerpoint Template
4 MB
Google Slides Template
External link
Keynote Template
2 MB
3 slides
Company Vision Roadmap Presentation
Bring your future story to life with a clear, inspiring layout that guides viewers through your long-term direction and strategic milestones. This presentation helps teams communicate purpose, goals, and planned progress in a simple, structured format that’s easy to follow. Compatible with PowerPoint, Keynote, and Google Slides.
- Remove from favorites
Powerpoint Template
1 MB
Google Slides Template
External link
Keynote Template
1 MB
8 slides
Product Showcase on Devices Presentation
Present your features in a sleek, mobile-first layout with the Product Showcase on Devices Presentation. This vertical slide design mimics a smartphone screen, making it ideal for displaying app features, service tiers, or digital tool highlights. Each section is clearly segmented, perfect for comparisons or step-by-step product walkthroughs. Fully editable in PowerPoint, Keynote, Canva, and Google Slides.
- Remove from favorites
Powerpoint Template
1 MB
Google Slides Template
External link
Keynote Template
1 MB
7 slides
PESTEL Market Analysis Infographic
PESTEL analysis is a crucial framework for comprehending the macro-environmental factors influencing a market. Our PESTEL market analysis infographic, rendered in lively shades of green and orange against a pristine white backdrop, provides a concise yet comprehensive overview of Political, Economic, Social, Technological, Environmental, and Legal aspects. Specifically tailored for business analysts, strategists, and market researchers, this template serves as a vibrant visual guide for dissecting the external market environment. With compatibility spanning PowerPoint, Keynote, and Google Slides, it promises a dynamic addition to your market analysis presentations.
- Remove from favorites
Powerpoint Template
1 MB
Google Slides Template
External link
Keynote Template
1 MB
5 slides
Studio Photography Infographics
Studio Photography is the practice of capturing photographs in a controlled environment, typically a dedicated photography studio. These infographic templates highlight the key aspects of studio photography with examples of fashion photography, photojournalism, and photography terminology. These are designed to assist photographers, photography studios, and enthusiasts in showcasing the essential elements and techniques involved in capturing stunning images in a studio setting. Use these to provides valuable insights and techniques to help your audience create stunning images in a studio environment. Compatible with Powerpoint, Keynote, and Google Slides.
- Remove from favorites
Powerpoint Template
1 MB
Google Slides Template
External link
Keynote Template
2 MB
5 slides
Types of Coffee Infographics
There are many different types of coffee, with varying tastes and brewing methods. This template features unique vertical Infographics as visual representation of different types of coffee that are popular in various parts of the world. These are designed to provide information on the different types of coffee, their origins, brewing methods, and taste profiles. You can also provide information on the ingredients used to make the coffee, such as the milk, cream, and sugars. These infographics are very visually pleasing, the icons, images, and color schemes are associated with coffee. Include your statistics on the popularity of different types of coffee and how they are consumed!
- Remove from favorites
Powerpoint Template
1 MB
Google Slides Template
External link
Keynote Template
2 MB
5 slides
IT Operations Management
Illustrate complex workflows with this gear-themed infographic designed for IT operations management. Each gear represents a key step or stage, perfect for showcasing interconnected processes, system automation, or IT service flow. Easy to customize in PowerPoint, Keynote, and Google Slides. Clean, professional layout with space for icons and concise text.
- Remove from favorites
Powerpoint Template
1 MB
Google Slides Template
External link
Keynote Template
1 MB
4 slides
5G Tech Use Cases and Industry Impact Presentation
Step into the future with this modern, tech-focused layout designed to simplify complex 5G use case presentations. Ideal for showcasing industry-specific impacts, this infographic-style slide makes your data look clean and professional. Fully editable and compatible with PowerPoint, Keynote, and Google Slides for seamless customization.
- Remove from favorites
Powerpoint Template
1 MB
Google Slides Template
External link
Keynote Template
1 MB
4 slides
Simple Daily Checklist Presentation
Stay organized and motivated with a clear, structured layout that helps you track tasks, goals, and priorities with ease. Perfect for daily planning, progress tracking, or productivity meetings, this presentation keeps everything simple and focused. Fully compatible with PowerPoint, Keynote, and Google Slides for smooth, customizable editing.
- Remove from favorites
Powerpoint Template
1 MB
Google Slides Template
External link
Keynote Template
1 MB
3 slides
Spider Diagram for Concept Mapping Presentation
Visualize complex data relationships with clarity using the Spider Diagram for Concept Mapping Presentation. This template is perfect for comparing multiple variables across categories, making it ideal for performance reviews, strategic analysis, and brainstorming sessions. Fully editable and compatible with PowerPoint, Keynote, and Google Slides.
- Remove from favorites
Powerpoint Template
1 MB
Google Slides Template
External link
Keynote Template
1 MB
6 slides
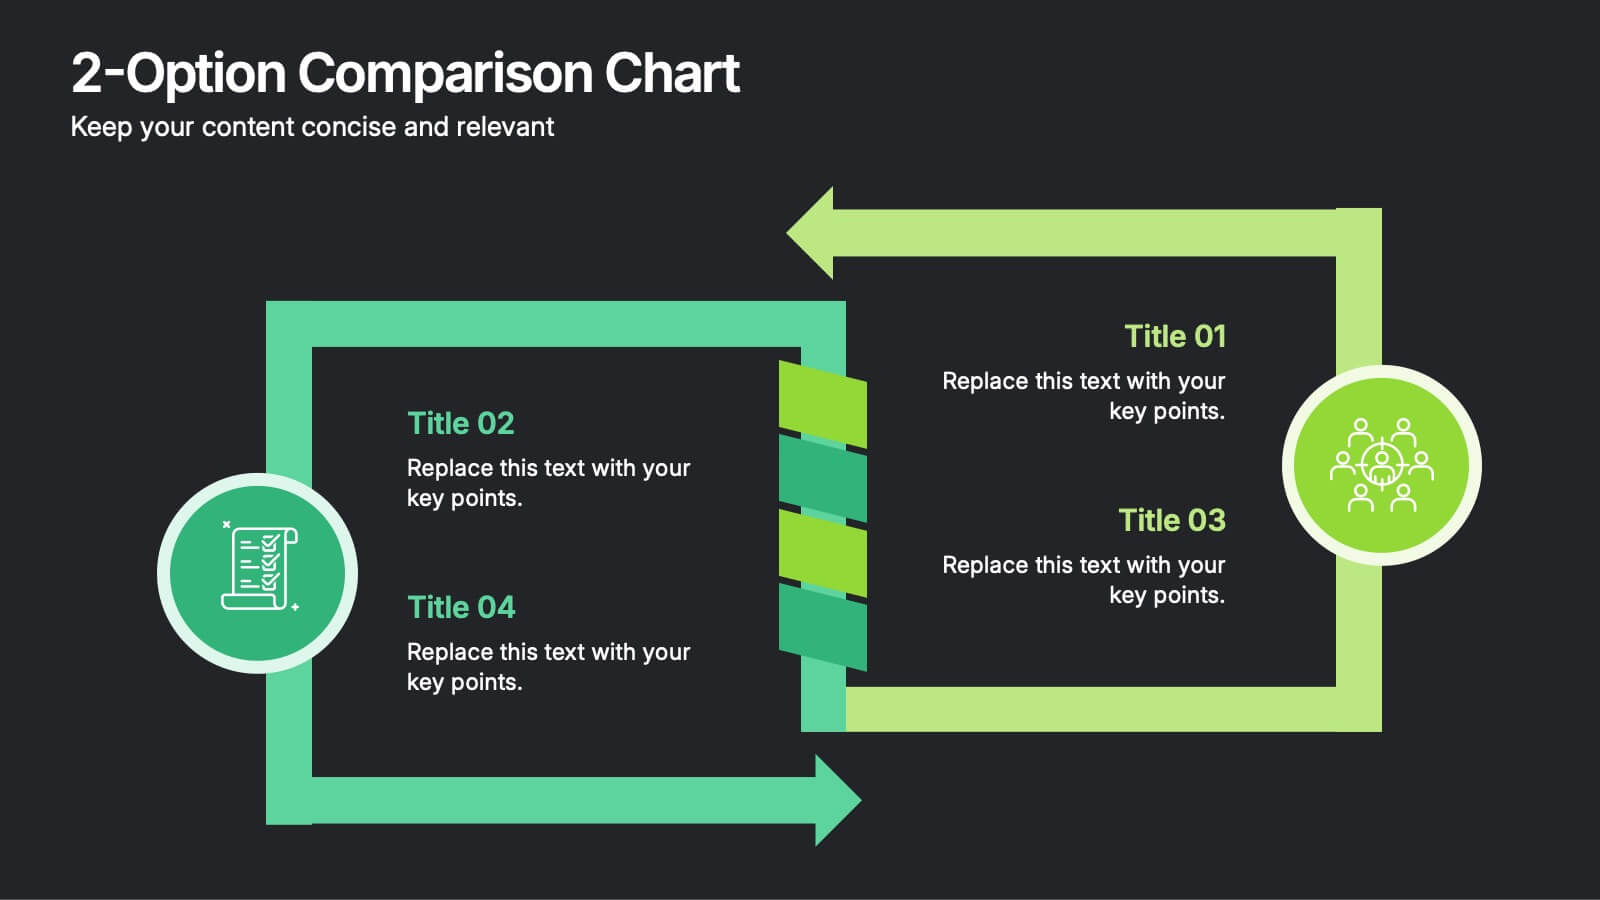
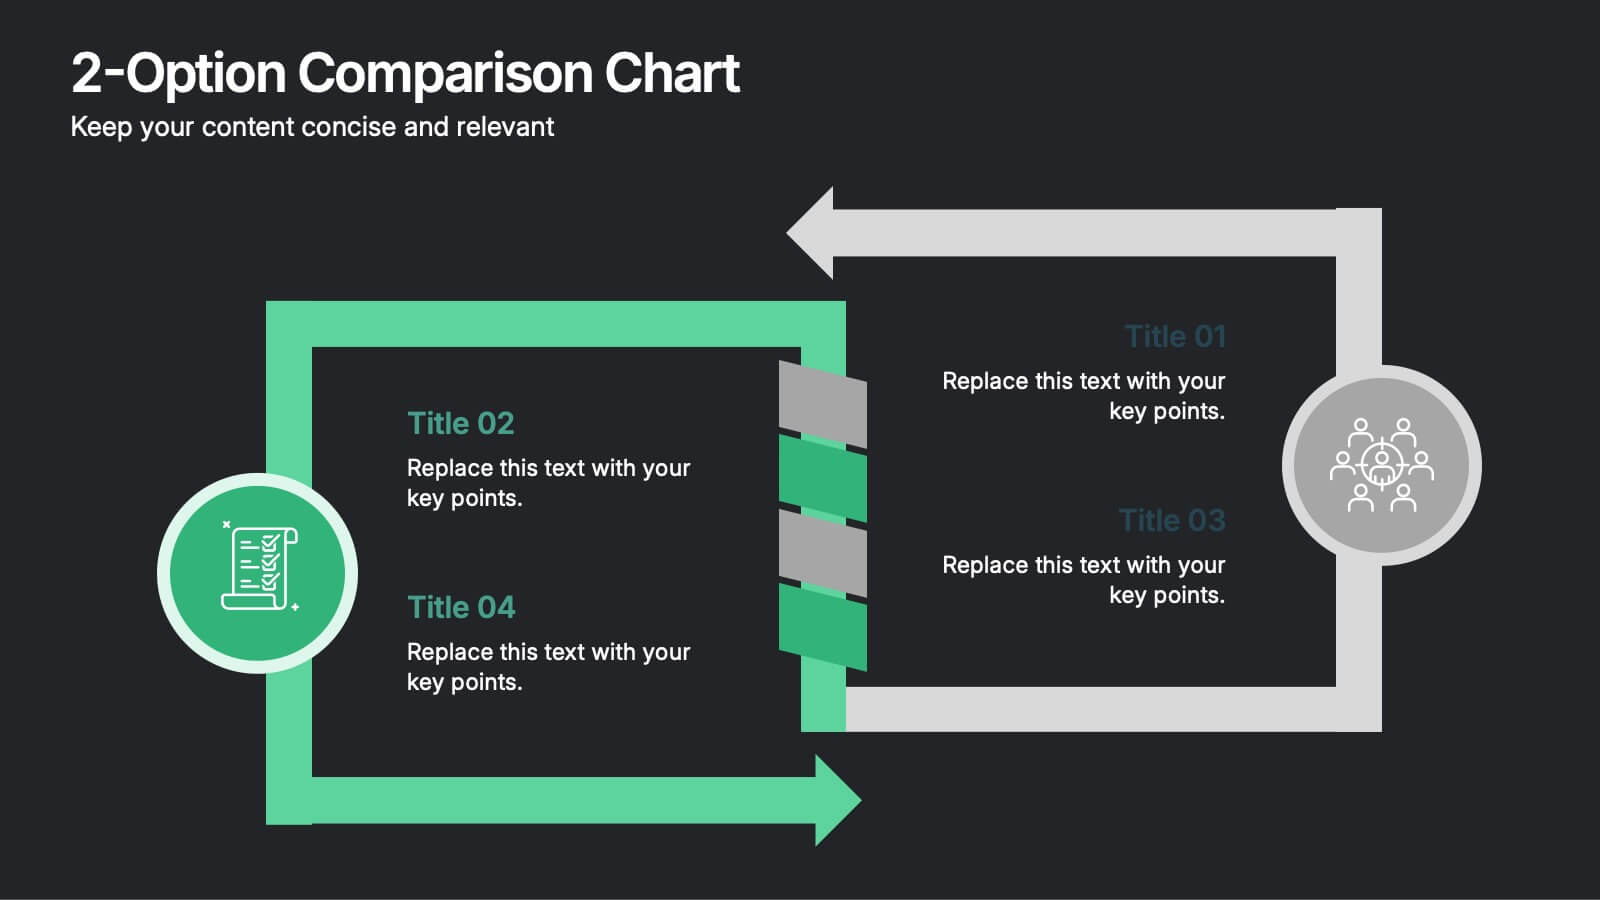
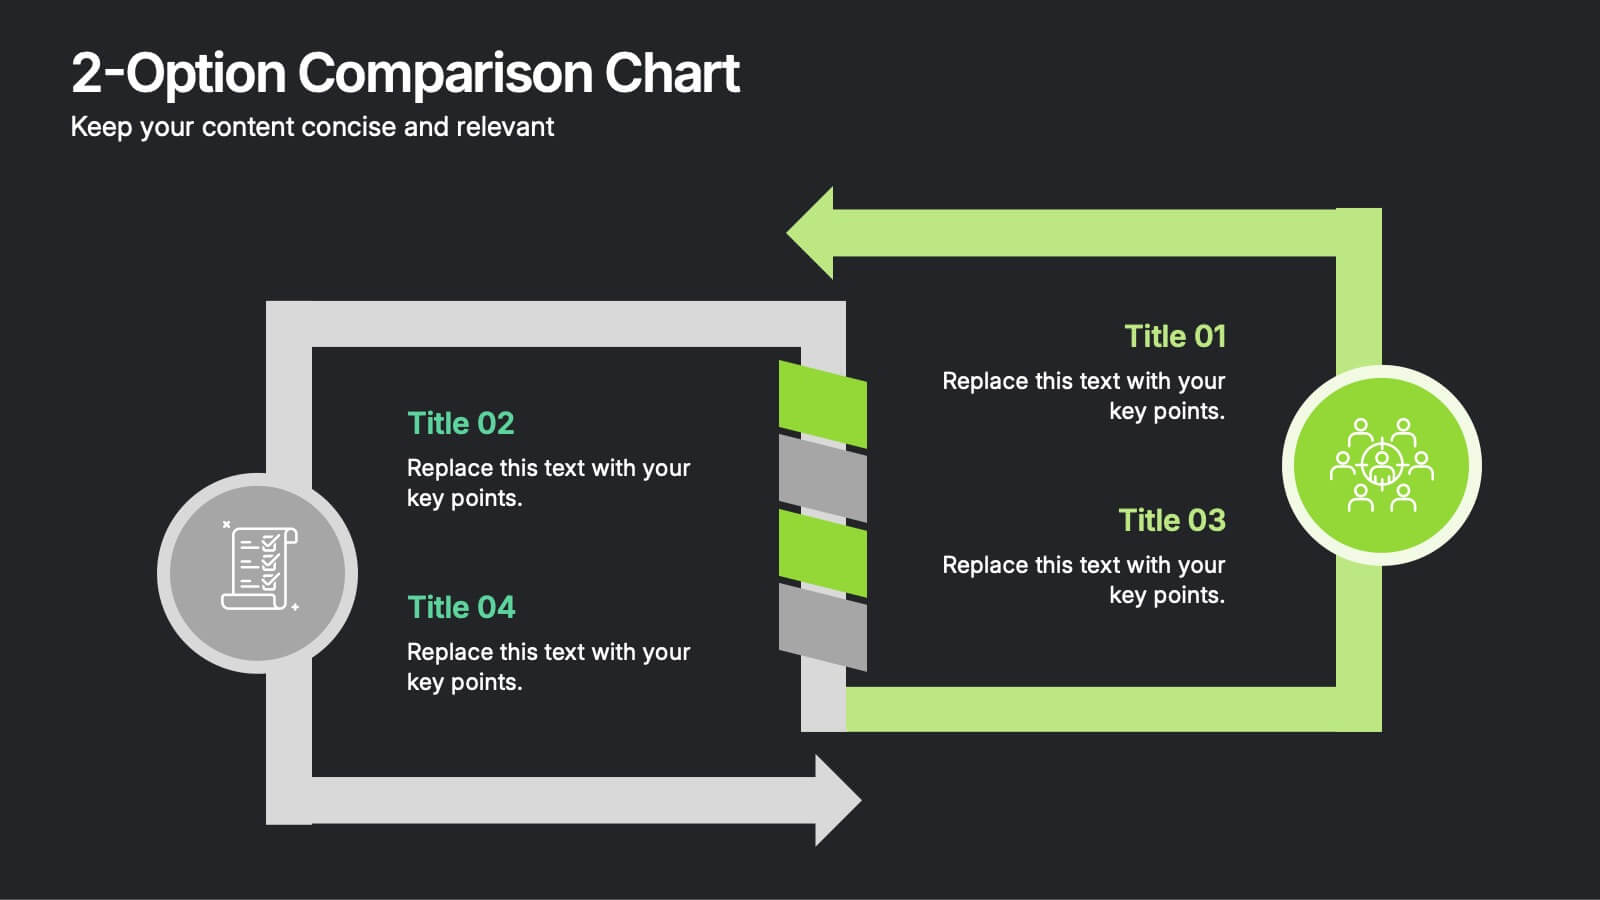
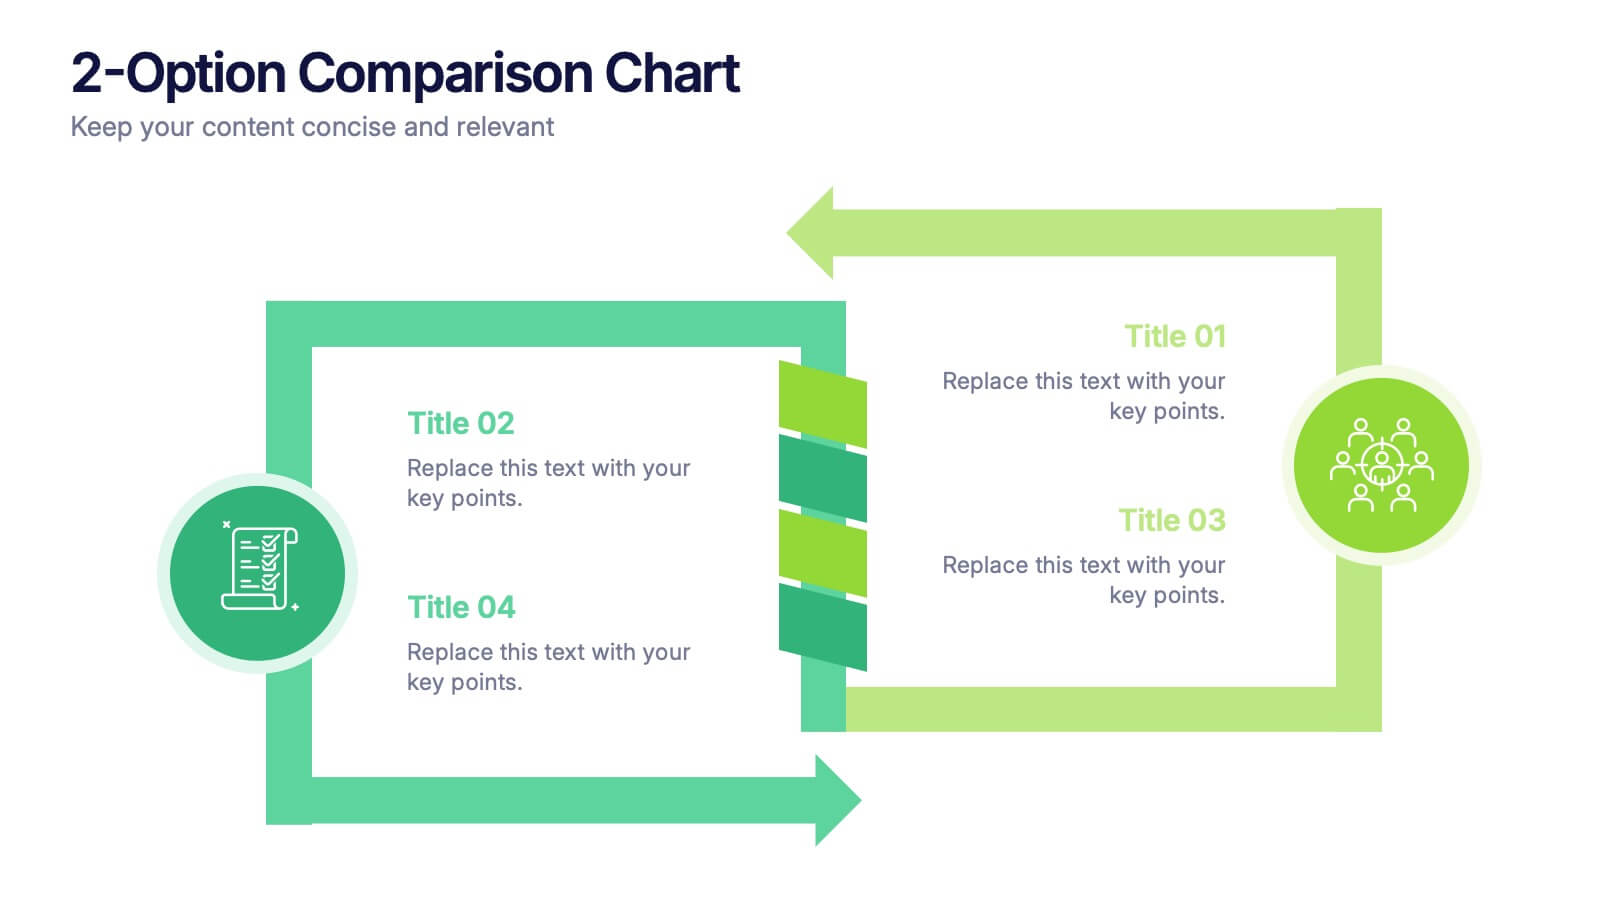
2-Option Comparison Chart Presentation
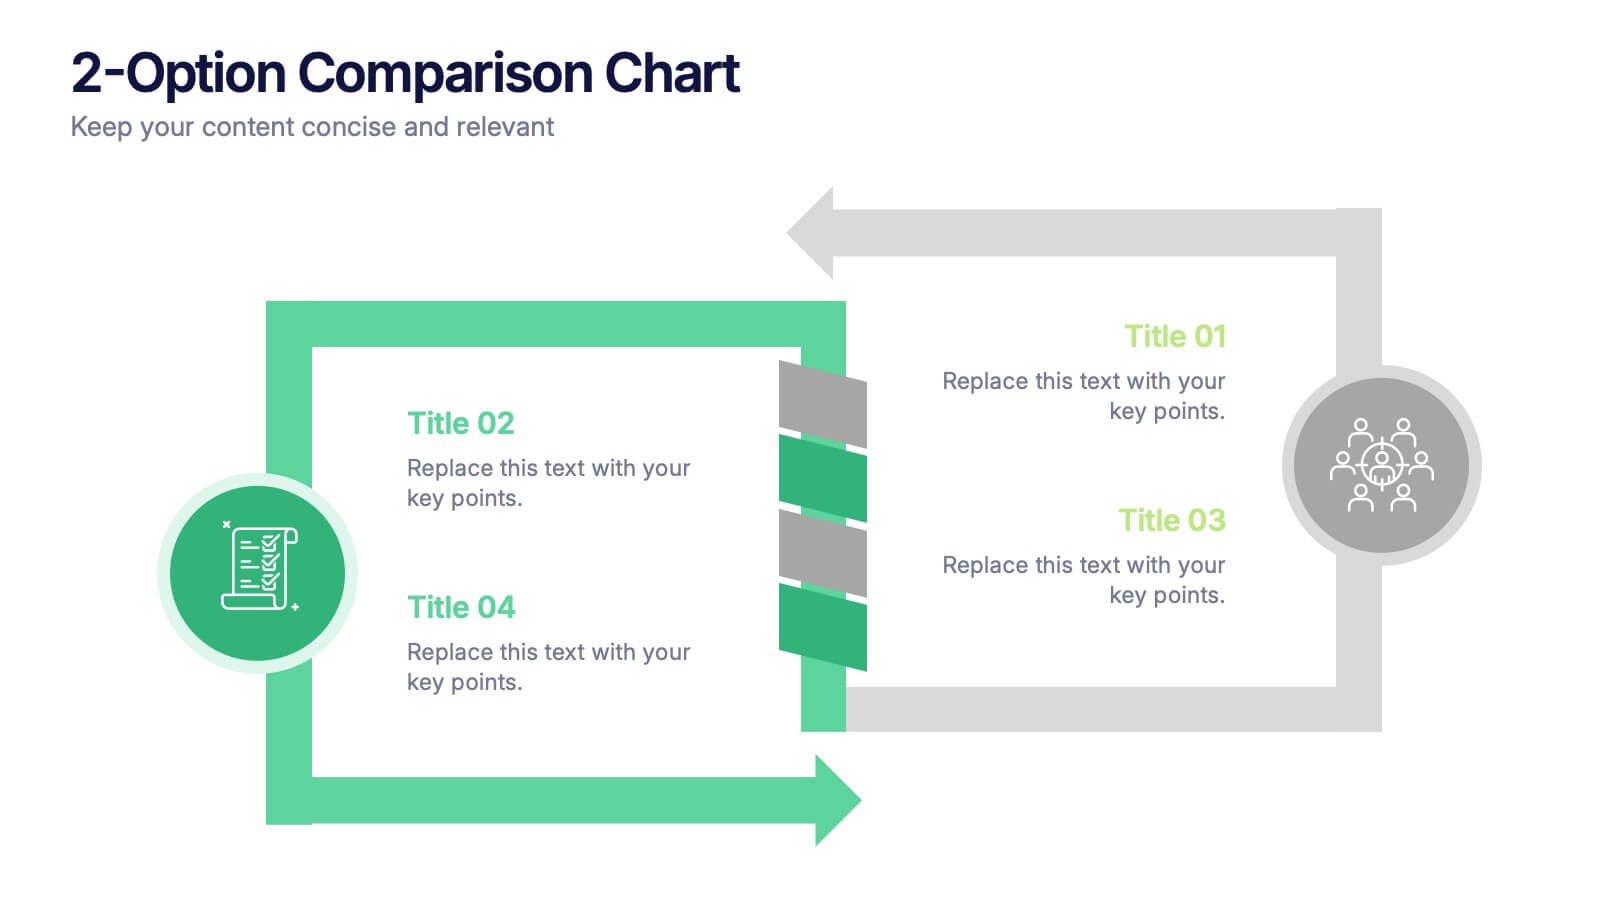
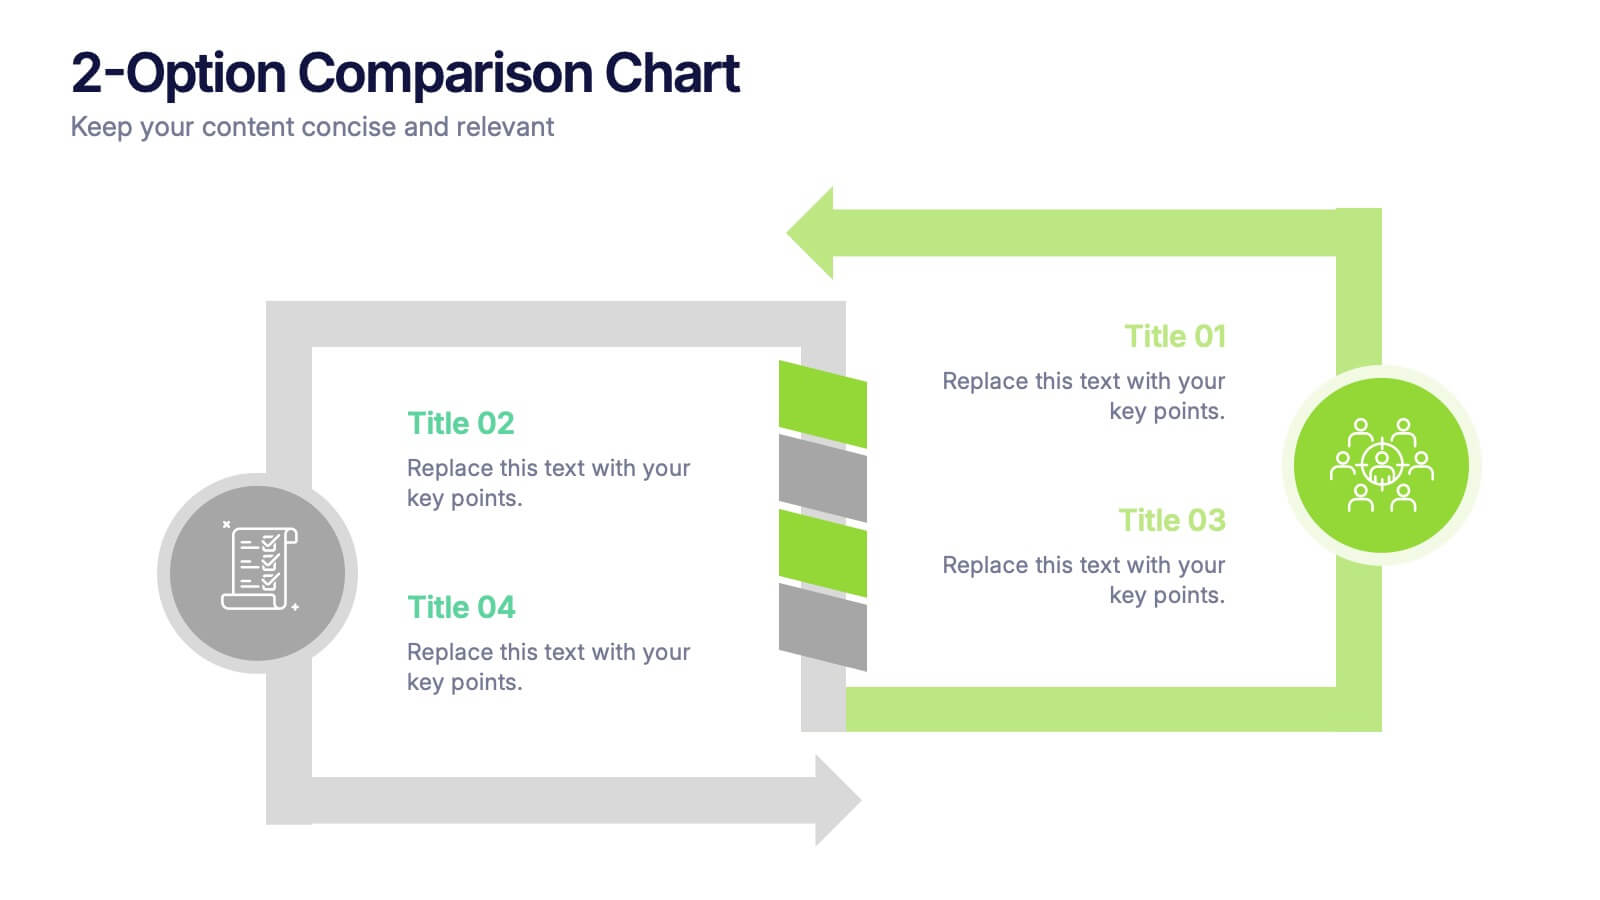
Make your decision-making story pop with a clean, energetic layout that clearly contrasts two paths side by side. This presentation helps you compare options, outline pros and cons, and guide audiences toward confident choices with sharp visual structure. Fully compatible with PowerPoint, Keynote, and Google Slides.
- Remove from favorites
Powerpoint Template
1 MB
Google Slides Template
External link
Keynote Template
1 MB
7 slides
Data-Driven Market Segmentation Presentation
Visualize customer segments with clarity using the Data-Driven Market Segmentation Presentation. This template features a structured, interconnected diagram with six customizable data points, ideal for audience targeting, persona mapping, or campaign planning. Clean, modern, and easy to edit in PowerPoint, Keynote, or Google Slides.
- Remove from favorites
Powerpoint Template
1 MB
Google Slides Template
External link
Keynote Template
2 MB
8 slides
AI Trends and Future Technology Presentation
Step into the future with this sleek, modern template designed to visualize cutting-edge concepts in artificial intelligence. Featuring futuristic robot graphics and a clean circular flow layout, this design is perfect for showcasing tech trends, automation strategies, or AI-driven innovations. Each section is color-coded and icon-supported for easy customization. Ideal for tech startups, AI researchers, and innovation consultants. Fully editable in PowerPoint, Keynote, and Google Slides.
- Remove from favorites
Powerpoint Template
1 MB
Google Slides Template
External link
Keynote Template
1 MB
3 slides
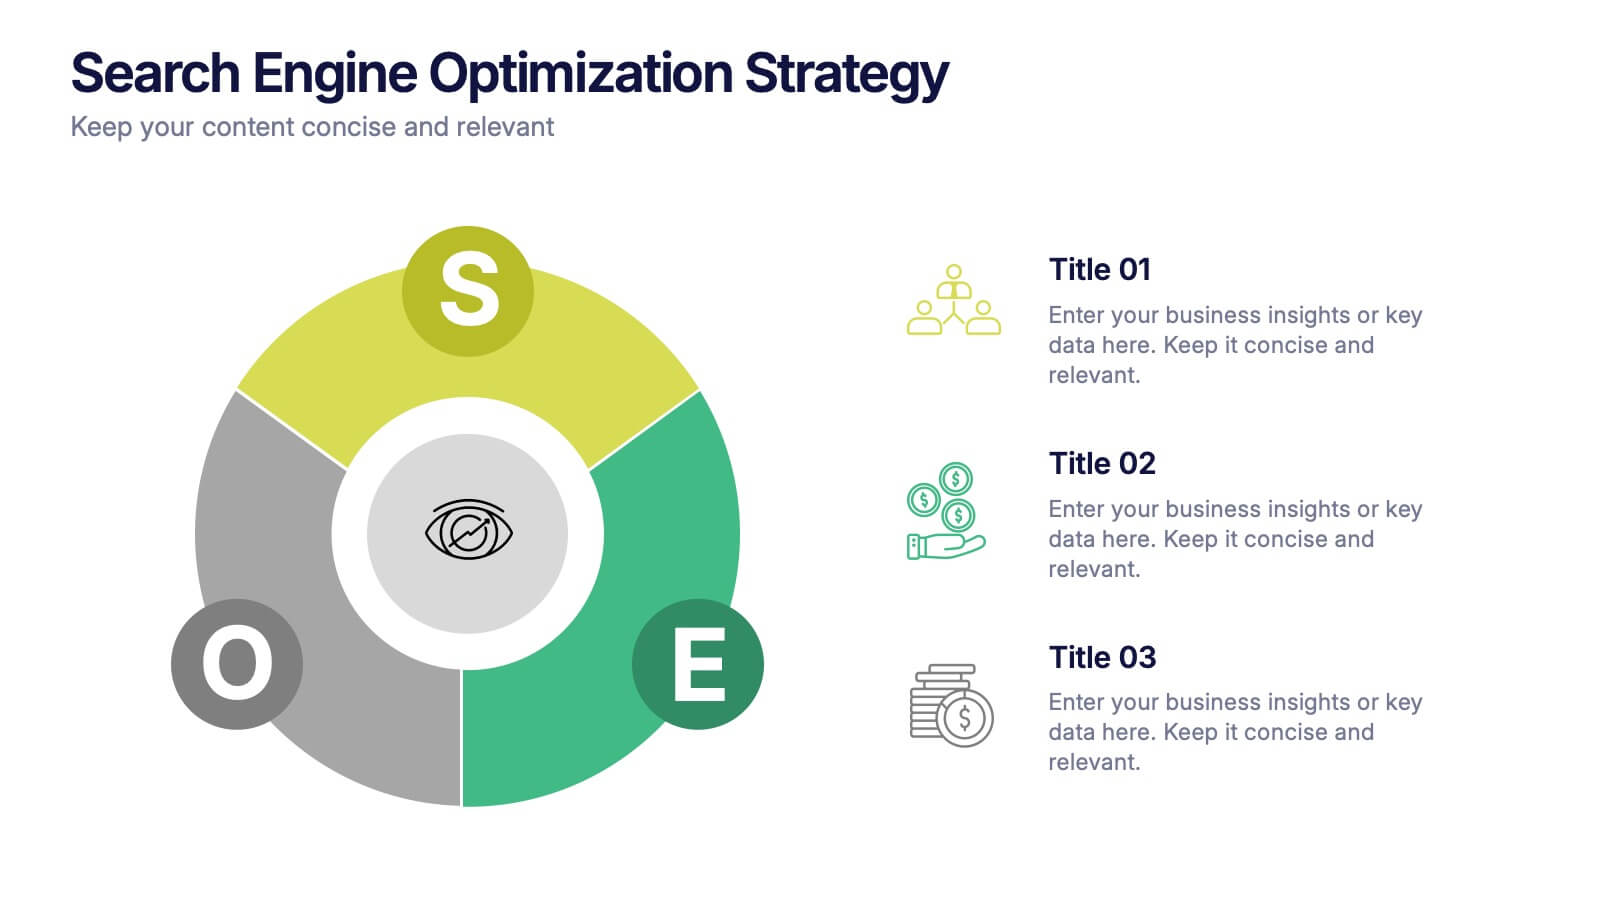
Search Engine Optimization Strategy Presentation
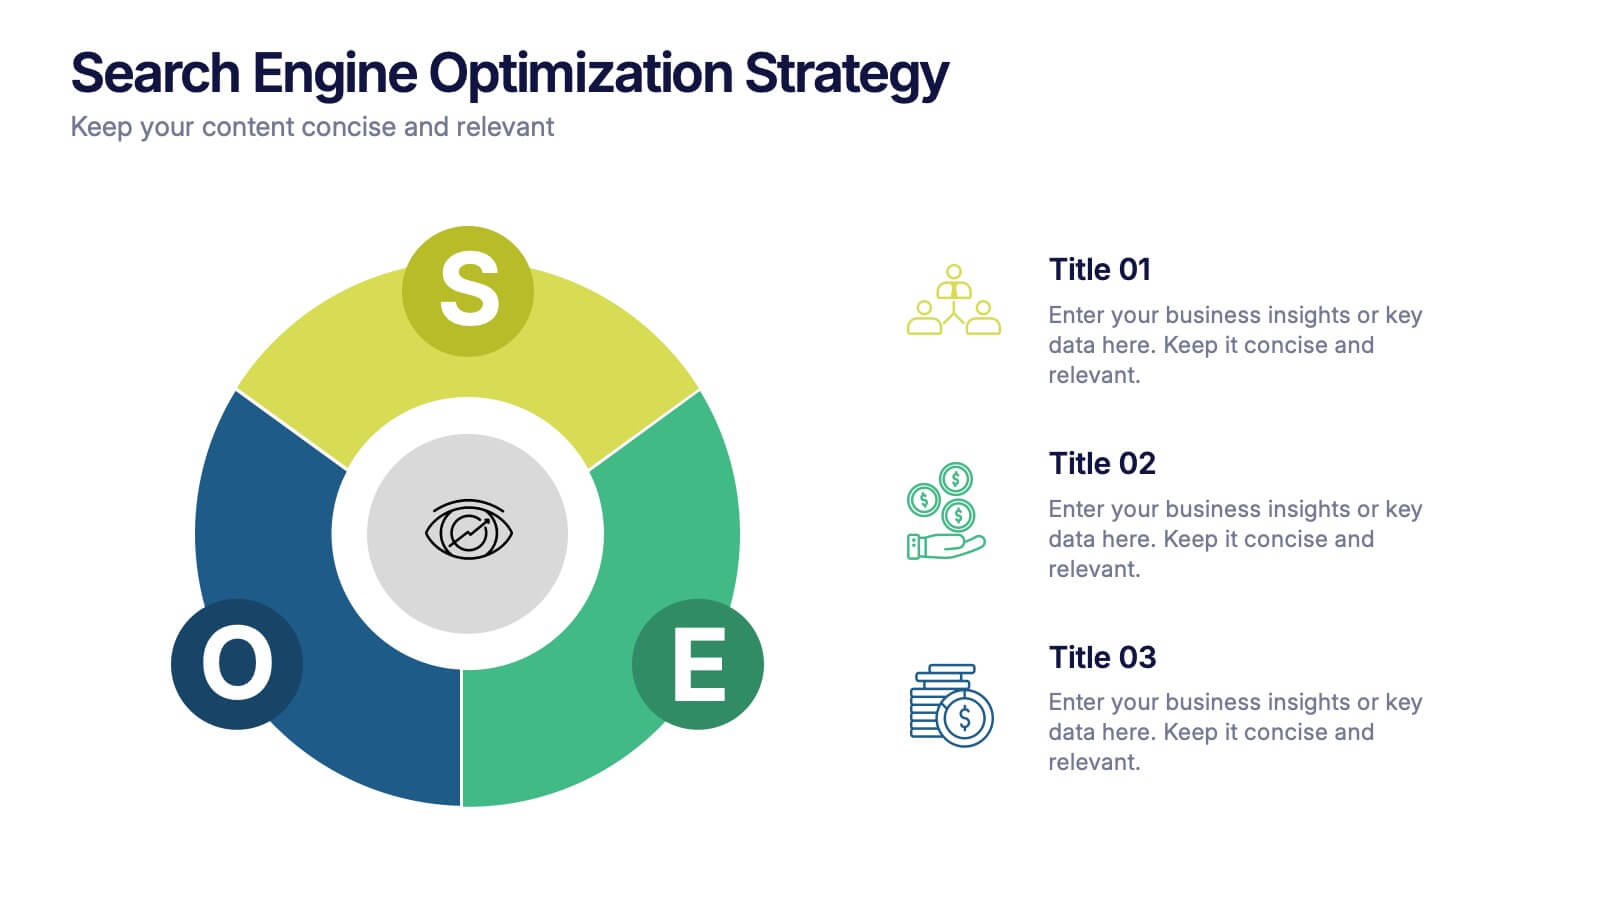
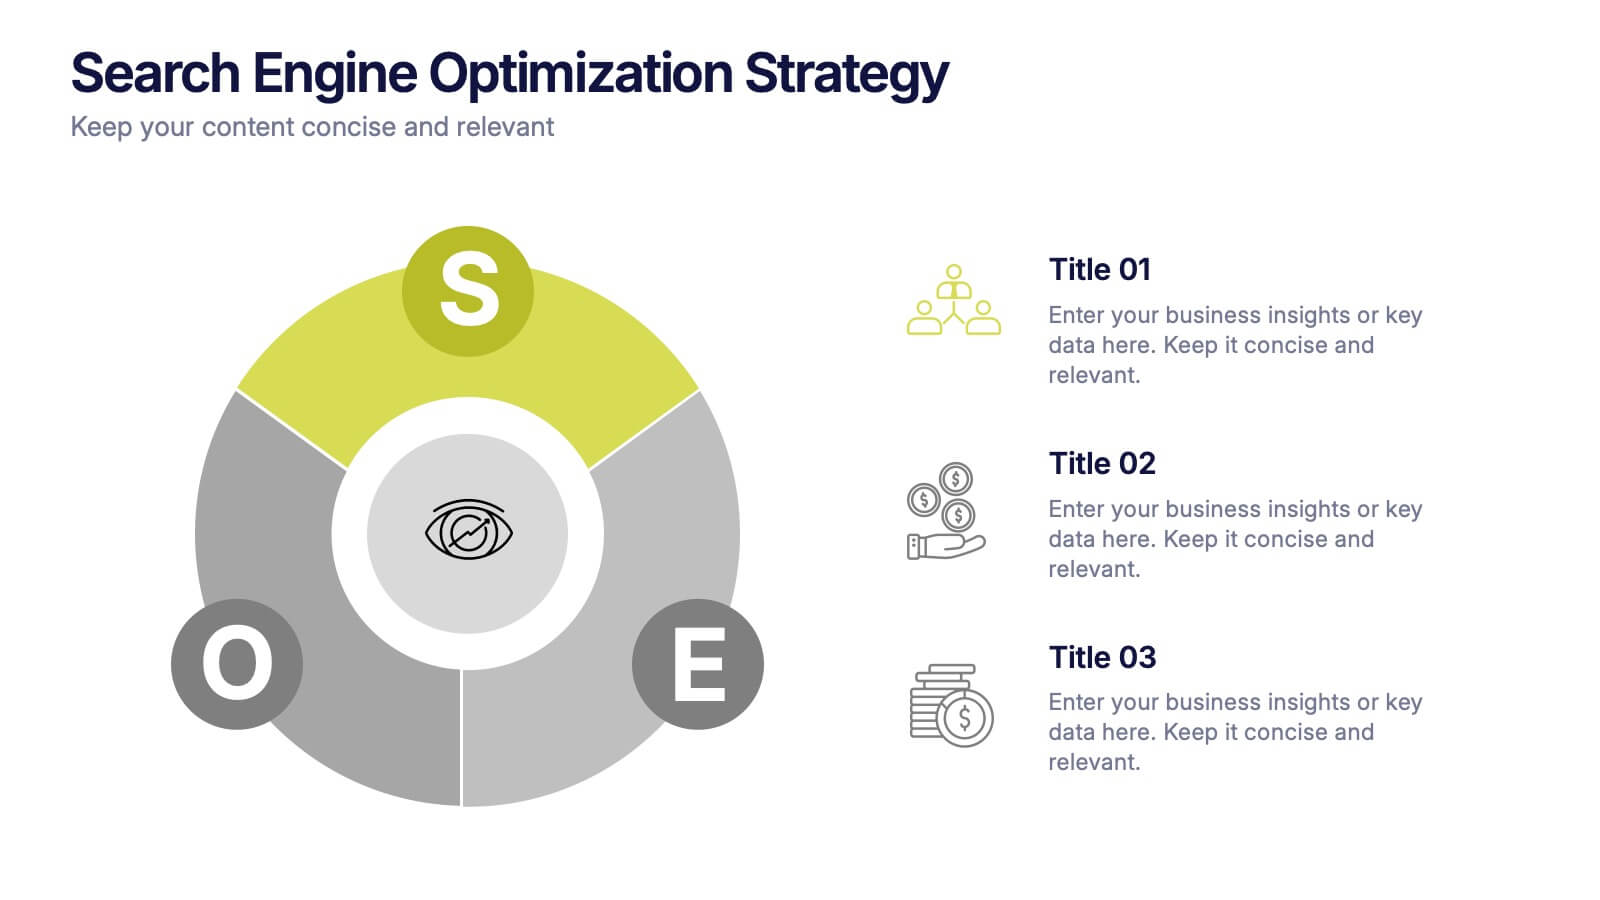
Stand out in your next presentation with this dynamic visual breakdown of digital visibility tactics. Perfect for marketers, business owners, or SEO specialists, this colorful circular infographic highlights the key pillars of a search strategy in a way that's both professional and easy to follow. Compatible with PowerPoint, Keynote, and Google Slides.
- Remove from favorites
Powerpoint Template
1 MB
Google Slides Template
External link
Keynote Template
1 MB
6 slides
Project Scope and Deliverables Overview Presentation
Make your project presentations flow effortlessly with a clear, structured layout that highlights goals, milestones, and deliverables. Ideal for tracking progress and aligning teams, this professional design balances clarity and style. Fully compatible with PowerPoint, Keynote, and Google Slides for smooth editing and presentation flexibility.
- Remove from favorites
Powerpoint Template
1 MB
Google Slides Template
External link
Keynote Template
2 MB
6 slides
Evolution of an Industry Through Time Presentation
Visualize industry transformation with the Evolution of an Industry Through Time Presentation. This timeline-style layout is perfect for highlighting key milestones, technological shifts, or growth stages across decades. Ideal for consultants, educators, or corporate strategists. Fully editable in Canva, PowerPoint, Keynote, and Google Slides for easy adaptation.


