


Features
- 4 Unique slides
- Fully editable and easy to edit in Microsoft Powerpoint, Keynote and Google Slides
- 16:9 widescreen layout
- Clean and professional designs
- Export to JPG, PDF or send by email


Do you have any questions?
Recommend


4 slides
Risk Assessments Matrix Presentation
Bring clarity to complex decisions with this bold, color-coded layout designed to pinpoint threats, compare impact levels, and communicate risks with confidence. This presentation makes evaluation simple, structured, and visually clear for any audience. Fully editable and ready for professional use. Compatible with PowerPoint, Keynote, and Google Slides.
21 slides
Twilight Project Milestones Report Presentation
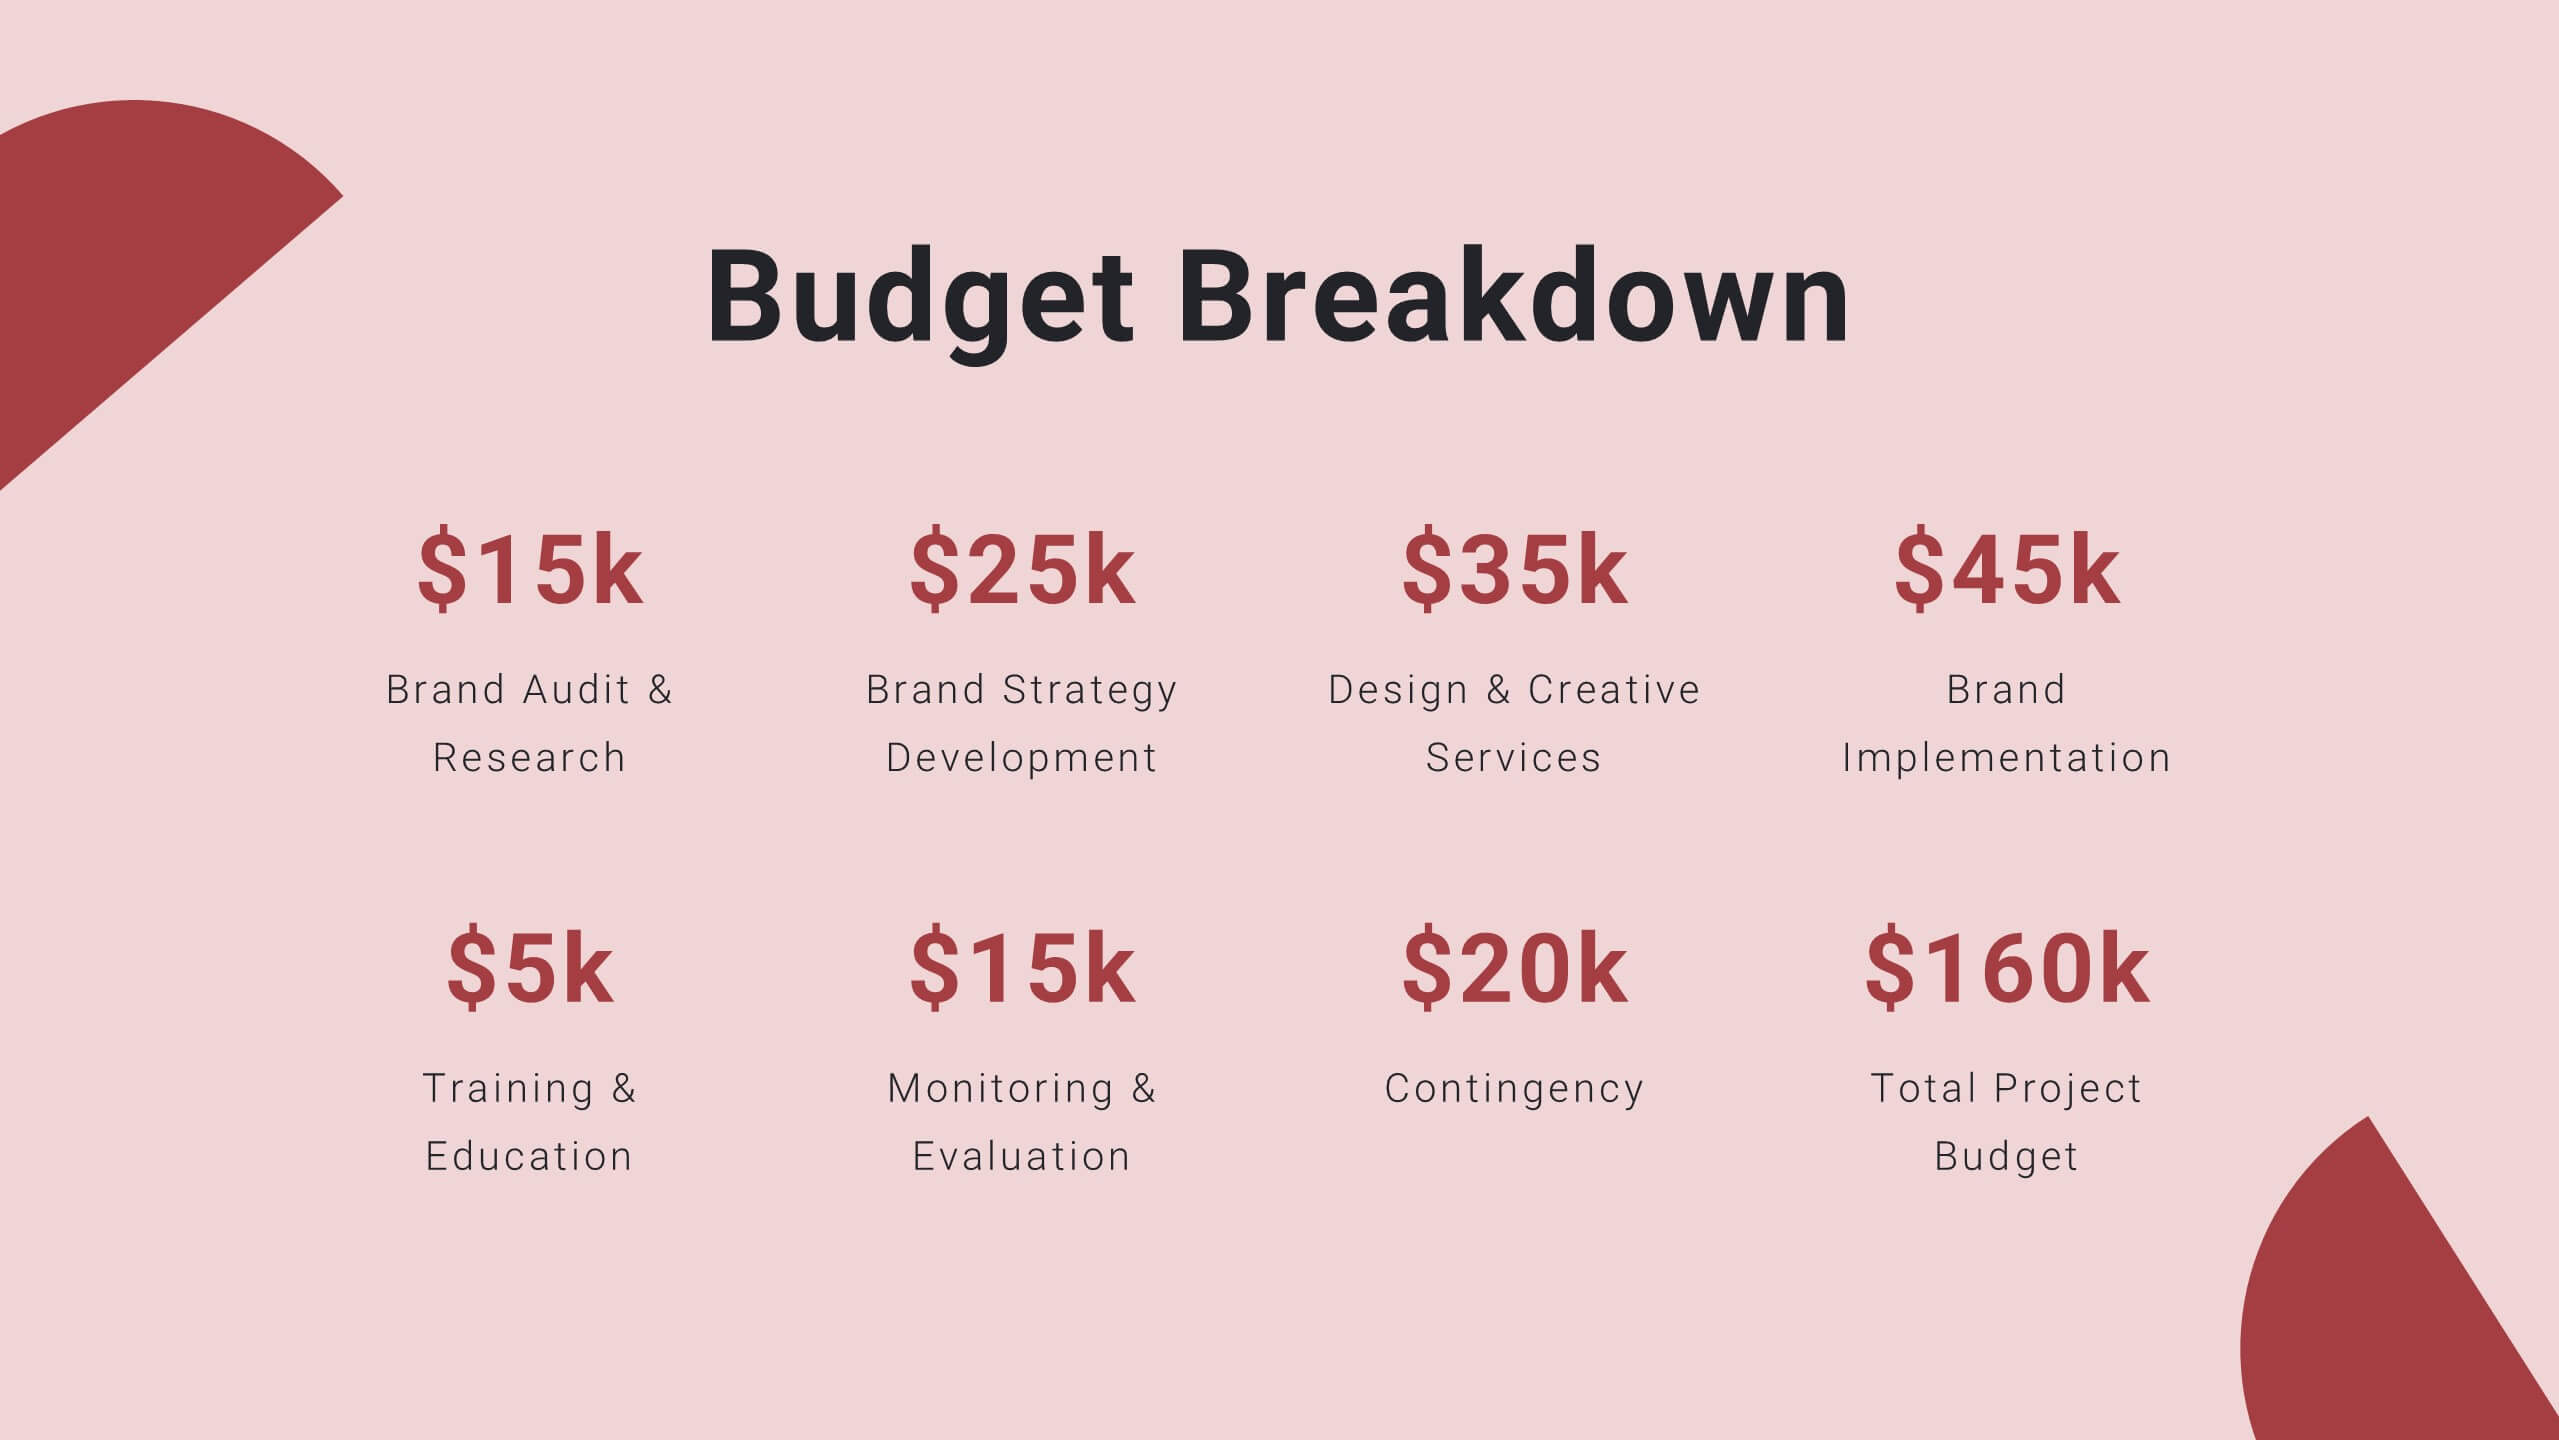
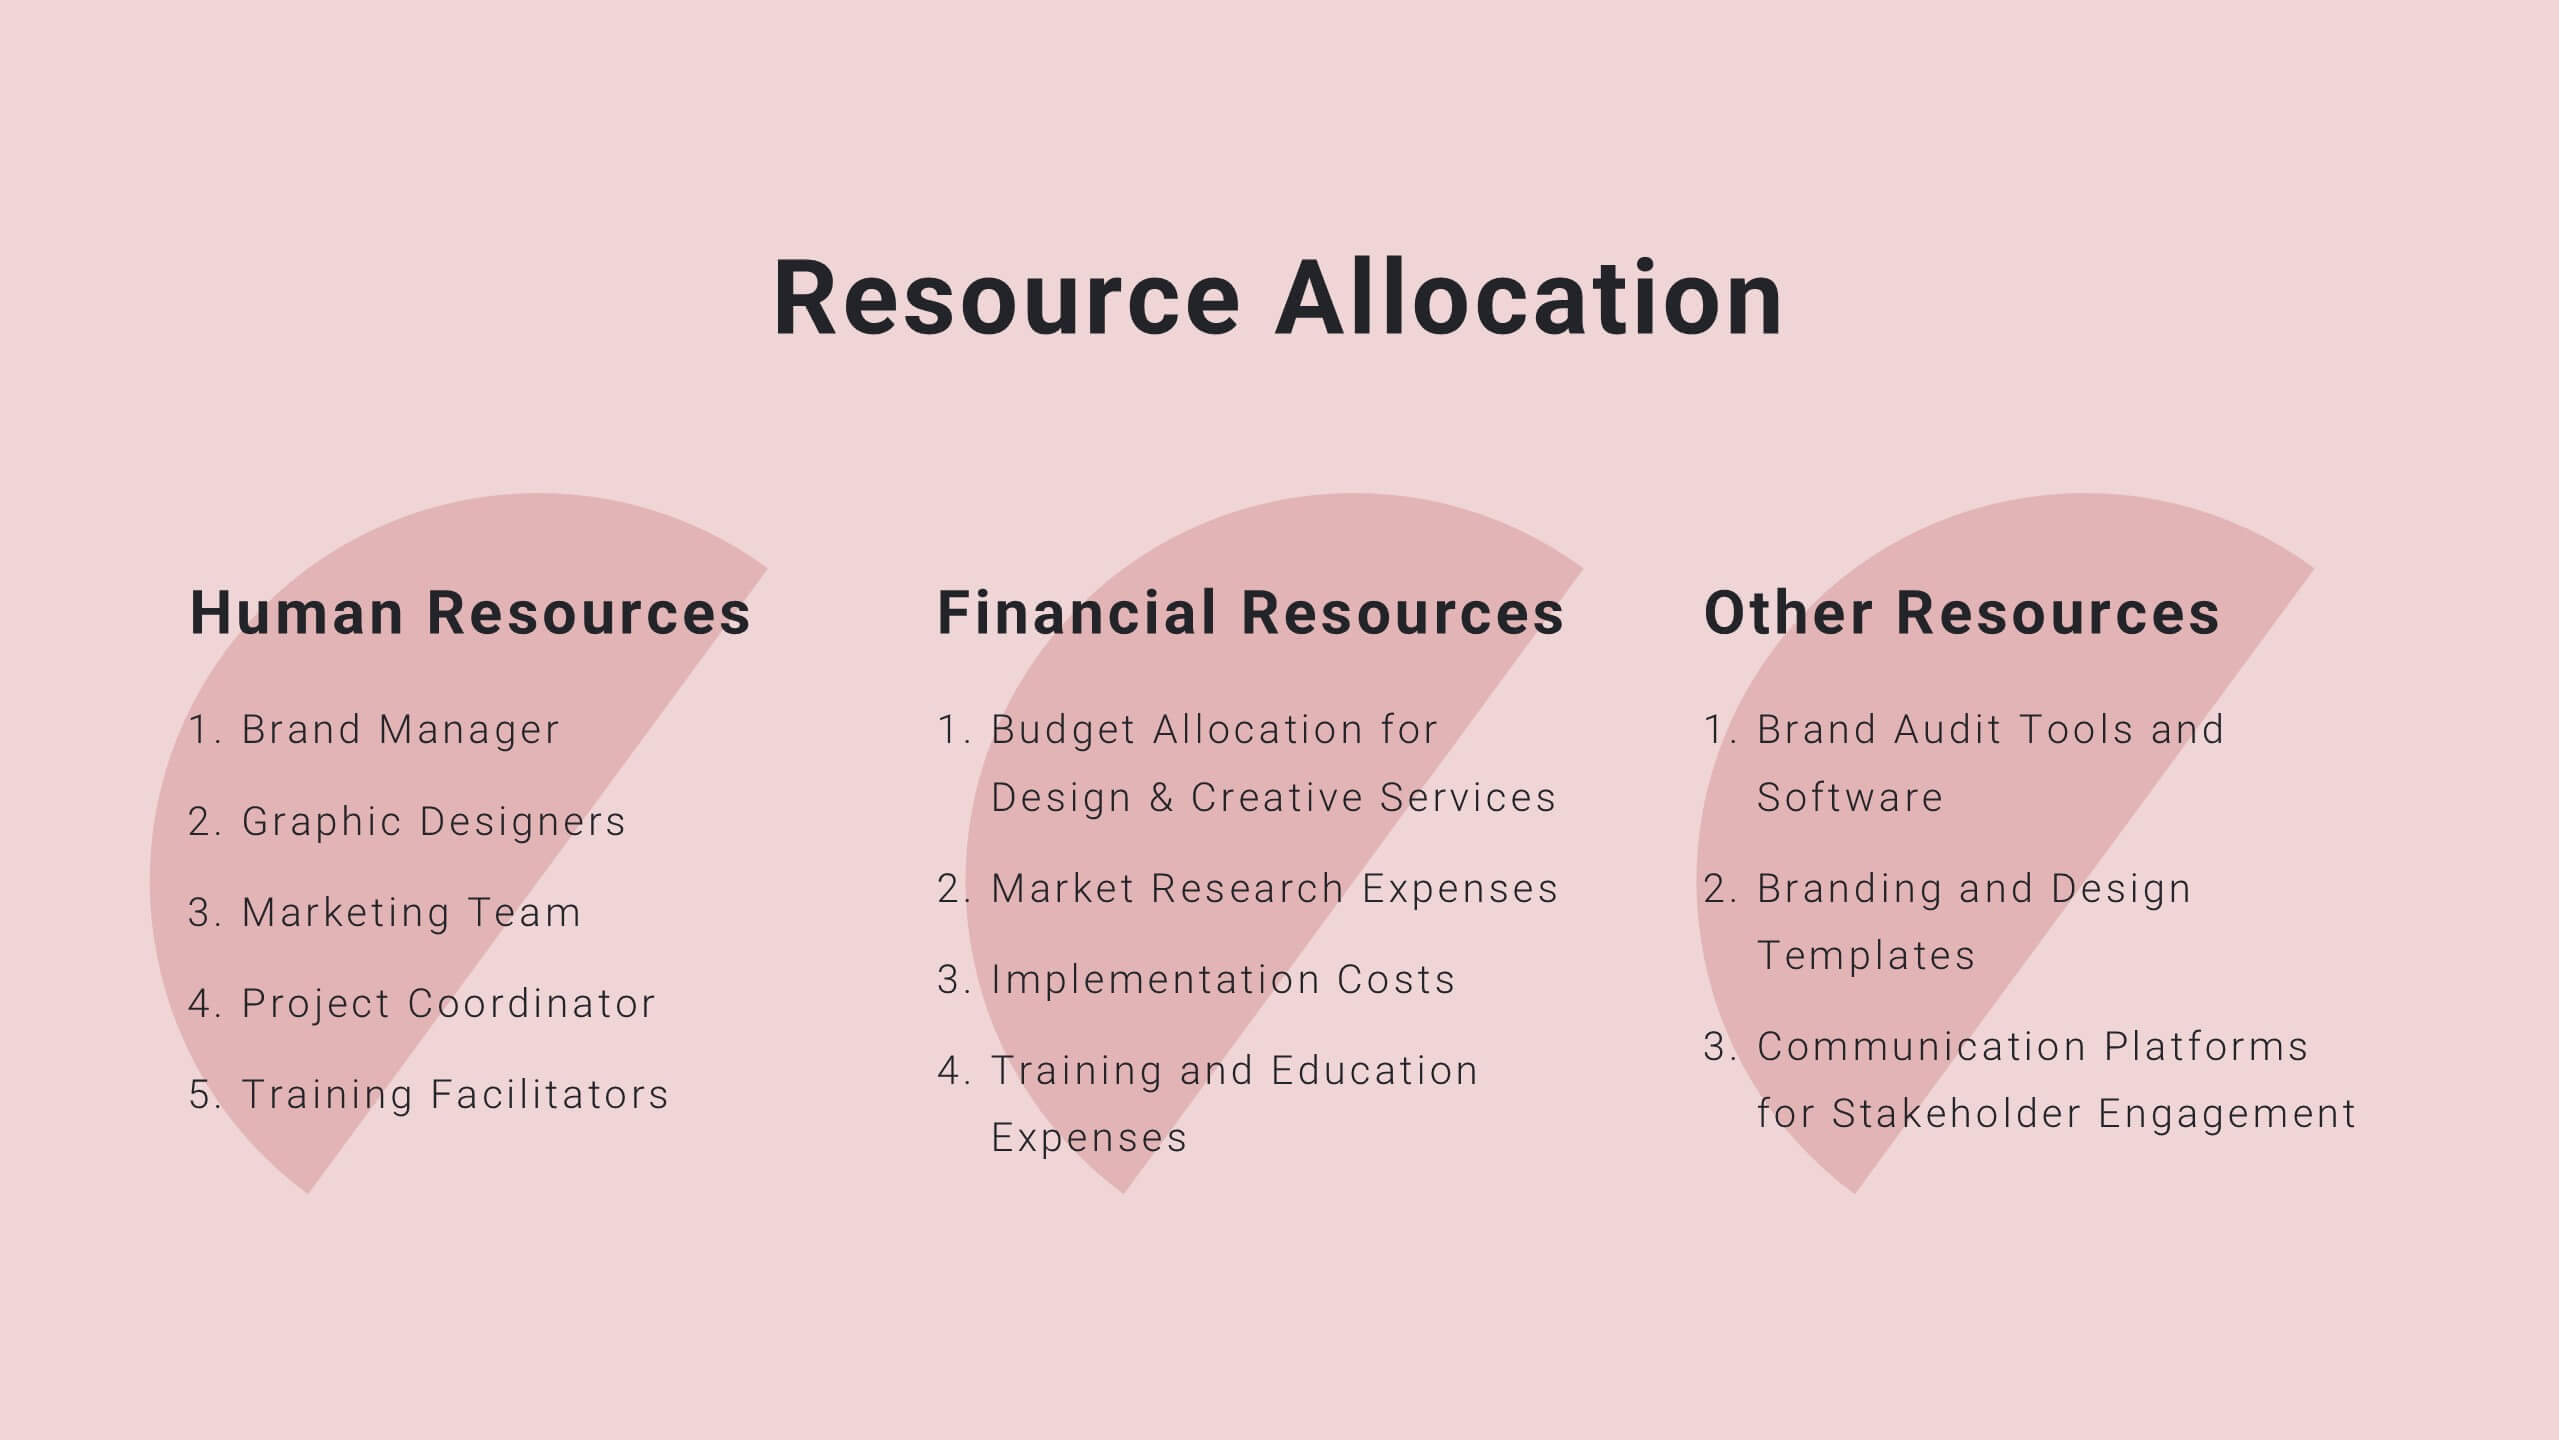
Present your project milestones and plan with clarity using this sleek project proposal template! It includes sections for objectives, timelines, budget breakdowns, and risk management. Perfect for organizing and presenting complex project plans, it’s fully customizable and compatible with PowerPoint, Keynote, and Google Slides, ensuring a professional presentation every time.


5 slides
Easy Asian Recipes Infographics
Asian cuisine is incredibly diverse and offers a wide range of delicious and flavorful recipes from various countries and regions. These vertical infographics are designed in a user-friendly design that showcase a collection of simple and delicious Asian recipes. These are perfect for home cooks, food bloggers, and anyone interested in exploring the flavors of Asian cuisine. These infographics include beautifully designed recipes for a variety of popular Asian dishes, such as ramen, teriyaki chicken, and more. Each recipe provides a list of ingredients needed and step-by-step instructions to guide users through the cooking process.


10 slides
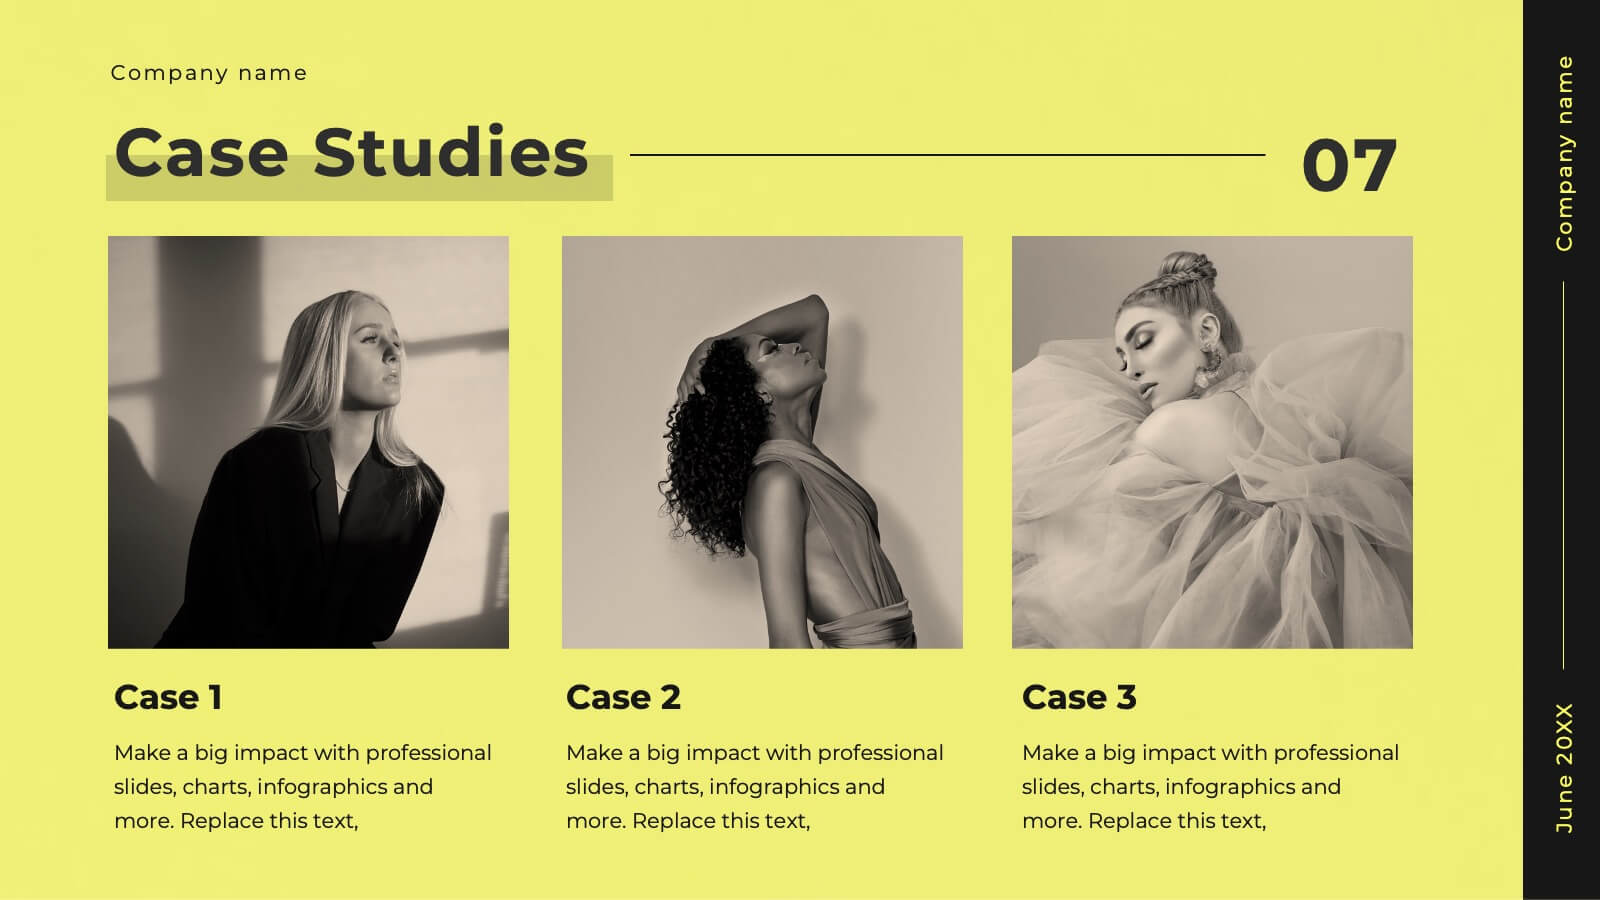
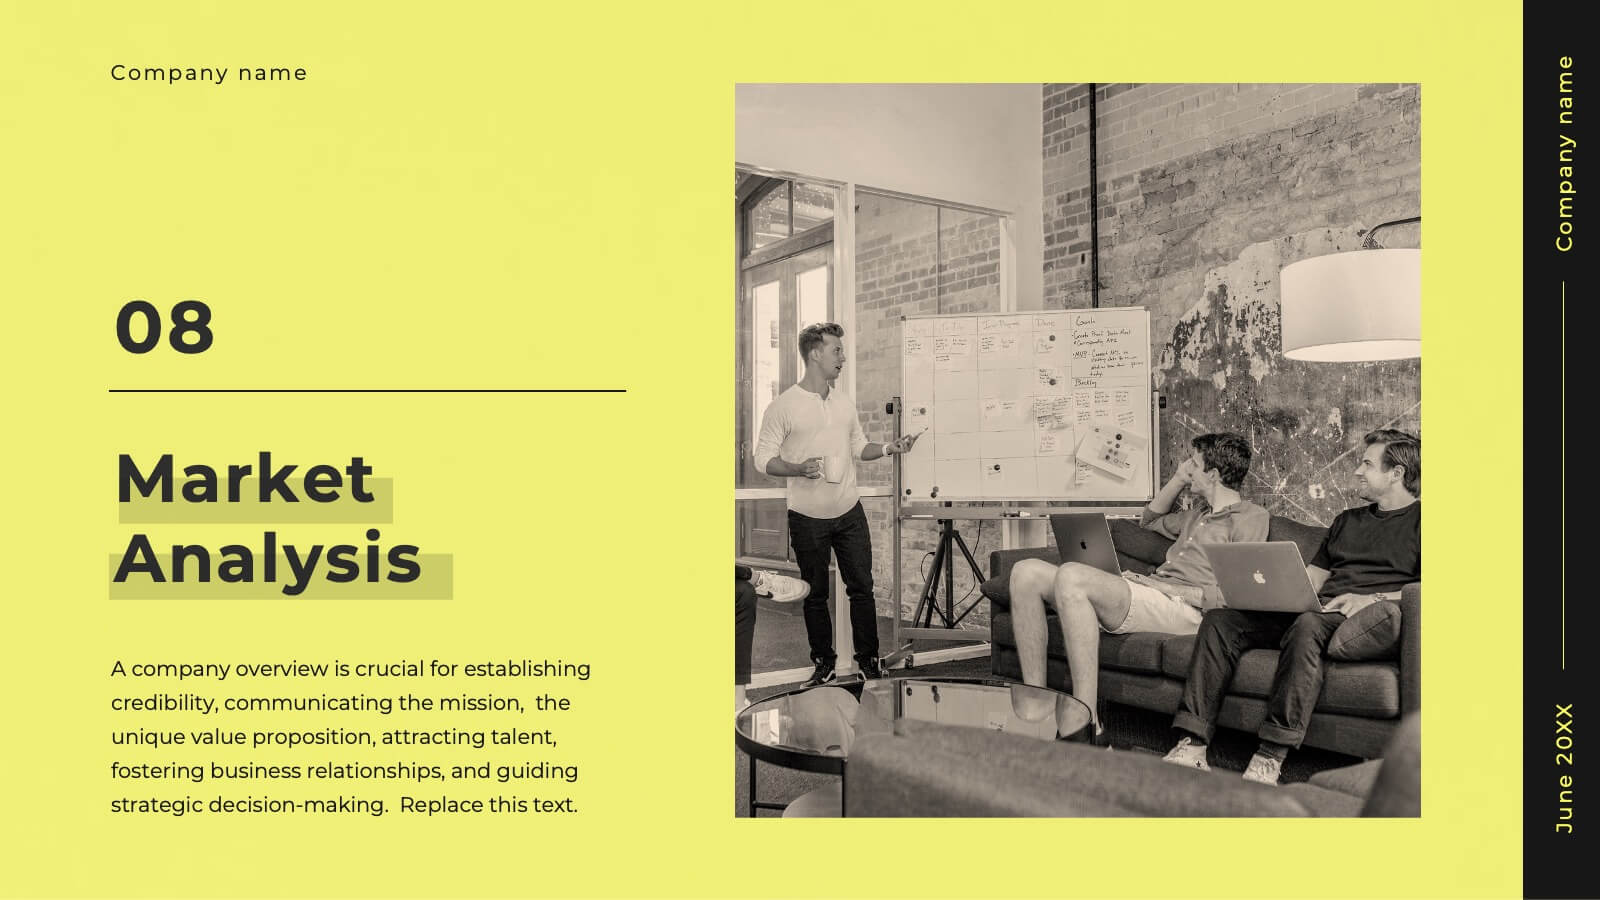
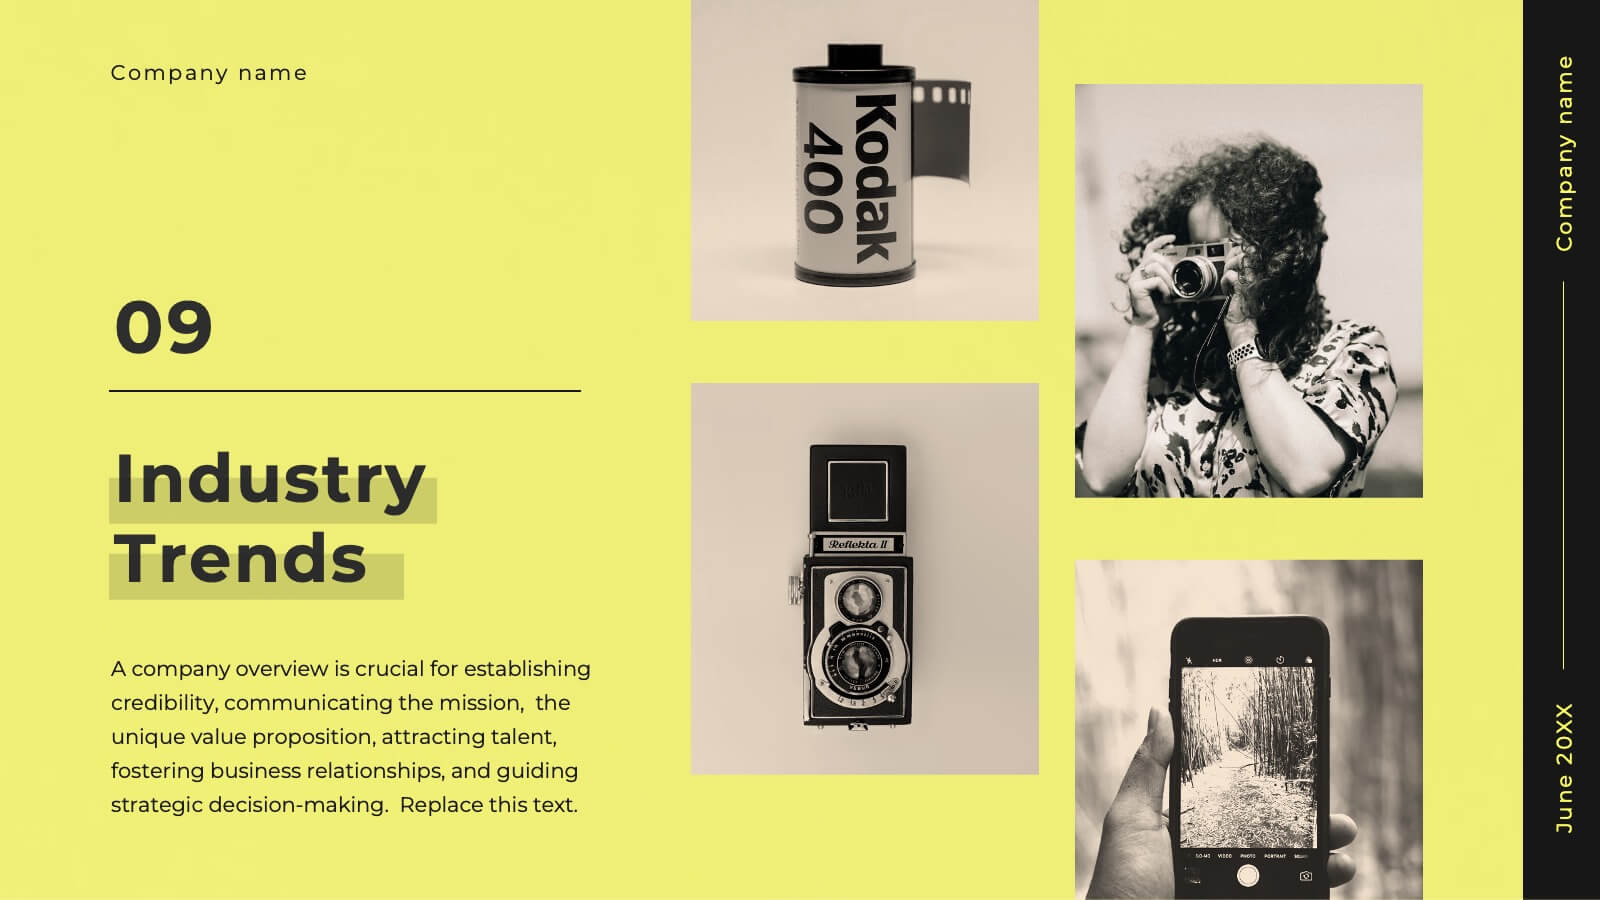
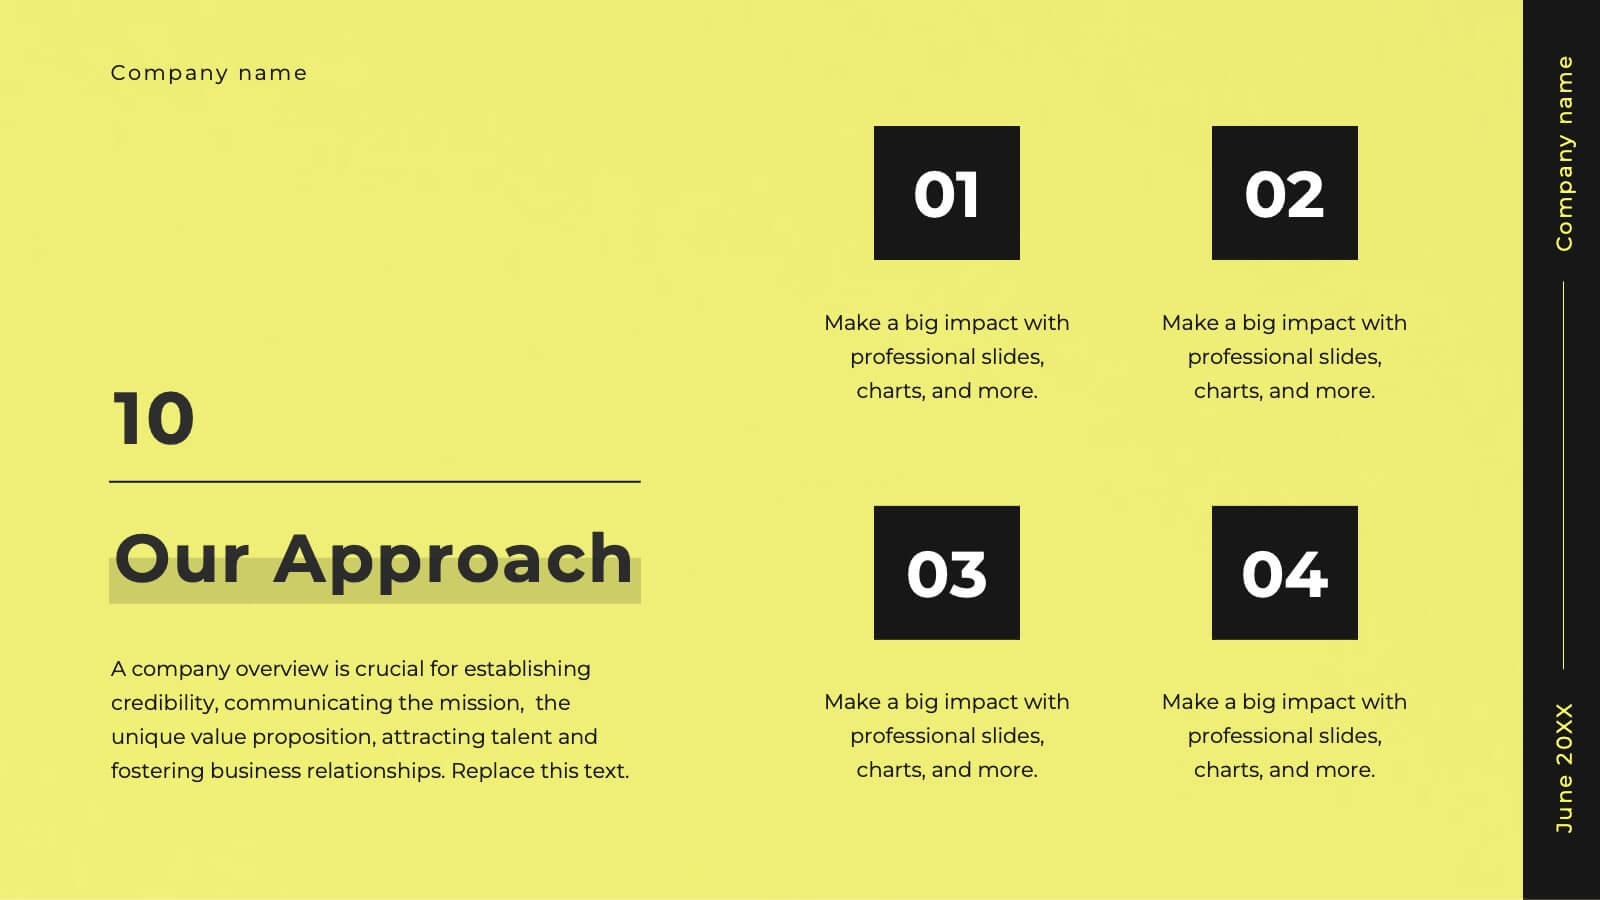
Success Stories and Case Findings Presentation
Celebrate achievements with clarity using the Success Stories and Case Findings Presentation. Featuring a vertical trophy infographic layout, this template allows you to present up to 5 milestones, results, or insights in a visually rewarding format. Ideal for showcasing progress, case highlights, or performance wins. Fully editable in PowerPoint, Keynote, and Google Slides.


6 slides
Home Security Infographics
Enhance your home security awareness with our Home Security infographic template. This template is fully compatible with popular presentation software like PowerPoint, Keynote, and Google Slides, allowing you to easily customize it to illustrate and communicate various aspects of home security measures and best practices. The Home Security infographic template offers a visually engaging platform to outline home security strategies, including alarm systems, surveillance, access control, and safety tips. Whether you're a homeowner, security professional, or simply interested in safeguarding your property and loved ones, this template provides a user-friendly canvas to create informative presentations and educational materials. Optimize your home security with this SEO-optimized Home Security infographic template, thoughtfully designed for clarity and ease of use. Customize it to showcase security device options, safety checklists, emergency procedures, and the importance of a secure home environment, ensuring that your audience gains valuable insights into this critical aspect of personal safety. Start crafting your personalized infographic today to bolster your home security knowledge and practices.

22 slides
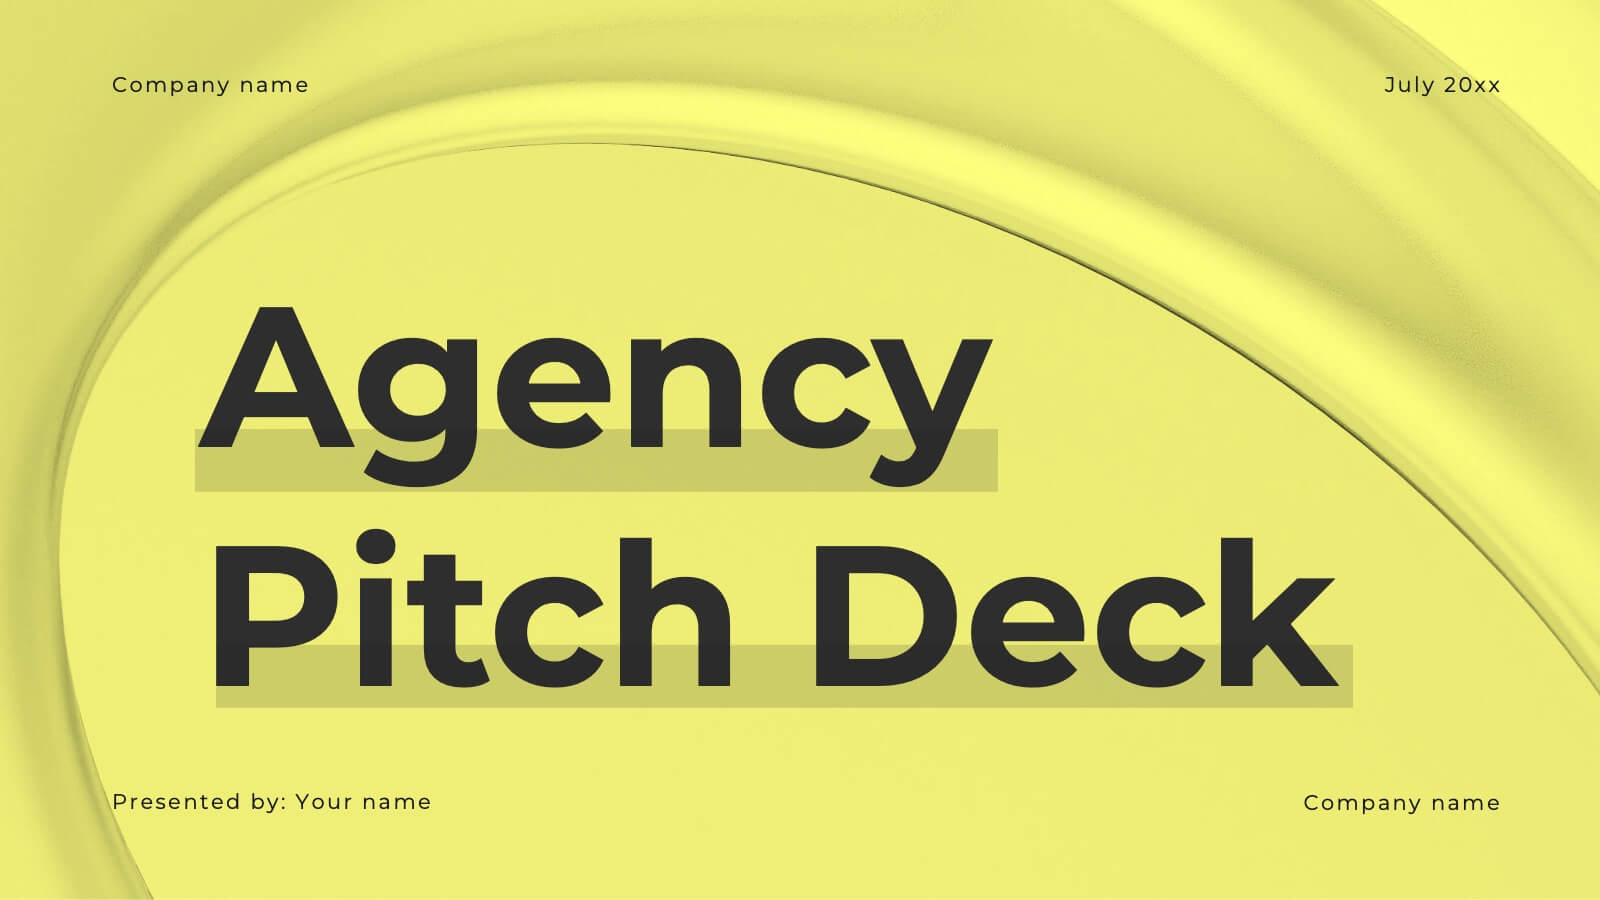
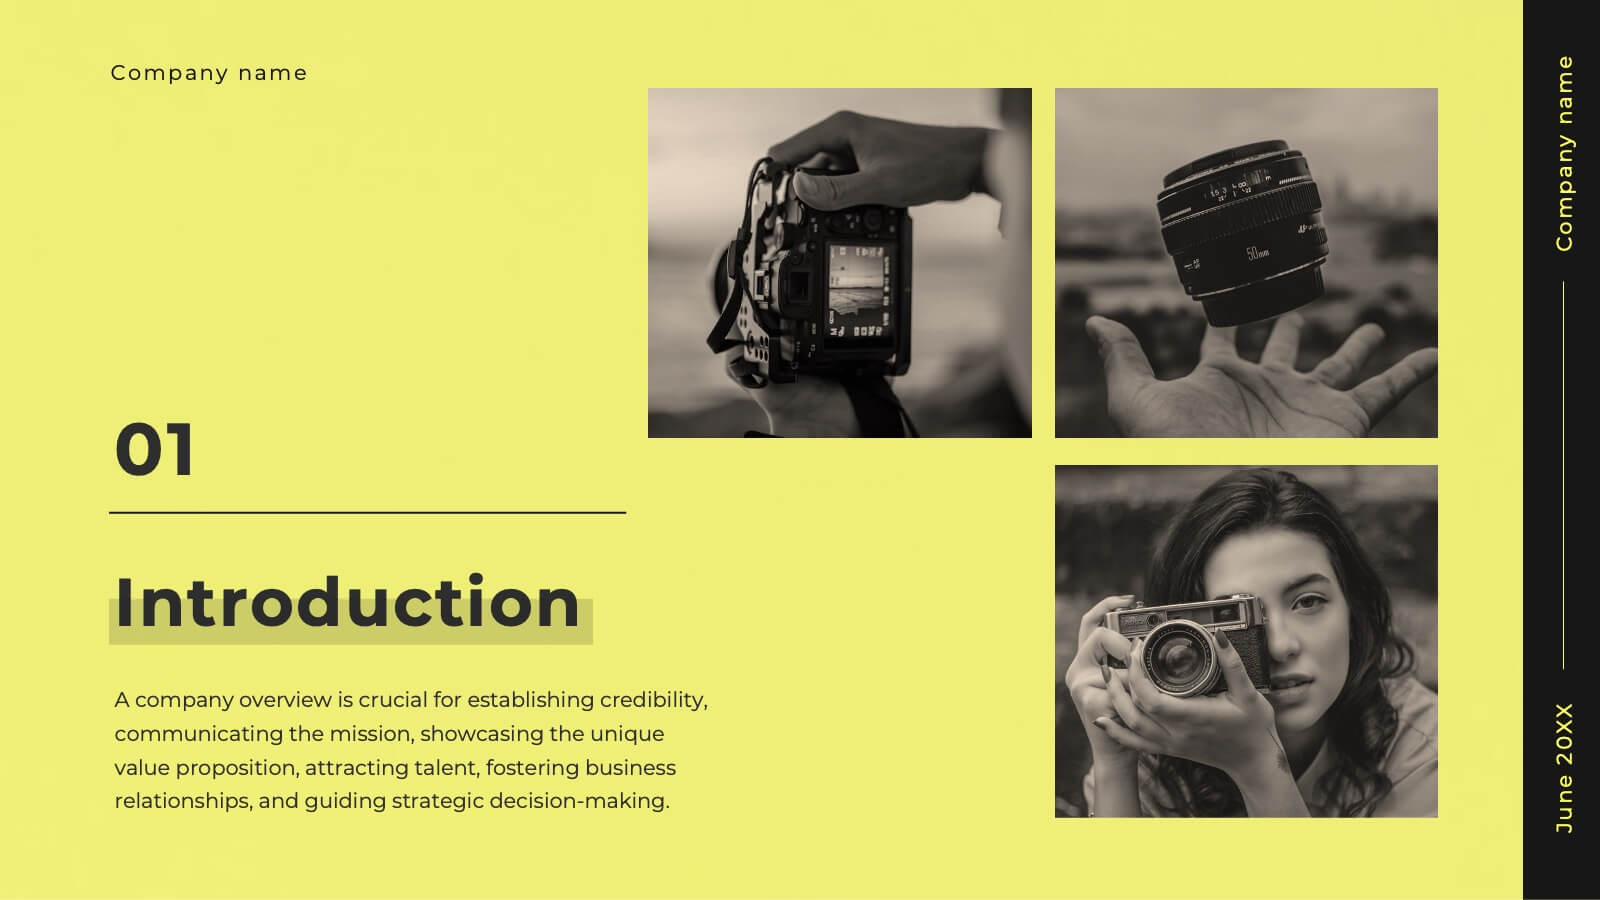
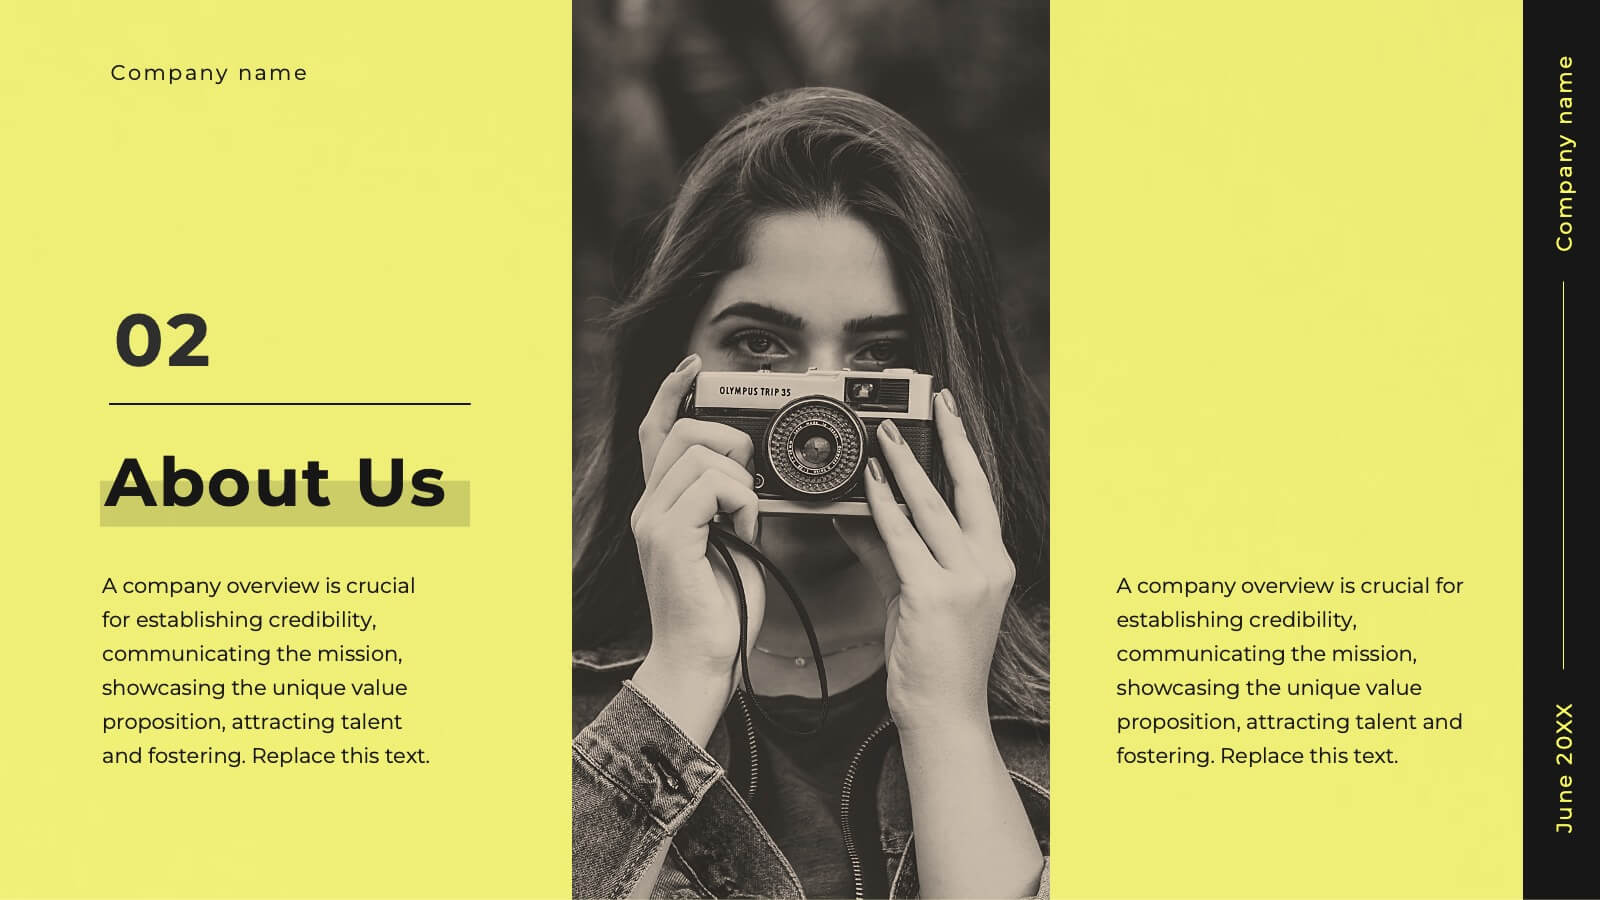
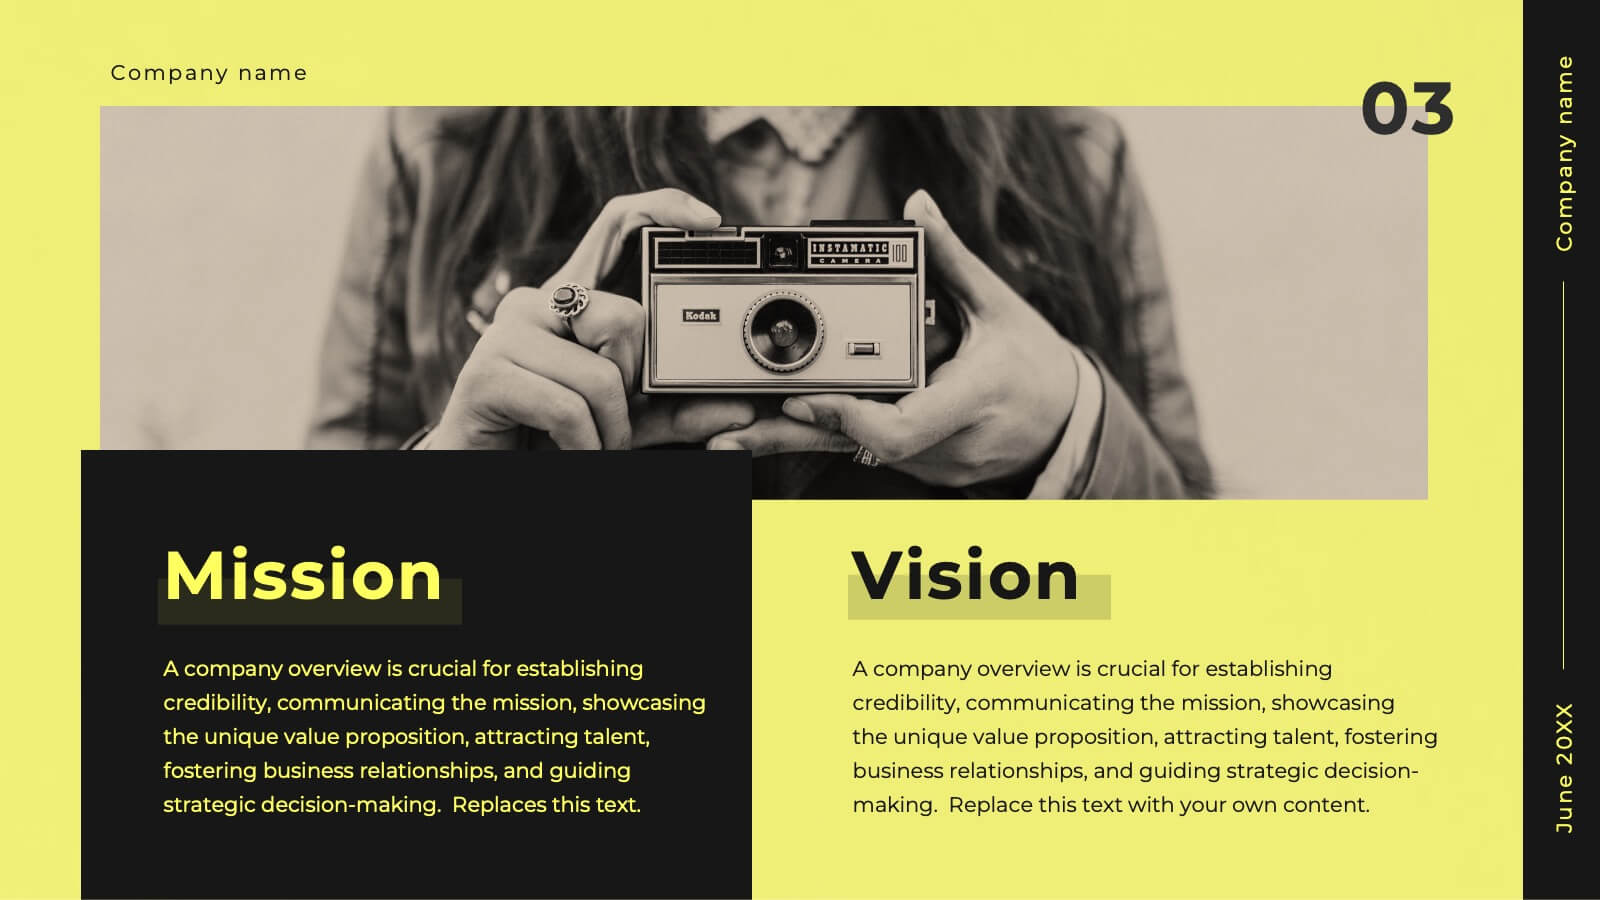
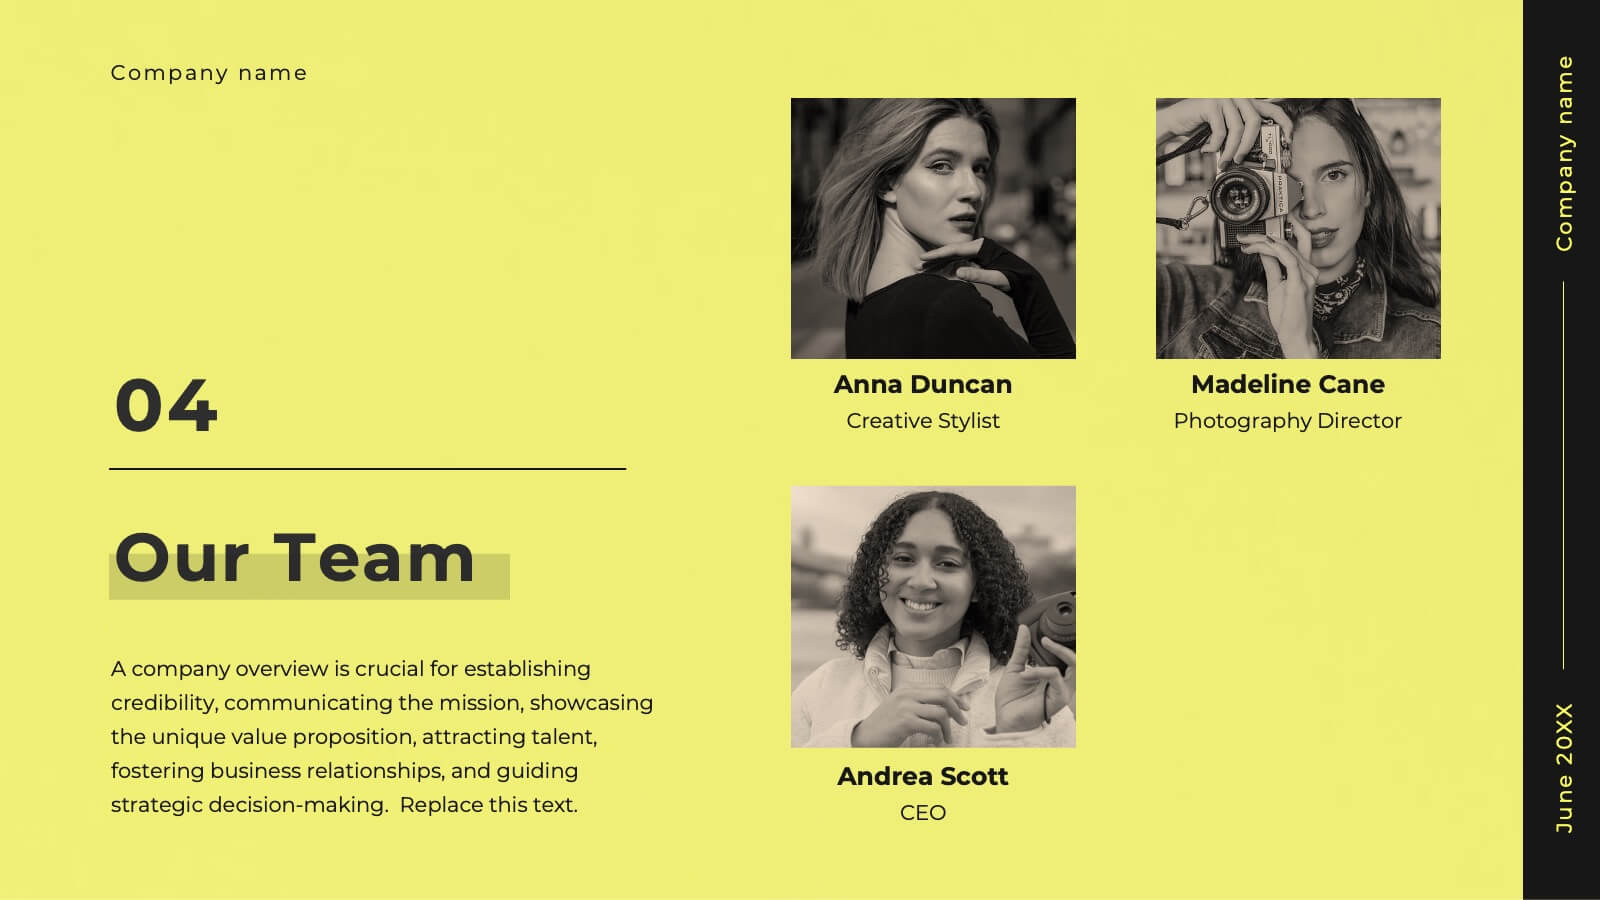
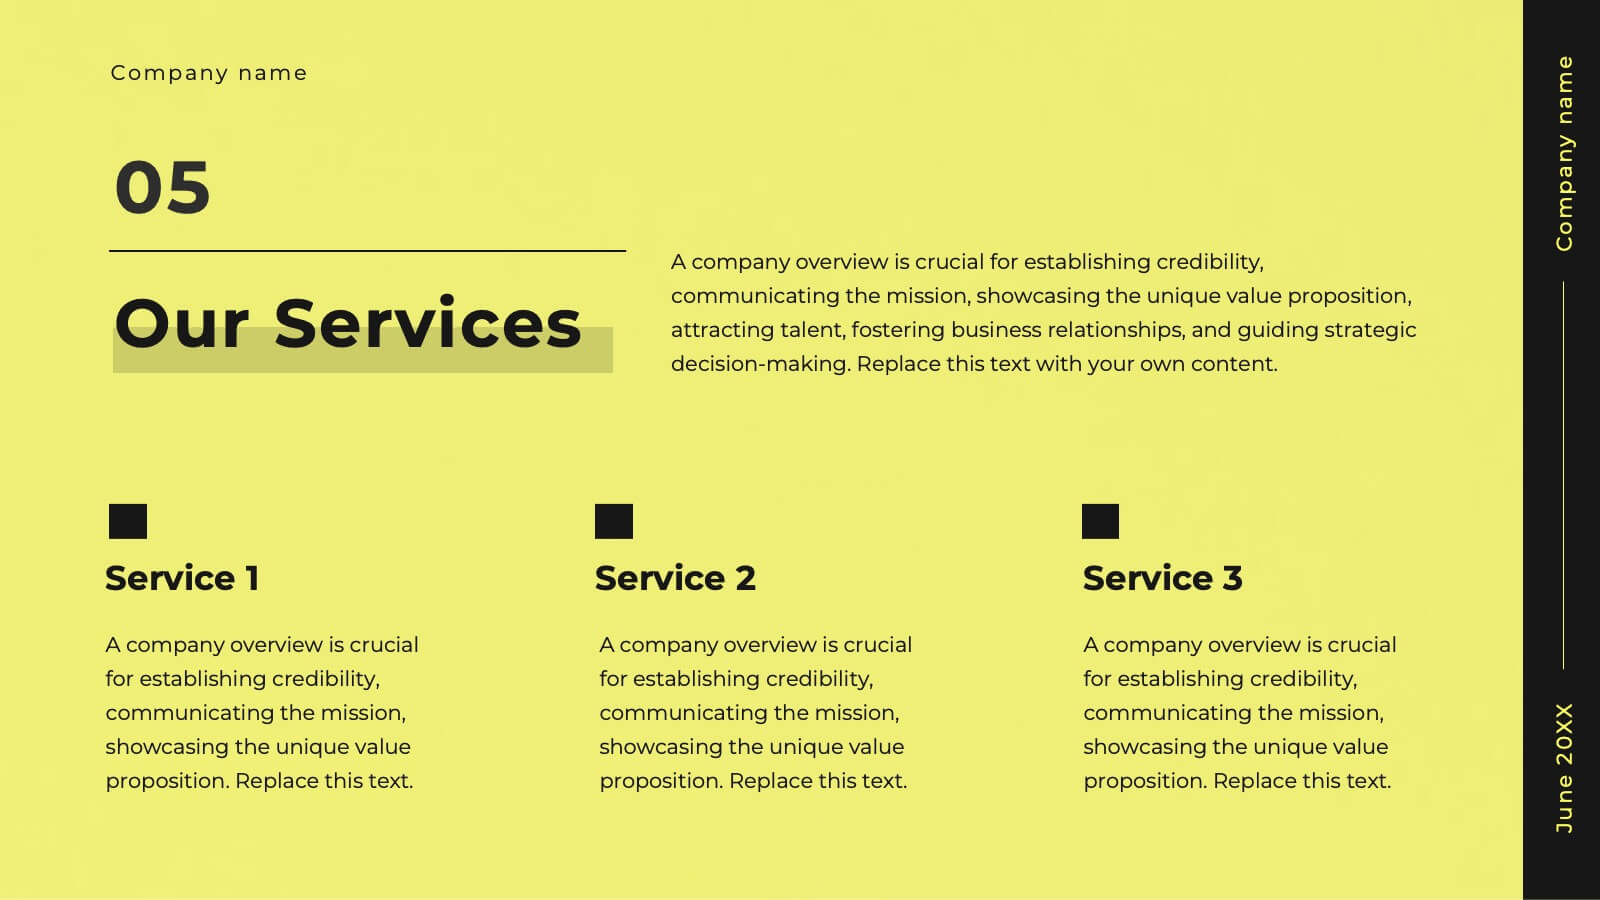
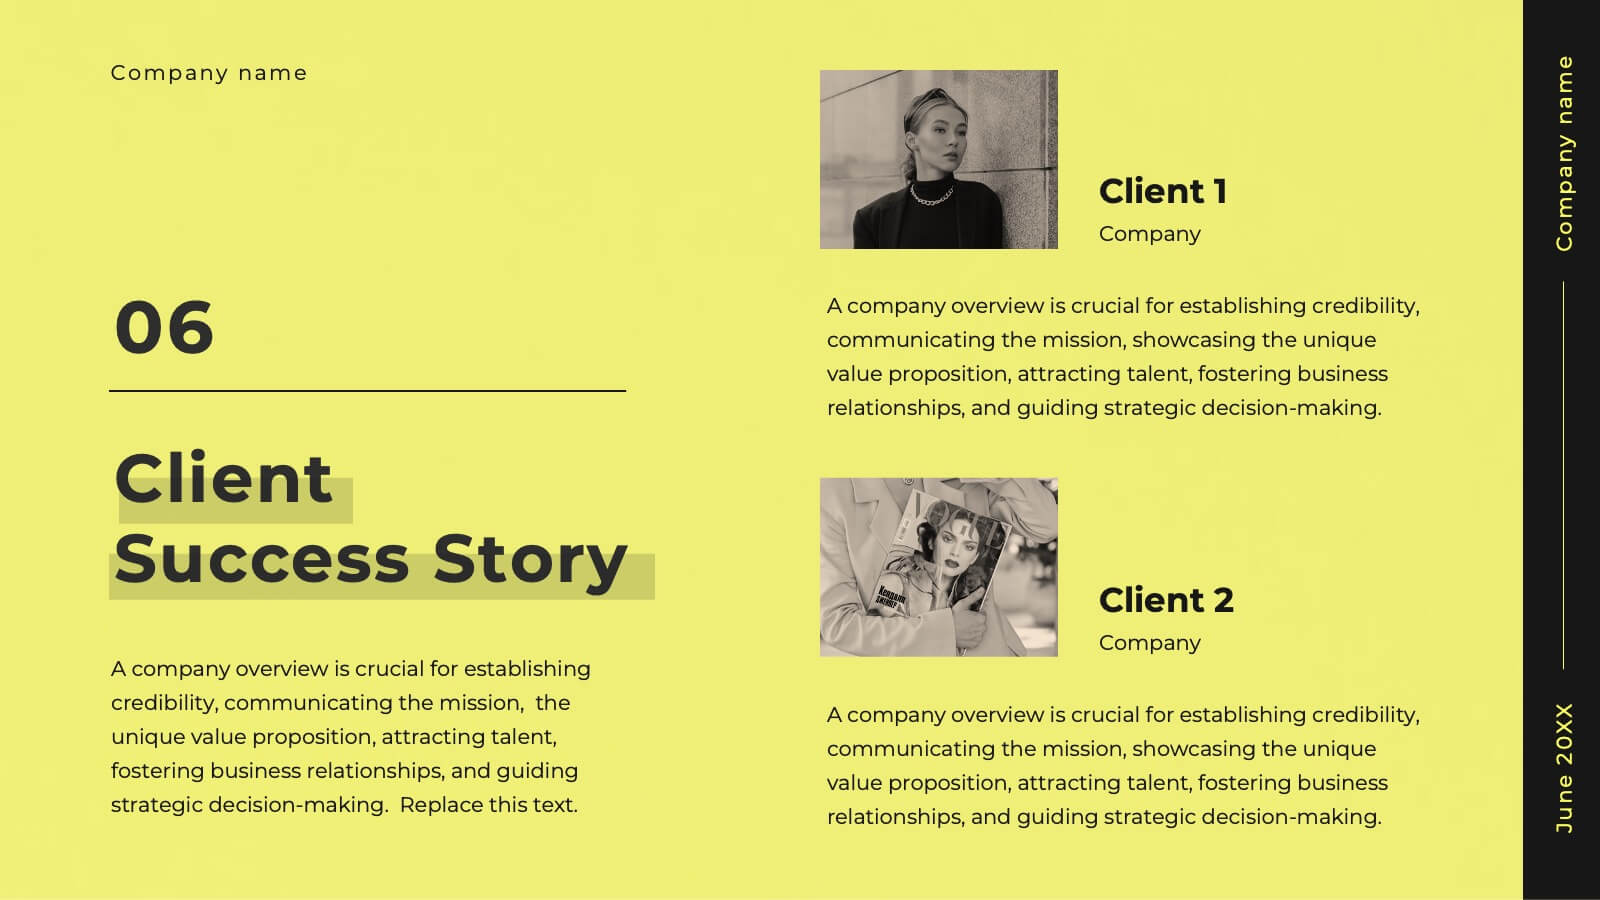
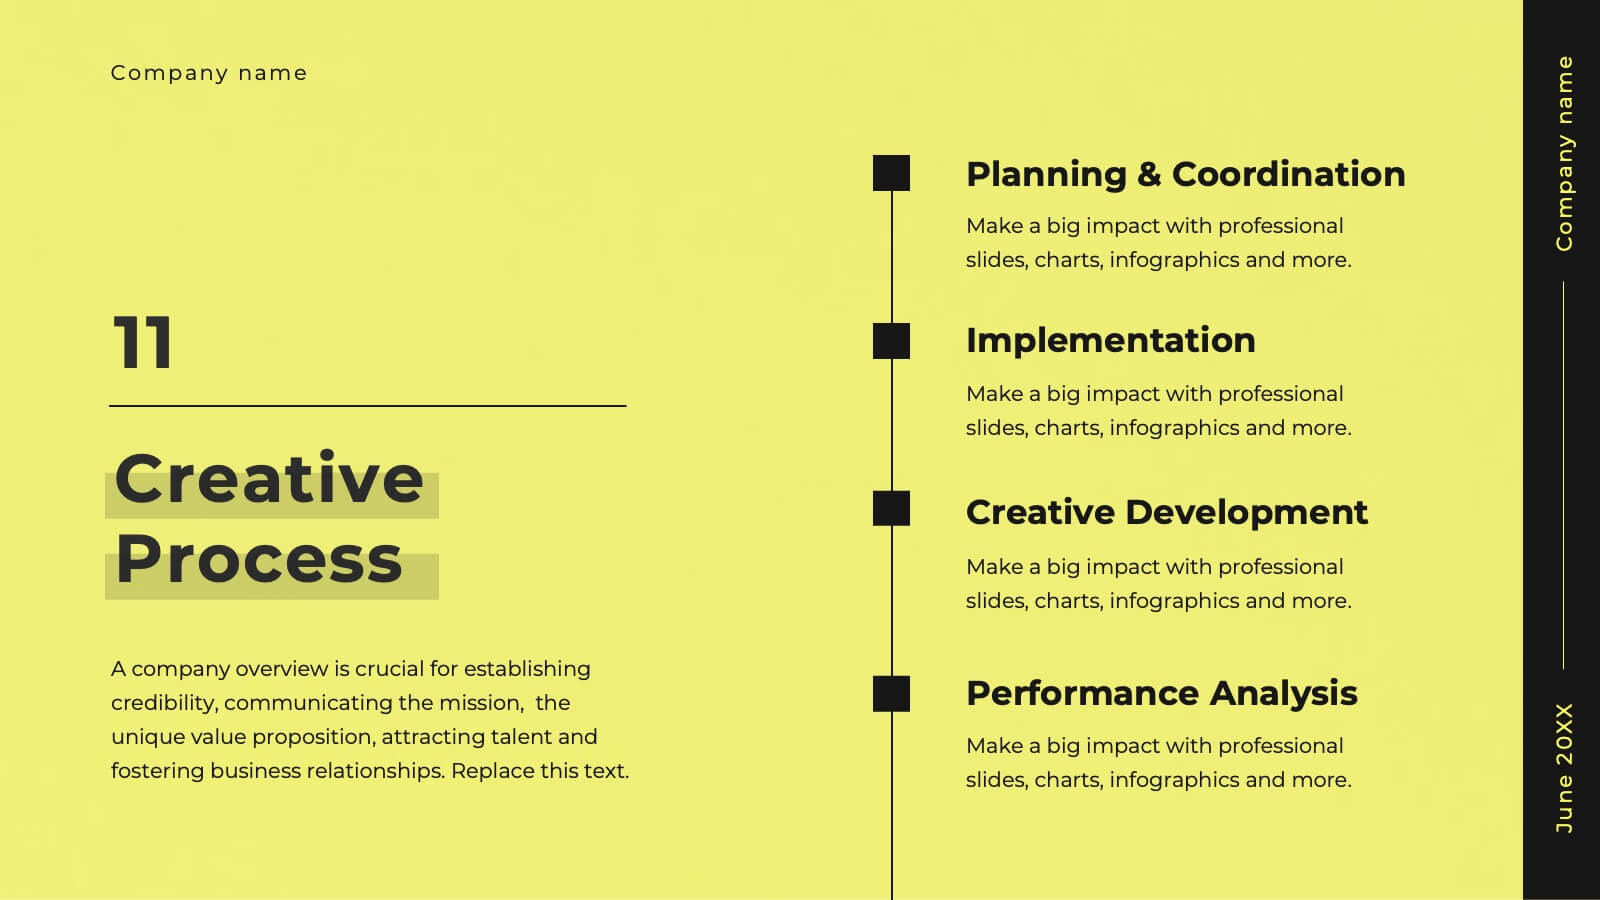
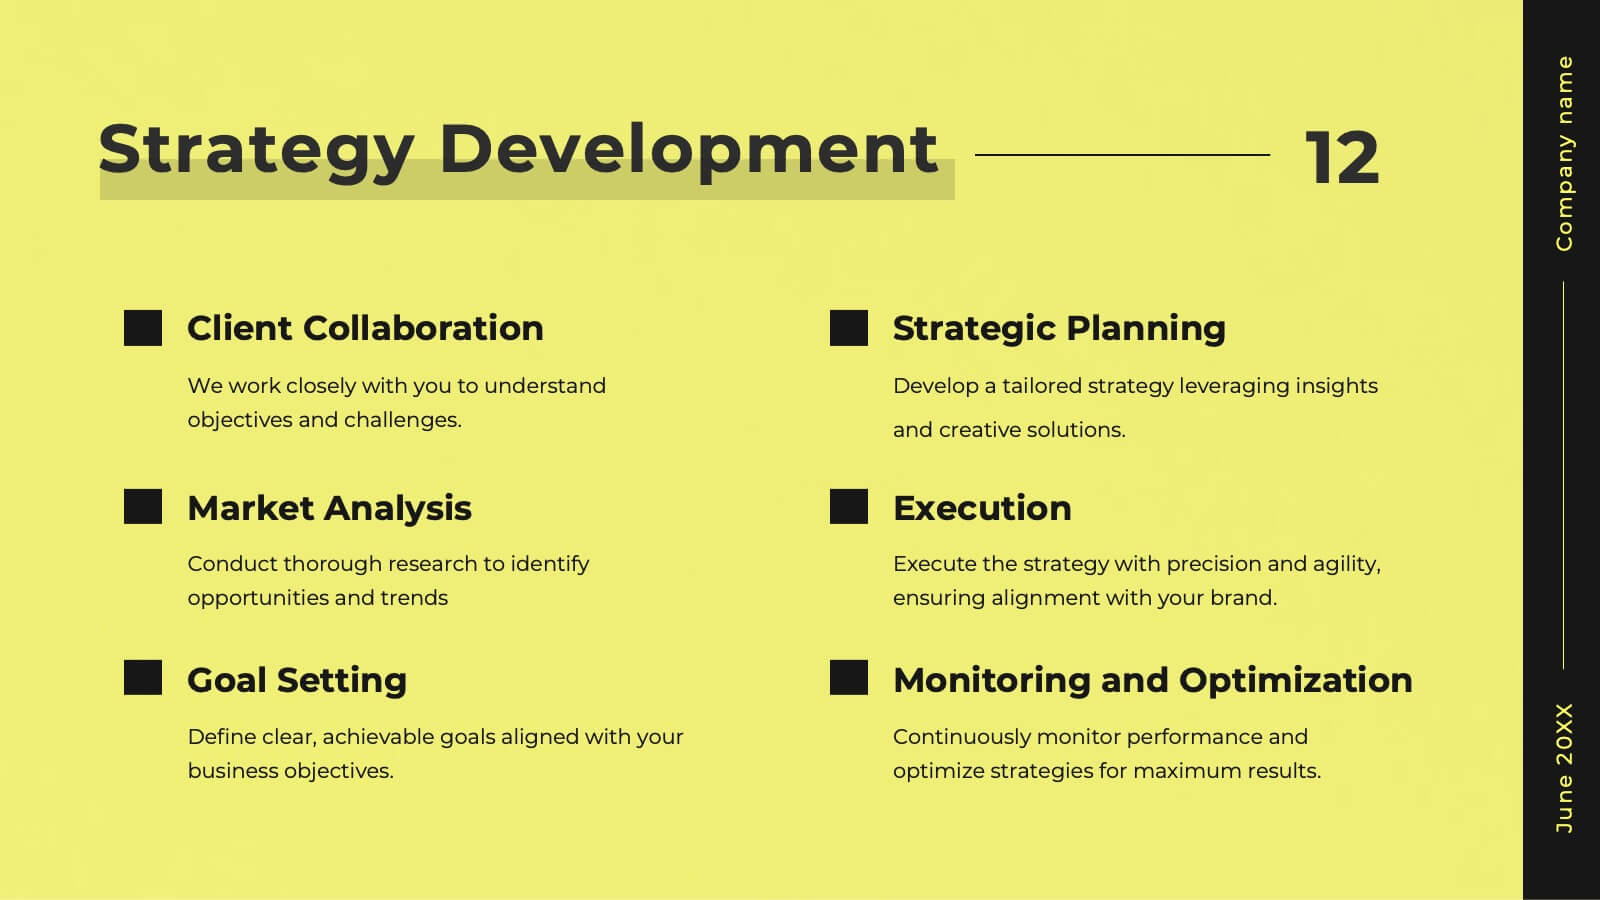
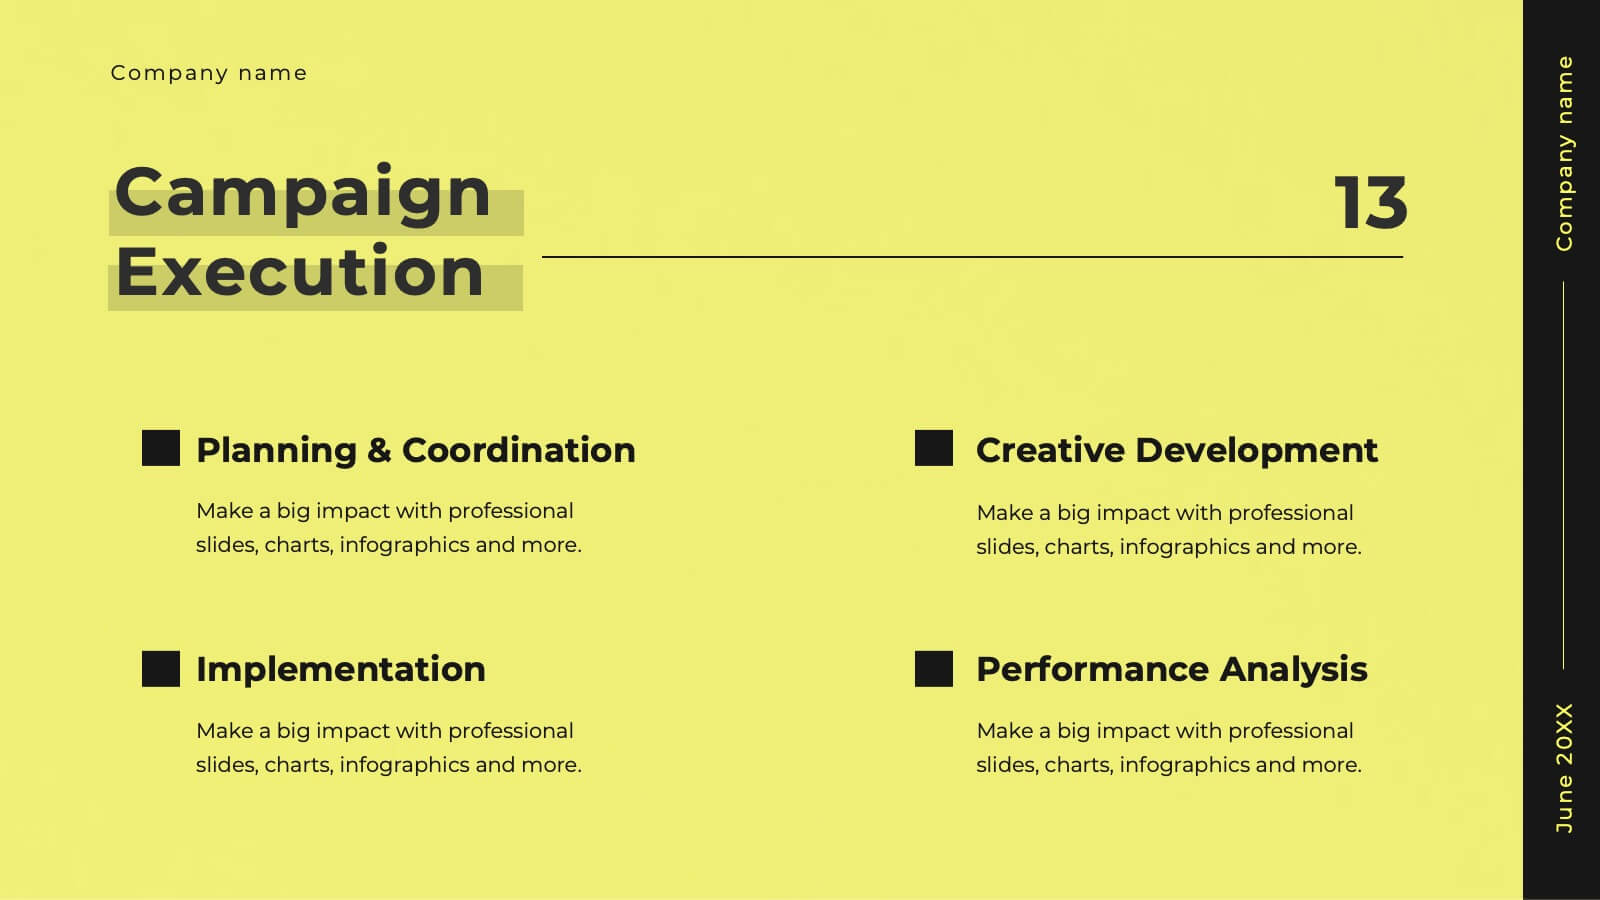
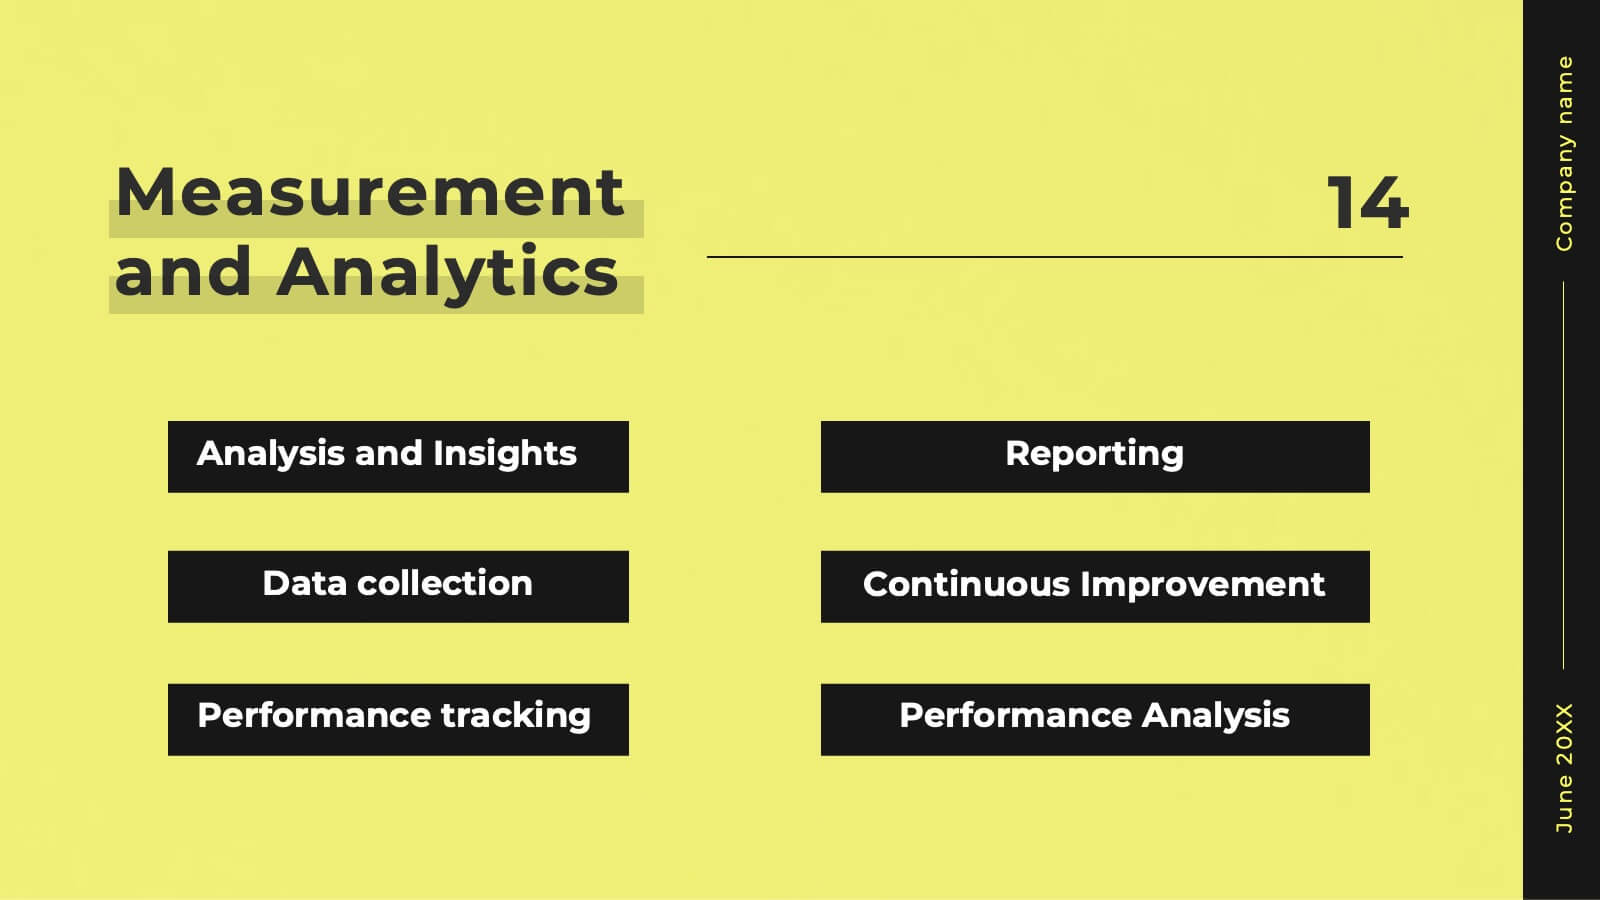
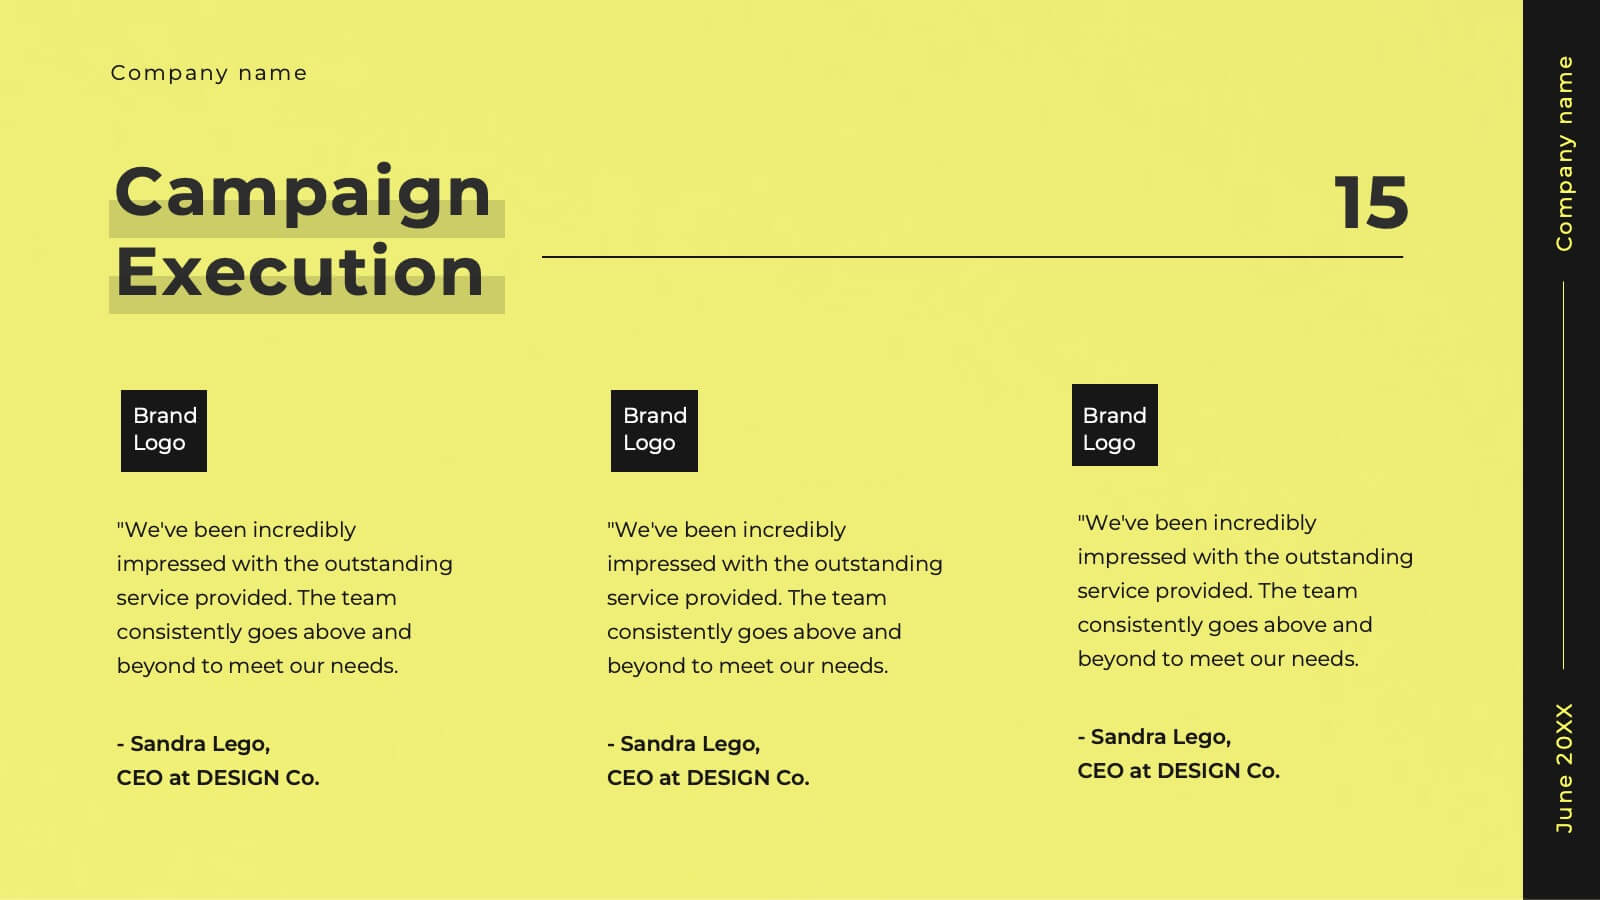
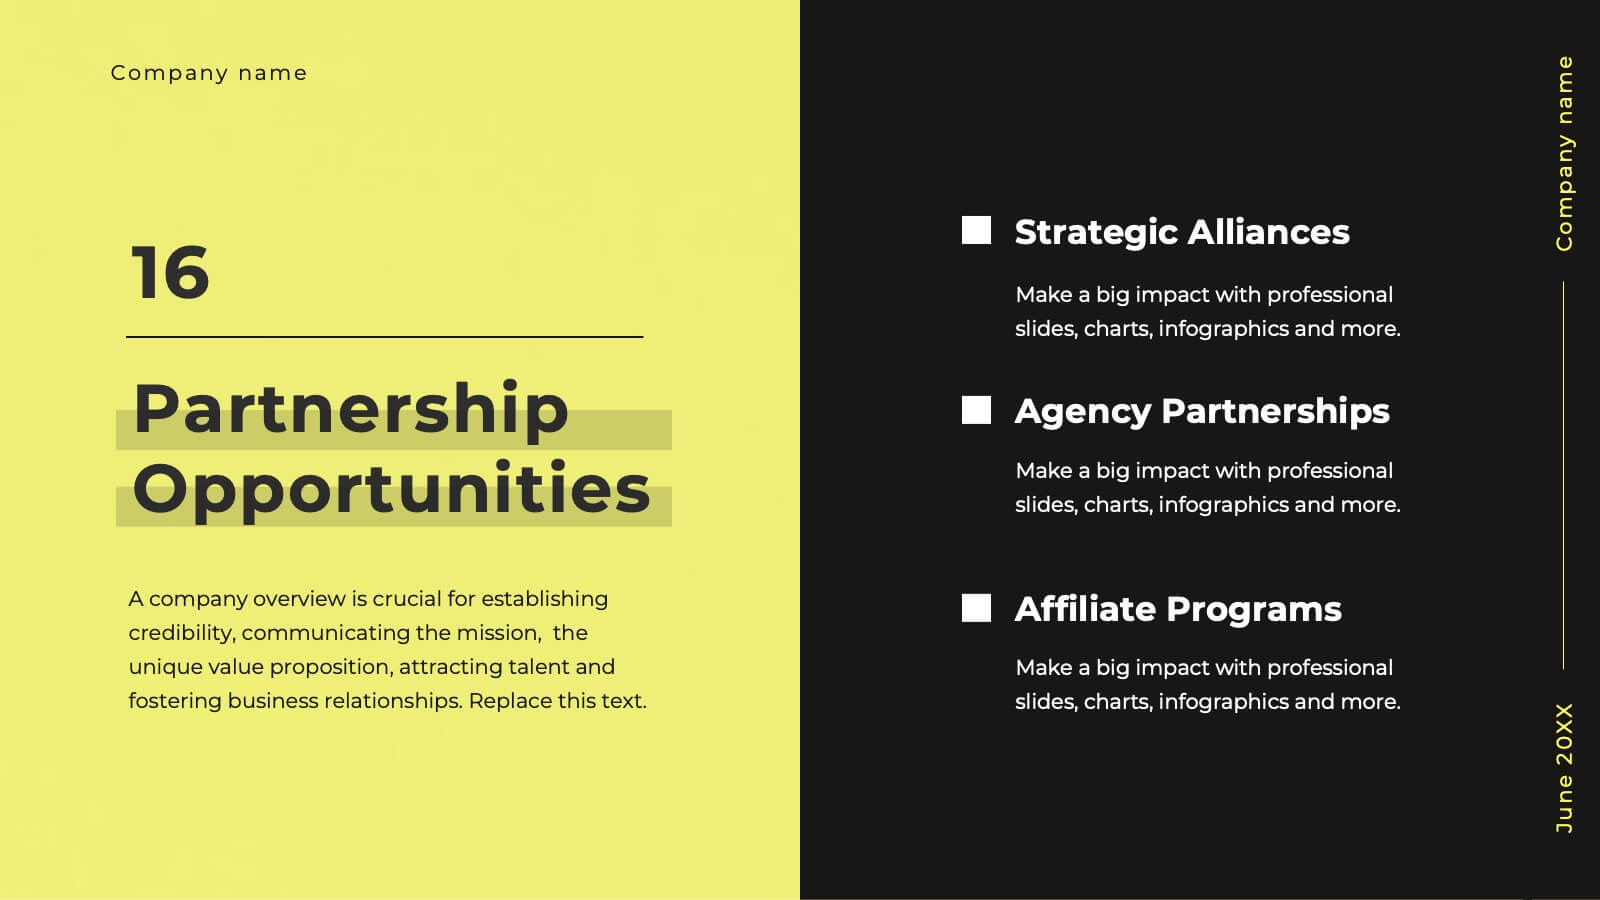
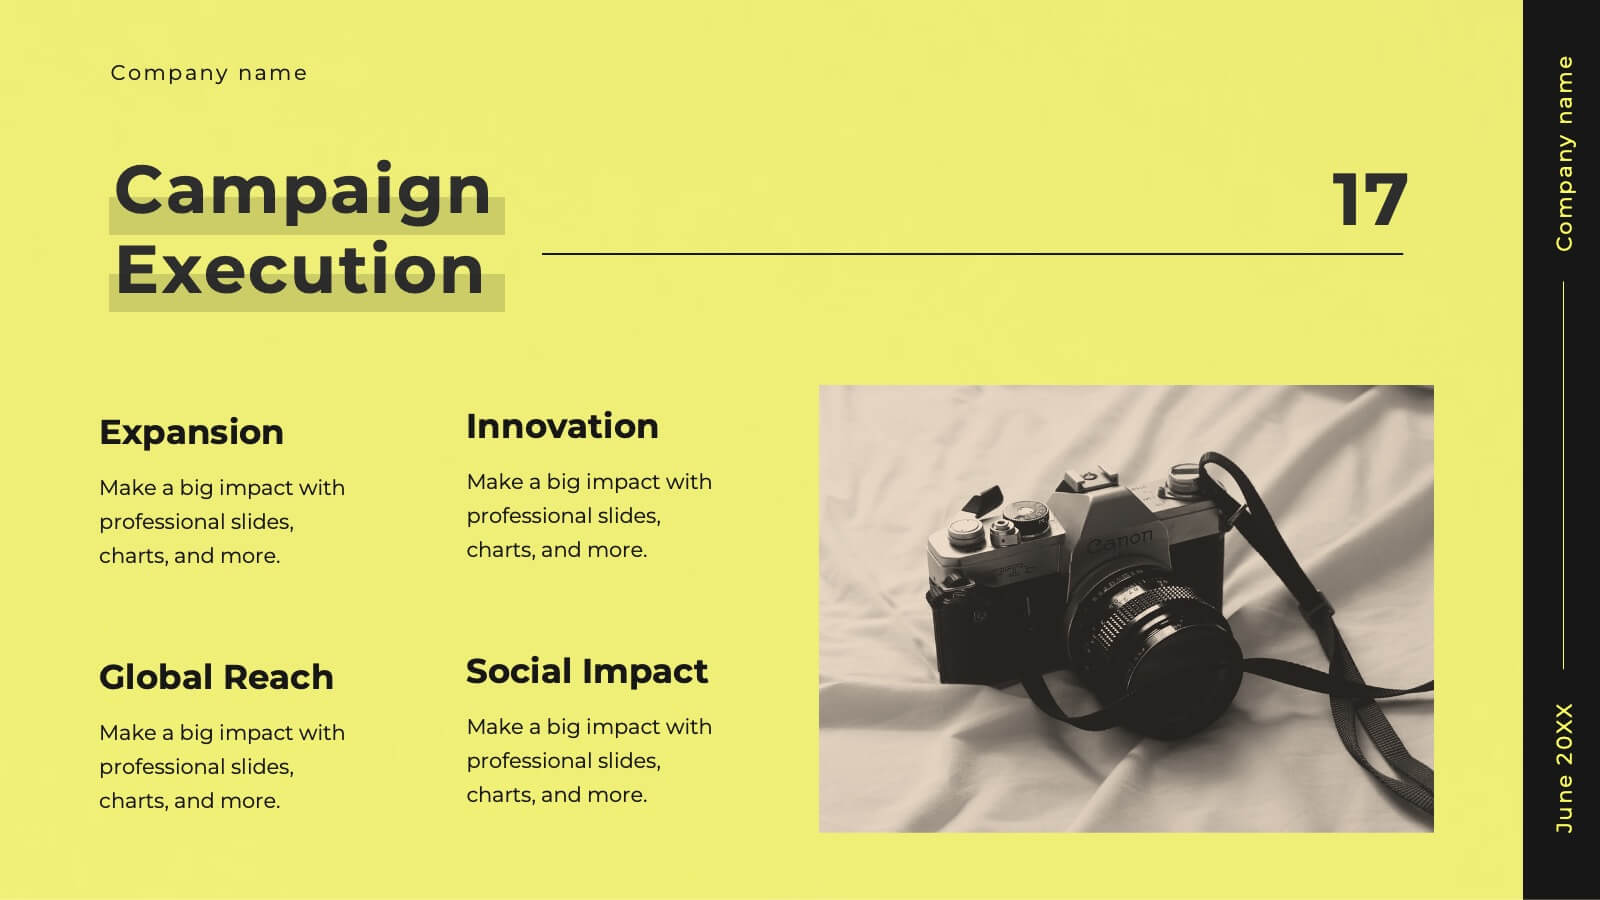
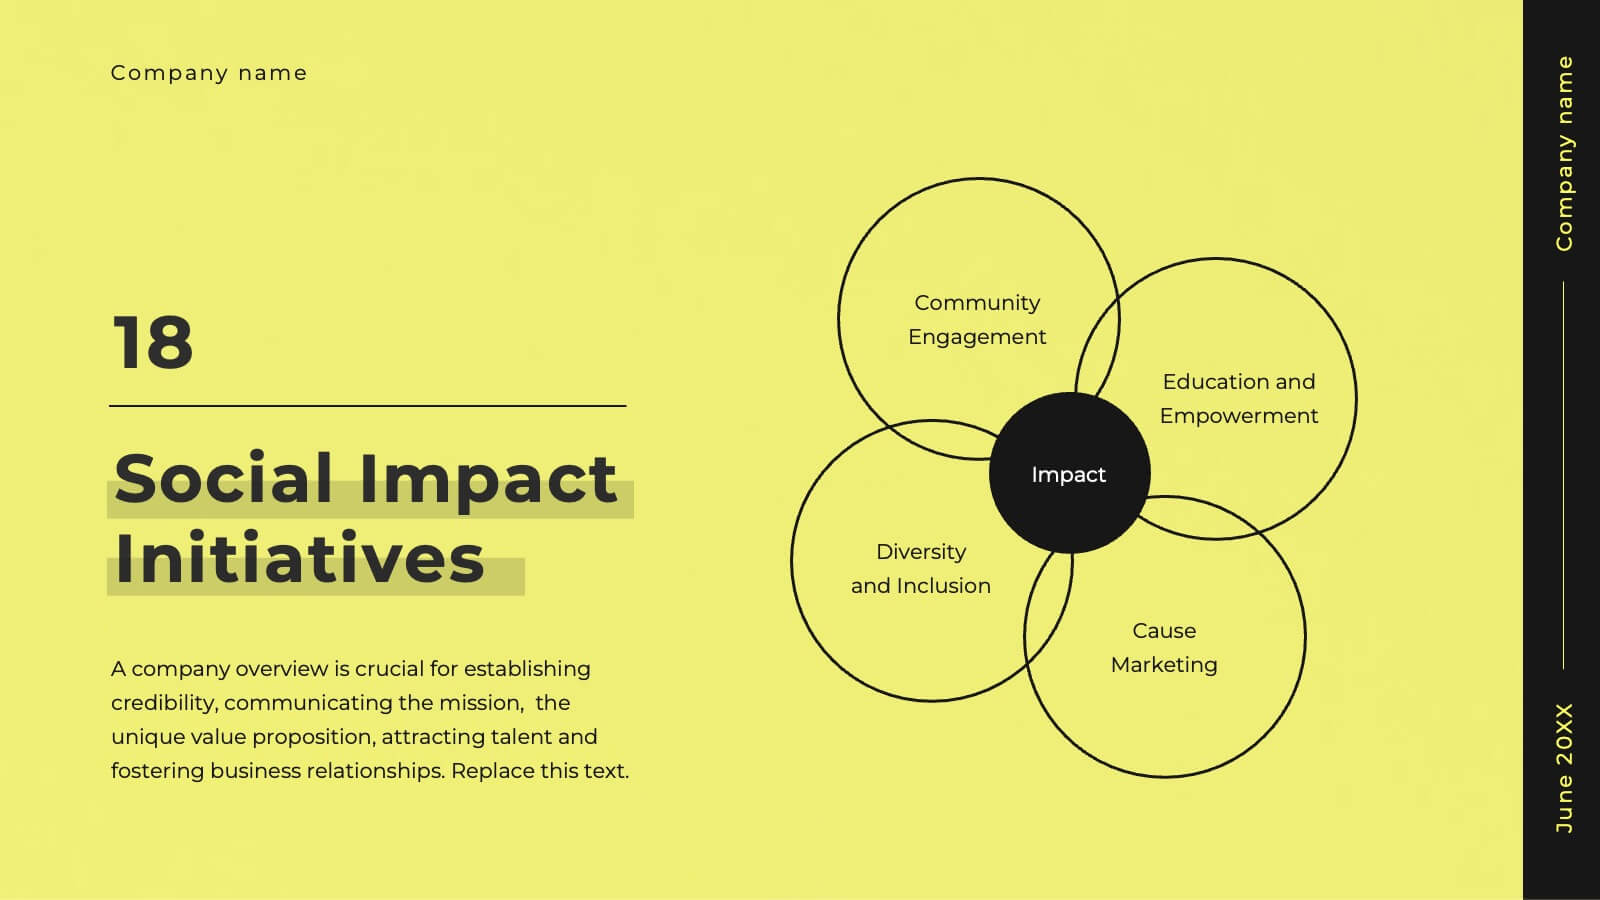
Glimmer Creative Agency Pitch Deck Presentation
Step up your game with this vibrant agency pitch deck template! Ideal for showcasing your services, client success stories, and strategic approach, it includes dynamic slides for market analysis and campaign execution. Engage potential clients with compelling visuals and well-organized content. Compatible with PowerPoint, Keynote, and Google Slides for a smooth presentation experience on any platform.


8 slides
Task Management Process Presentation
Bring clarity and momentum to every workflow with this clean, step-by-step layout designed to break down tasks, handoffs, and progress stages. This presentation helps teams visualize responsibilities and streamline execution with ease. Fully customizable and ready to use in PowerPoint, Keynote, and Google Slides.


20 slides
Astrolight Startup Growth Plan Presentation
A modern and vibrant presentation template tailored for startups. It includes slides for business models, growth plans, competitive analysis, and financial overviews. The visually appealing layout ensures clarity and impact for stakeholders. Fully customizable and compatible with PowerPoint, Keynote, and Google Slides for seamless adaptability.


5 slides
Strategic Roadmap with Milestone Tracks
Chart your progress with clarity using the Strategic Roadmap with Milestone Tracks Presentation. This visual template showcases a dotted milestone path connecting key yearly events or business phases—perfect for illustrating timelines, strategic goals, and transformation journeys. Fully editable in PowerPoint, Keynote, and Google Slides.


6 slides
Industry Analysis Porter's 5 Forces Presentation
Analyze industry competition with this Porter's Five Forces template! This structured layout visually breaks down key factors like buyer power, supplier influence, competitive rivalry, new market entrants, and substitution threats, making it ideal for strategic planning and market assessments. Fully customizable and compatible with PowerPoint, Keynote, and Google Slides.


4 slides
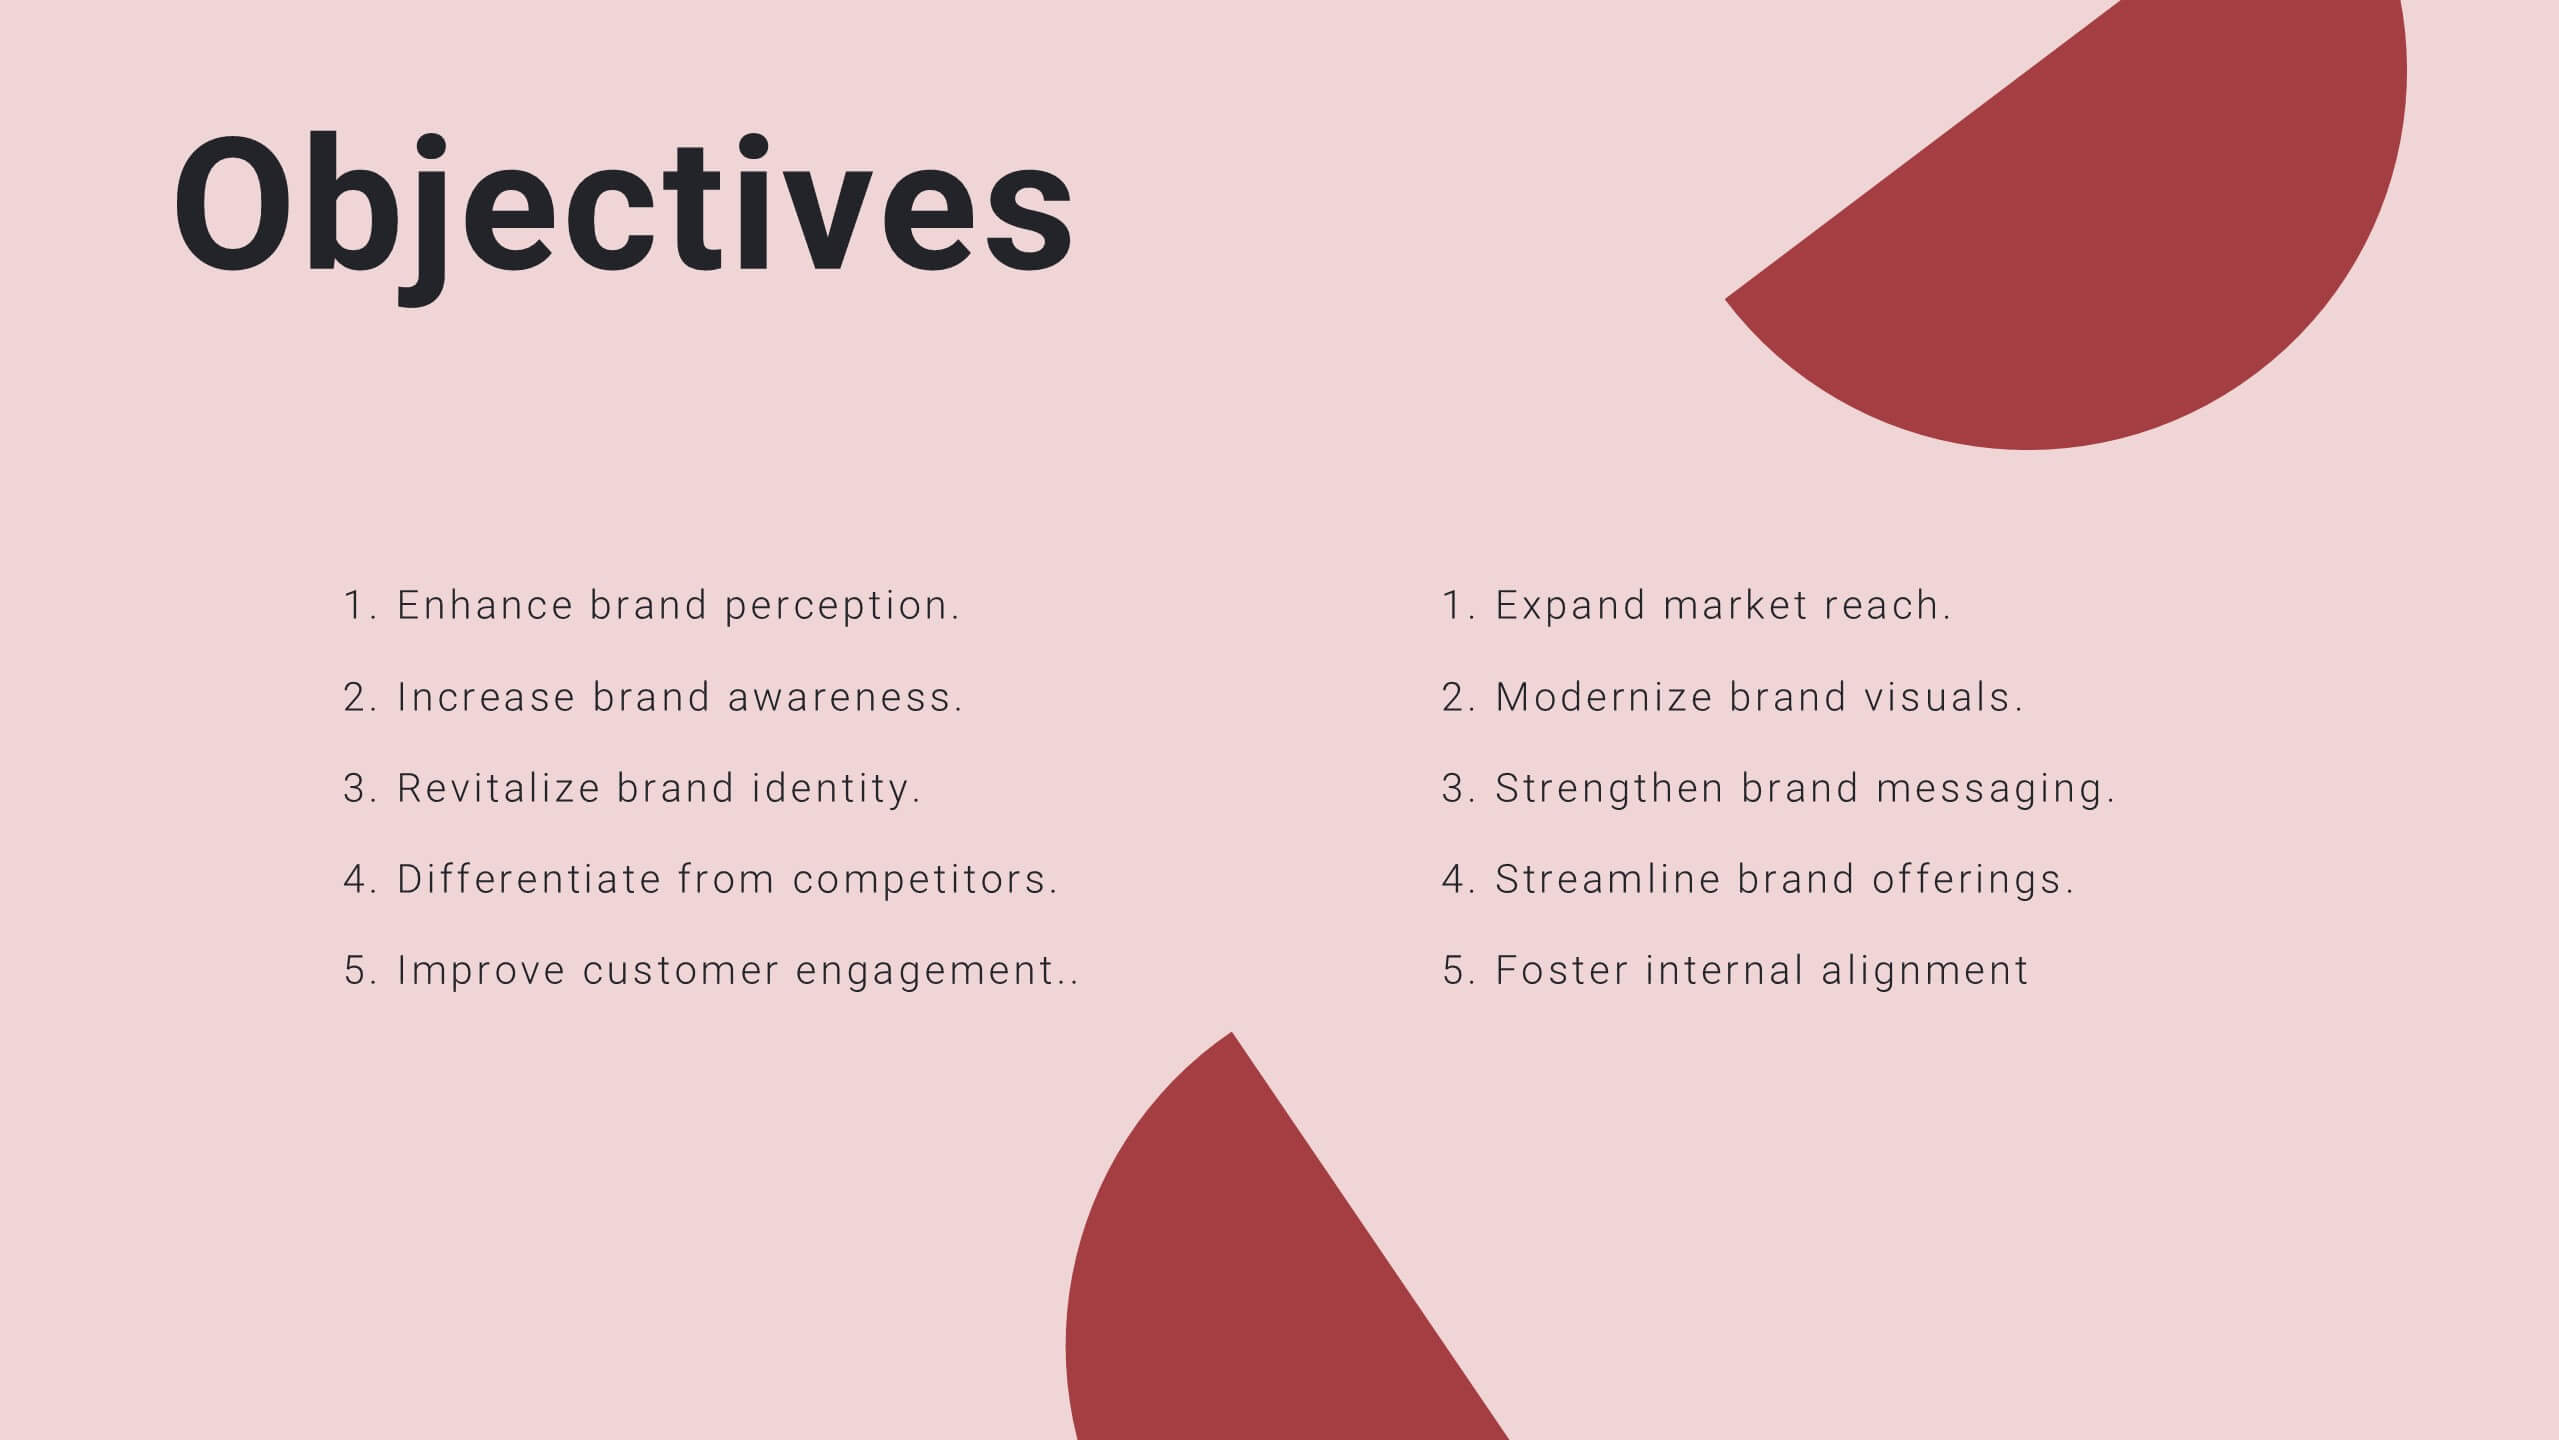
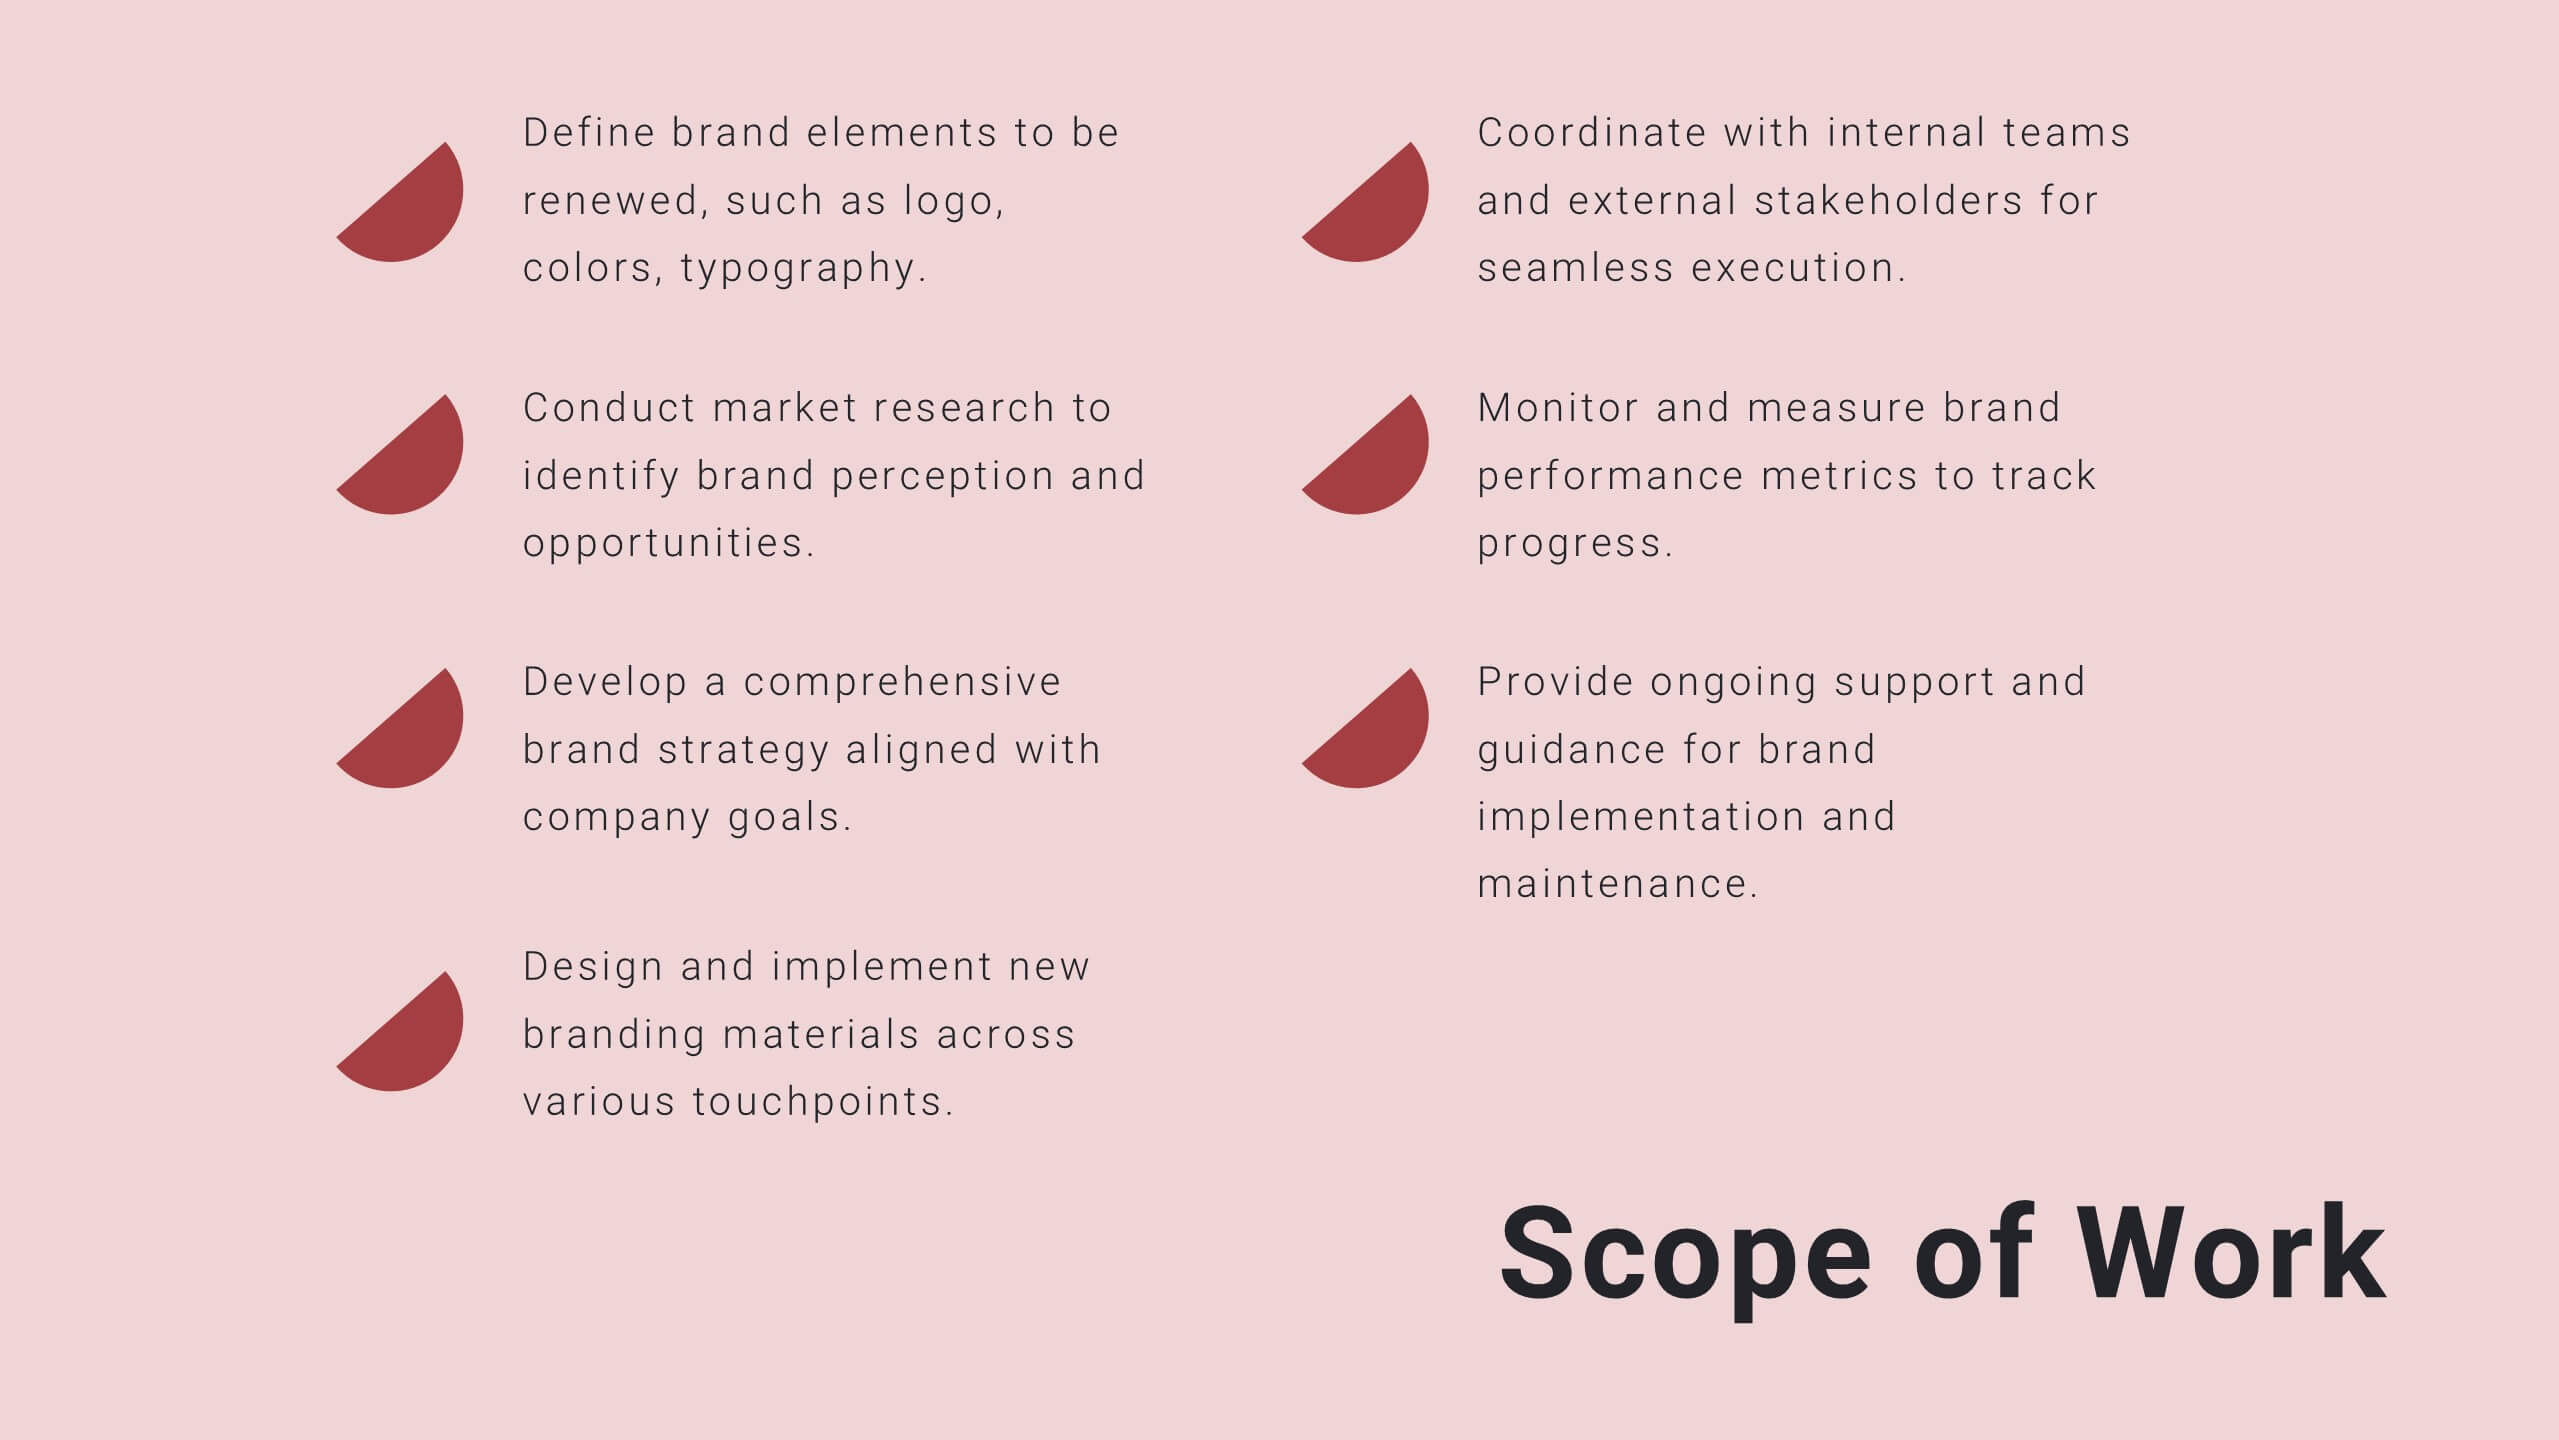
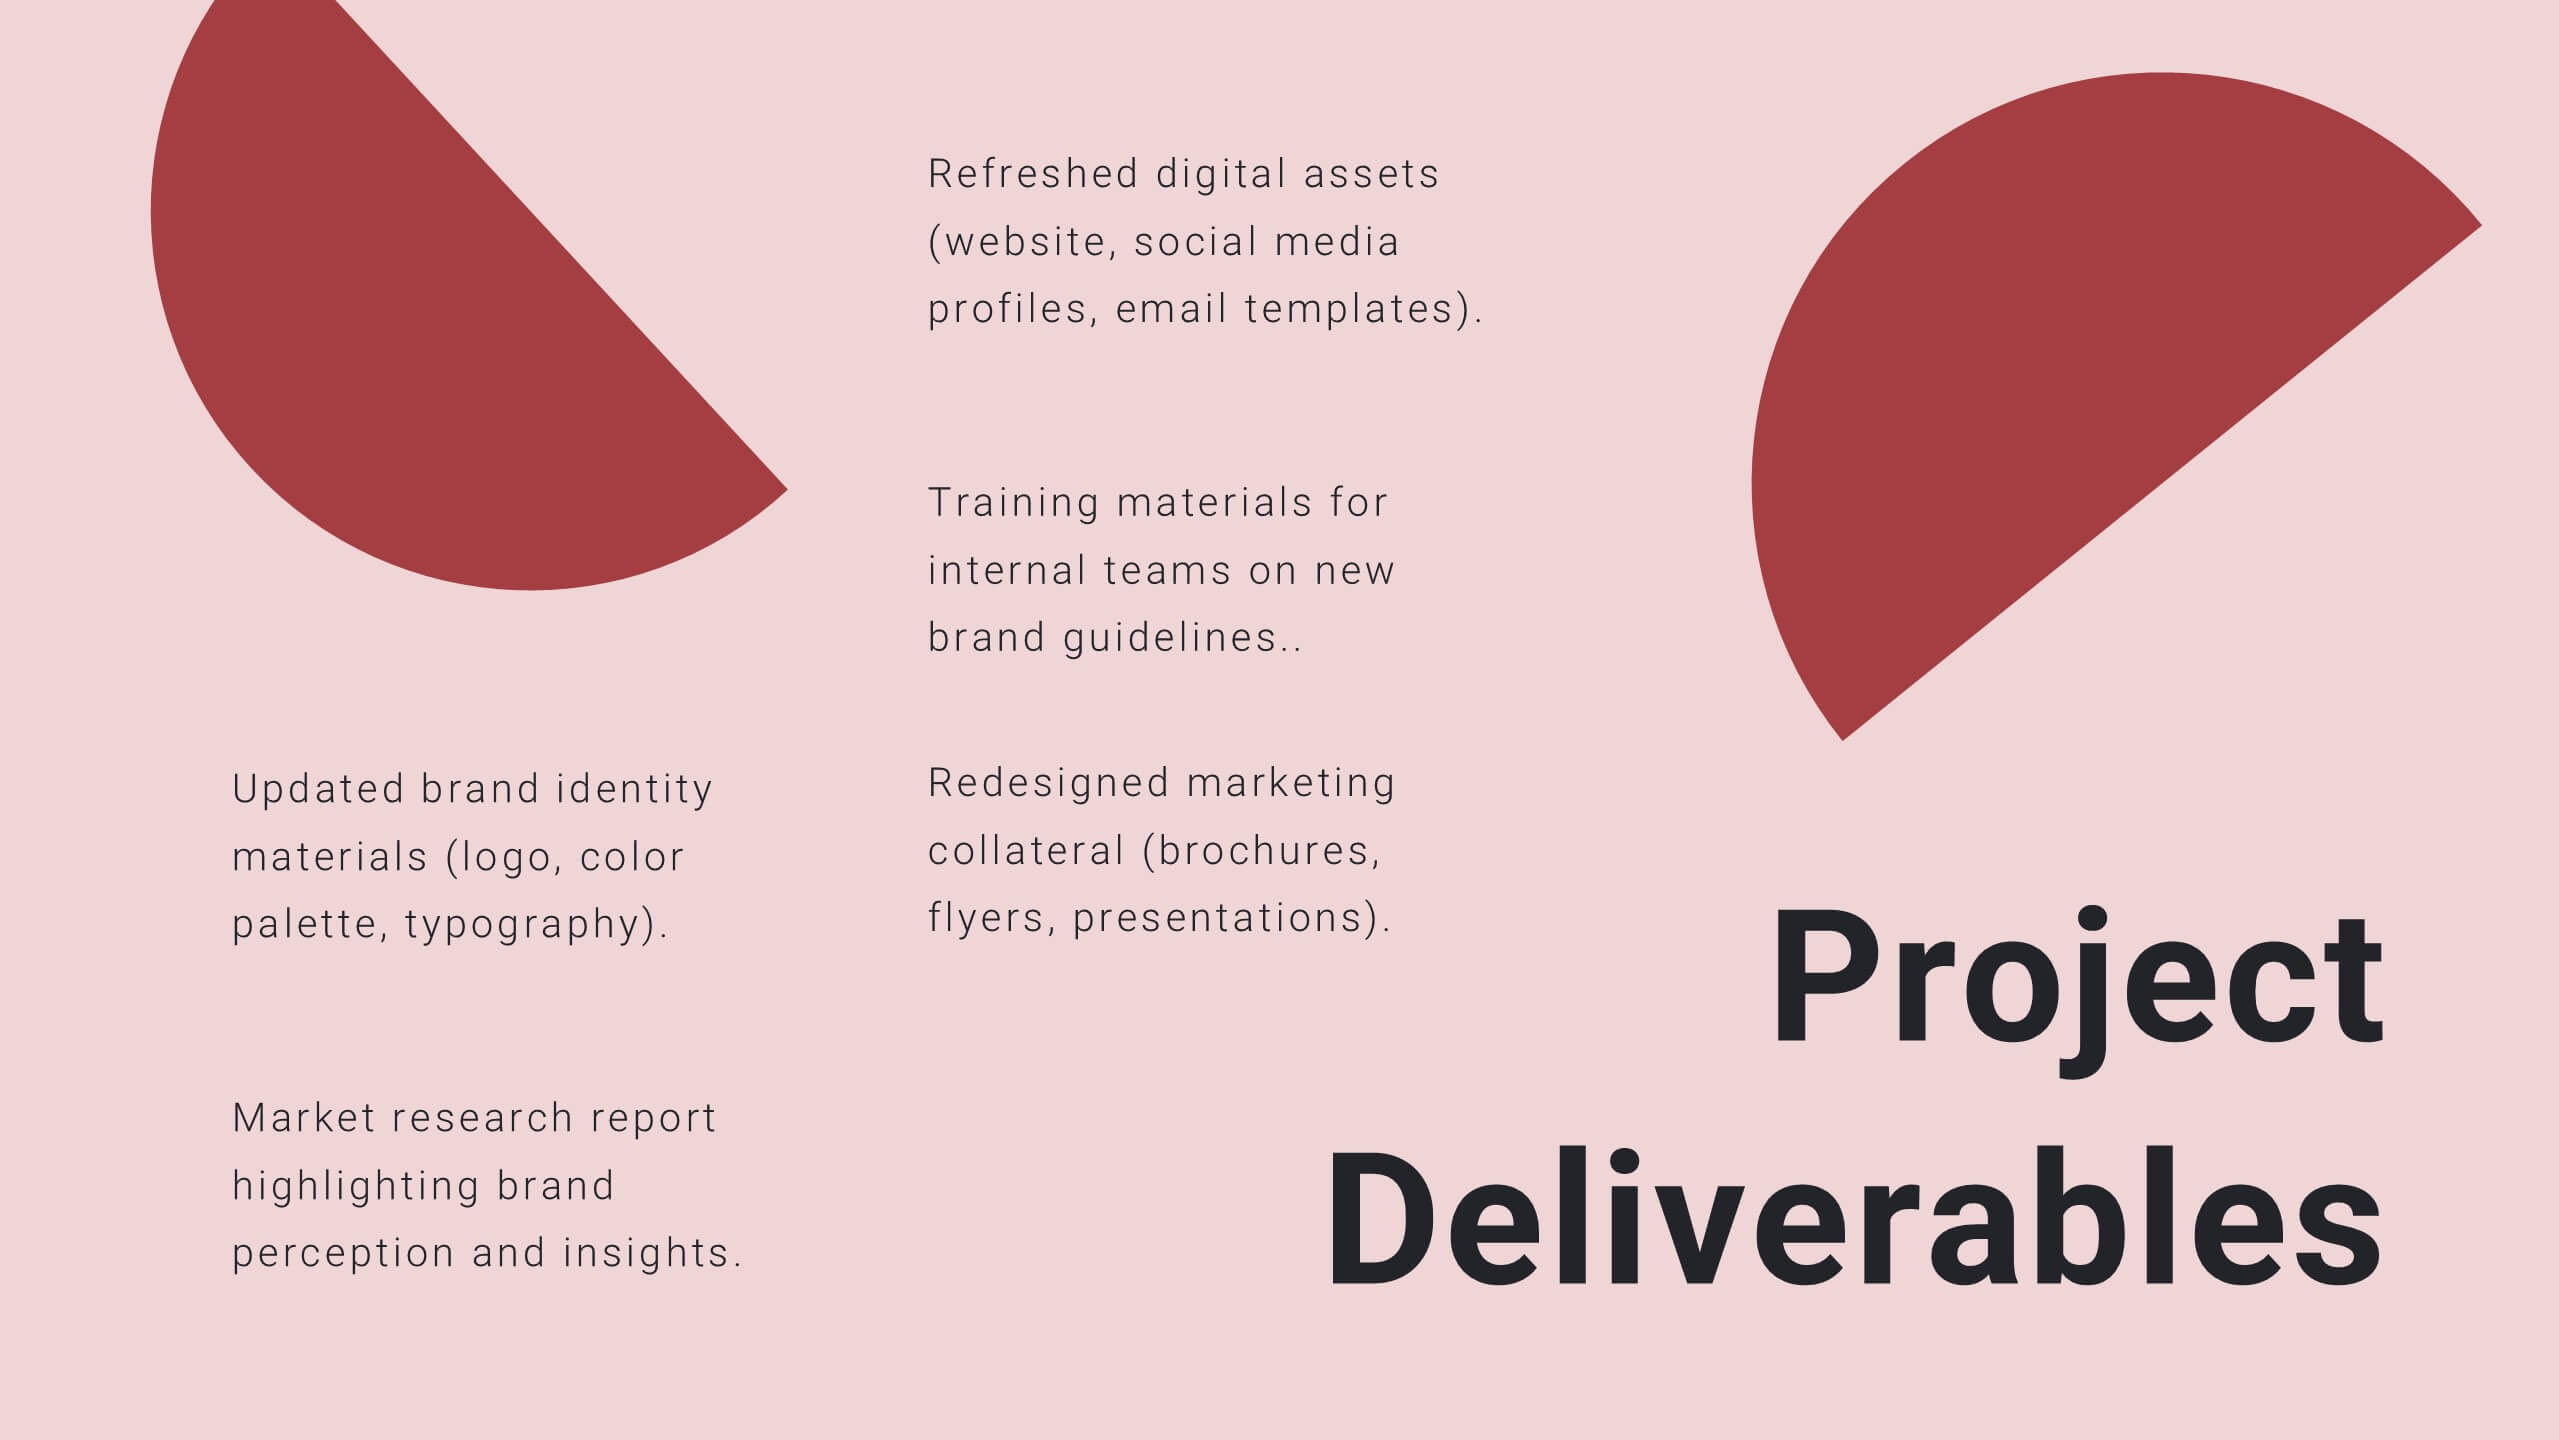
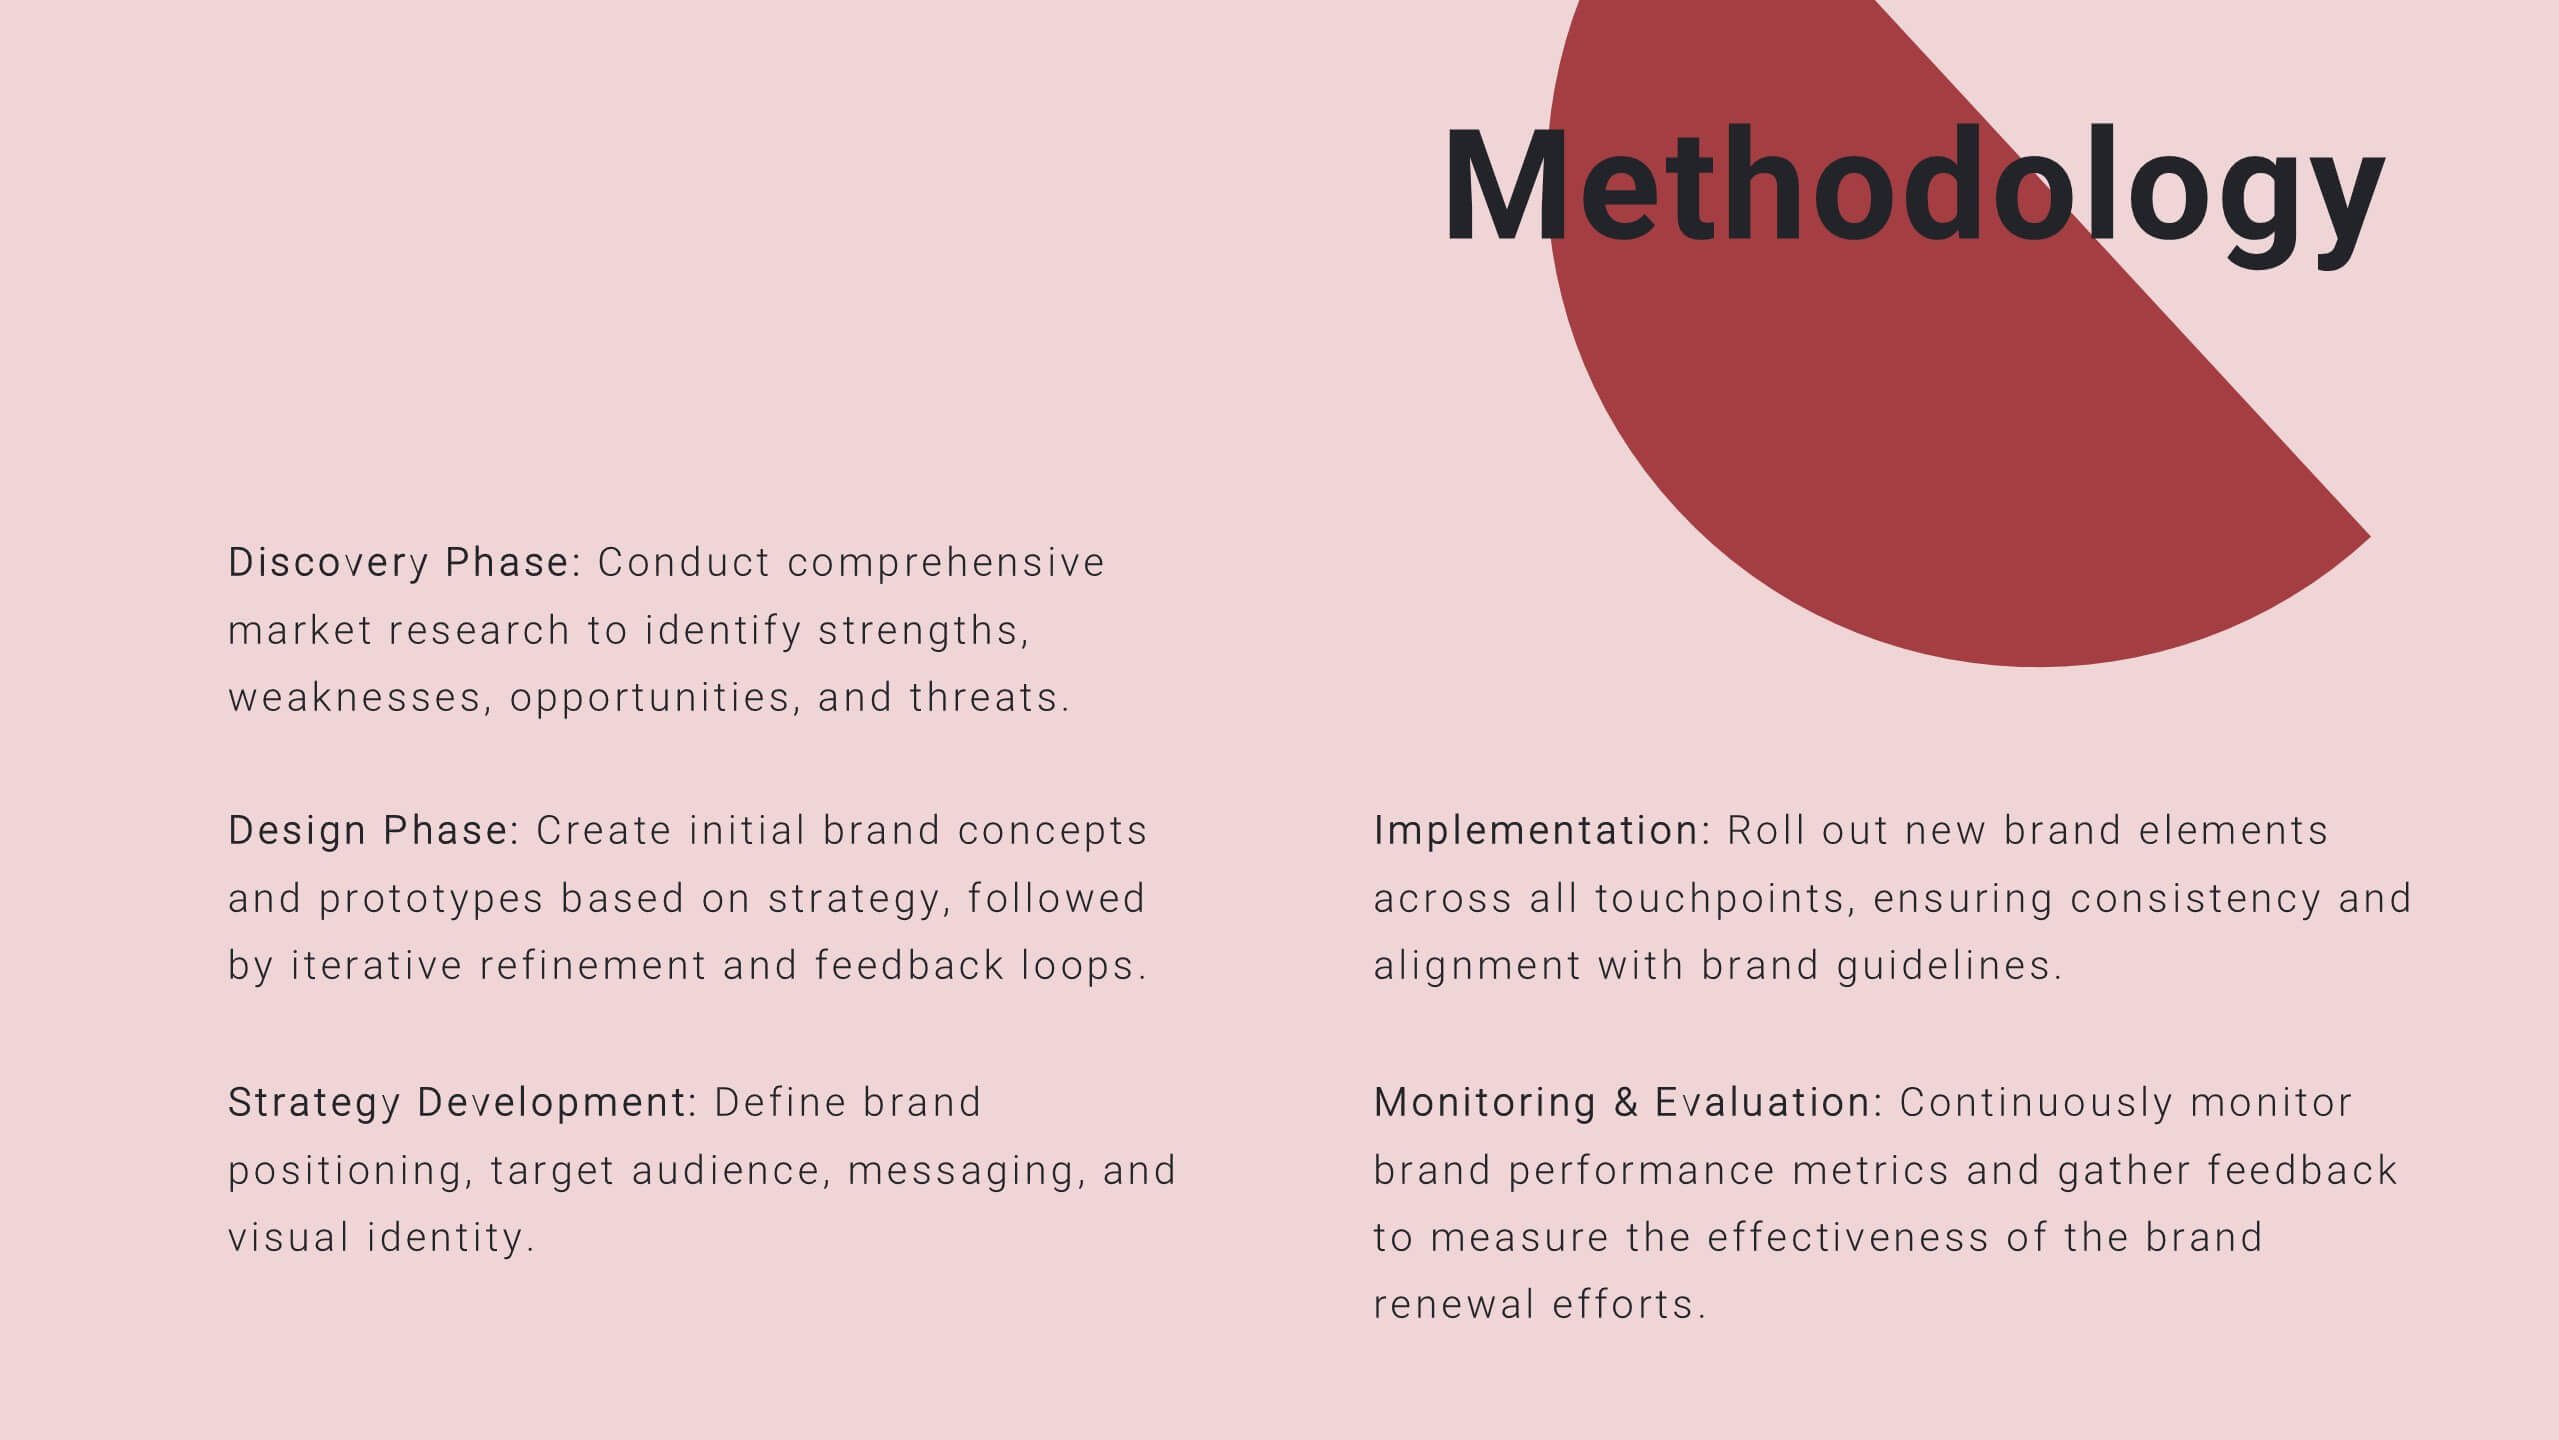
Business Goals and Objectives Presentation
Build a strong foundation for success with this business goals and objectives template! Designed to help organizations define clear targets and align strategies, this visual layout simplifies goal-setting and planning. Perfect for corporate teams, startups, and strategists. Fully customizable and compatible with PowerPoint, Keynote, and Google Slides for effortless editing.


6 slides
World Map Regions Infographic
The world can be divided into several regions based on various factors such as geography, culture, politics, and economics. This presentation template showcases different regions of the world. It provides an overview of the continents, countries, and key geographic features, allowing viewers to gain a better understanding of global geography and the distribution of regions. The visually appealing design and concise information make it easy for viewers to grasp the geographic layout of the world and appreciate the diversity of regions. Compatible with Powerpoint, Keynote, and Google Slides.


7 slides
Sports Training Camp Schedule Deck Presentation
Plan and present weekly training programs with this Sports Training Camp Schedule Deck. Featuring a clean, color-coded layout for Monday to Saturday, this slide helps coaches organize sessions clearly. Ideal for team meetings, camp planning, or fitness schedules. Fully editable in PowerPoint, Keynote, and Google Slides for easy customization.


7 slides
Kickoff Meeting Infographic
A meeting is a planned gathering of individuals, often from an organization or a group, who come together to discuss specific topics, share information, make decisions, or collaborate on projects. This infographic template is a visually engaging guide to launching your projects with a burst of energy and purpose. This template is your go-to tool for orchestrating that vital moment—the project kickoff—that sets the stage for success. Compatible with Powerpoint, Keynote, and Google Slides. This template is a structured way to communicate, coordinate actions, and ensure that everyone involved is aligned towards common goals.


26 slides
Remote Work Strategies Presentation
Enhance your team's flexibility with our Remote Work Strategies presentation template, designed for use with PowerPoint, Keynote, and Google Slides. This template is an invaluable asset for team leaders, HR professionals, and business consultants dedicated to cultivating a productive remote work culture. Our template is tailored to provide an in-depth analysis of remote work best practices, offering slides that cover essential strategies for communication, collaboration, and project management in a virtual environment. It also includes insights on setting up a successful home office, maintaining work-life balance, and leveraging technology for seamless remote operations. With customizable elements, you can illustrate the advantages of remote work, share success stories, and provide actionable tips to maximize team efficiency from afar. This template is SEO-optimized to ensure your presentation reaches those seeking to optimize their remote work operations and foster a thriving digital workplace.


6 slides
Tables of Content Analysis Infographic
Table of Contents analysis refers to the examination and evaluation of the structure and content of a document's table of contents. It is commonly used as a preliminary step to understand the flow of information within a longer document, such as a book, report, thesis, or research paper. This infographic template provides insights into the document's structure and can help readers determine whether the document is relevant to their needs. This infographic is designed to provide a quick overview of the topics covered in the document and their distribution, helping readers understand the organization of the content at a glance.


7 slides
Advanced Education Infographics
The "Advanced Education" infographic template is a sophisticated and visually engaging resource, designed meticulously for PowerPoint, Keynote, and Google Slides. This template is an invaluable tool for educators, administrators, and policy makers aiming to present complex educational frameworks, advanced curriculum details, and innovative learning methodologies. The template expertly encapsulates the essence of advanced education, highlighting specialized programs, cutting-edge research opportunities, and pathways for academic excellence. It's organized to showcase the breadth and depth of advanced educational offerings, making it perfect for academic conferences, institutional presentations, or educational policy discussions. The design is as intellectually stimulating as the content it represents, with a color scheme that is both elegant and conducive to a learning environment. This not only enhances the visual appeal of the presentation but also aligns with the advanced and scholarly nature of the content. Whether used in a university setting, a professional development seminar, or a policy briefing, this template ensures that the value and intricacies of "Advanced Education" are communicated with sophistication, clarity, and visual impact.