


Features
- 10 Unique slides
- Fully editable and easy to edit in Microsoft Powerpoint, Keynote and Google Slides
- 16:9 widescreen layout
- Clean and professional designs
- Export to JPG, PDF or send by email


Do you have any questions?
Recommend


12 slides
Digital Marketing Strategy Presentations
Turn complex campaigns into captivating visuals with this modern, data-driven layout designed for marketing professionals. Perfect for outlining strategies, performance metrics, and digital funnels, it keeps information clear and visually engaging. Easily customizable and fully compatible with PowerPoint, Keynote, and Google Slides for seamless editing across your favorite platforms.


5 slides
Transportation Industry Market Trends Presentation
Visualize industry shifts and delivery dynamics with this road-themed presentation layout. Featuring a stylized highway path and moving vehicle graphic, this template helps you break down four key market trends in a clear, visual progression. Each stop on the route includes editable icons and text blocks for streamlined storytelling. Perfect for logistics analysts, transportation planners, and consultants. Fully customizable in PowerPoint, Keynote, and Google Slides.


6 slides
Sales Skills Development Training Presentation
Bring your sales training to life with a sleek, infinity-loop visual that keeps learners engaged from start to finish. This template helps you map out each phase of sales skill development, from lead generation to closing. Fully customizable and compatible with PowerPoint, Keynote, and Google Slides for seamless integration.


5 slides
Modern Home Layout Slides Presentation
Give your design ideas a modern edge with this clean, architectural presentation. Perfect for showcasing home layouts, interior concepts, or real estate projects, it combines structure and creativity to keep viewers engaged. Fully customizable and compatible with PowerPoint, Keynote, and Google Slides for effortless editing and professional delivery.


7 slides
Business Plan Process Infographic
Unveil the roadmap to entrepreneurial success with our business plan process infographic. This simple and streamlined infographic encapsulates the quintessential steps to draft a robust business plan, guiding entrepreneurs and business professionals on their journey to creating a successful enterprise. This infographic is an indispensable tool for budding entrepreneurs, business consultants, educators, and anyone looking to gain insights into the formulation of a business plan. Designed for seamless integration with PowerPoint, Keynote, or Google Slides, this template promises a presentation that is both engaging and educative.


5 slides
Agriculture Industry Infographics
Delve into the heart of the agricultural sector with our agriculture industry infographics. Cast in the earthy tones of green and yellow, reflecting growth and harvest, this template brings the farming industry to your fingertips. Its creative, vertical design infused with farm-style aesthetics makes it perfect for agricultural educators, and farming consultants seeking to present data with a touch of nature's essence. Compatible with Powerpoint, Keynote, and Google Slides. The template boasts graphics, intuitive icons, and flexible image placeholders. From showcasing industry trends to unraveling complex farming processes.


6 slides
Editable Puzzle Infographic
Piece together complex data with our Editable Puzzle Infographic, compatible with Powerpoint, Google Slides, and Keynote. This engaging infographic is designed to help presenters visually connect different pieces of information in a cohesive and understandable way. The puzzle pieces are a metaphor for how individual components fit into a larger strategy or concept, making it perfect for collaborative projects or educational models. The infographic is fully customizable, allowing you to adapt the colors, text, and arrangement to fit your specific needs. With this puzzle infographic, you can make your presentations more interactive ensuring your audience can see the big picture every time.


7 slides
TAM SAM SOM Research Infographic
TAM, SAM, and SOM are acronyms often used in business and marketing to analyze and understand the potential market for a product or service. This infographic template acts as a compass, guiding you through the seas of Total Available Market (TAM), Served Available Market (SAM), and Share of Market (SOM). Compatible with Powerpoint, Keynote, and Google Slides. This showcases creative visualization methods to represent TAM, SAM, and SOM effectively, ensuring clarity and engagement. Use this template to discuss how insights from TAM SAM SOM analysis can shape business strategies, drive growth, and enhance competitiveness.


23 slides
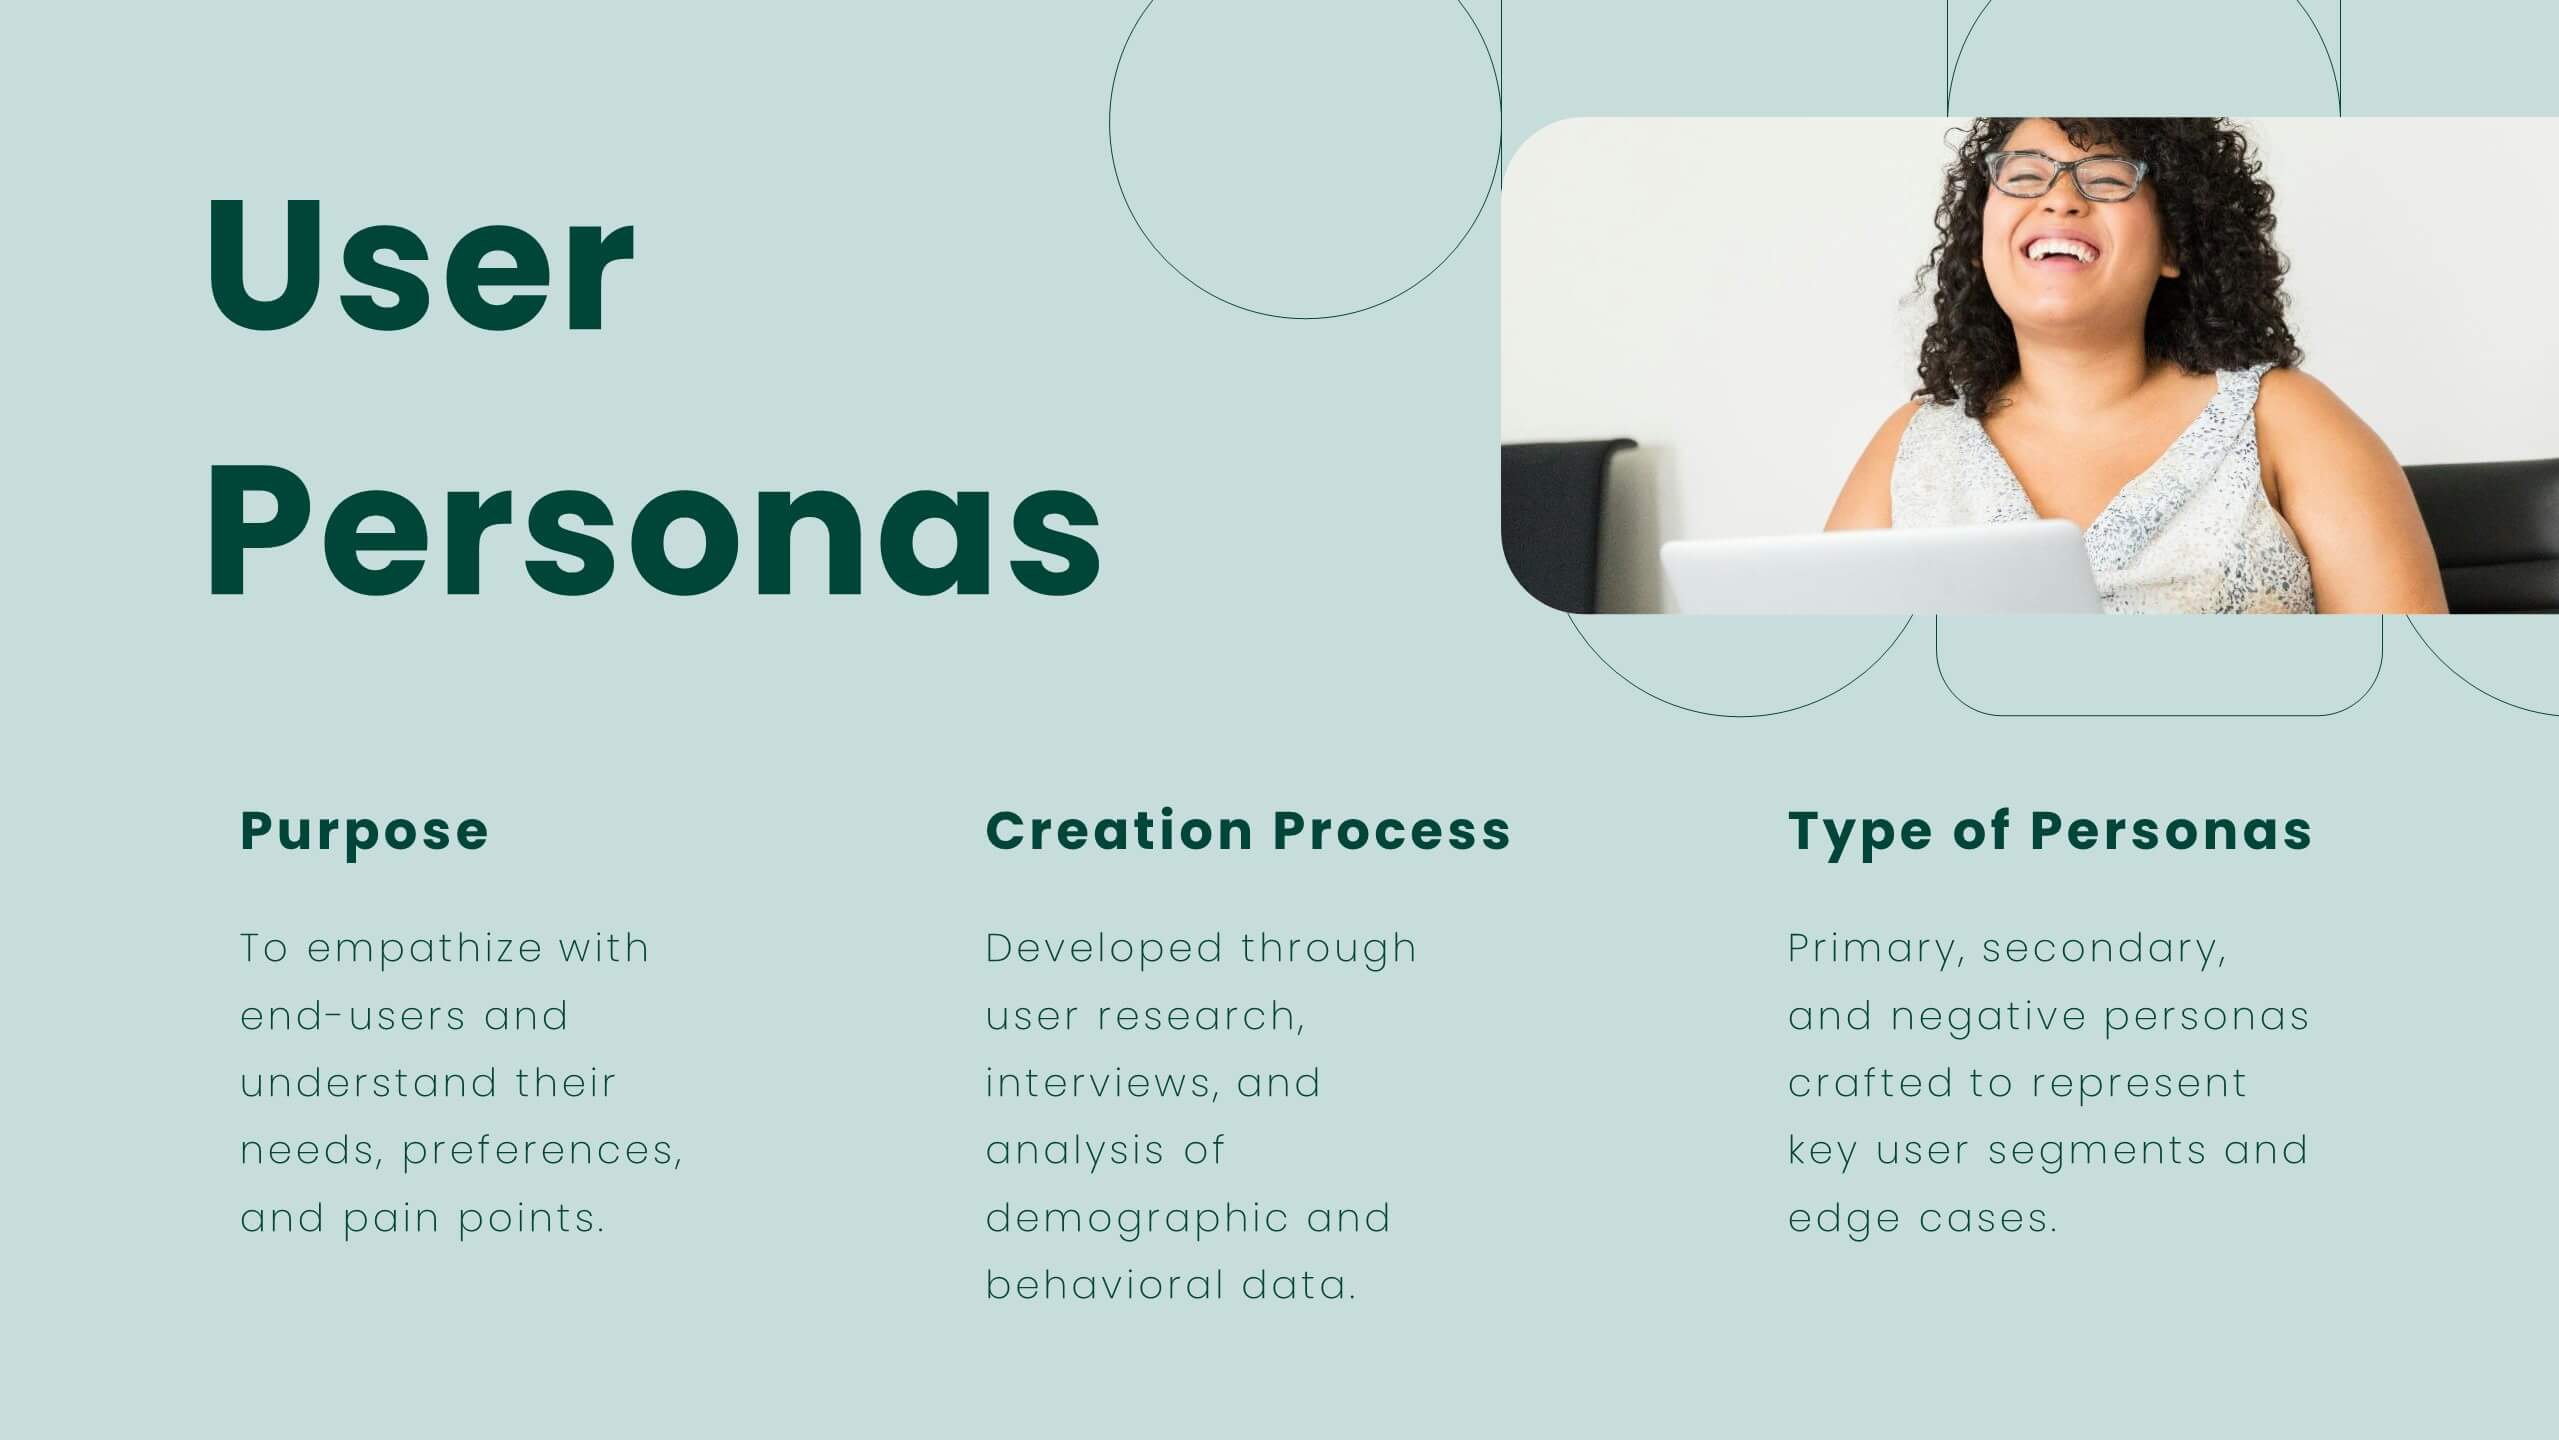
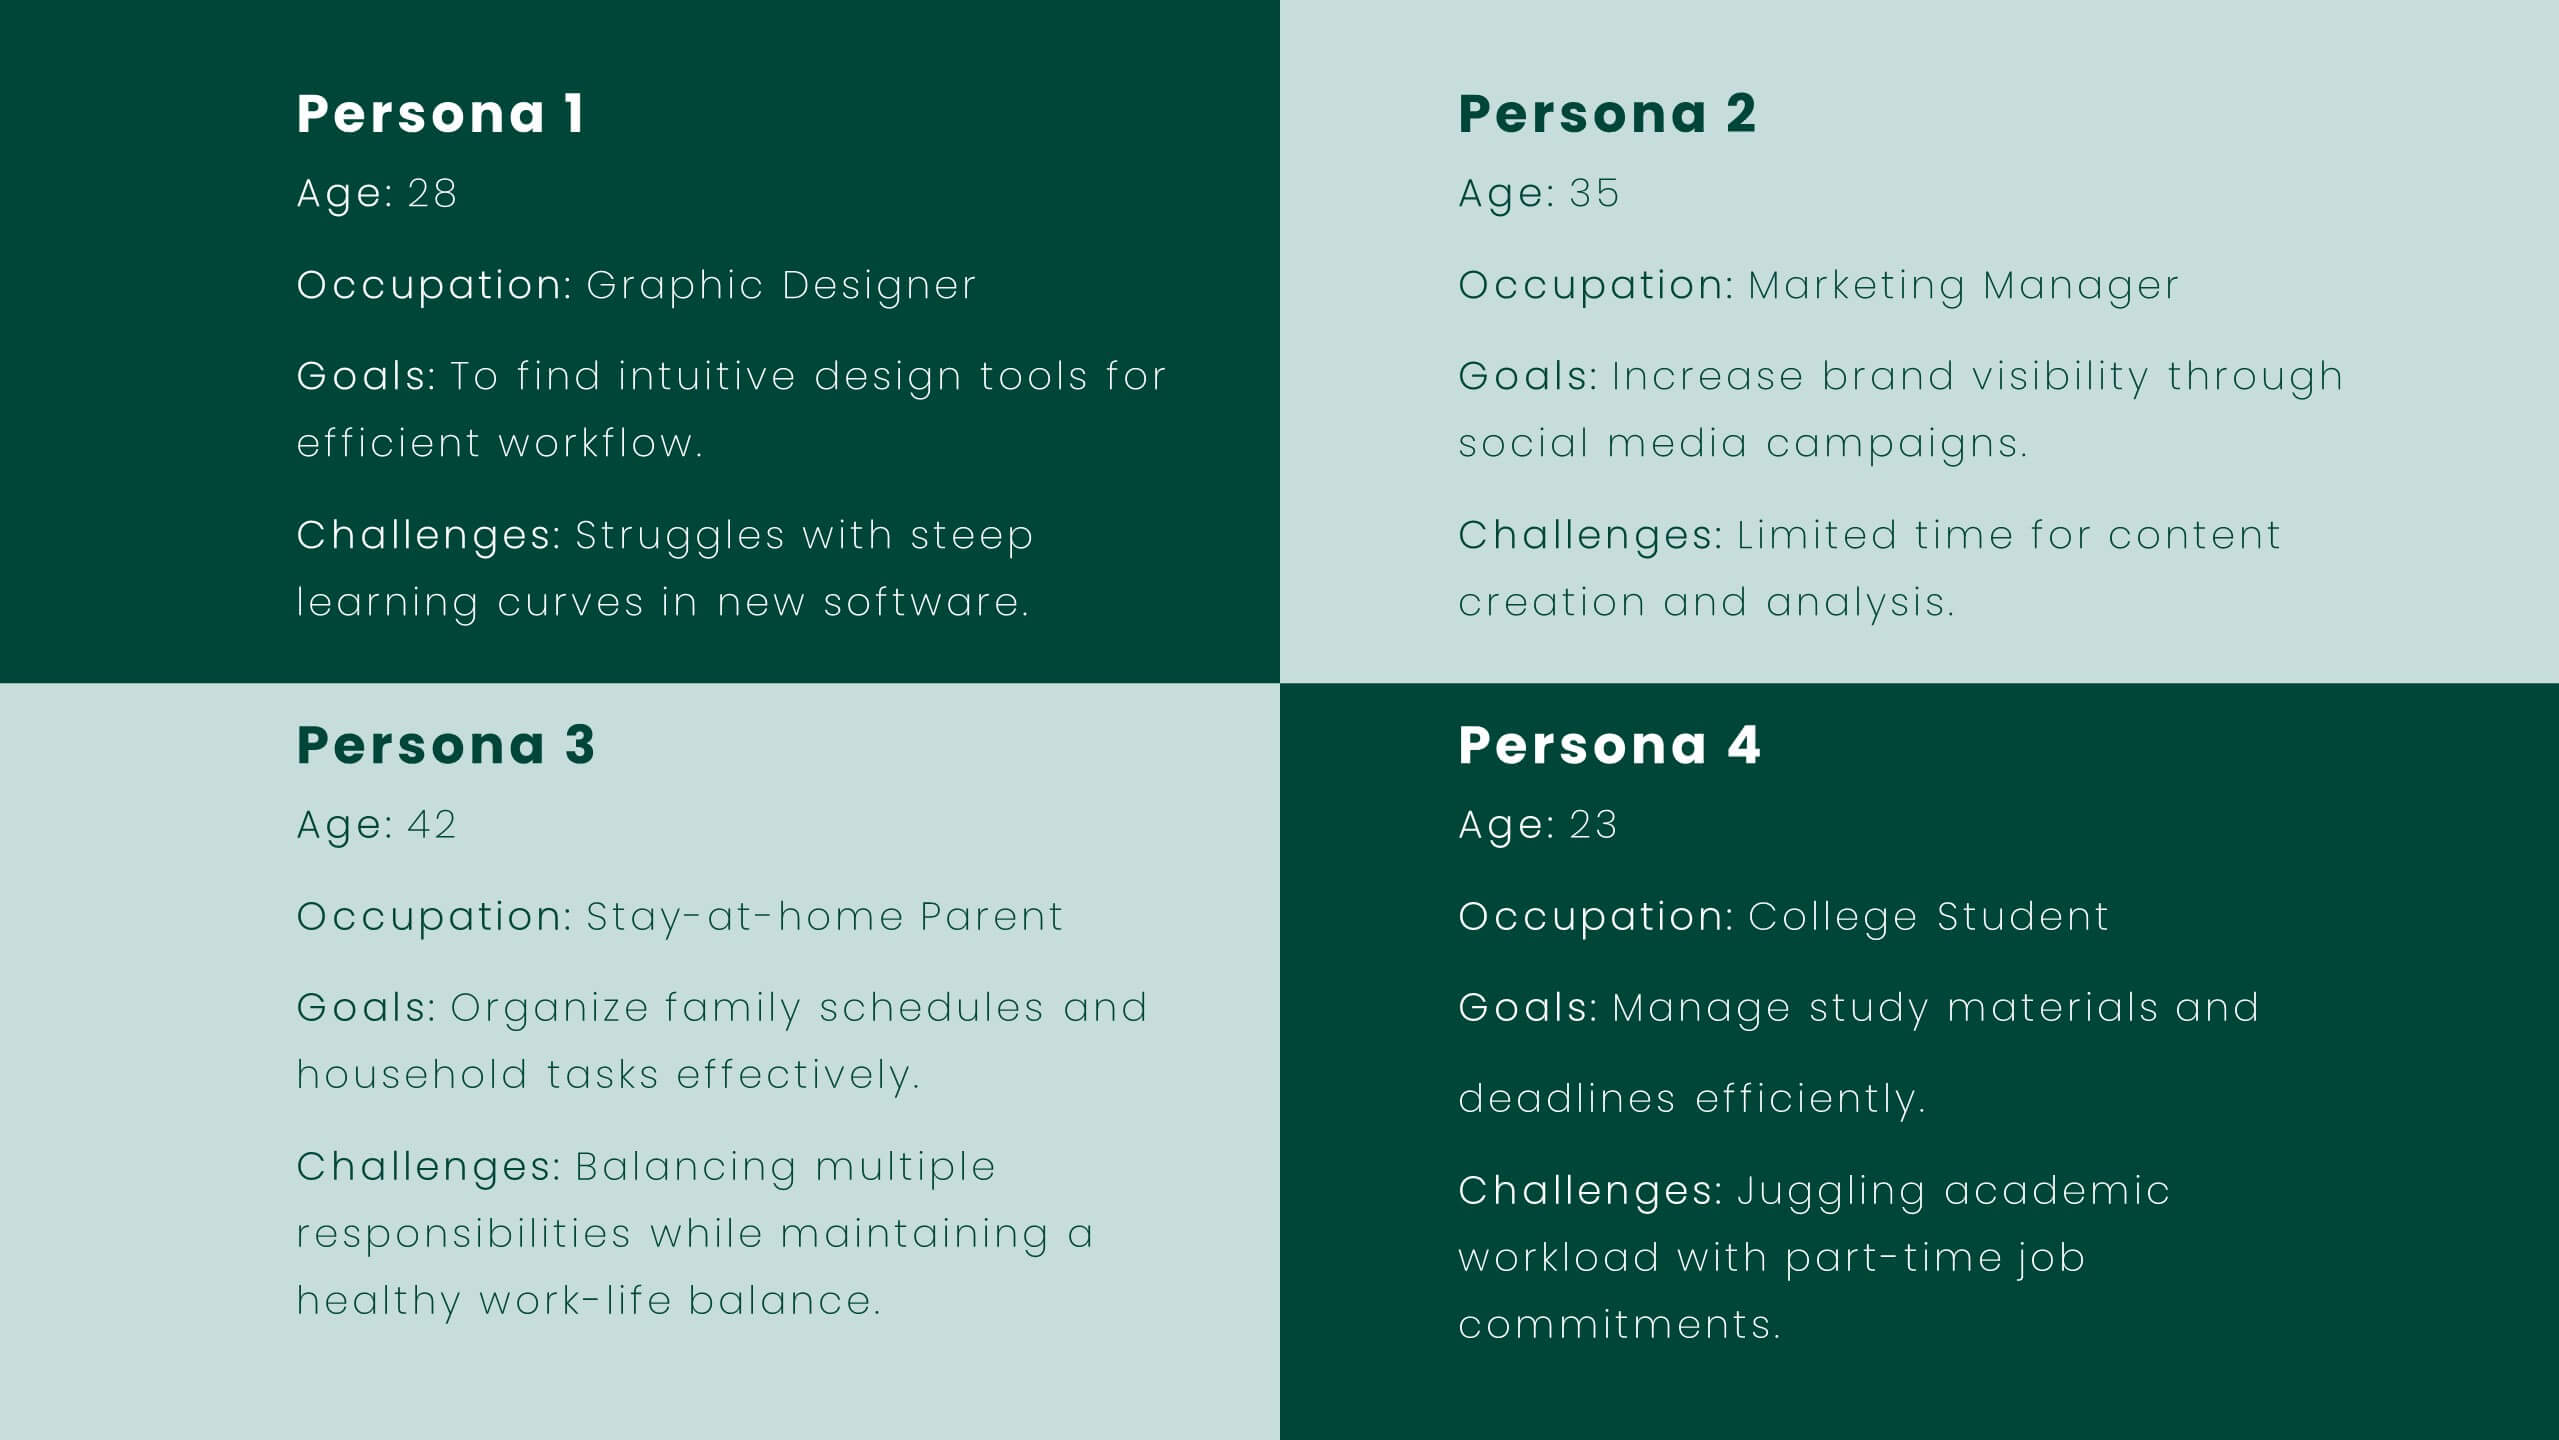
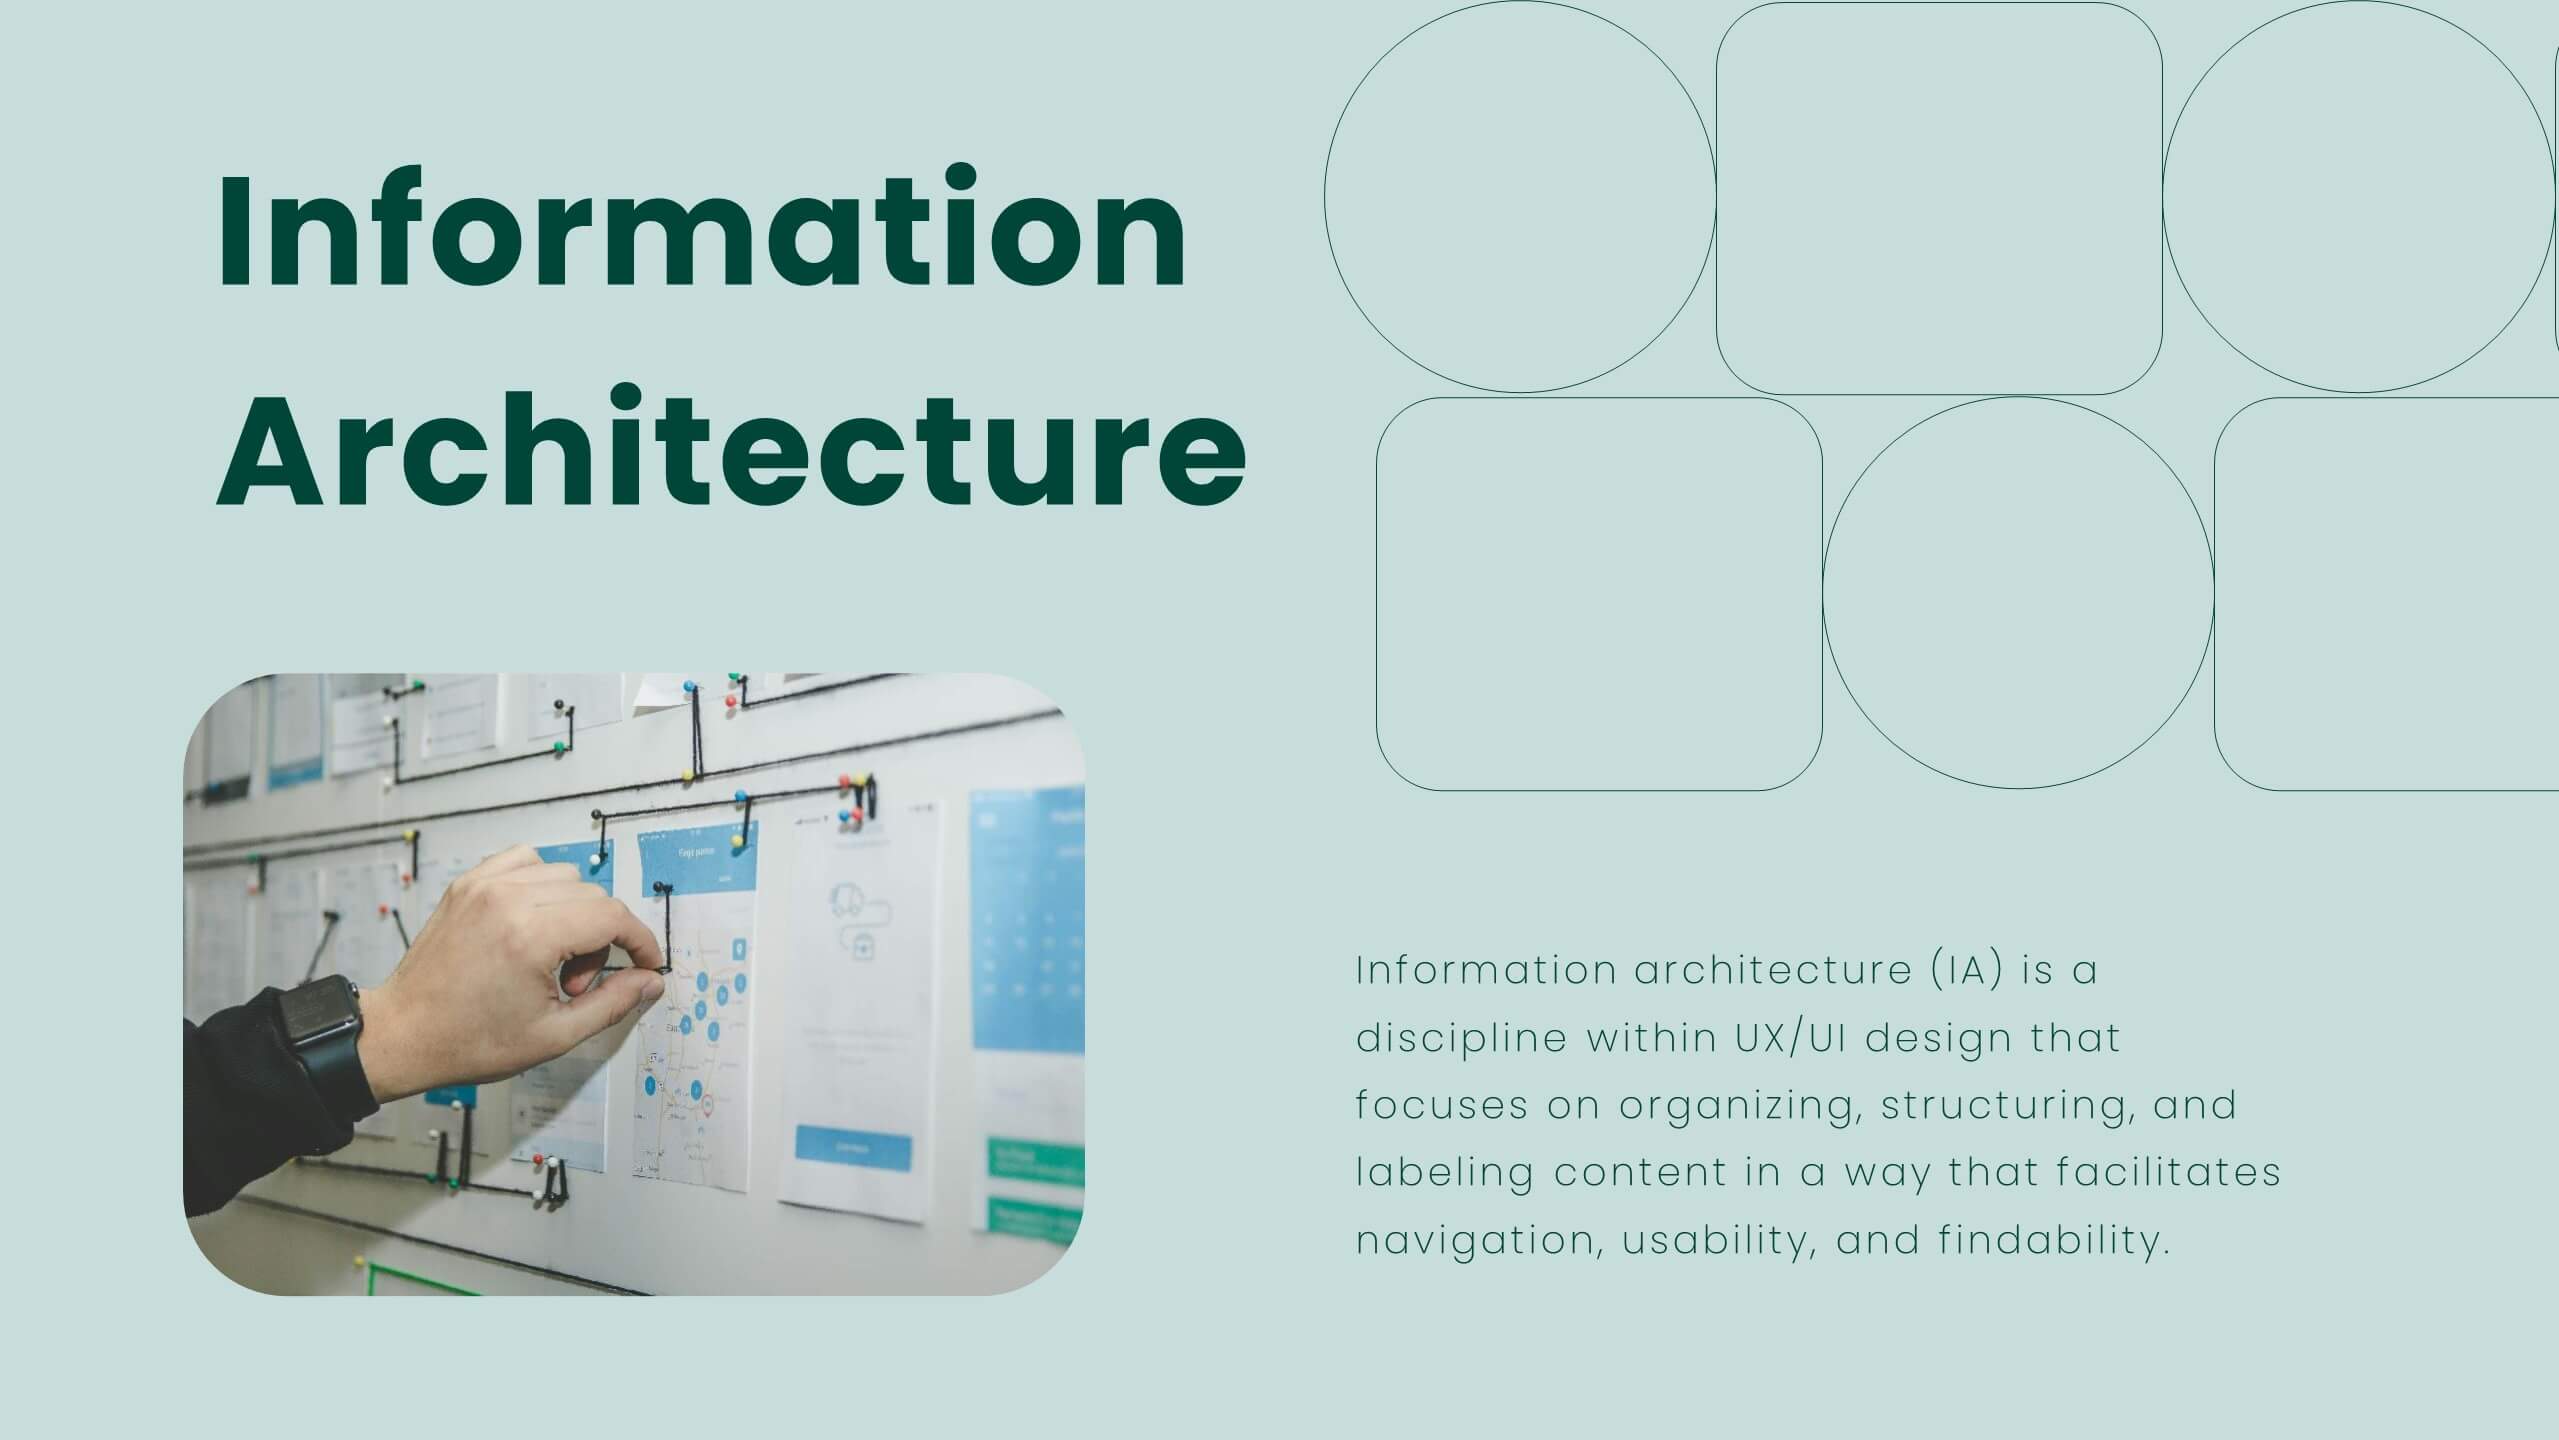
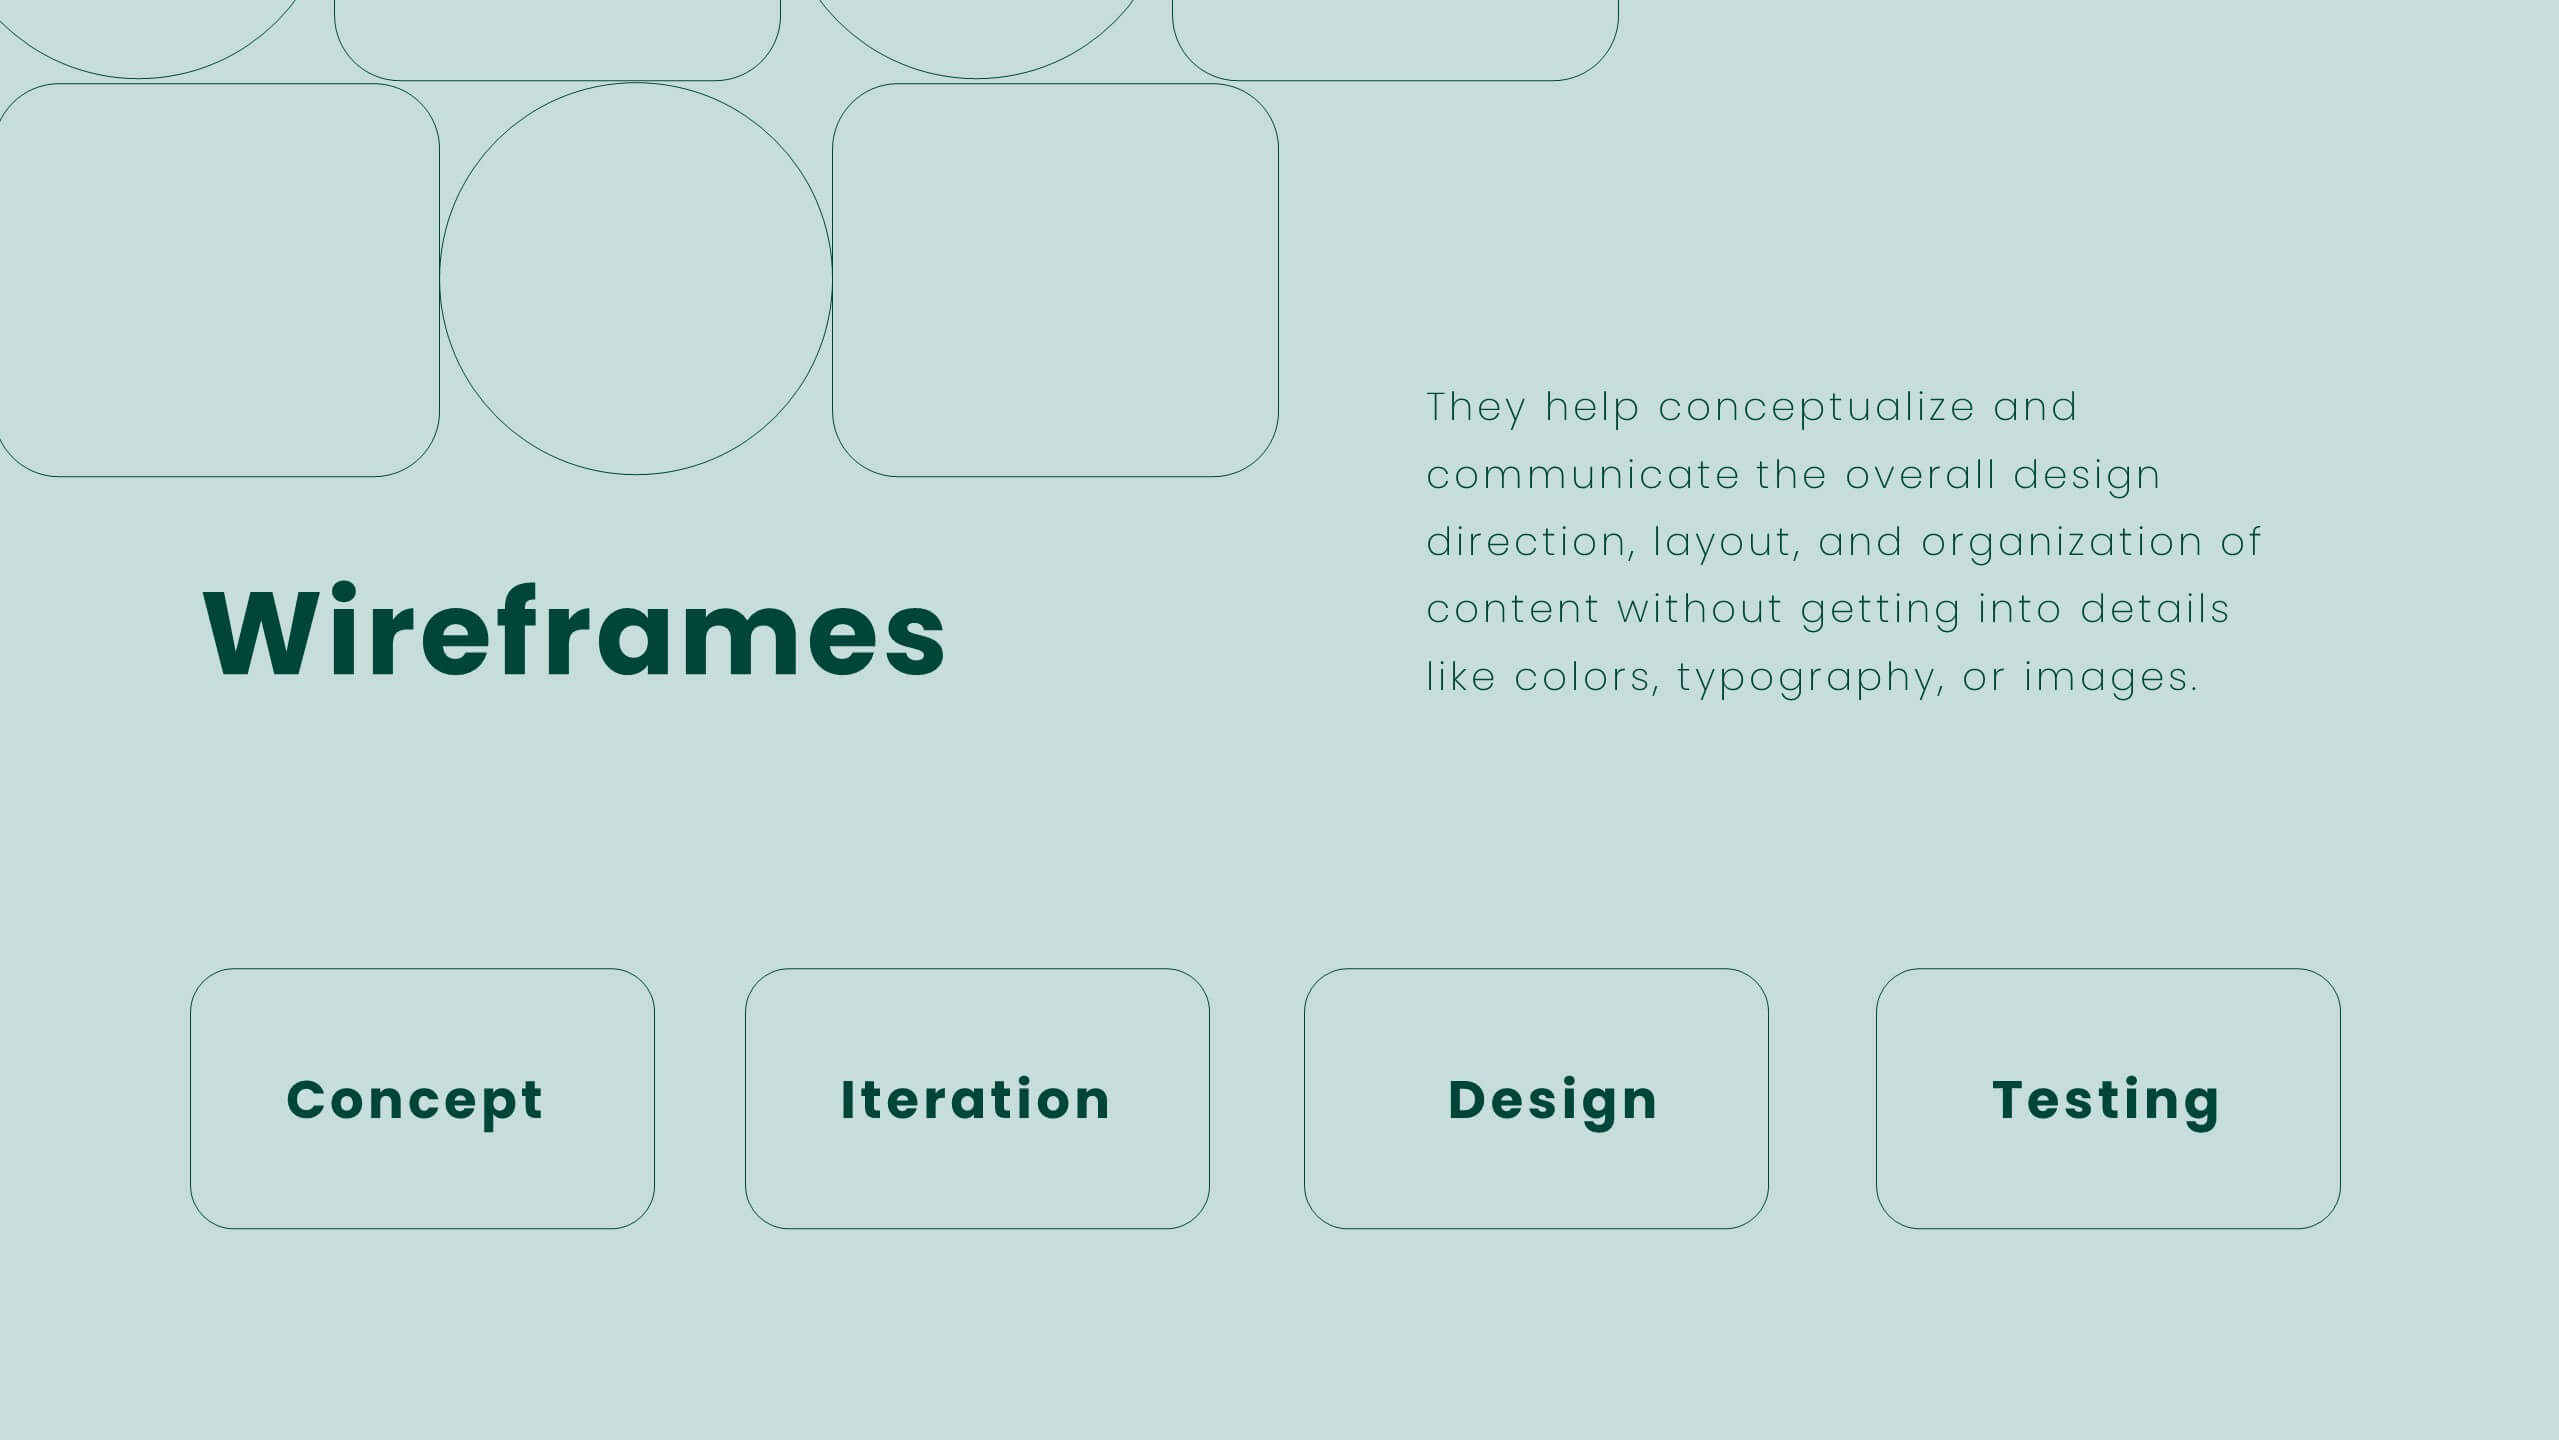
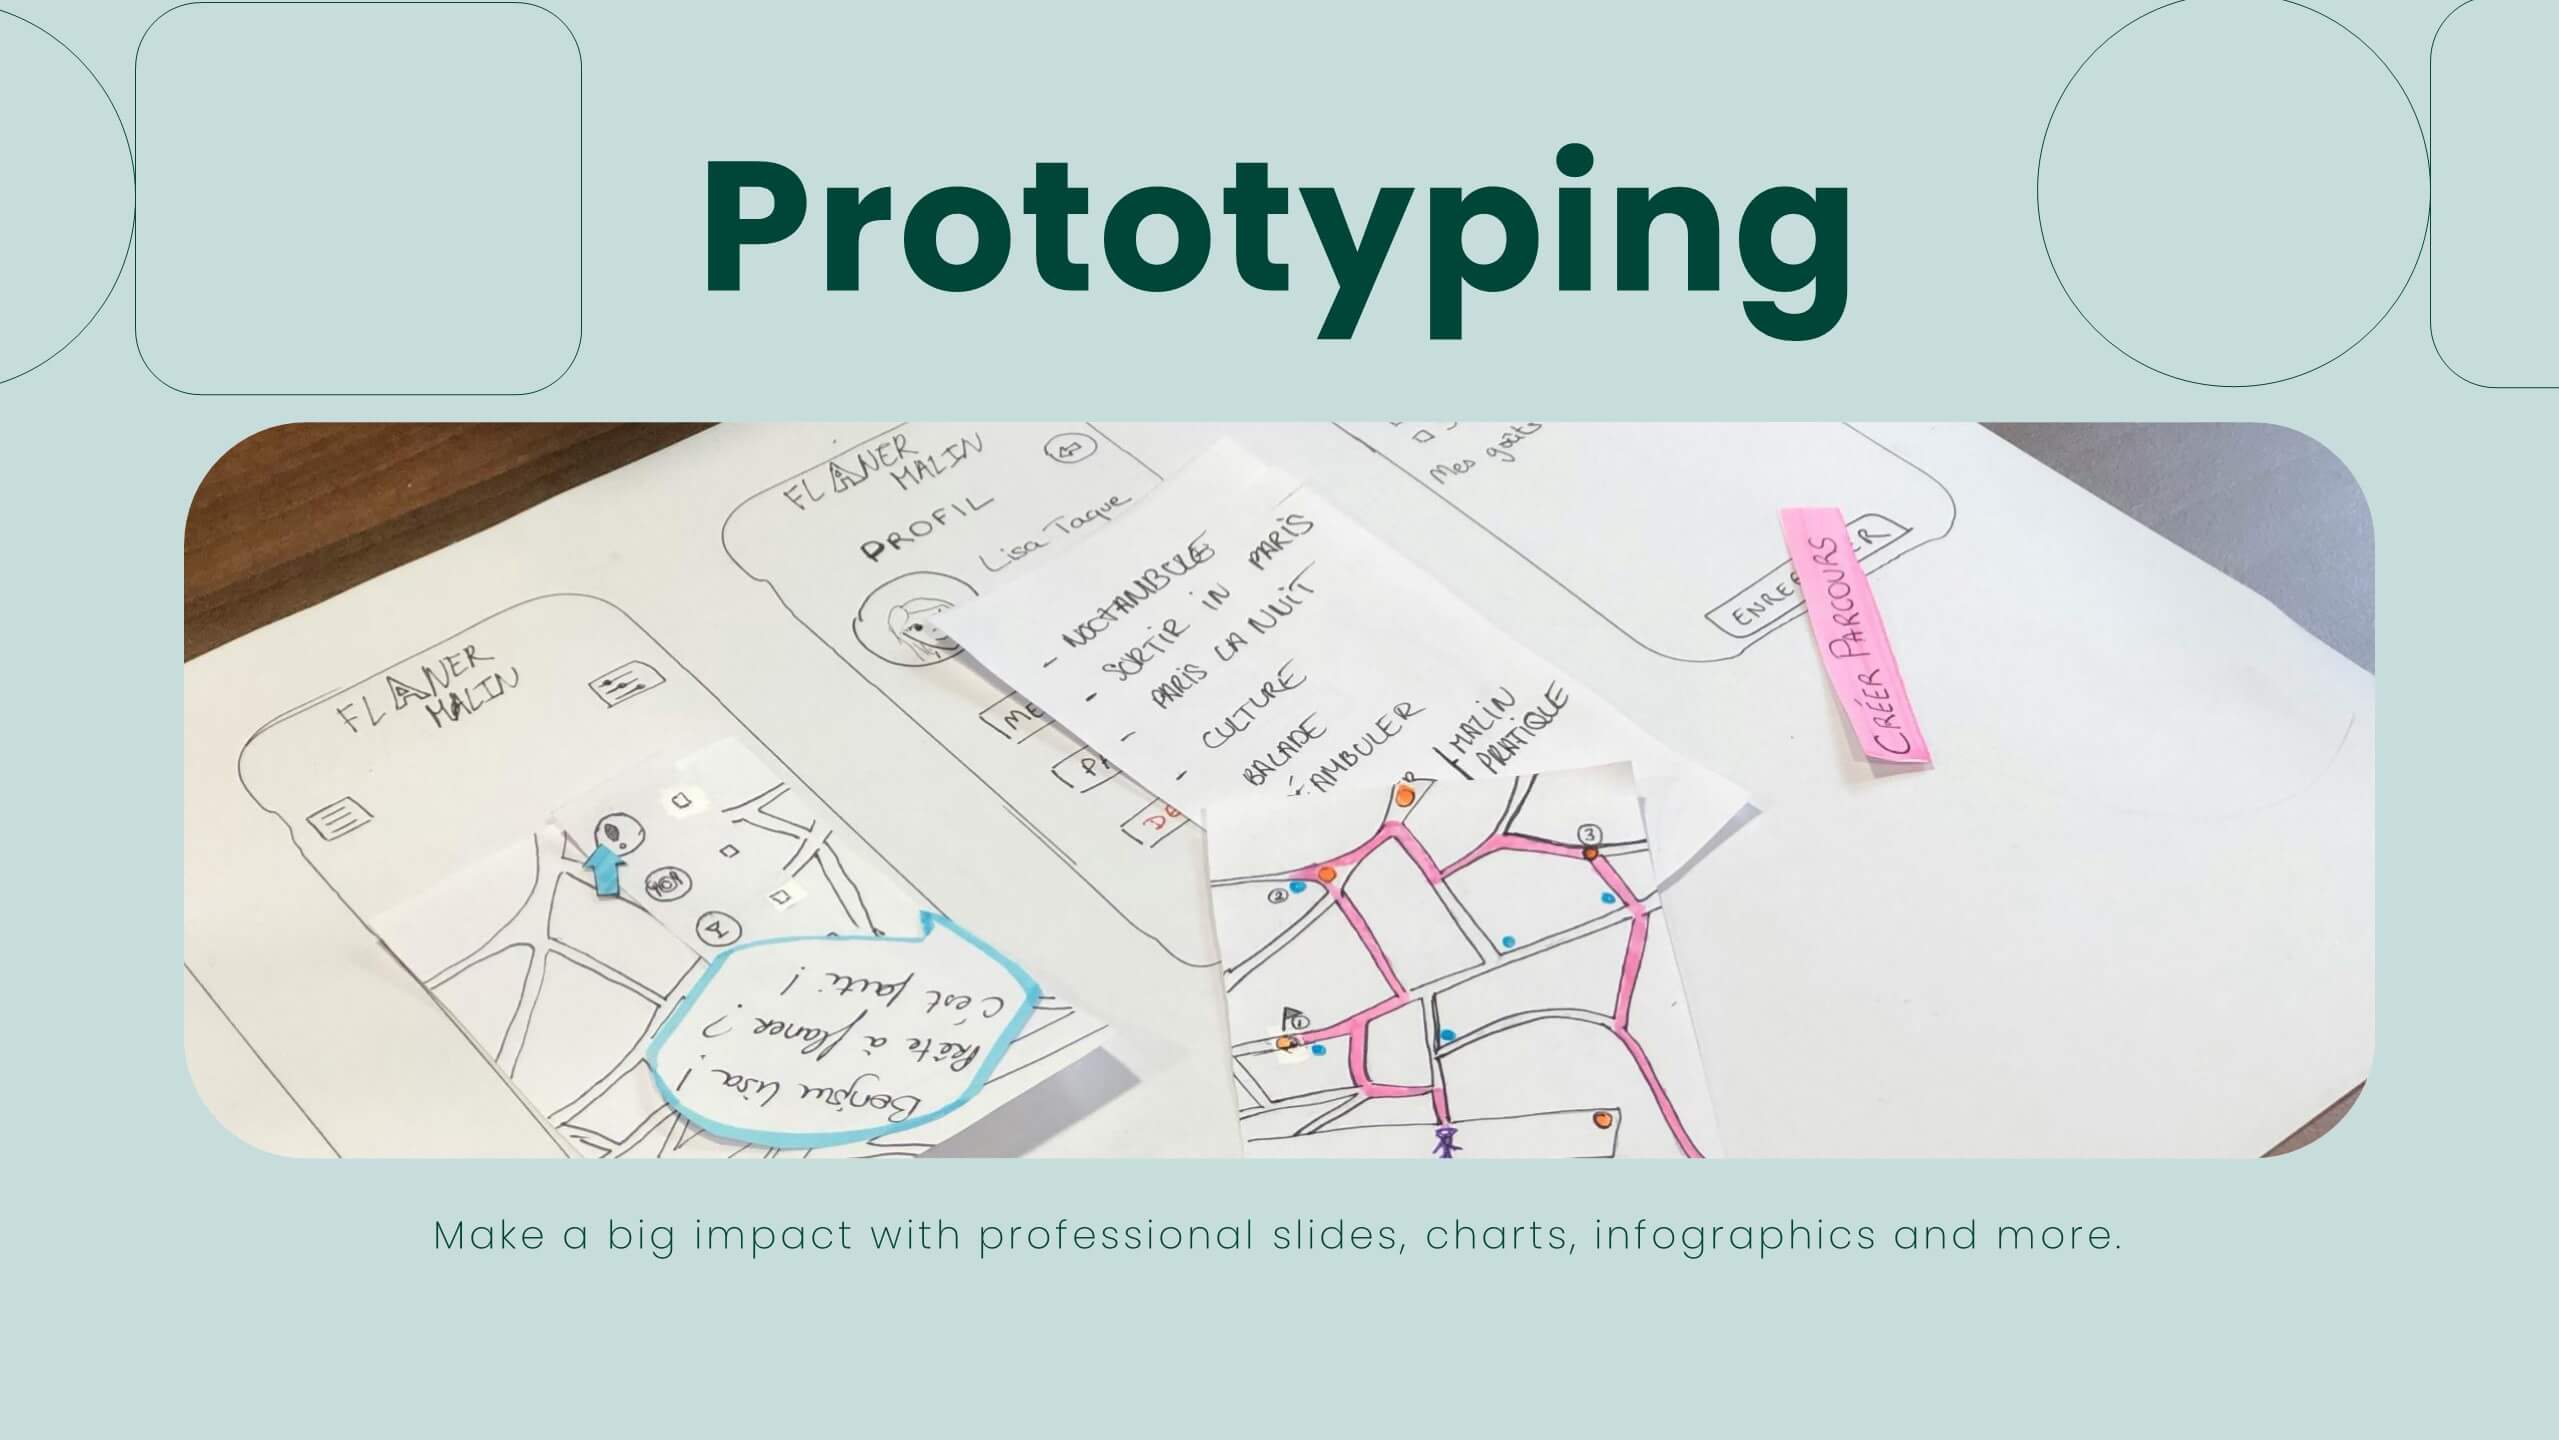
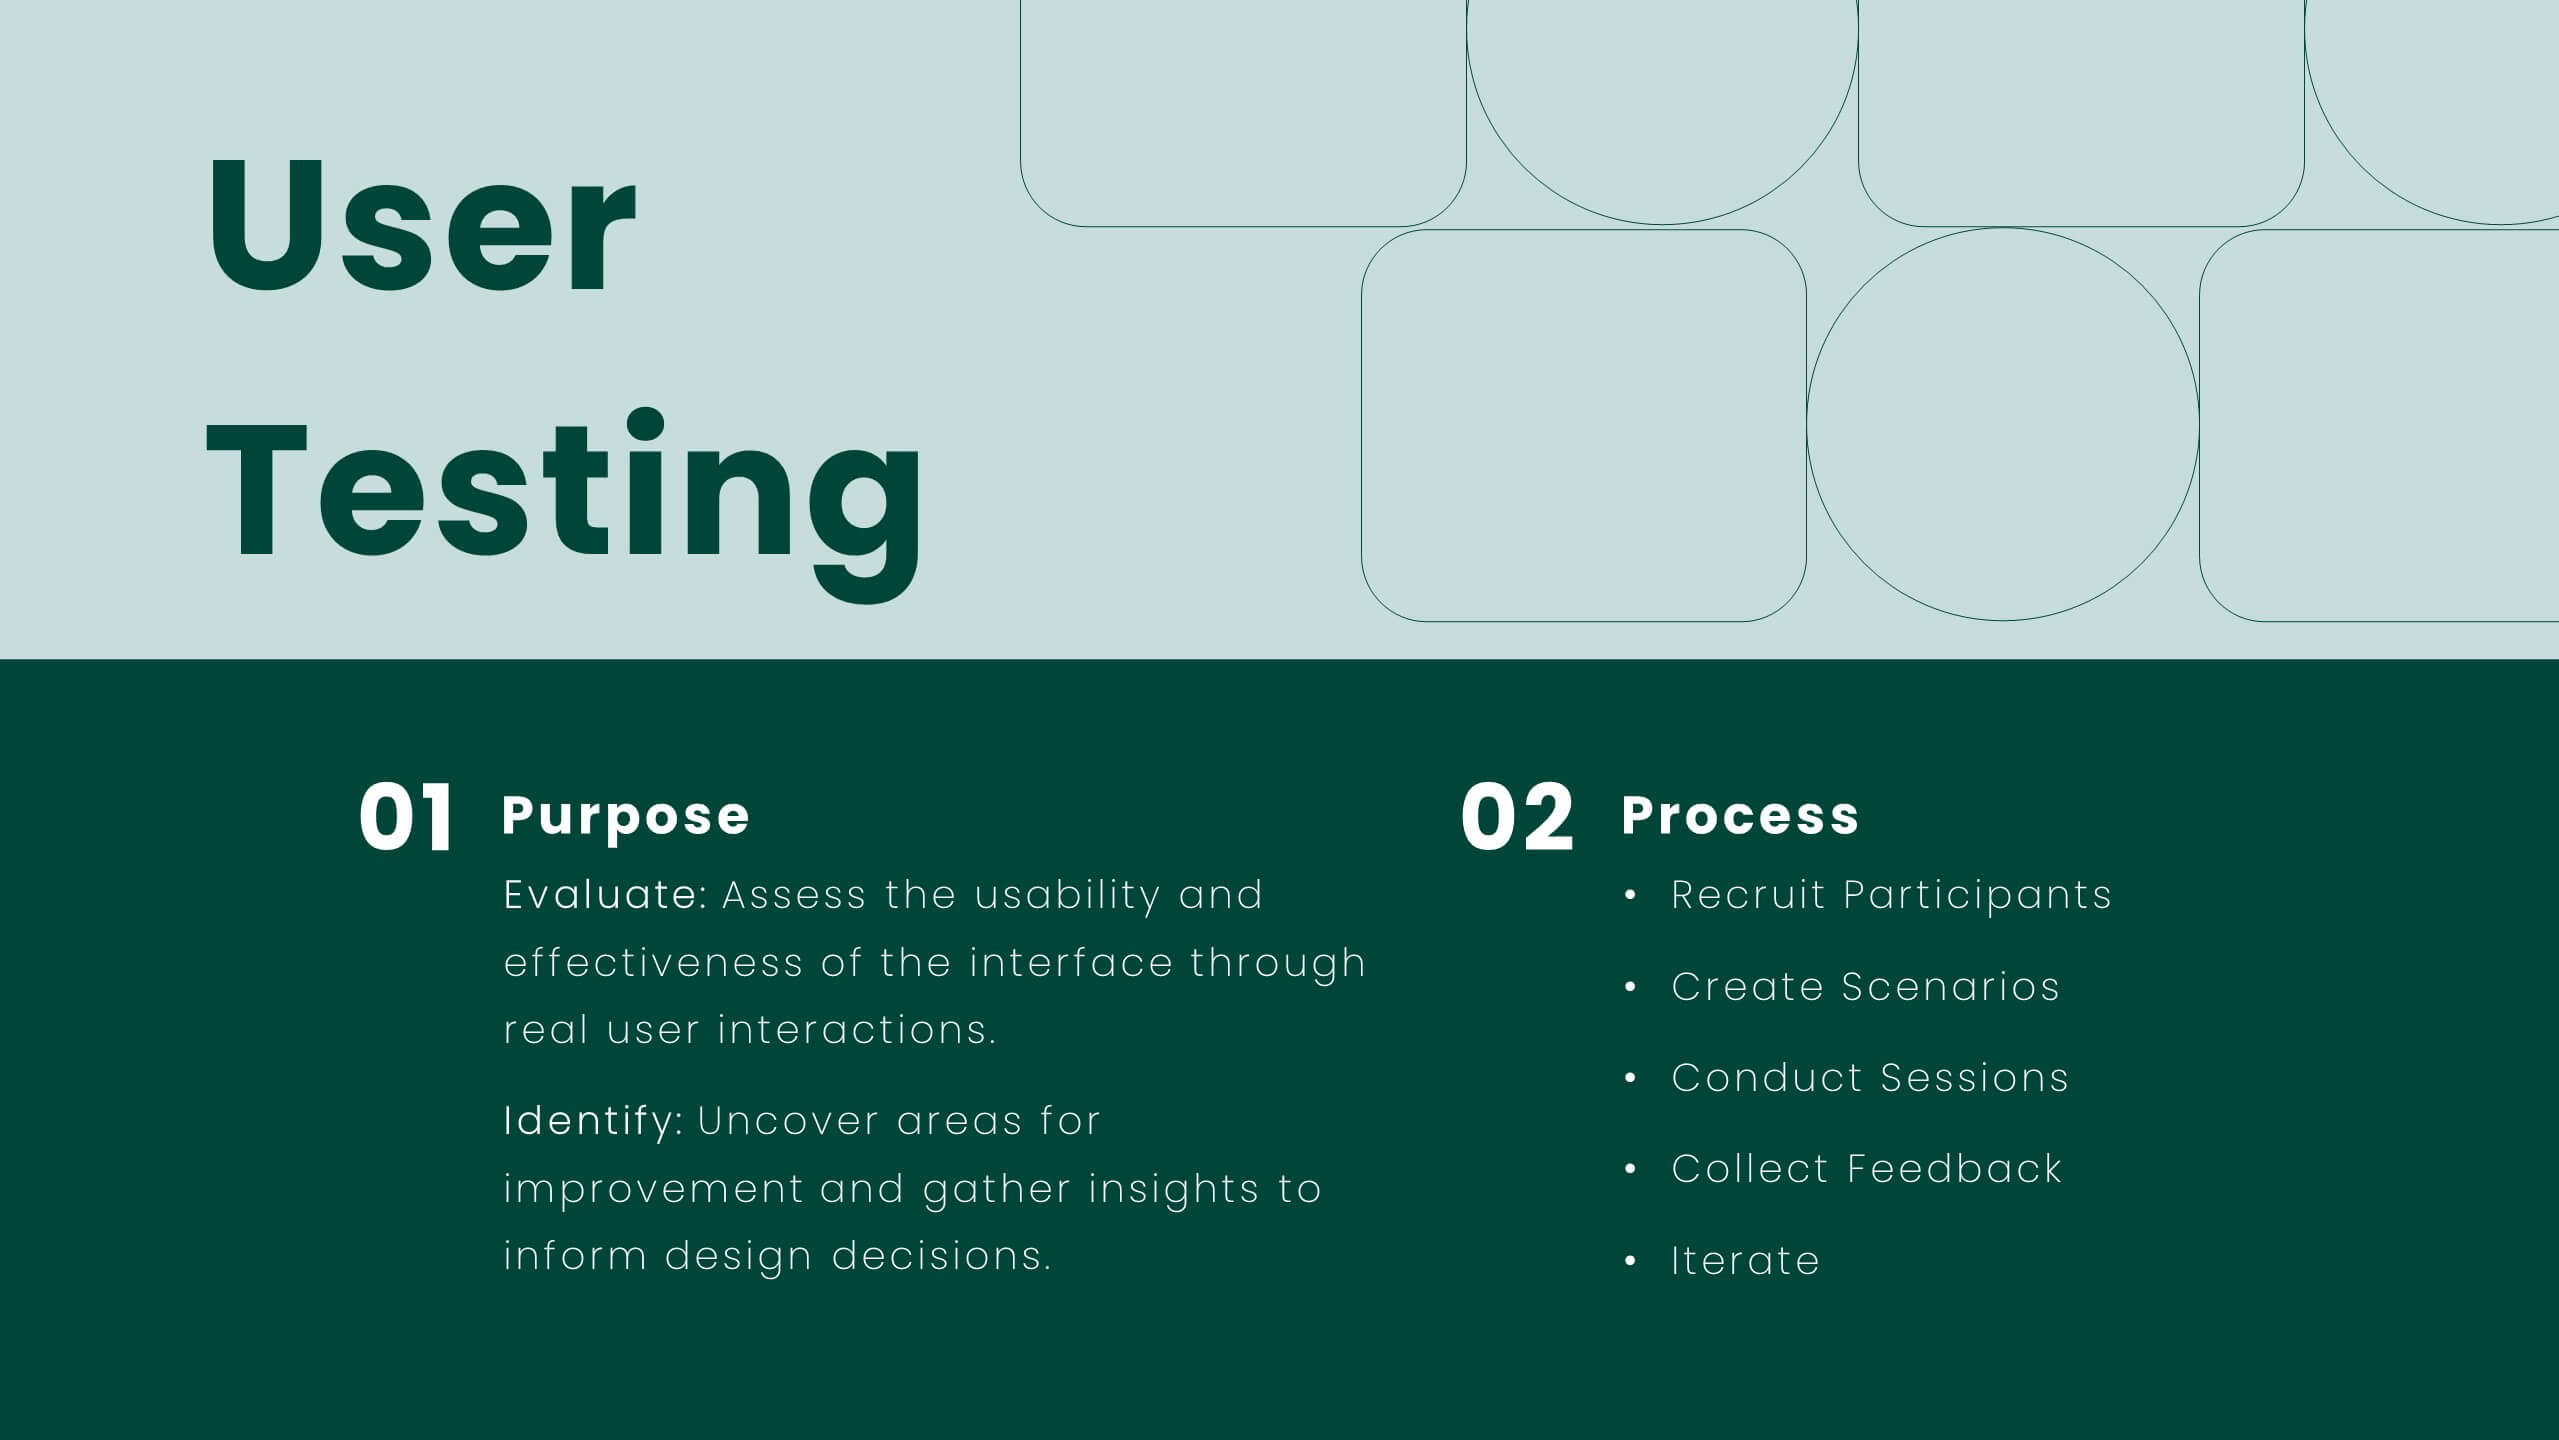
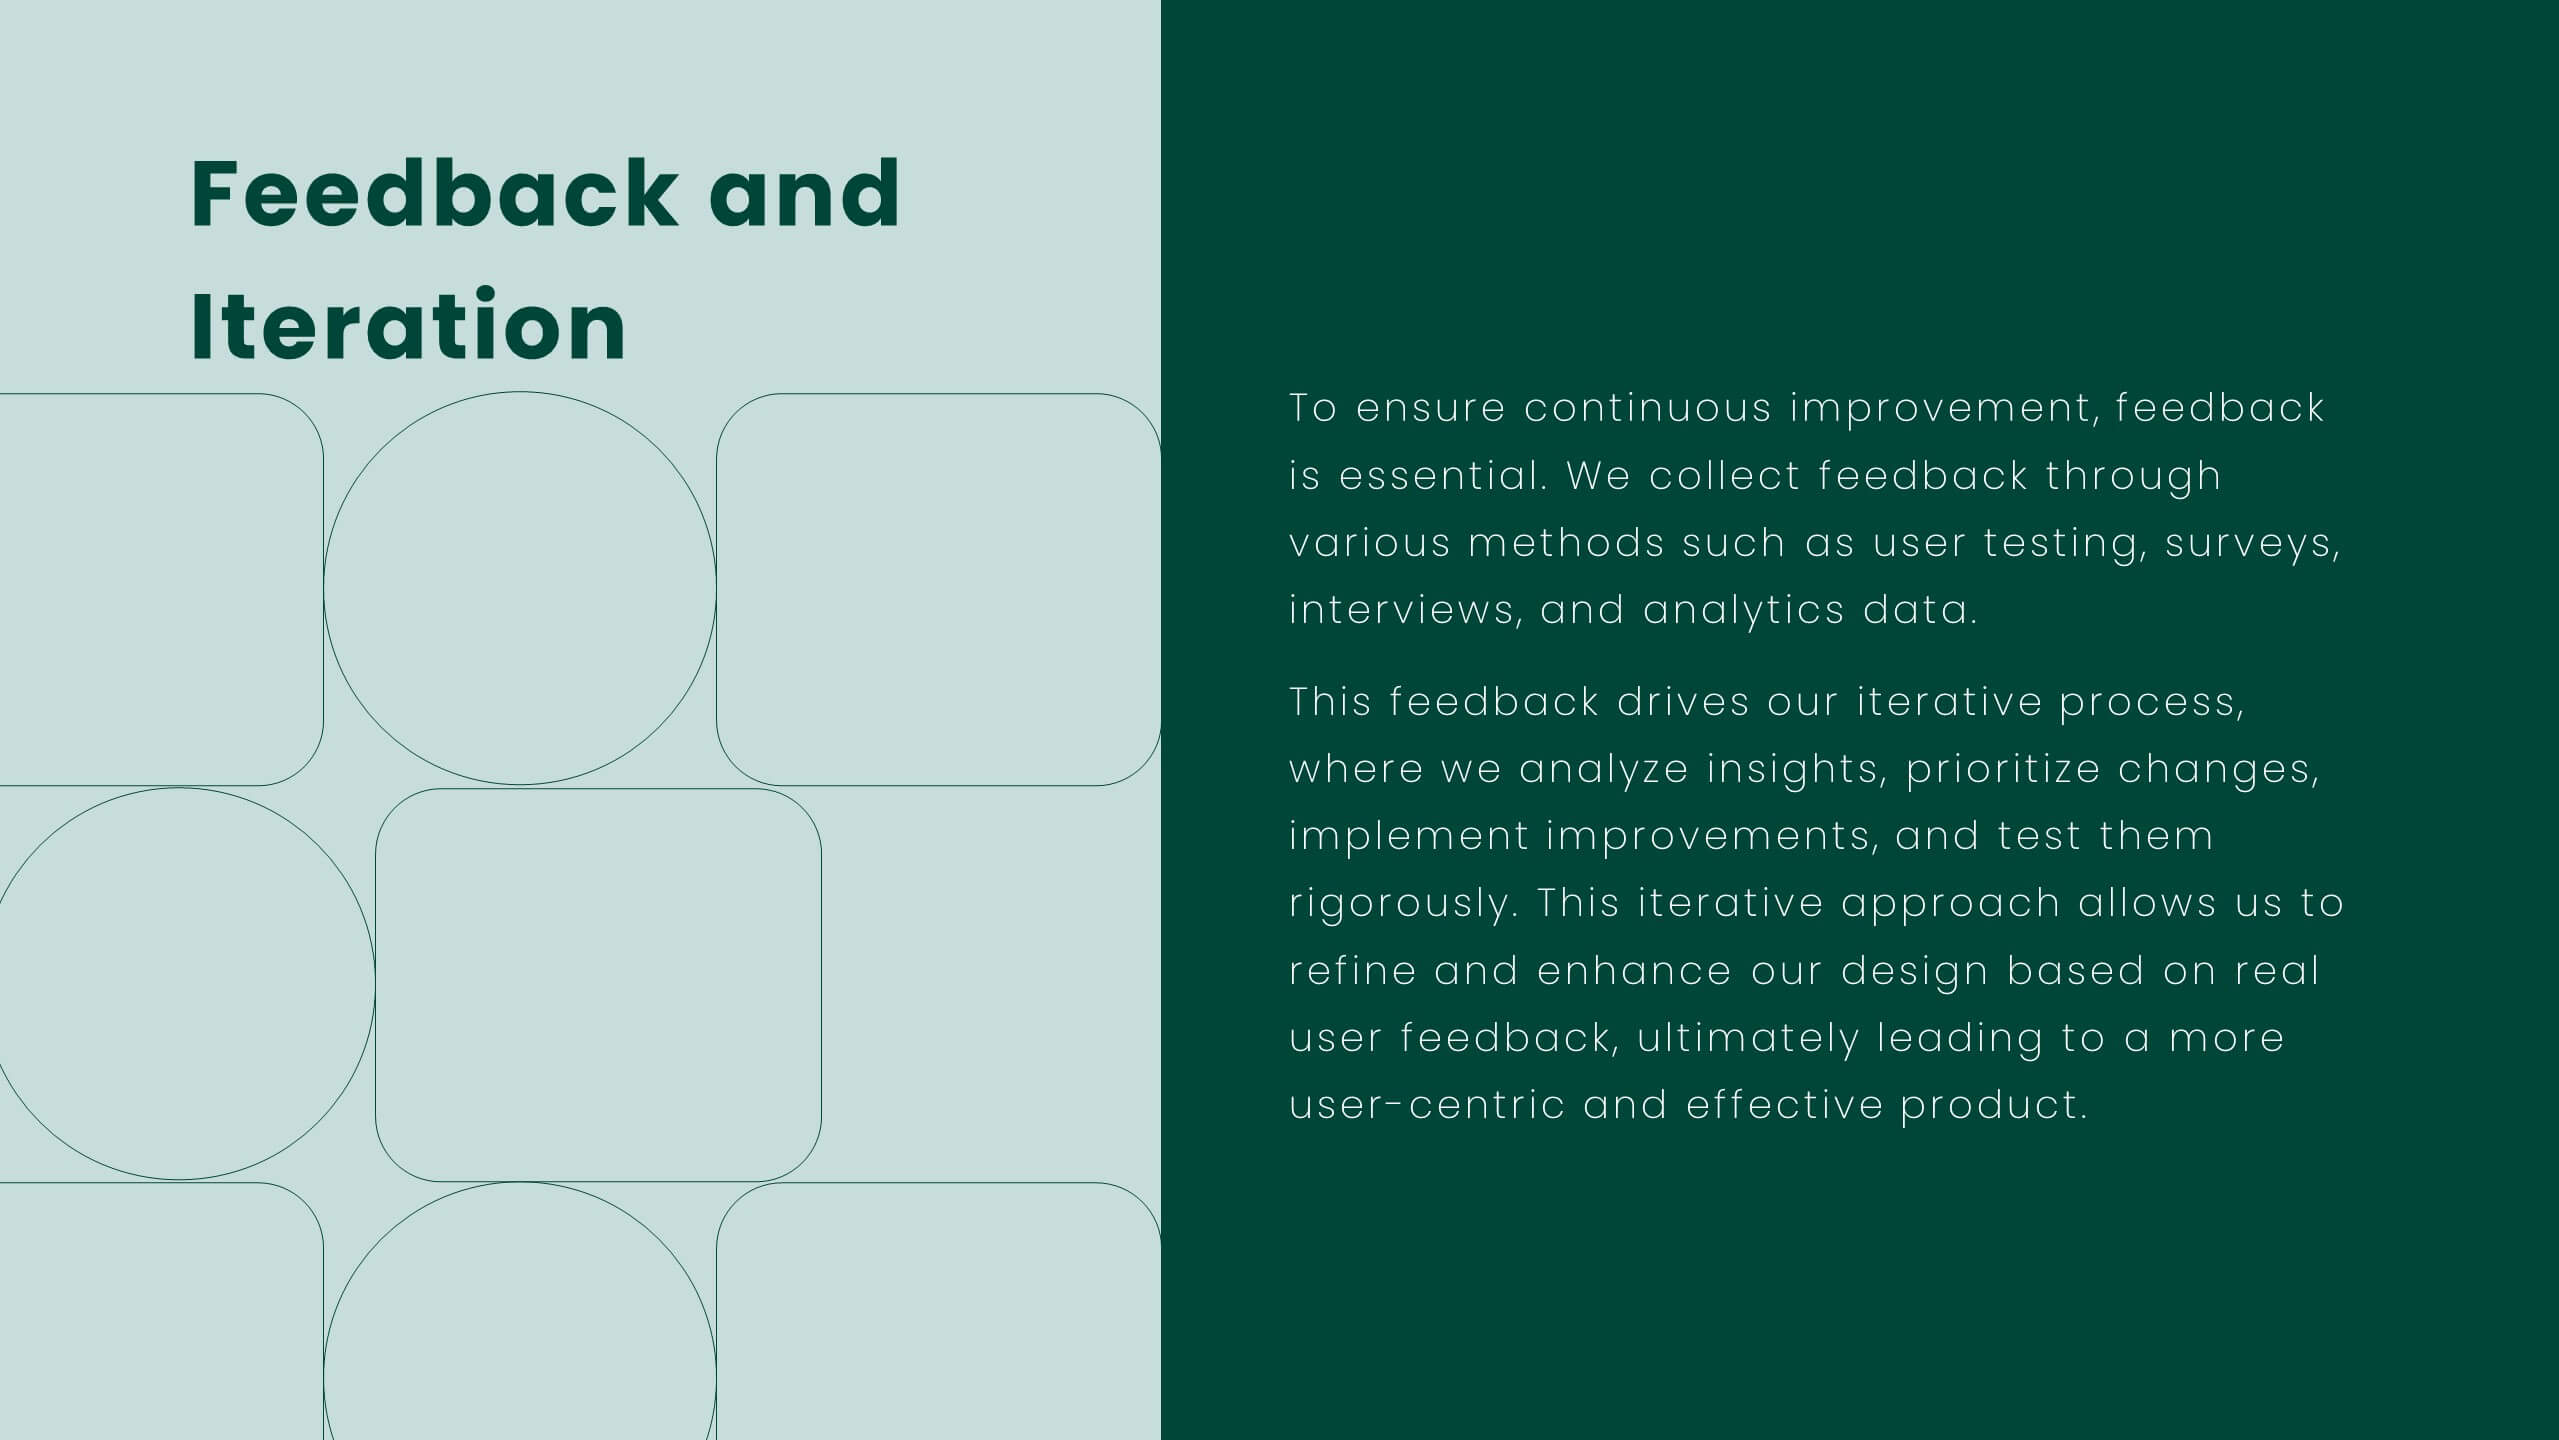
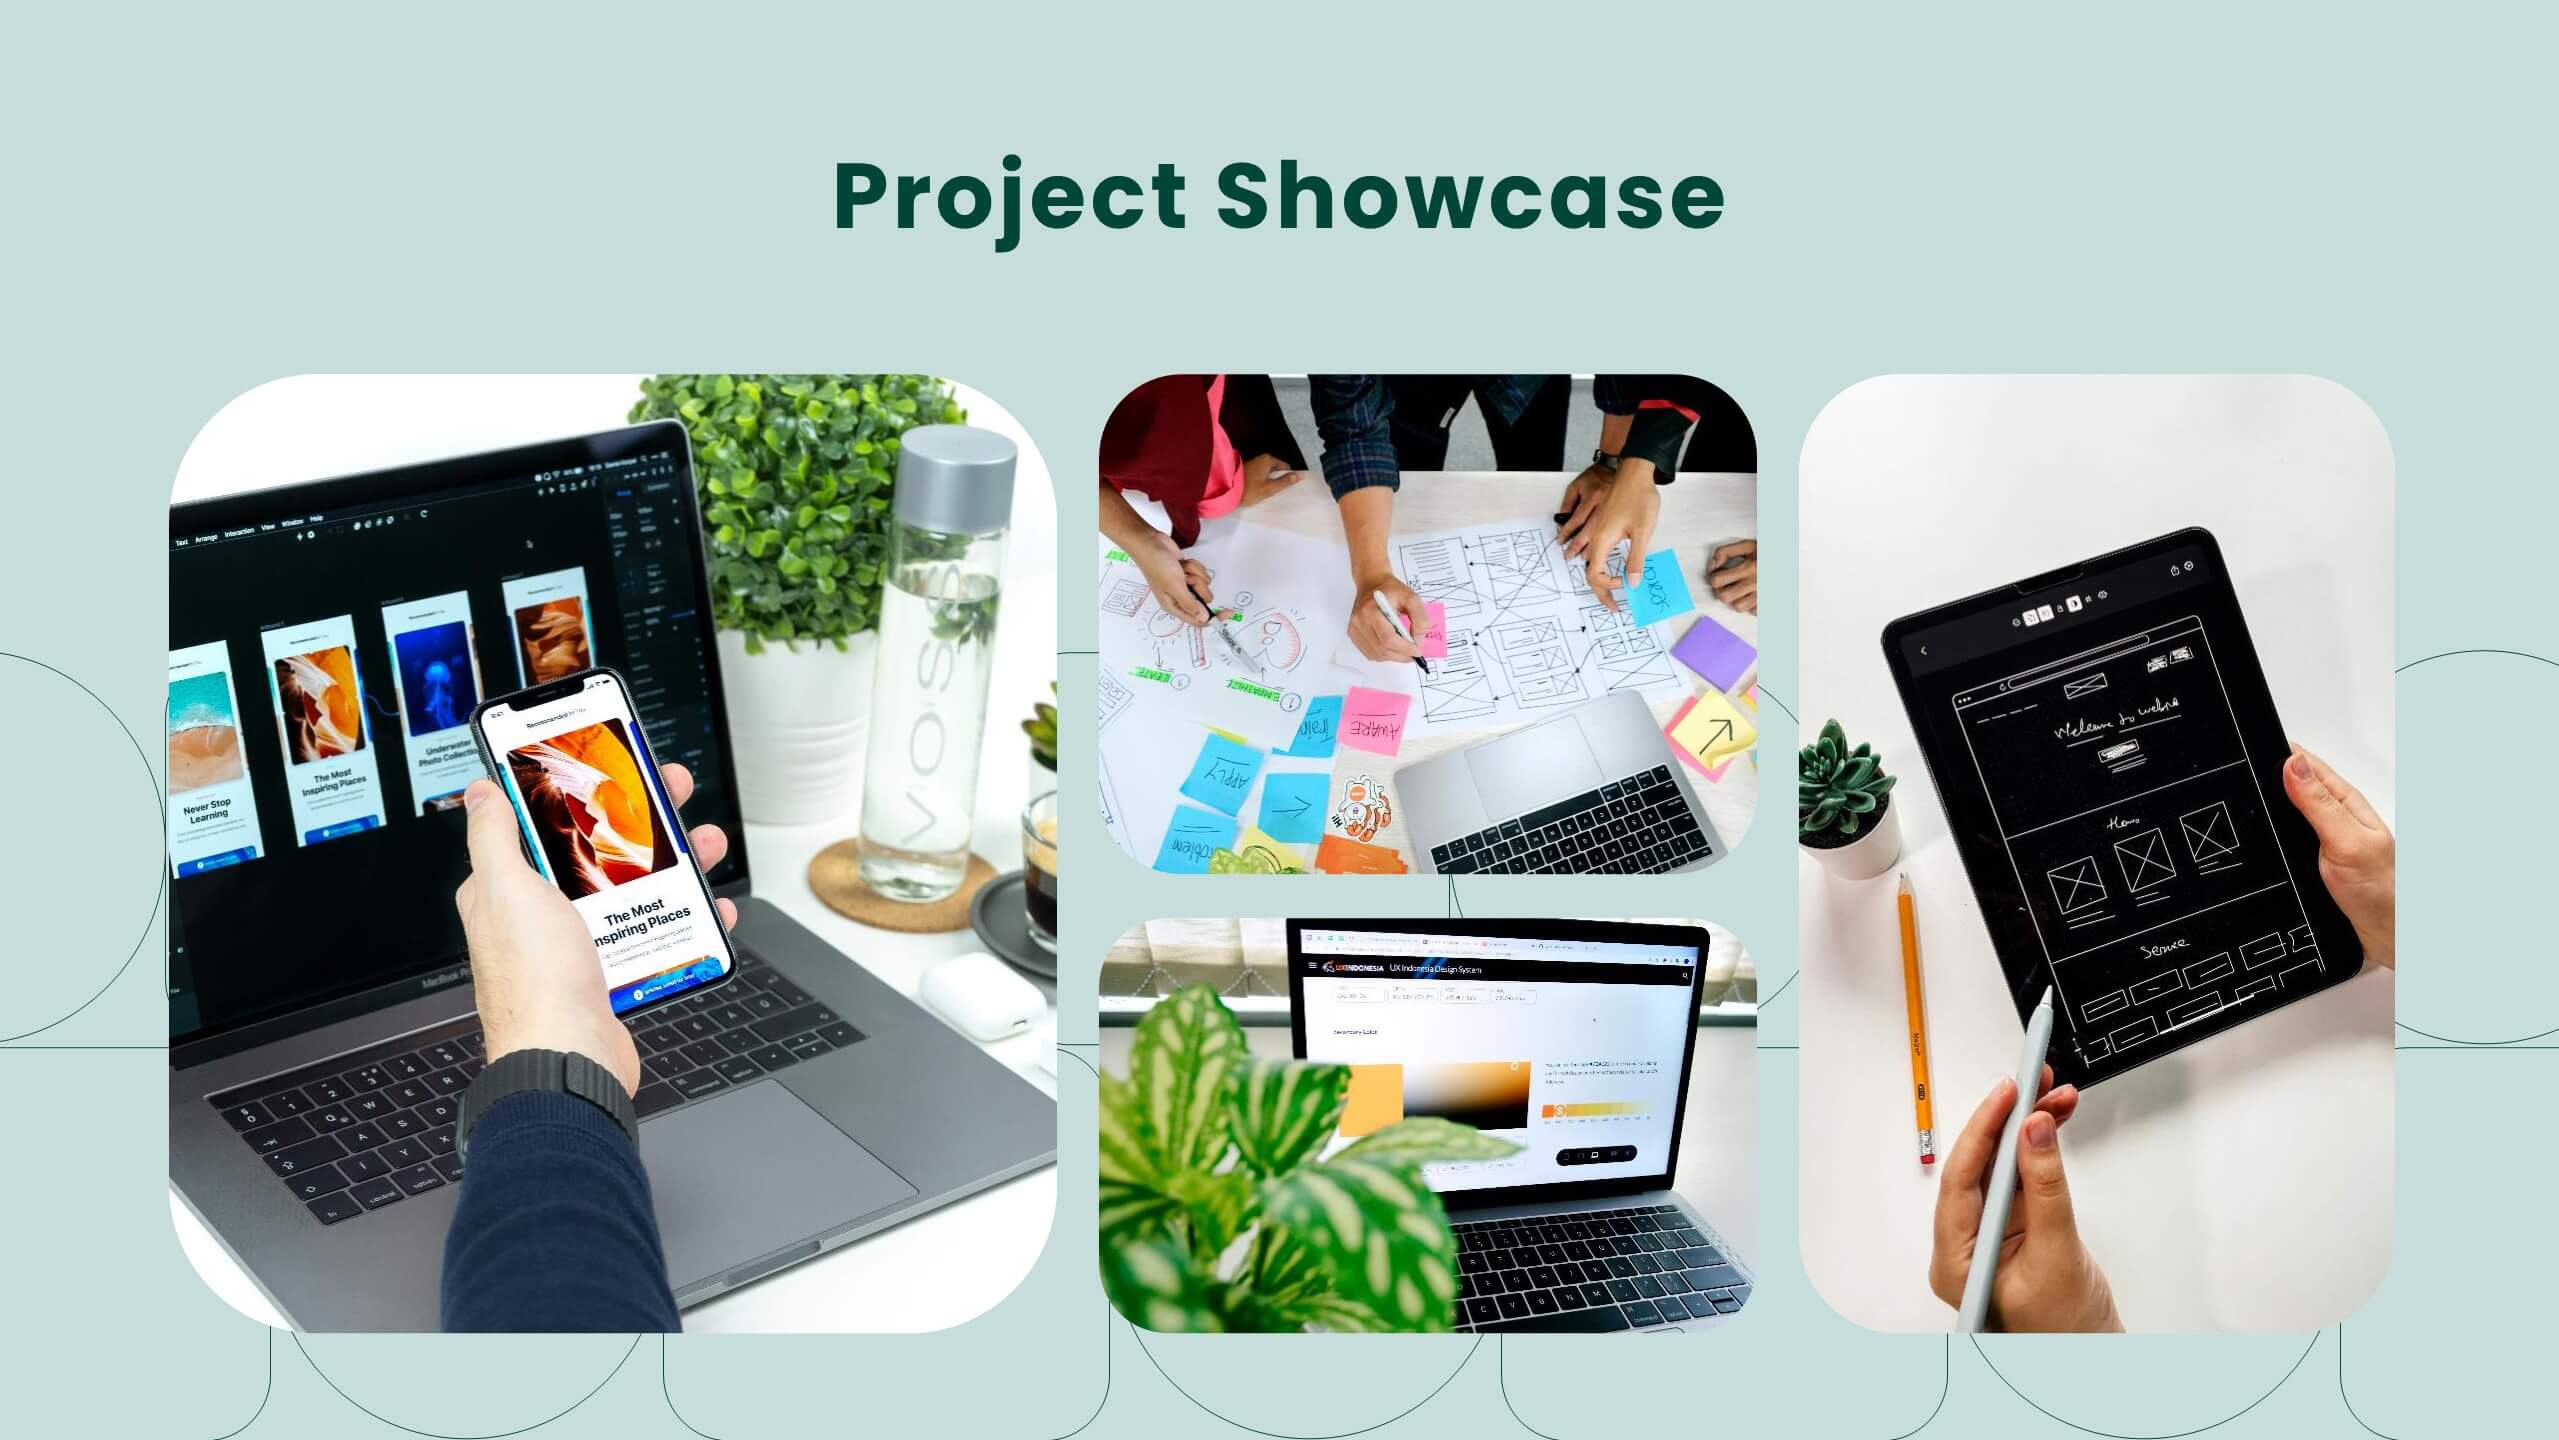
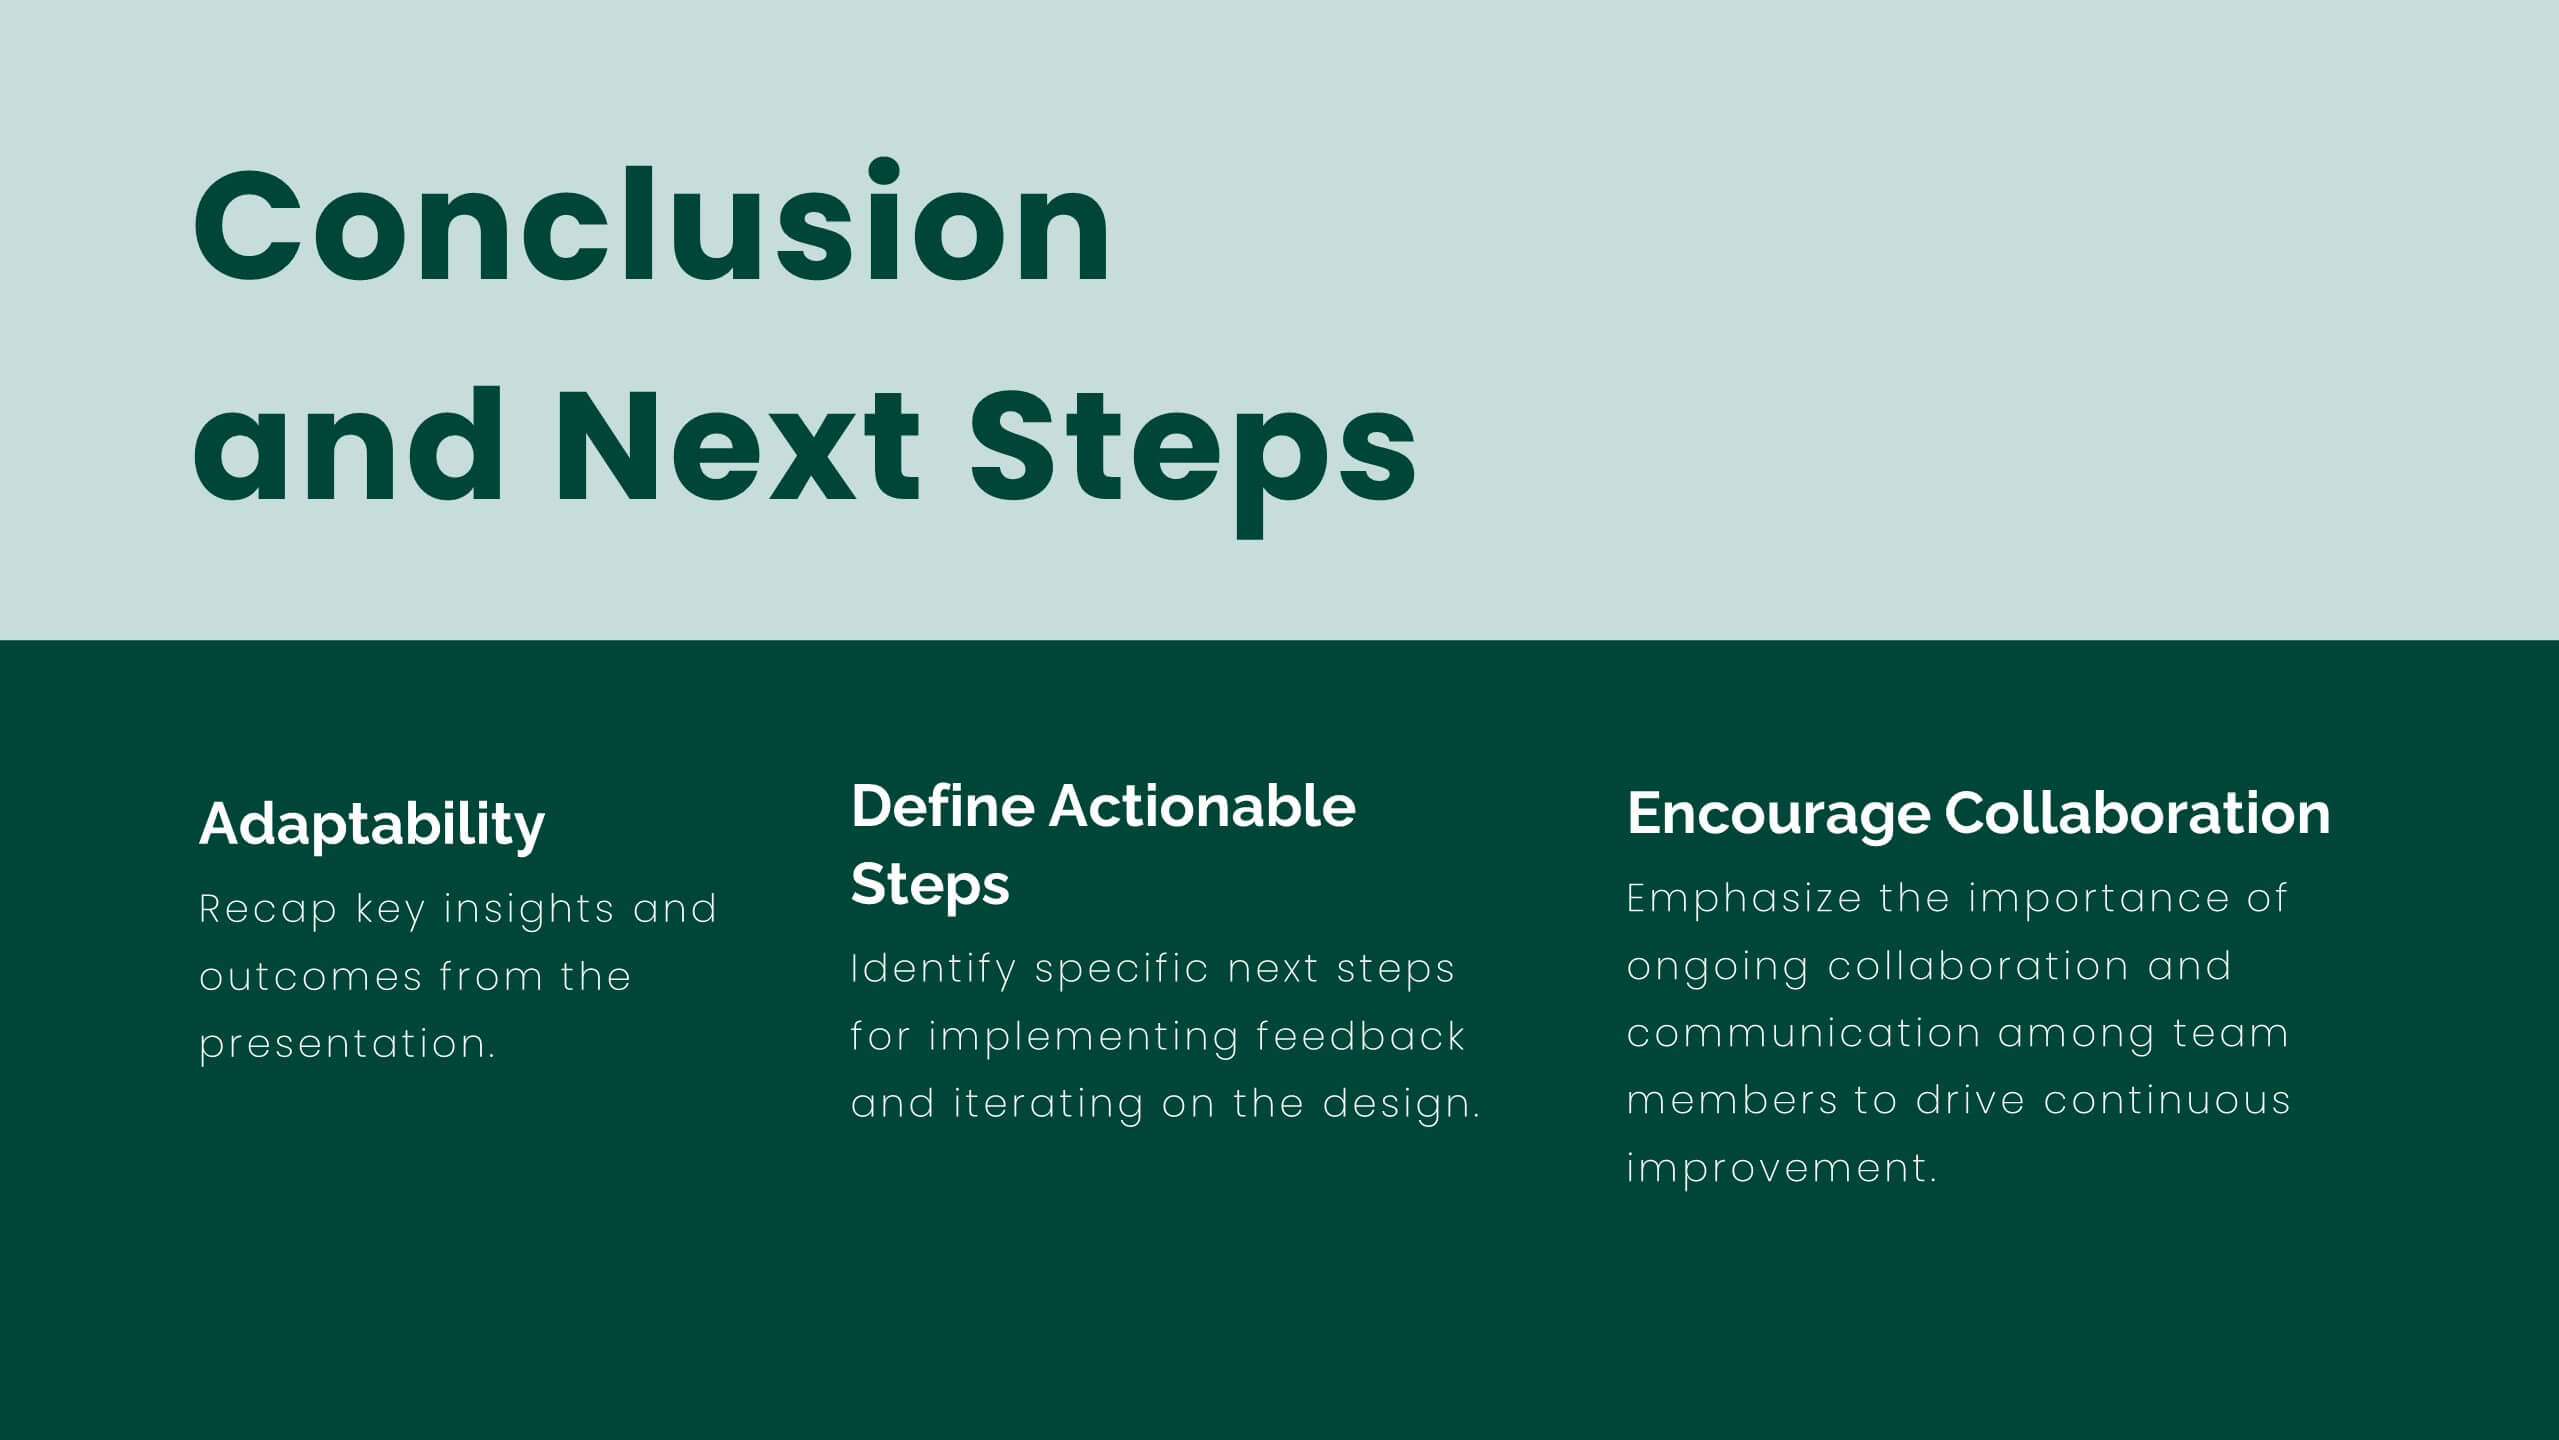
Lumina UX Case Study Presentation
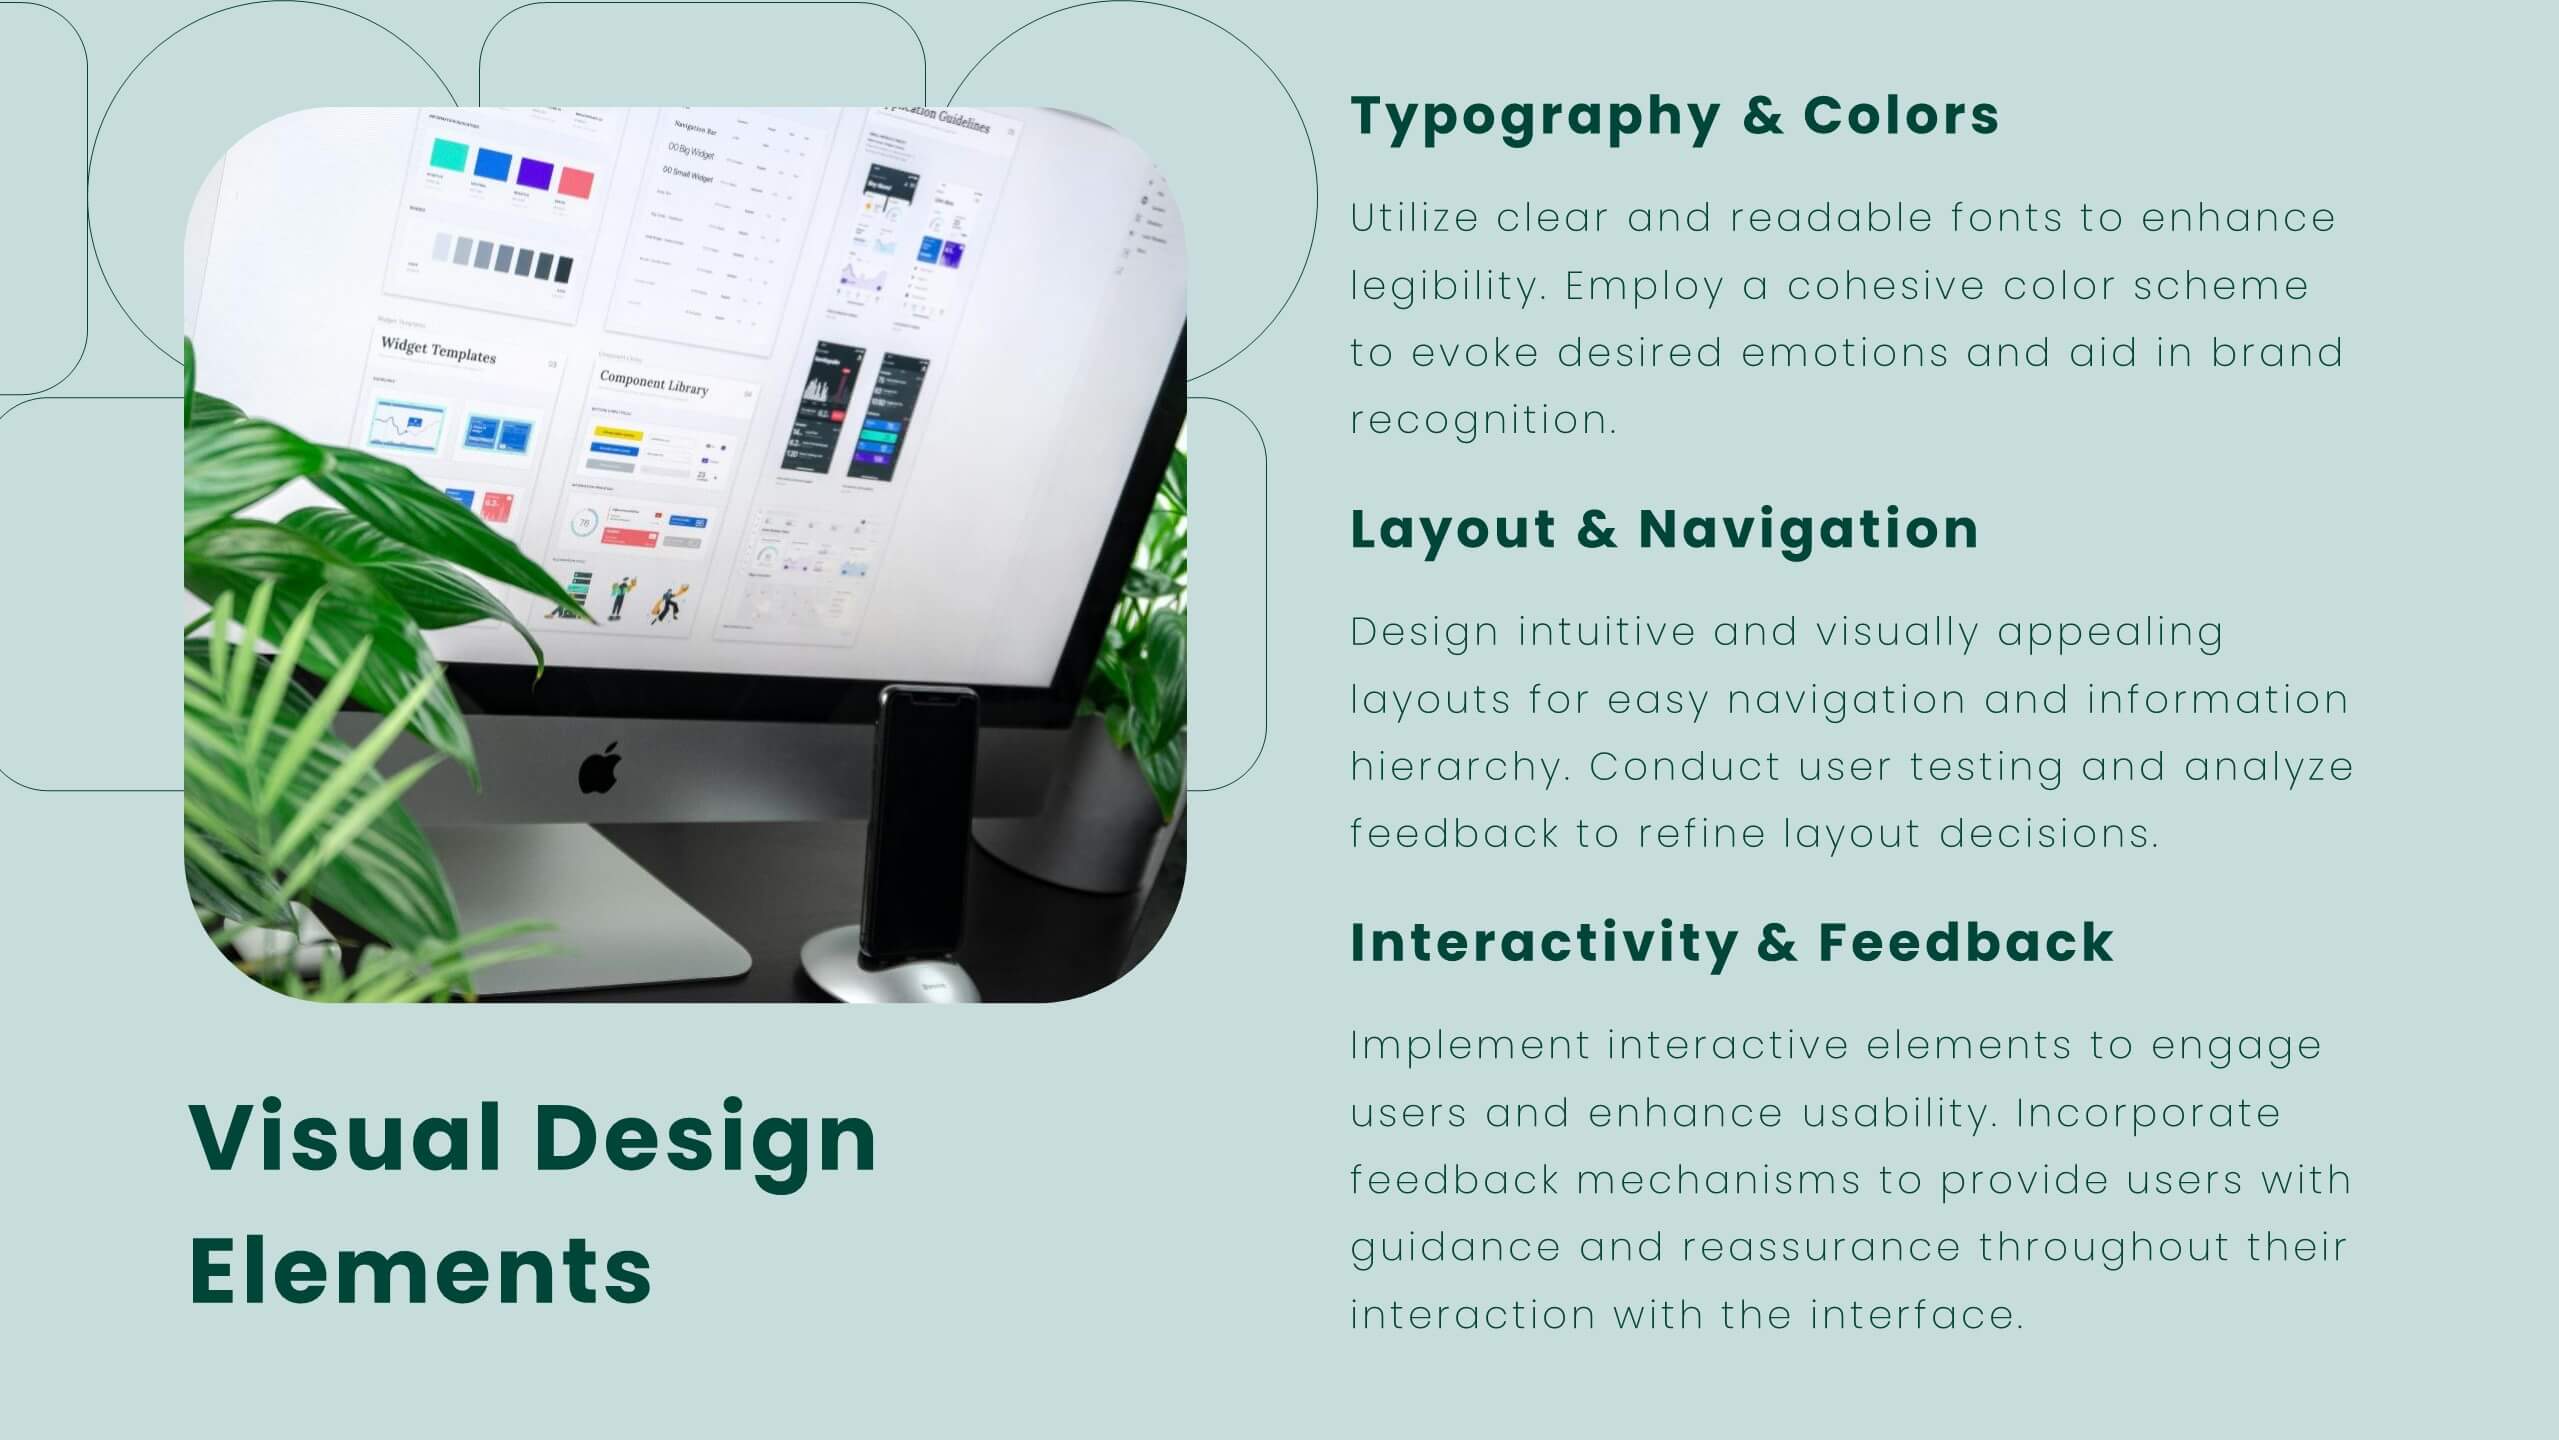
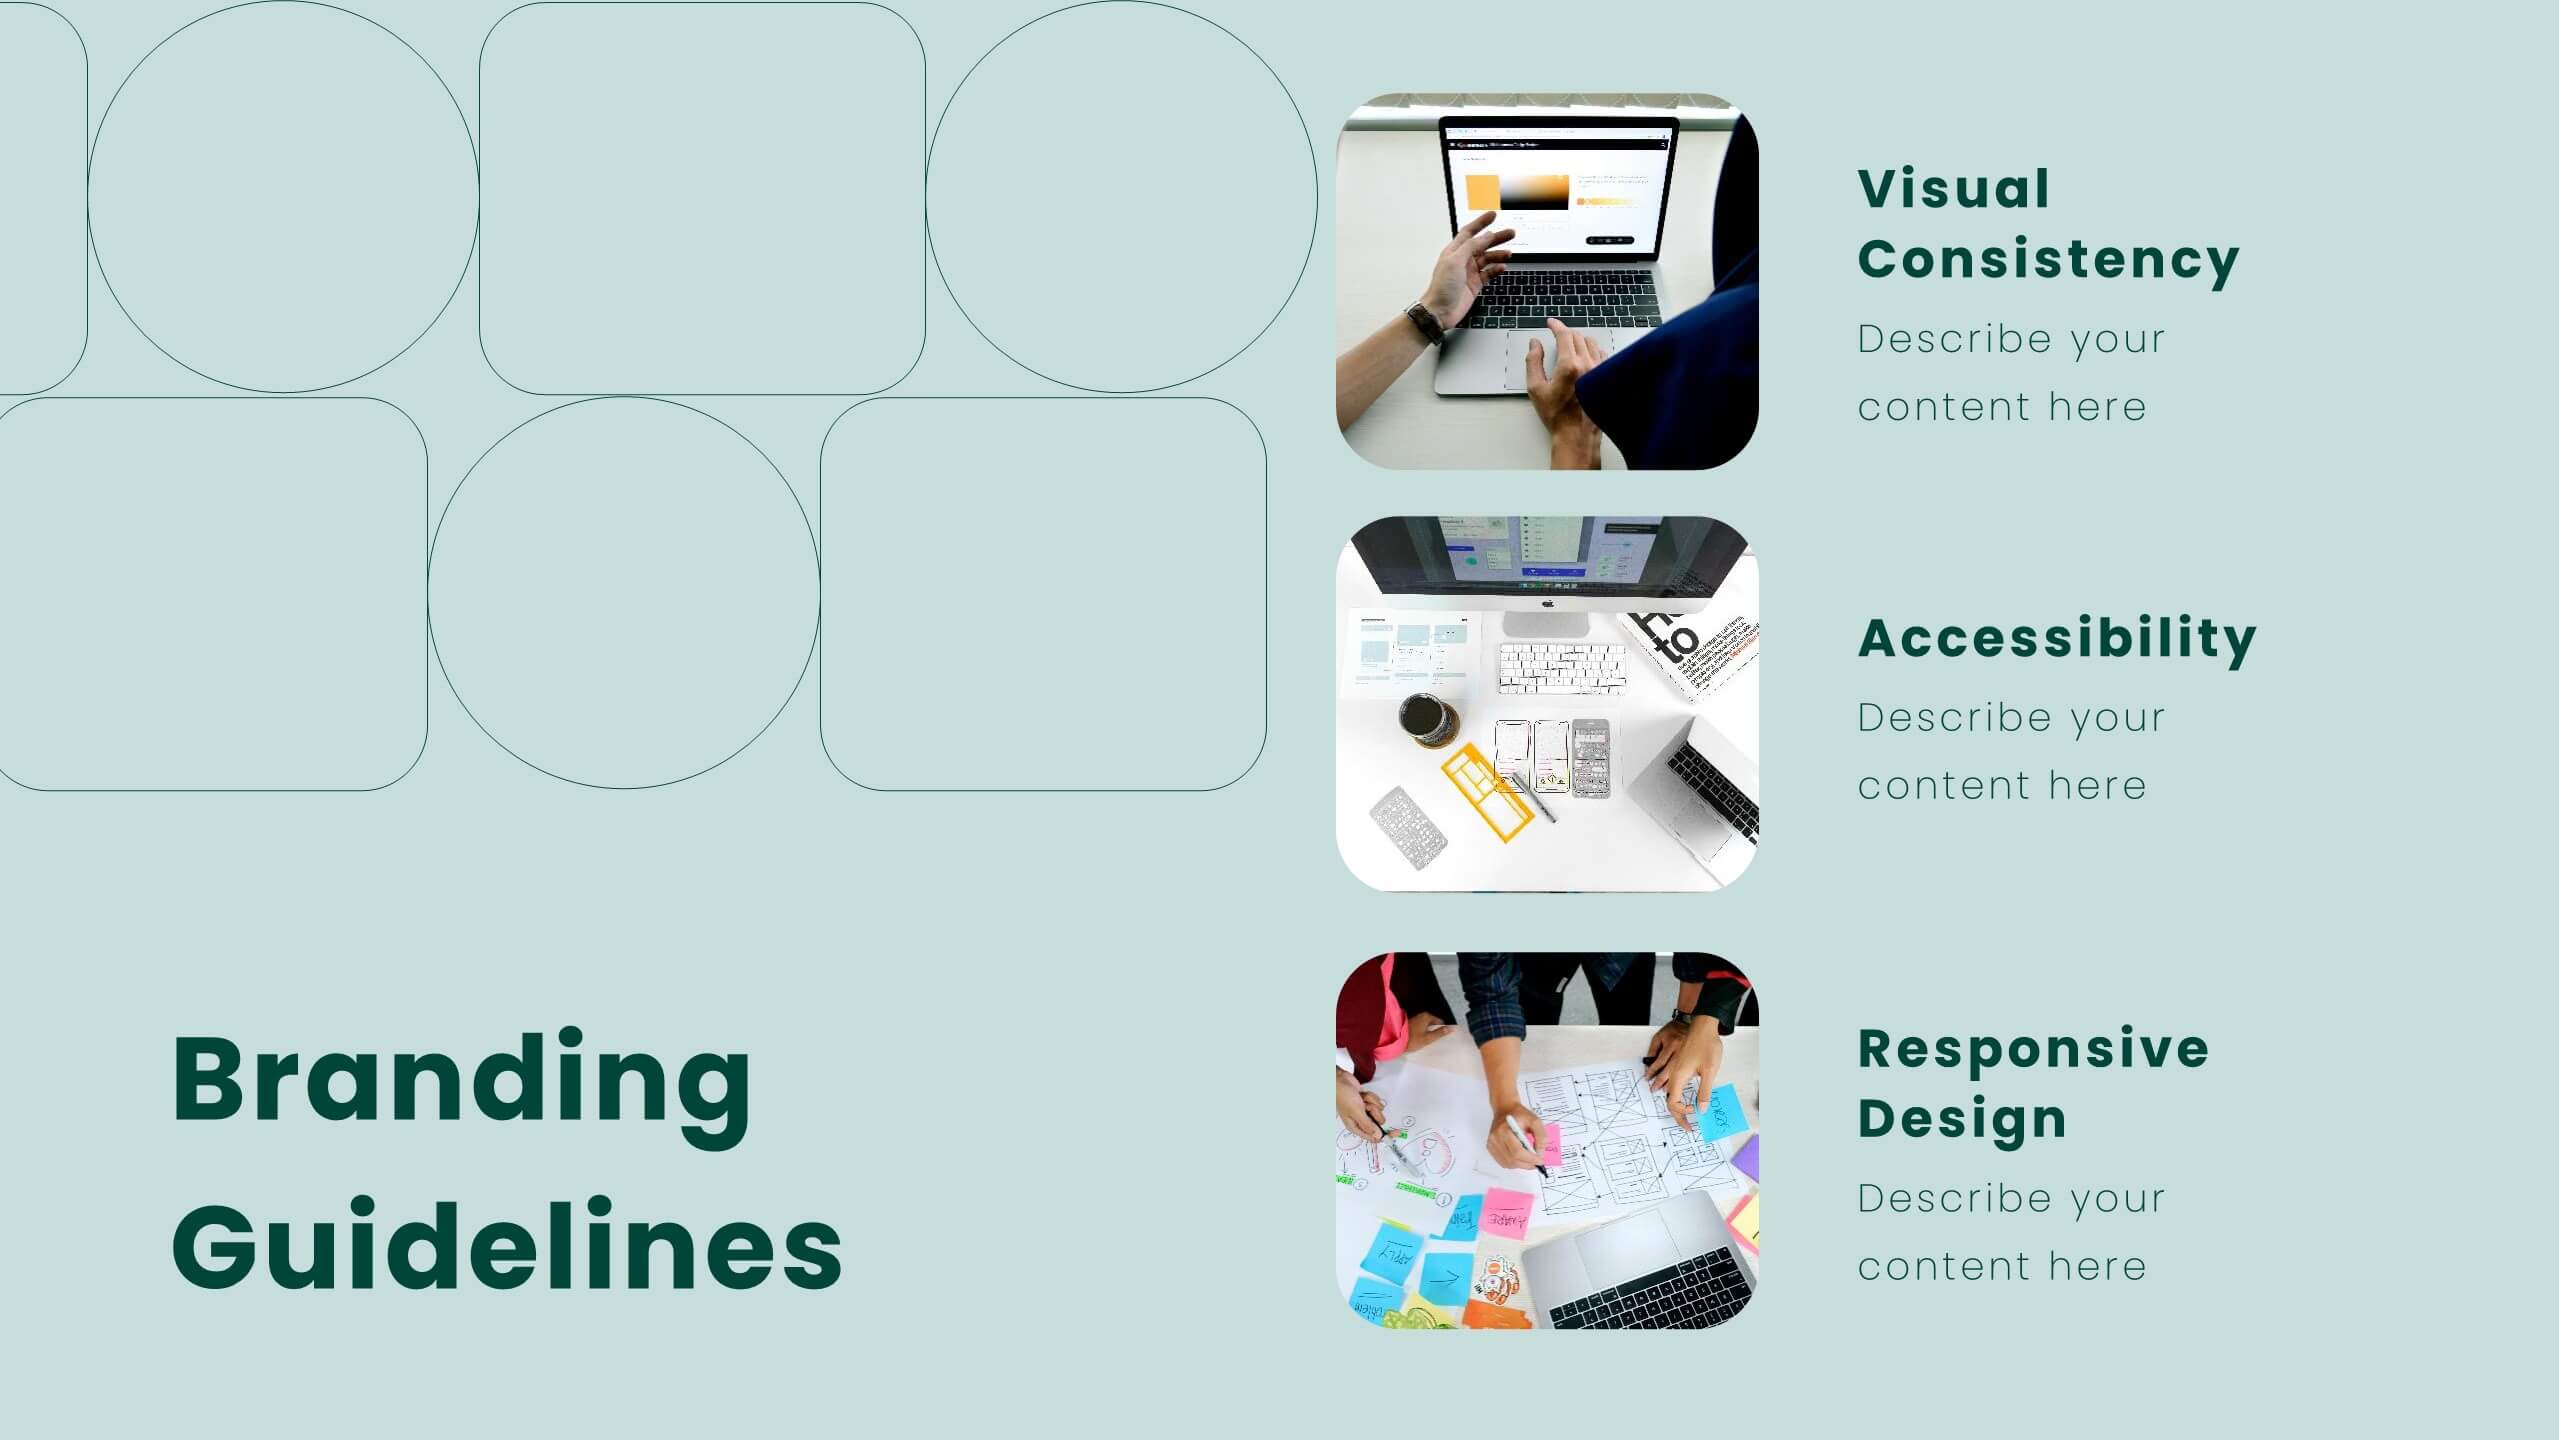
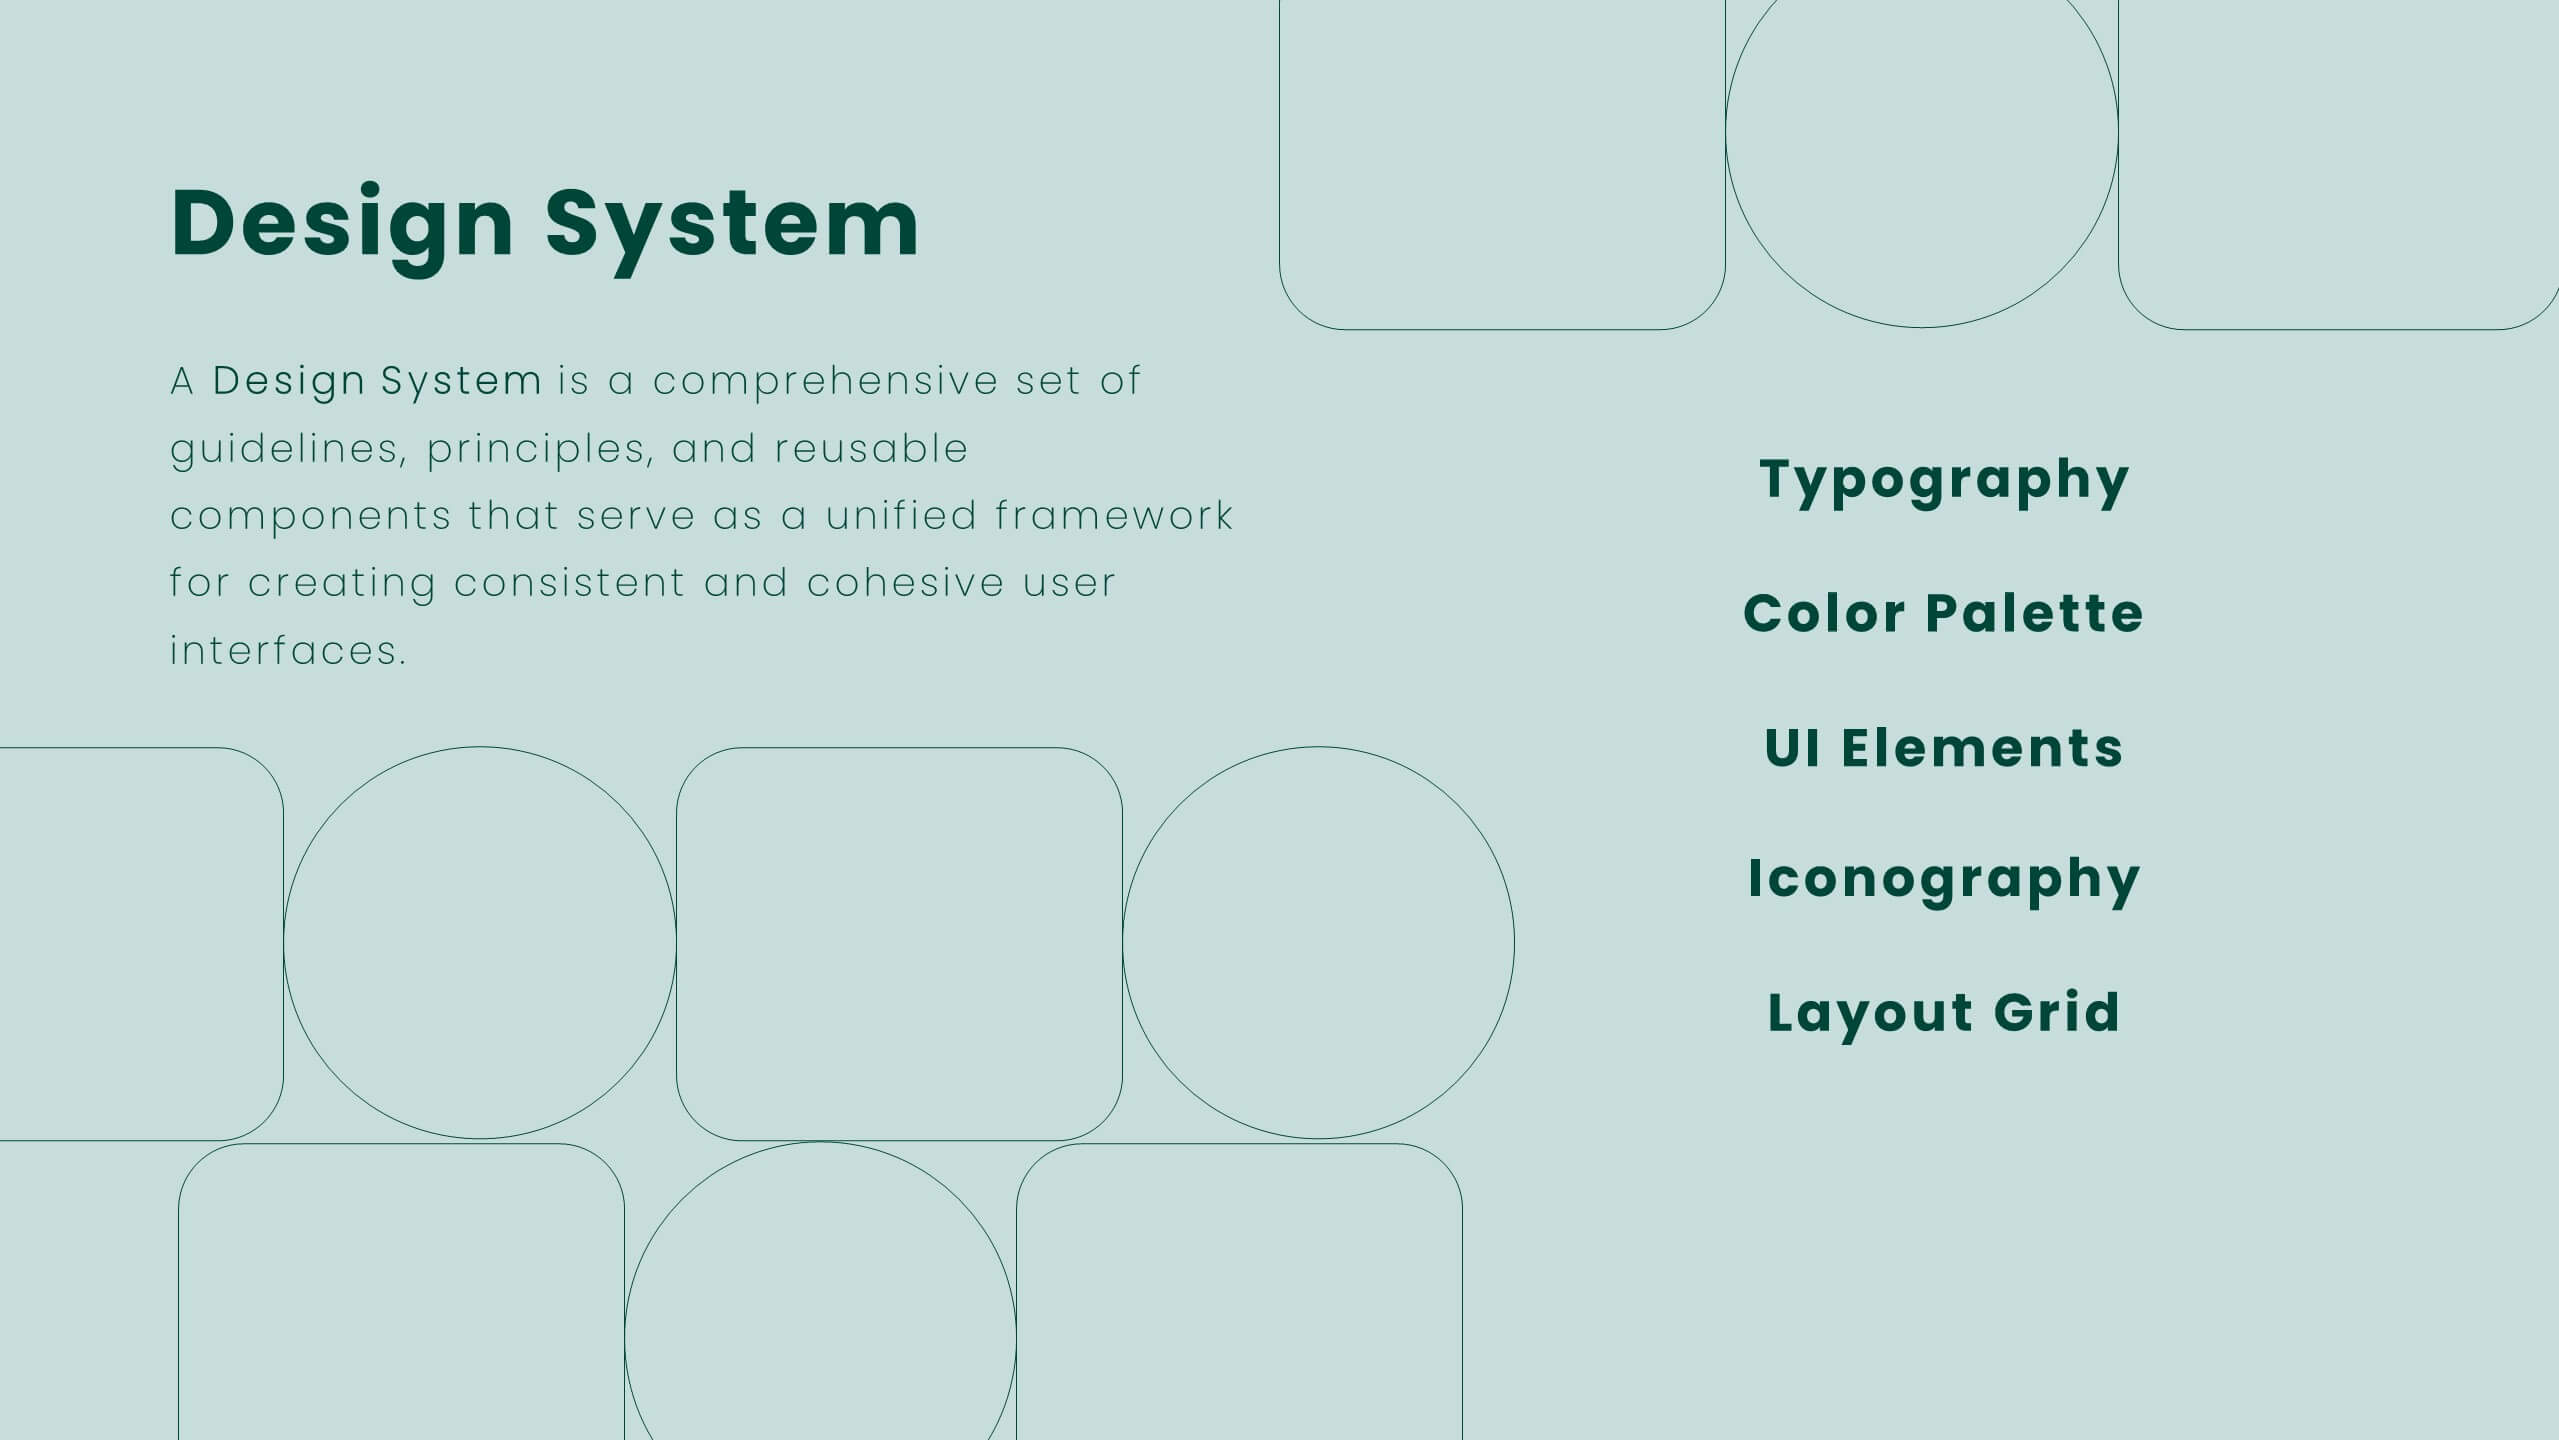
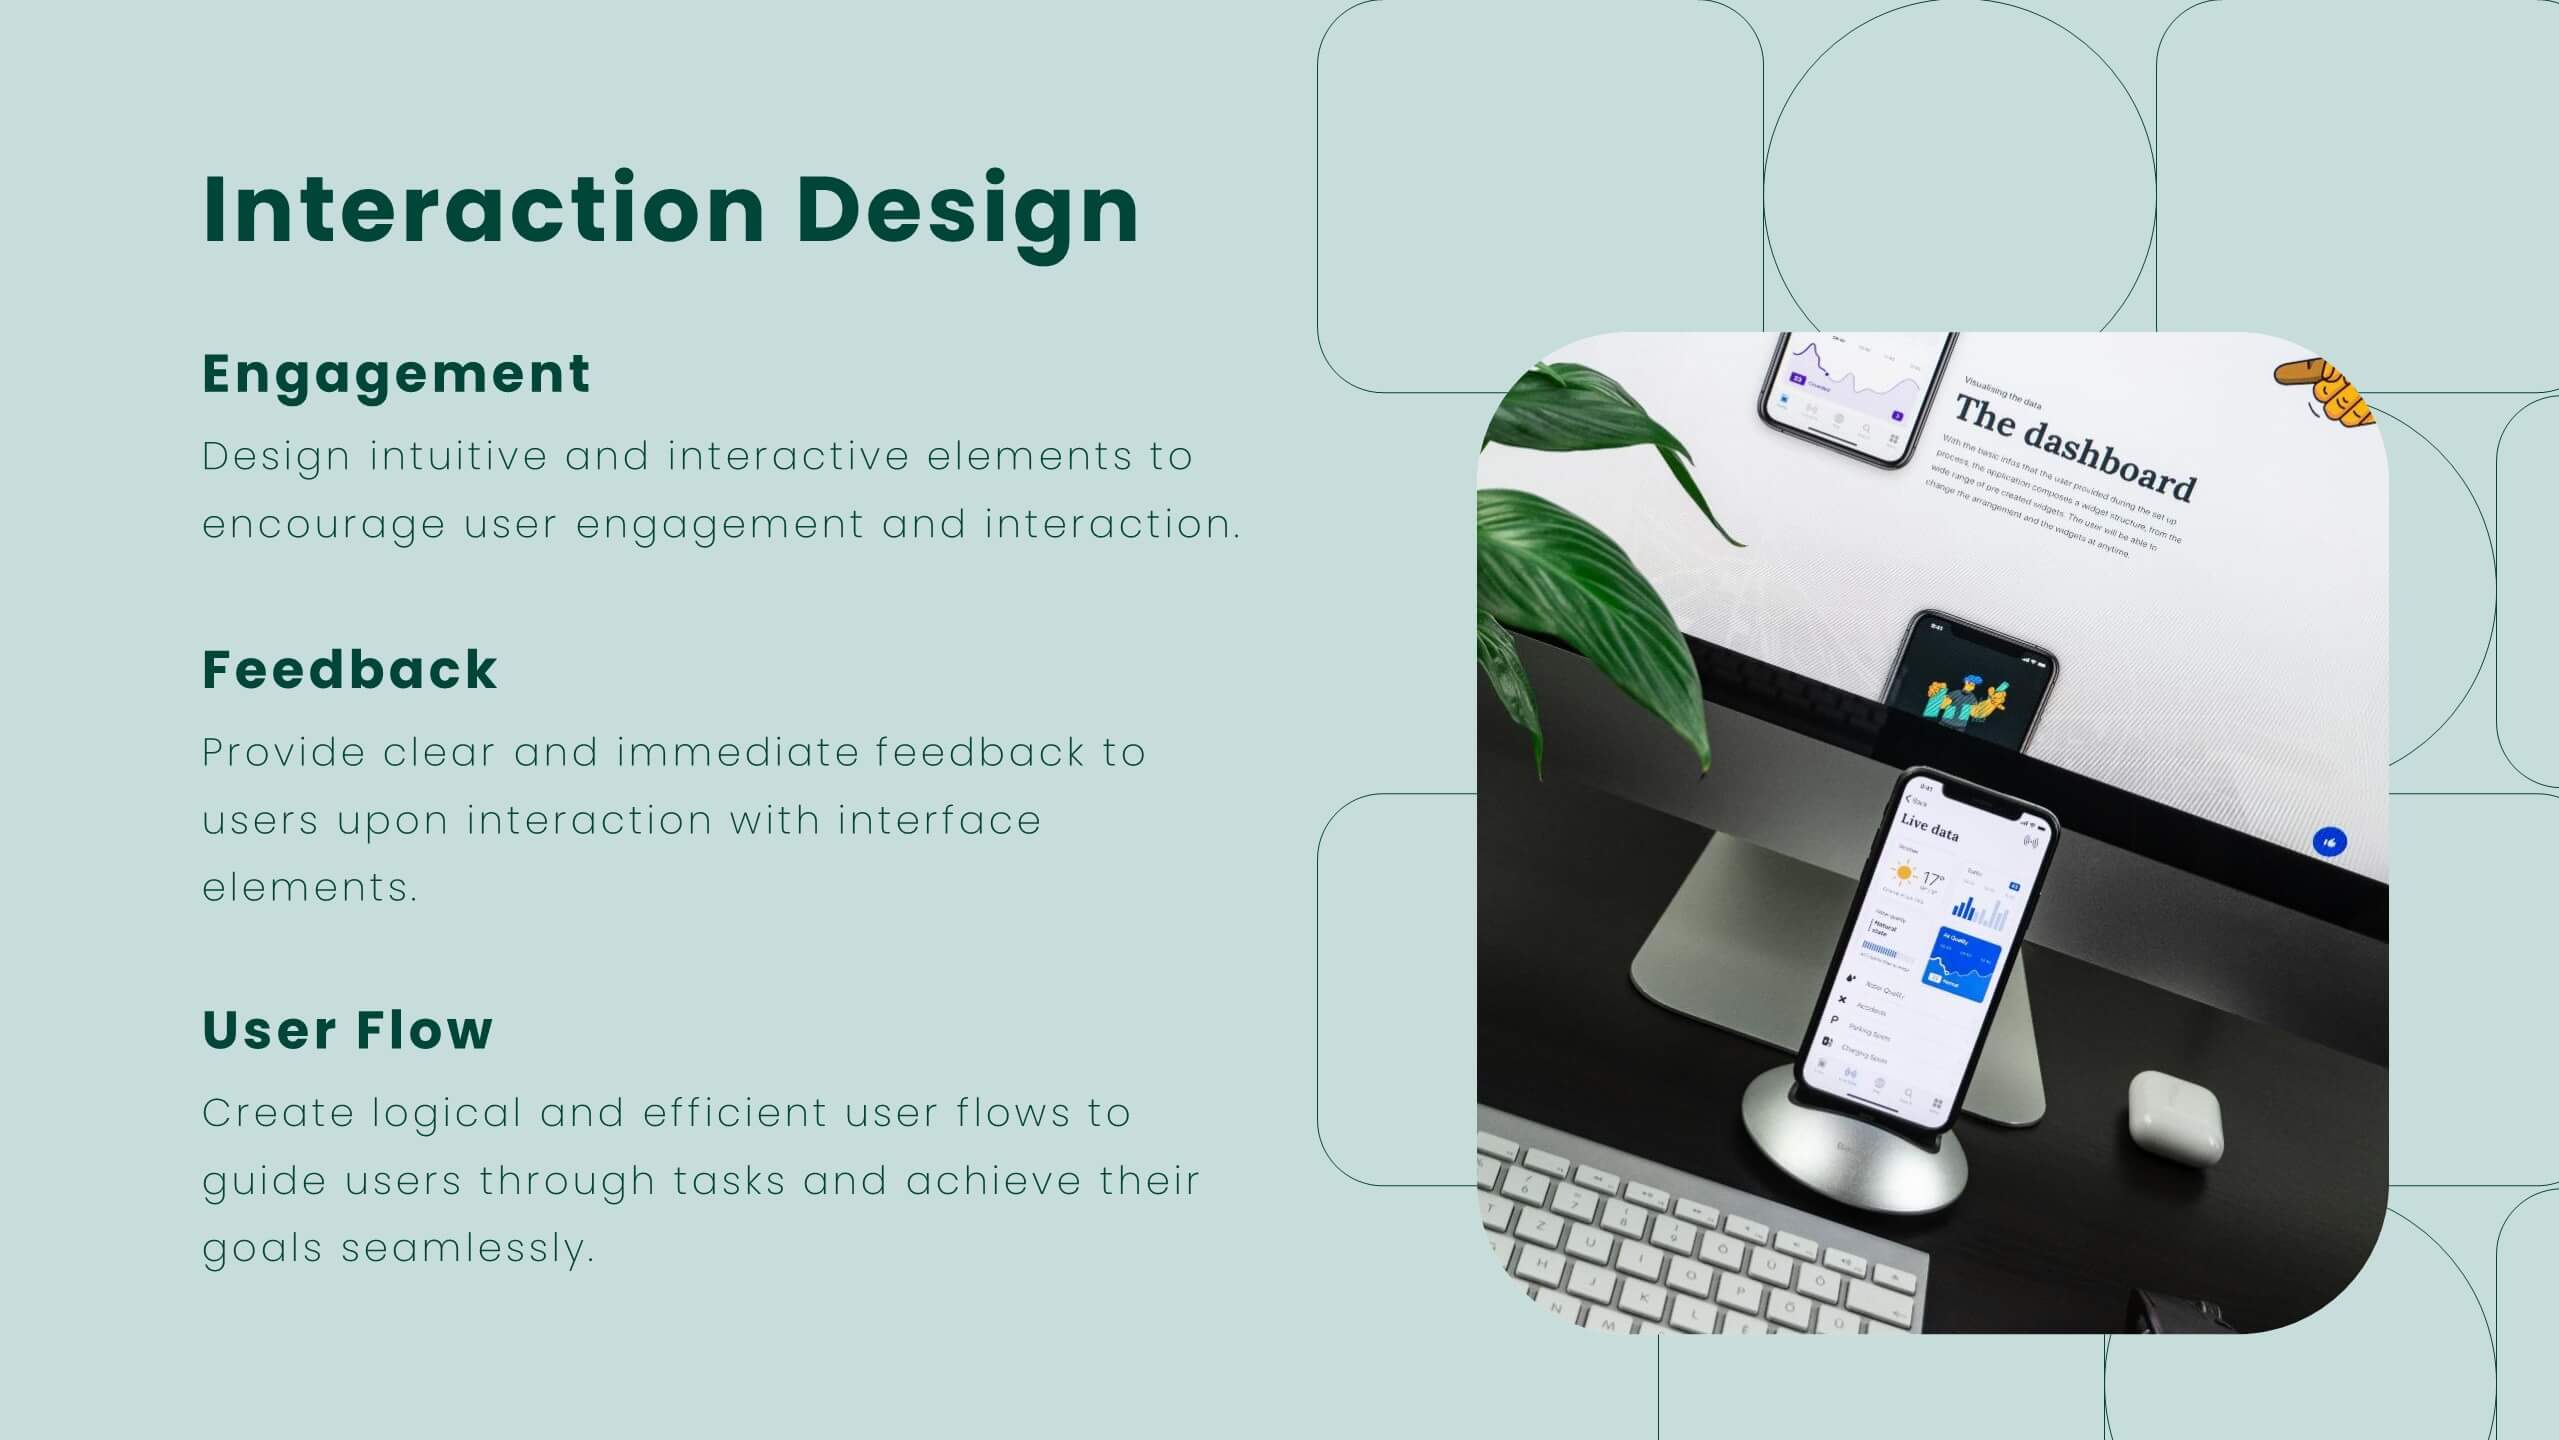
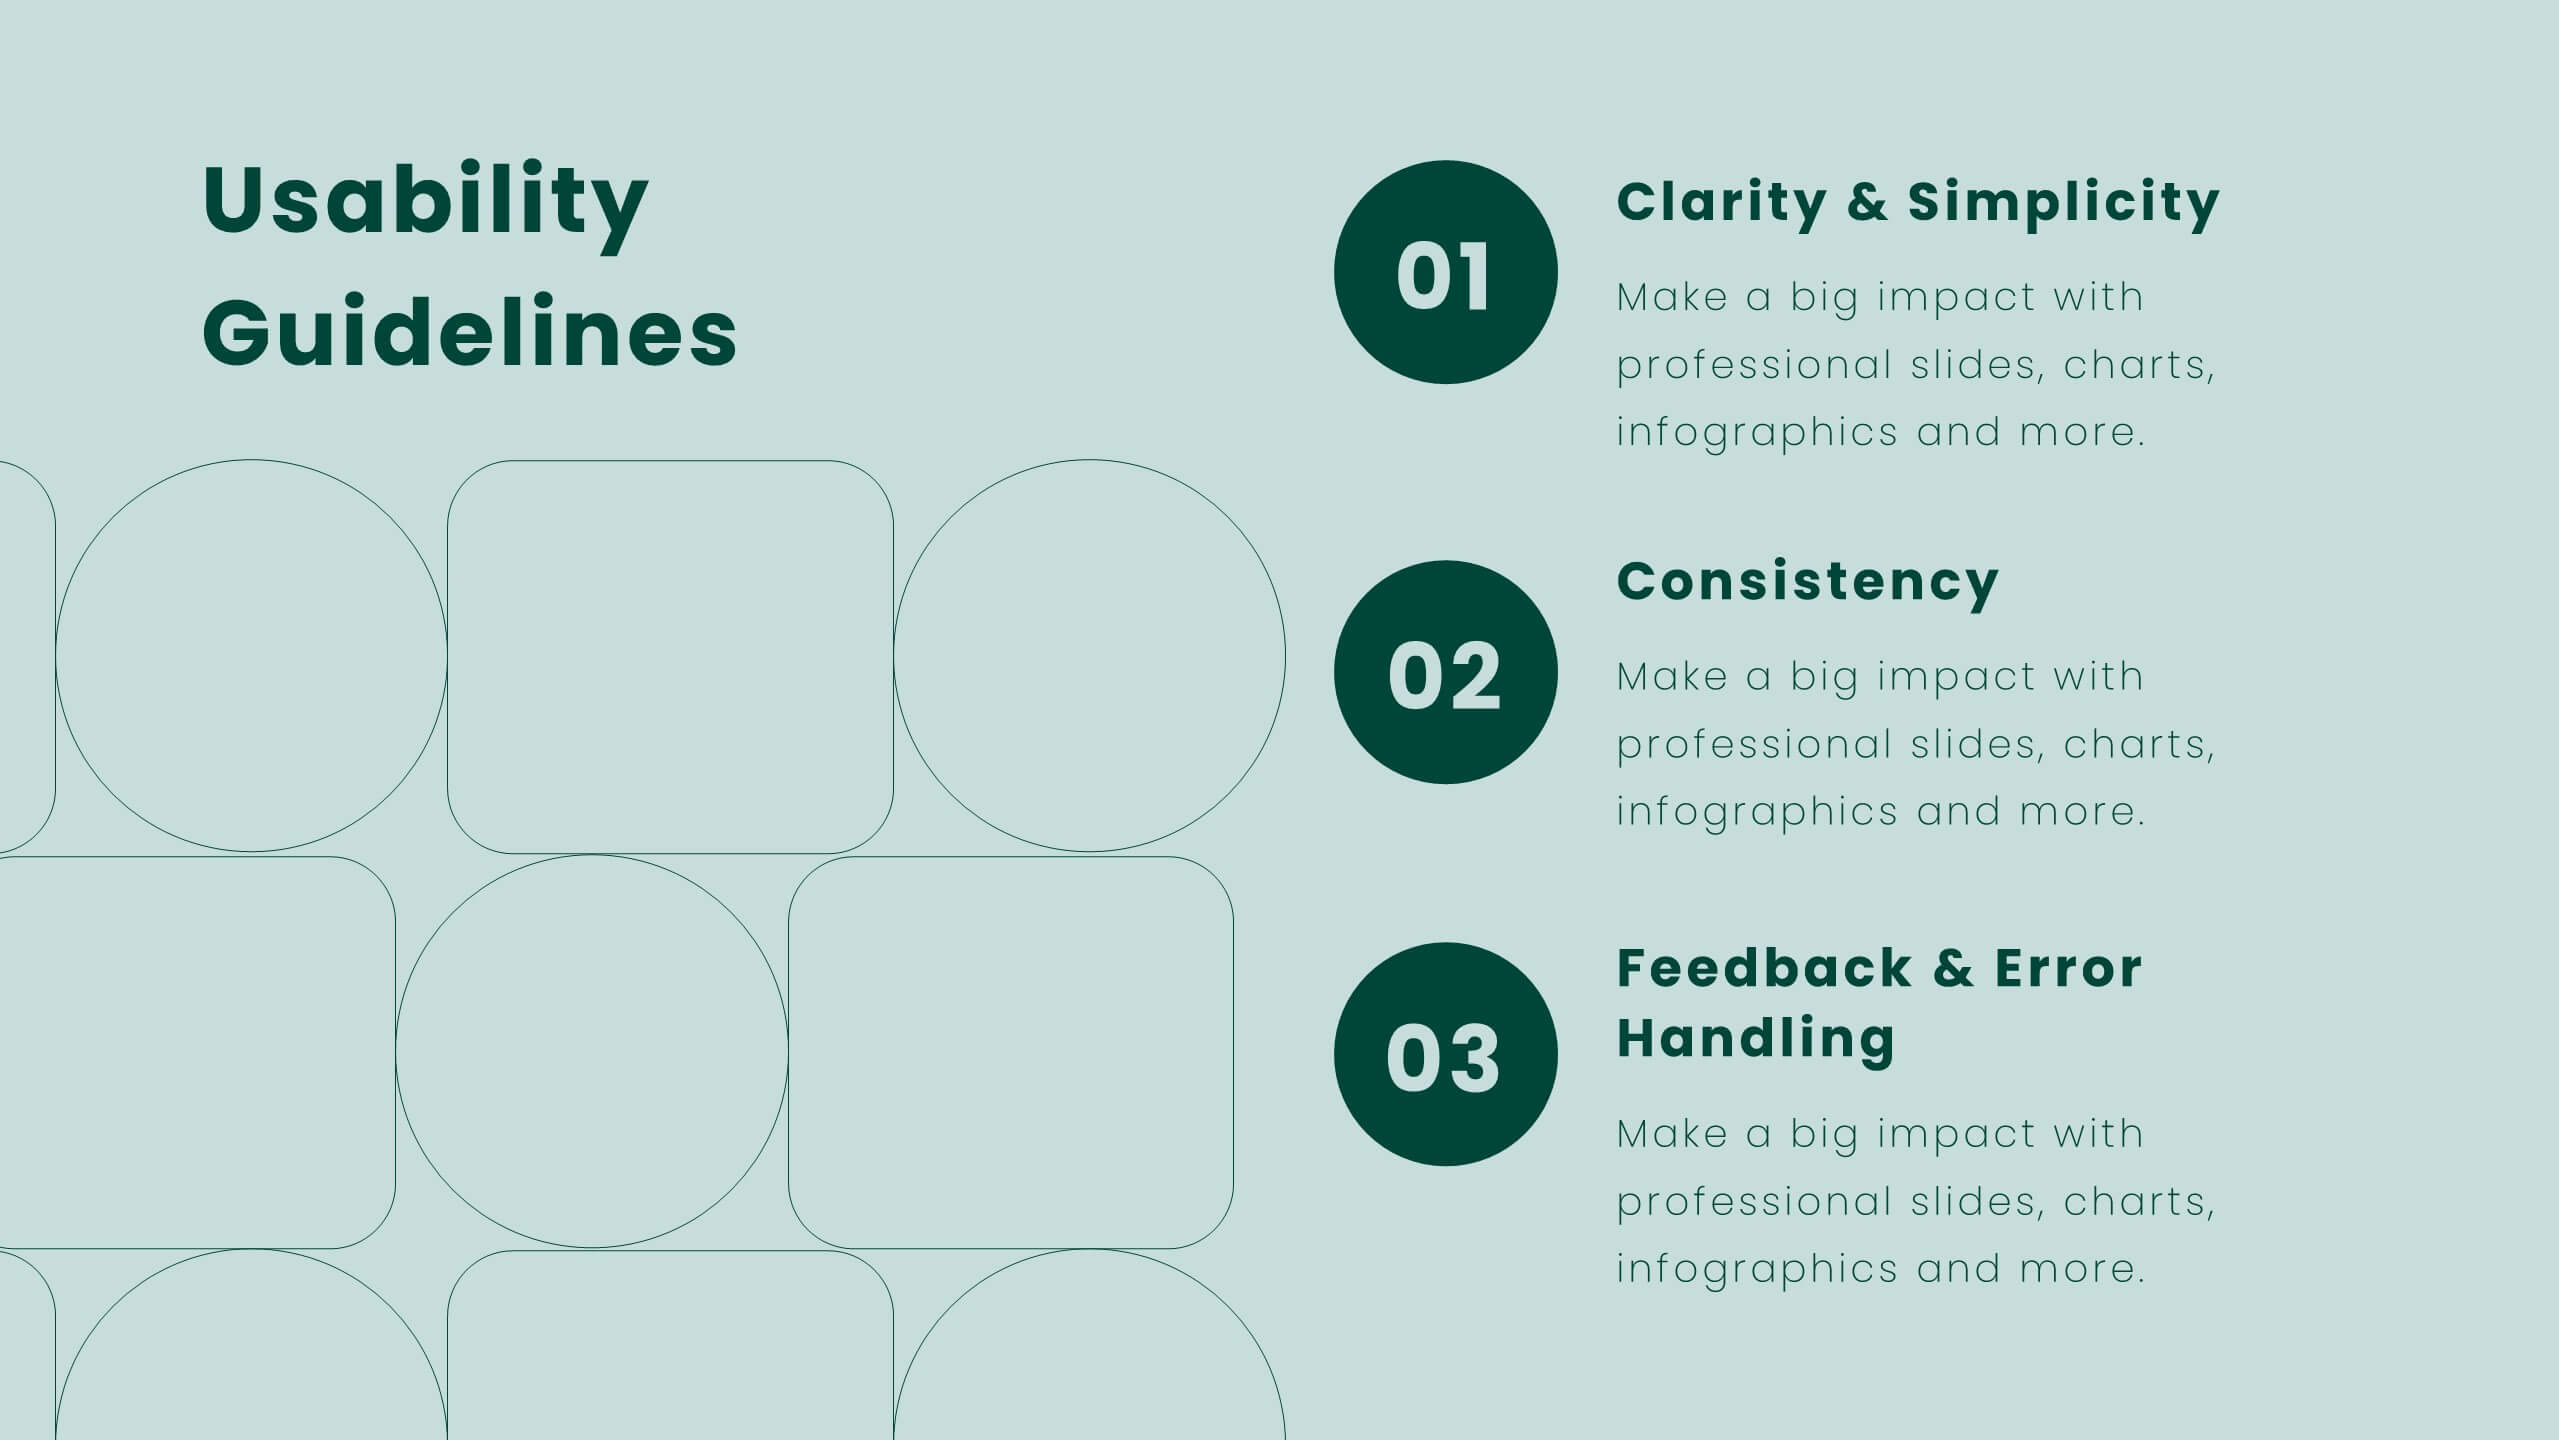
Create compelling UX case studies with this modern template. Cover user research, personas, wireframes, and prototyping. Perfect for showcasing UI design principles, responsive design, and usability guidelines. Highlight feedback, iteration, and project showcase. Compatible with PowerPoint, Keynote, and Google Slides. Elevate your UX presentations and impress stakeholders with clear, detailed insights.


2 slides
Bold and Minimal Opening Presentation Layout
Make your first slide speak volumes with this bold yet minimal opening layout. Designed to grab attention while keeping things simple, this template helps you introduce your presentation with clarity and confidence. Great for modern business decks, it’s fully customizable and works seamlessly in PowerPoint, Keynote, and Google Slides.


6 slides
Strategic Expansion in Africa Map Presentation
Showcase your regional growth plan with the Strategic Expansion in Africa Map Presentation. This layout combines a clean Africa map with color-coded country highlights and directional labels, making it perfect for outlining market entry, regional operations, or investment focus. Ideal for business consultants or NGOs. Works in PowerPoint, Canva, and Google Slides.


8 slides
Competitive Market Strategy Presentation
Stay Ahead in the Market with this Competitive Market Strategy Presentation template. This slide helps you analyze industry competition, market positioning, and strategic advantages with a clean, engaging circular layout. Ideal for business planning, marketing strategy meetings, and competitive analysis, this template allows you to highlight key differentiators and action steps clearly. Fully customizable and available for PowerPoint, Keynote, and Google Slides.


21 slides
Glacieron Financial Report Presentation
This Financial Report Presentation Template is a professional and visually engaging tool to showcase financial performance, key metrics, and strategic initiatives. It includes slides for performance metrics, financial summaries, competitor insights, and future goals, making it ideal for business reviews and stakeholder meetings. Compatible with PowerPoint, Keynote, and Google Slides for easy customization.
3 slides
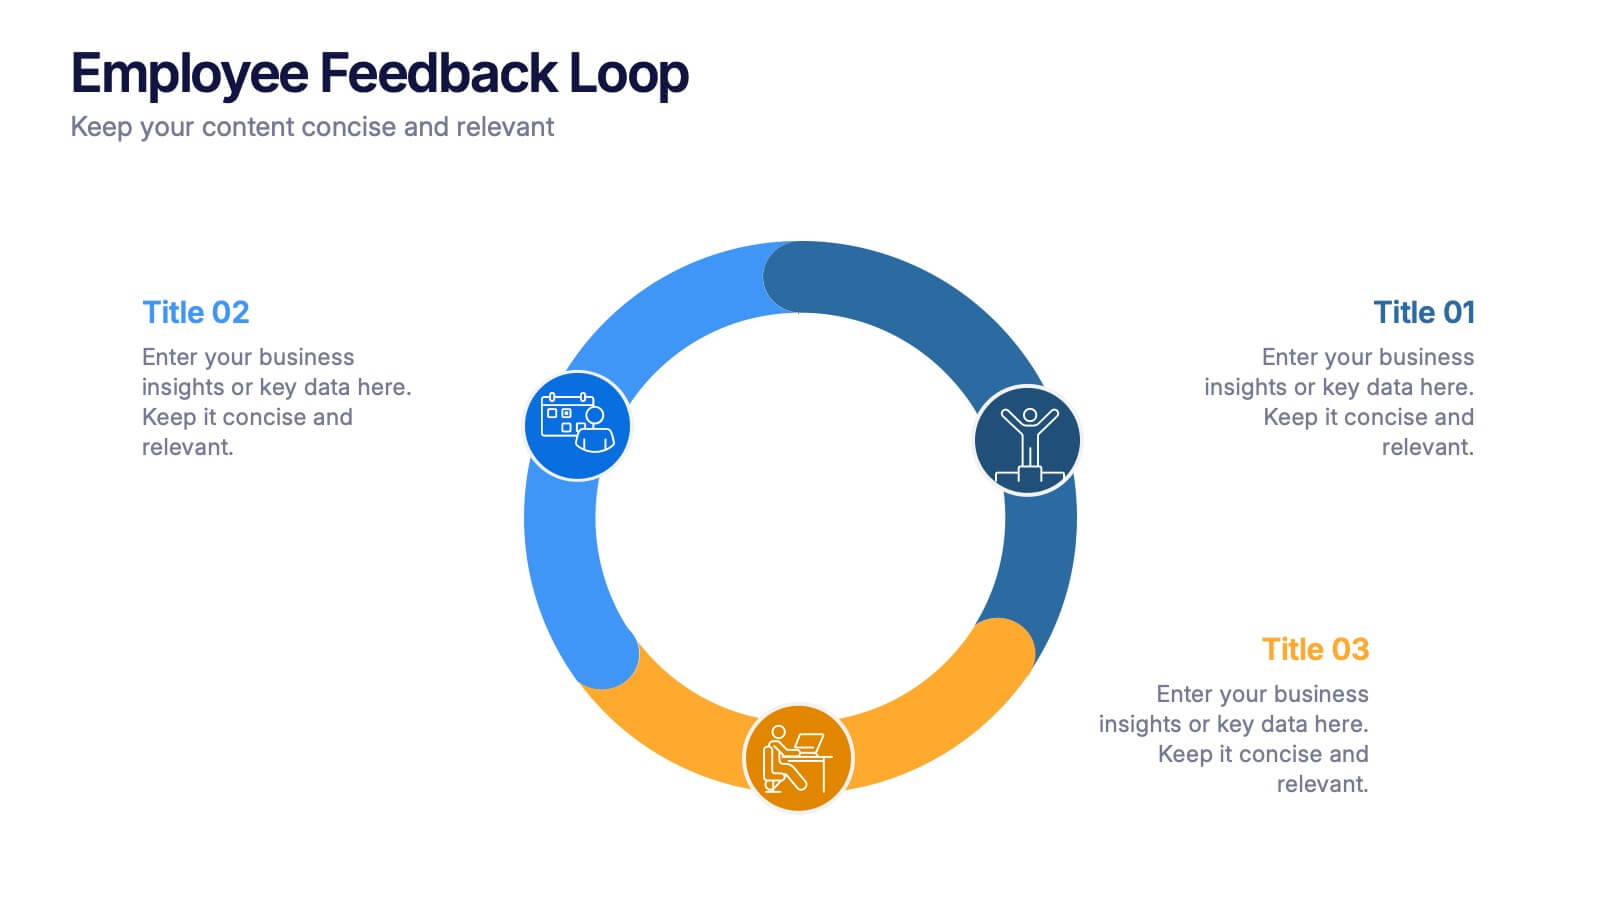
Employee Feedback Loop Presentation
Keep your team connected and continuously improving with this engaging presentation design. Ideal for showcasing communication strategies, feedback cycles, and performance insights, it helps visualize the process of collecting and acting on employee input. Fully customizable and compatible with PowerPoint, Keynote, and Google Slides for effortless, professional presentations.


26 slides
Melo Presentation Template
Are you looking for a presentation to make your product stand out? Melo is a beautifully elegant presentation with modern elements and light neutral color palette. Perfect for furniture brands, or any one looking for a modern presentation. These slides include world maps, company slides, mockups and charts perfect for businesses, this template has everything you'll need. It's simple yet chic design makes it stand out and at the same time keep your audience engaged. This is the perfect choice for businesses, brands or anyone who needs to make a great looking template on their next presentation


21 slides
Fahrenheit Scientific Research Presentation
Present your findings with clarity using this scientific research presentation template. Designed for researchers, it includes sections for objectives, methodology, data analysis, results, and recommendations. Perfect for academic and professional use, this template ensures a polished, organized presentation and is fully compatible with PowerPoint, Keynote, and Google Slides.


5 slides
Corporate Ethics and Legal Guidelines
Clearly outline company policies and ethical standards with this organized and professional slide. Featuring a checklist-style layout with customizable categories, it’s ideal for corporate trainings, compliance presentations, and HR onboarding. Fully editable and compatible with PowerPoint, Keynote, and Google Slides.