


Features
- 5 Unique slides
- Fully editable and easy to edit in Microsoft Powerpoint, Keynote and Google Slides
- 16:9 widescreen layout
- Clean and professional designs
- Export to JPG, PDF or send by email


Do you have any questions?
Recommend


5 slides
Hospital Operations and Services Overview Presentation
Deliver a clear, structured view of healthcare operations with this stethoscope-themed presentation slide. Ideal for medical service breakdowns, hospital department overviews, or care process explanations. Fully customizable in PowerPoint, Keynote, and Google Slides, this layout supports healthcare professionals, administrators, and educators aiming to present medical services with precision and professionalism.


4 slides
Project Responsibility Assignment Matrix Presentation
Visualize team roles and task accountability at a glance with this Project Responsibility Assignment Matrix. This structured layout categorizes assignments using the RACI model—Responsible, Accountable, Consulted, and Informed—organized by team and position. Ideal for project managers, team leads, and operations planners, it helps ensure clarity, reduce overlap, and promote accountability across departments. Easily editable in PowerPoint, Keynote, and Google Slides for seamless customization and cross-platform use.


5 slides
Breast Cancer Treatment Infographics
Breast cancer is a type of cancer that develops in the breast cells. These vertical infographics serve as a valuable resource for healthcare professionals, patients, advocacy groups, and educational institutions involved in breast cancer awareness and support. They provide a visually engaging and informative overview of common causes, different treatment options, stages, side effects, survivorship, and ongoing research in breast cancer treatment. This template will help you convey crucial information in a clear manner, empowering individuals with knowledge about breast cancer treatment options and fostering informed decision-making.


12 slides
Investment and Financial Portfolio Analysis Presentation
Visualize your data with confidence using this Investment and Financial Portfolio Analysis Presentation. Designed to help finance professionals showcase quarterly performance, allocated budgets, total selling ratios, and project earnings in one powerful slide. With customizable charts including bar graphs, pyramids, and pie charts, you can present complex numbers in a clean and compelling way. Fully editable in PowerPoint, Keynote, and Google Slides.


10 slides
Corporate Governance and Law Presentation
Master the essentials of organizational oversight with the "Corporate Governance and Law" template, which offers a structured approach to business management, effectively illustrating key elements such as performance, strategy, governance, talent, and integrity. This layout ensures easy comprehension and is ideal for illustrating the hierarchical relationships and regulatory frameworks in corporate environments. Compatible with PowerPoint, Keynote, and Google Slides.


4 slides
Strategic Planning Gap Assessment
Visualize growth opportunities with this Strategic Planning Gap Assessment template. Perfect for showcasing the gap between actual progression and potential performance over time. Ideal for risk evaluation, diversification, and product development planning. Fully editable for PowerPoint, Keynote, and Google Slides.


21 slides
Fortuna Product Development Plan Presentation
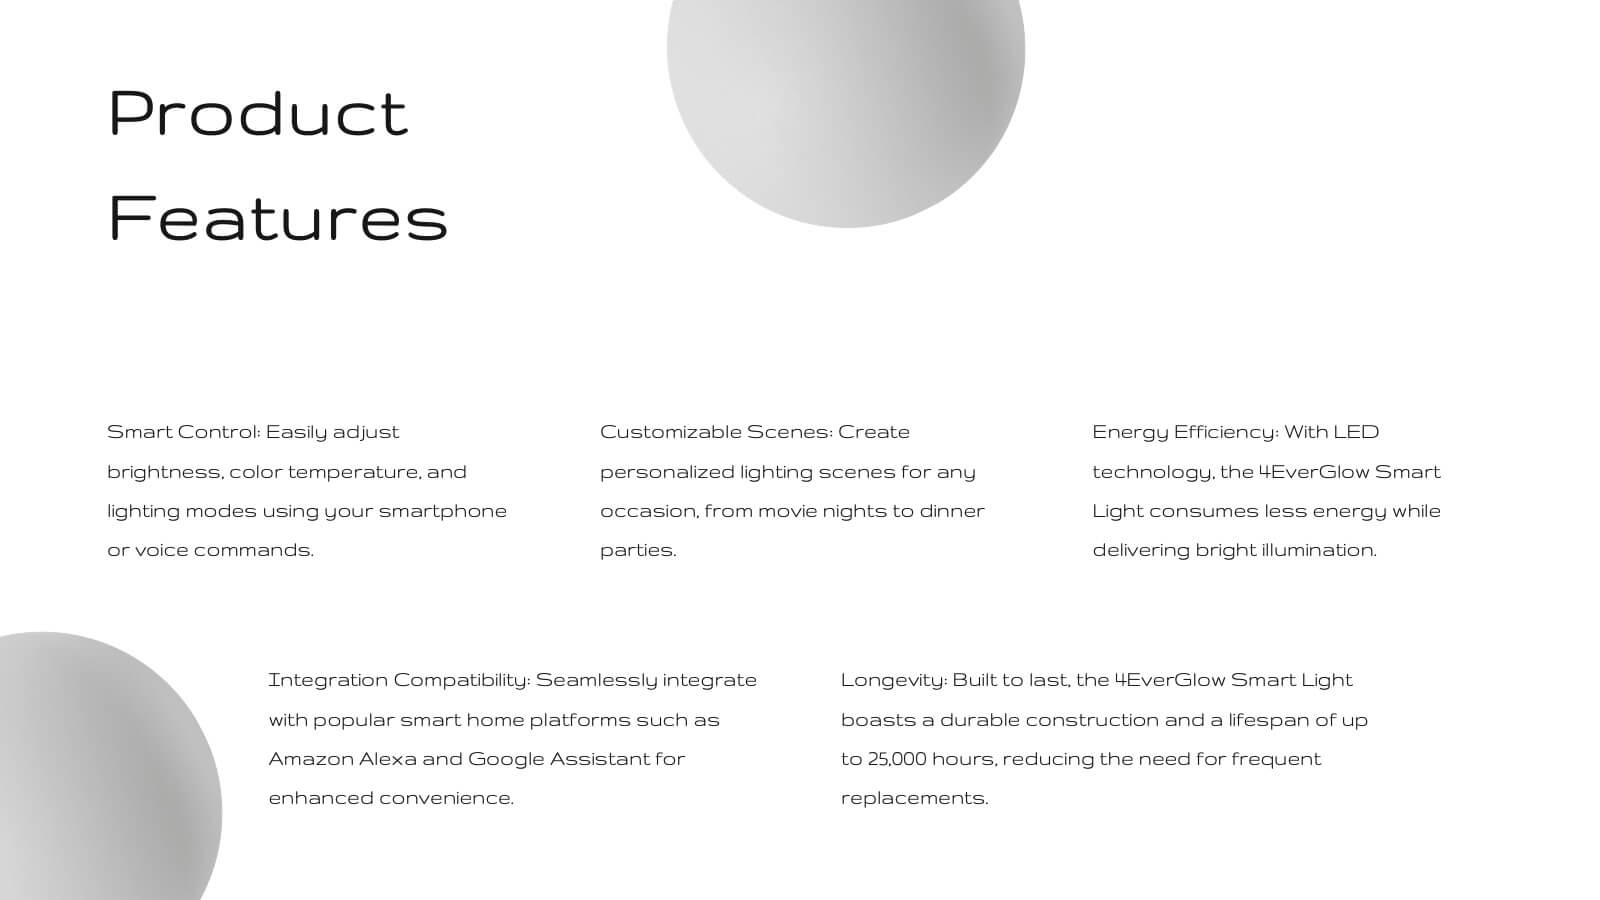
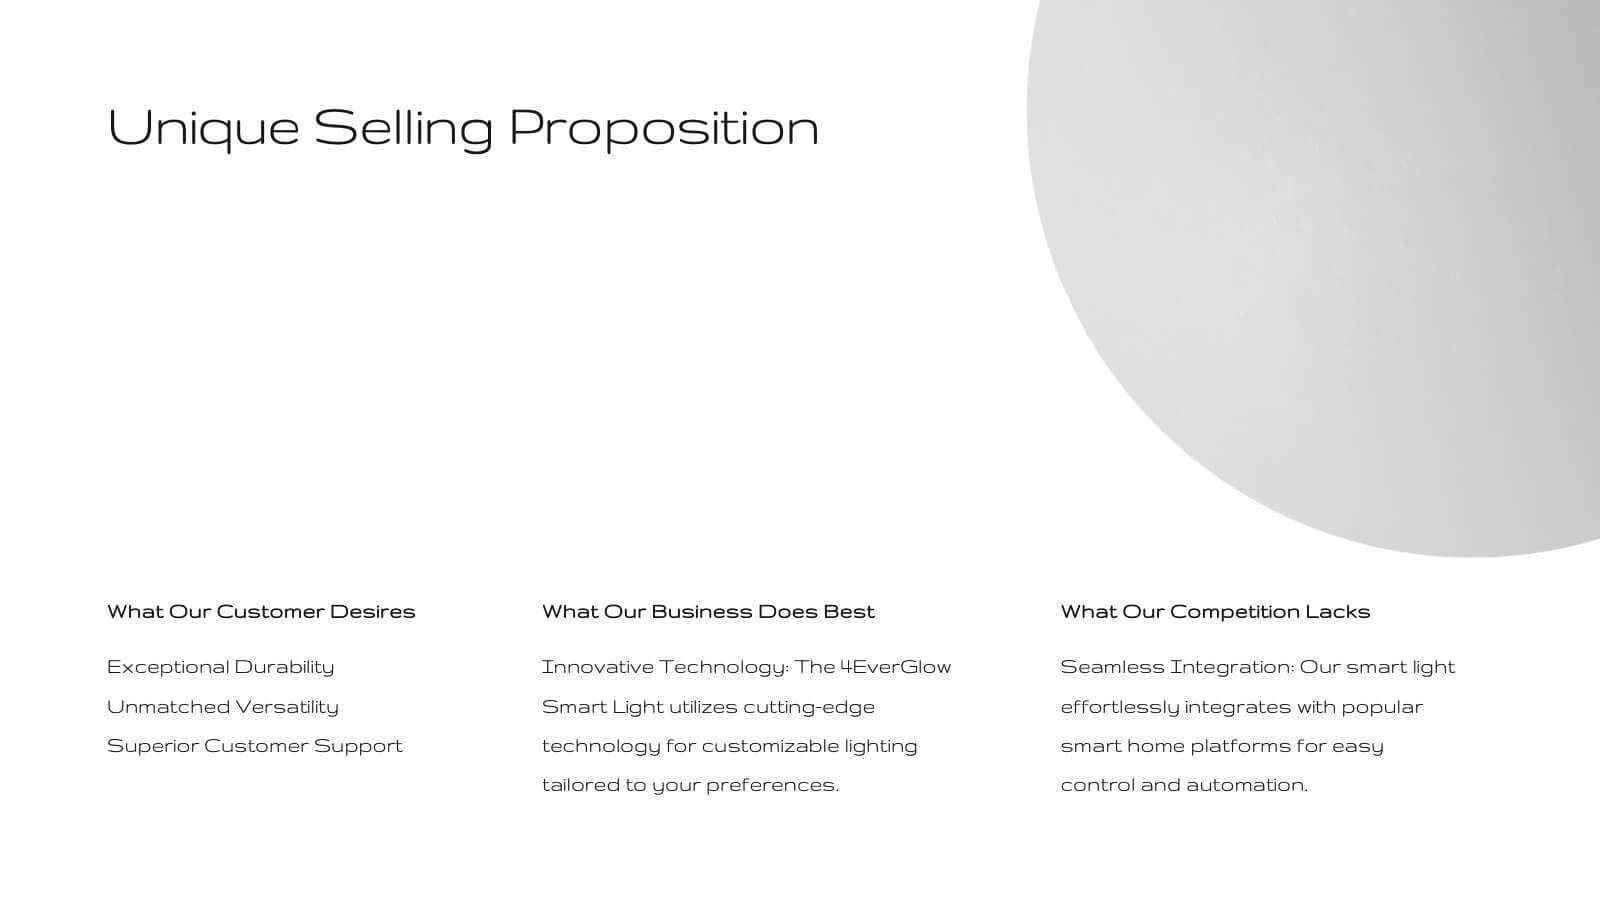
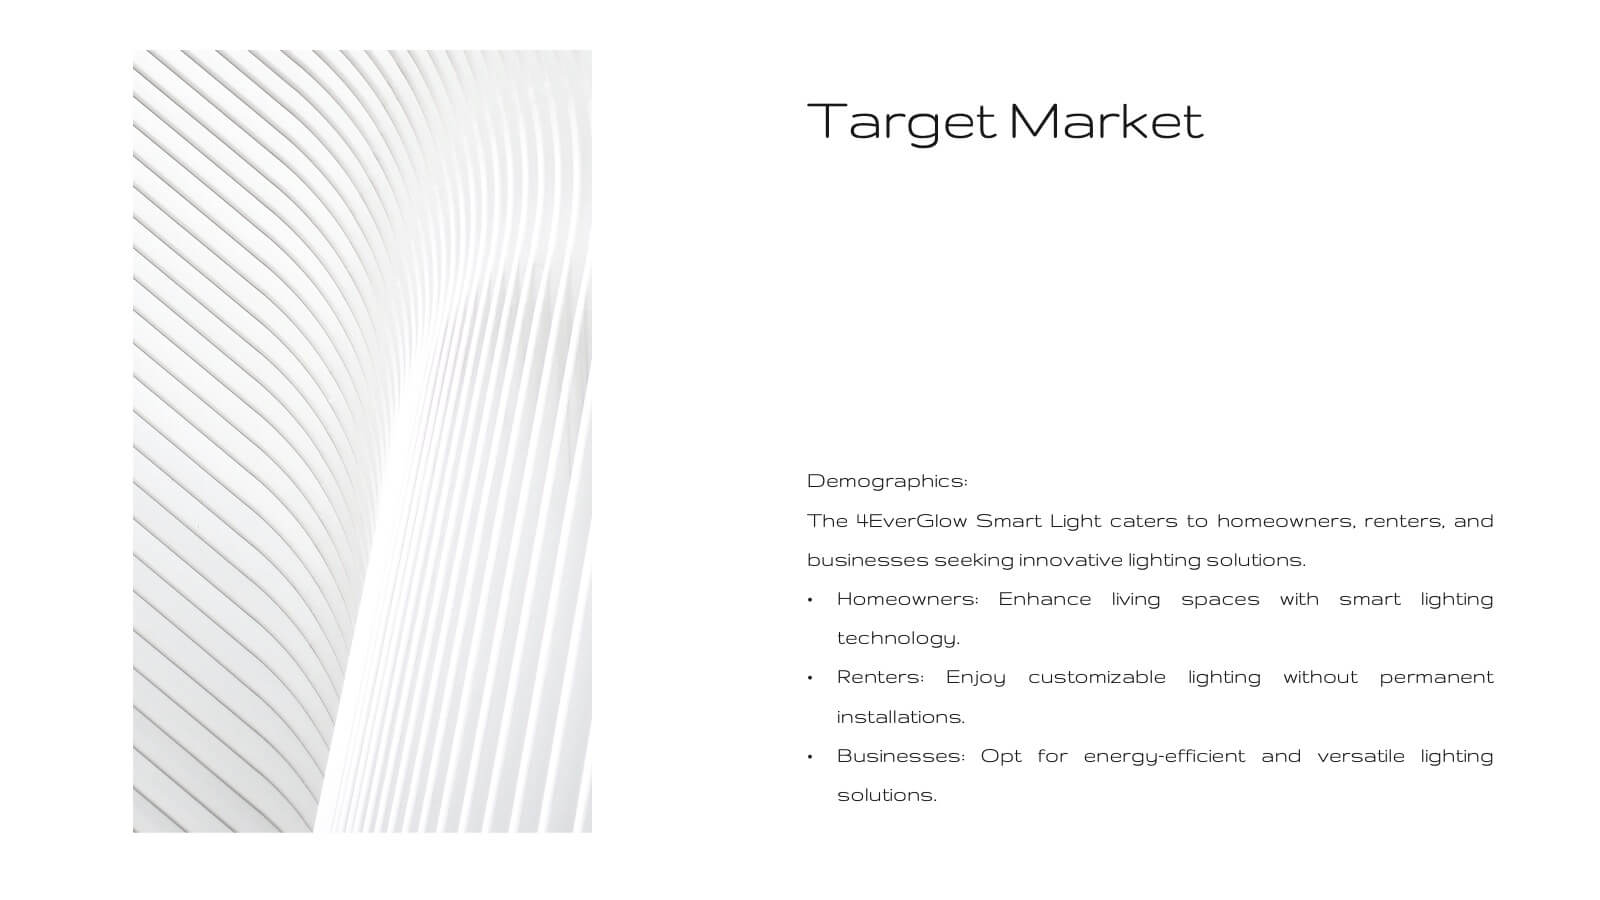
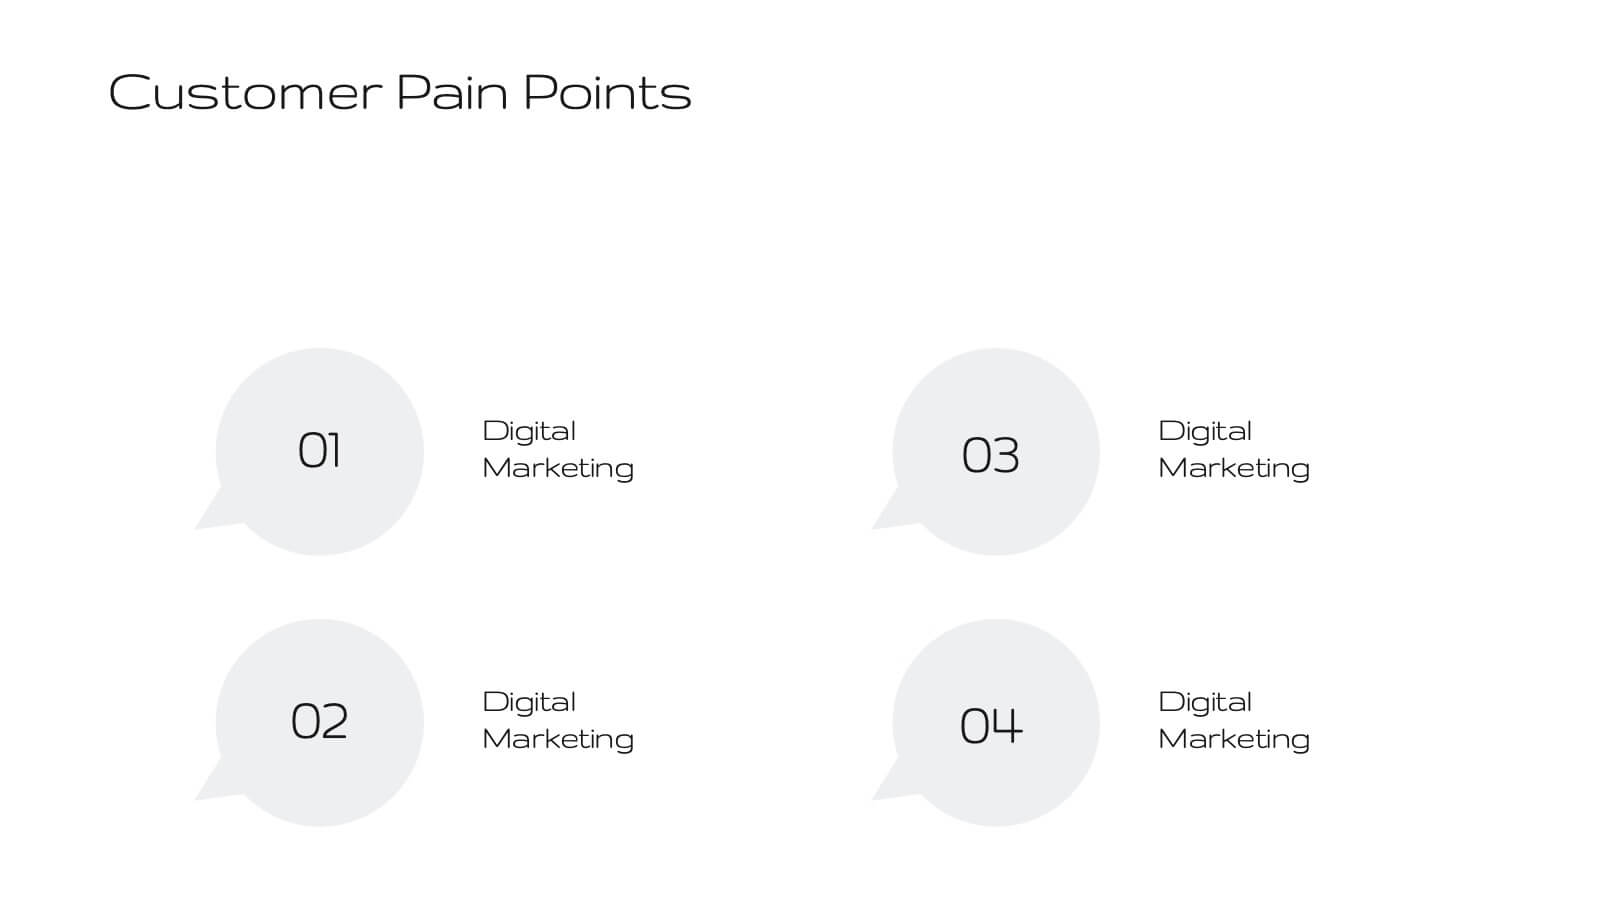
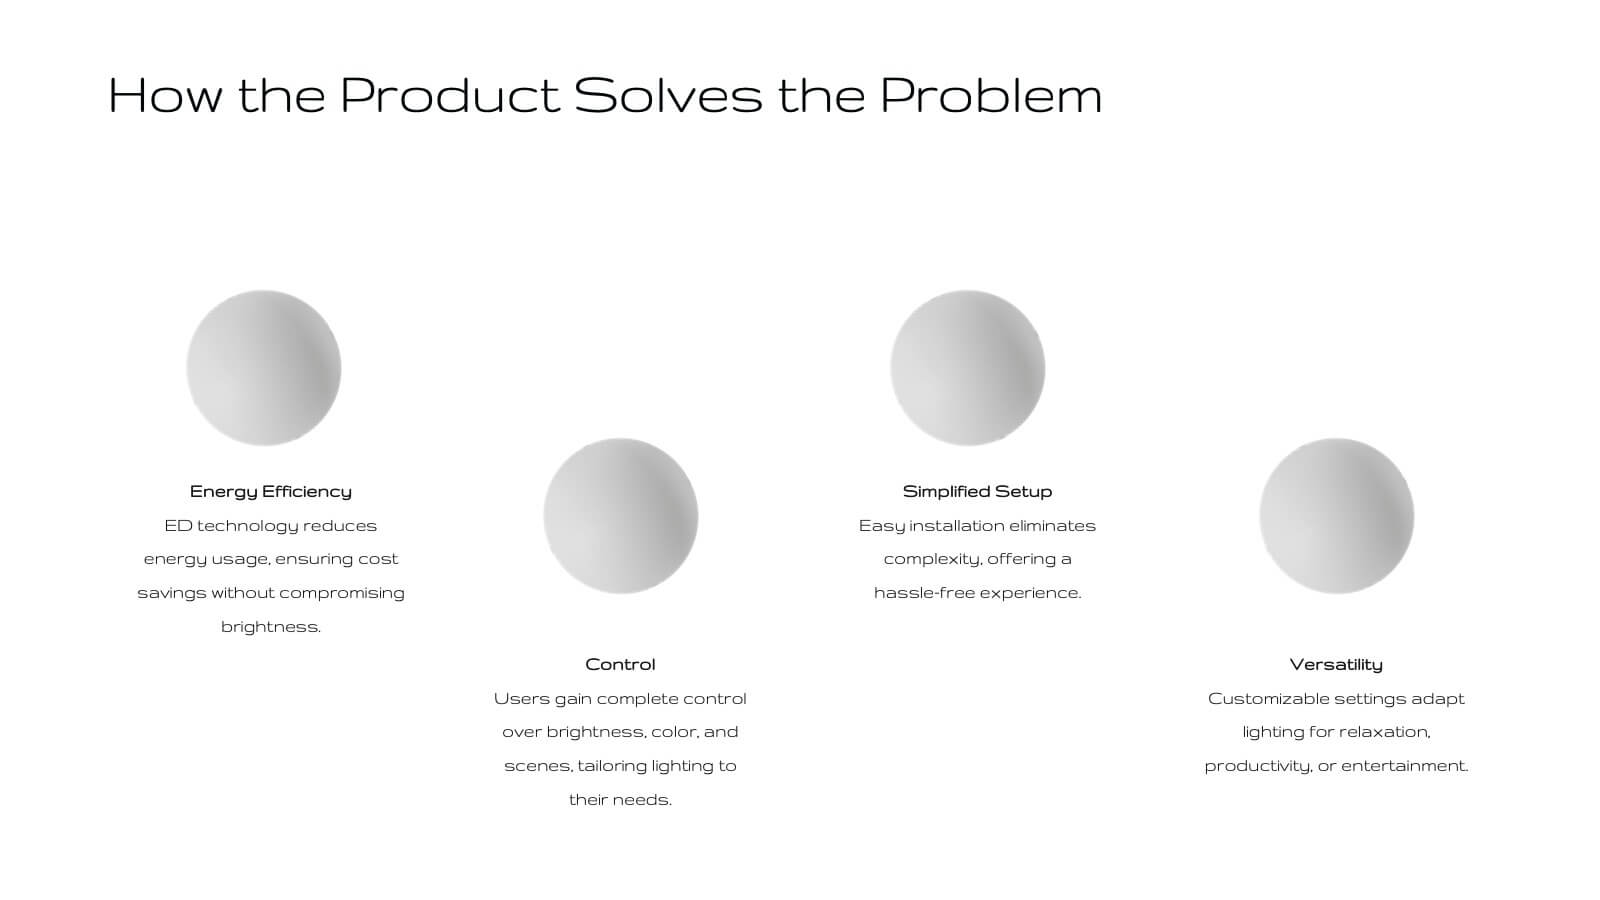
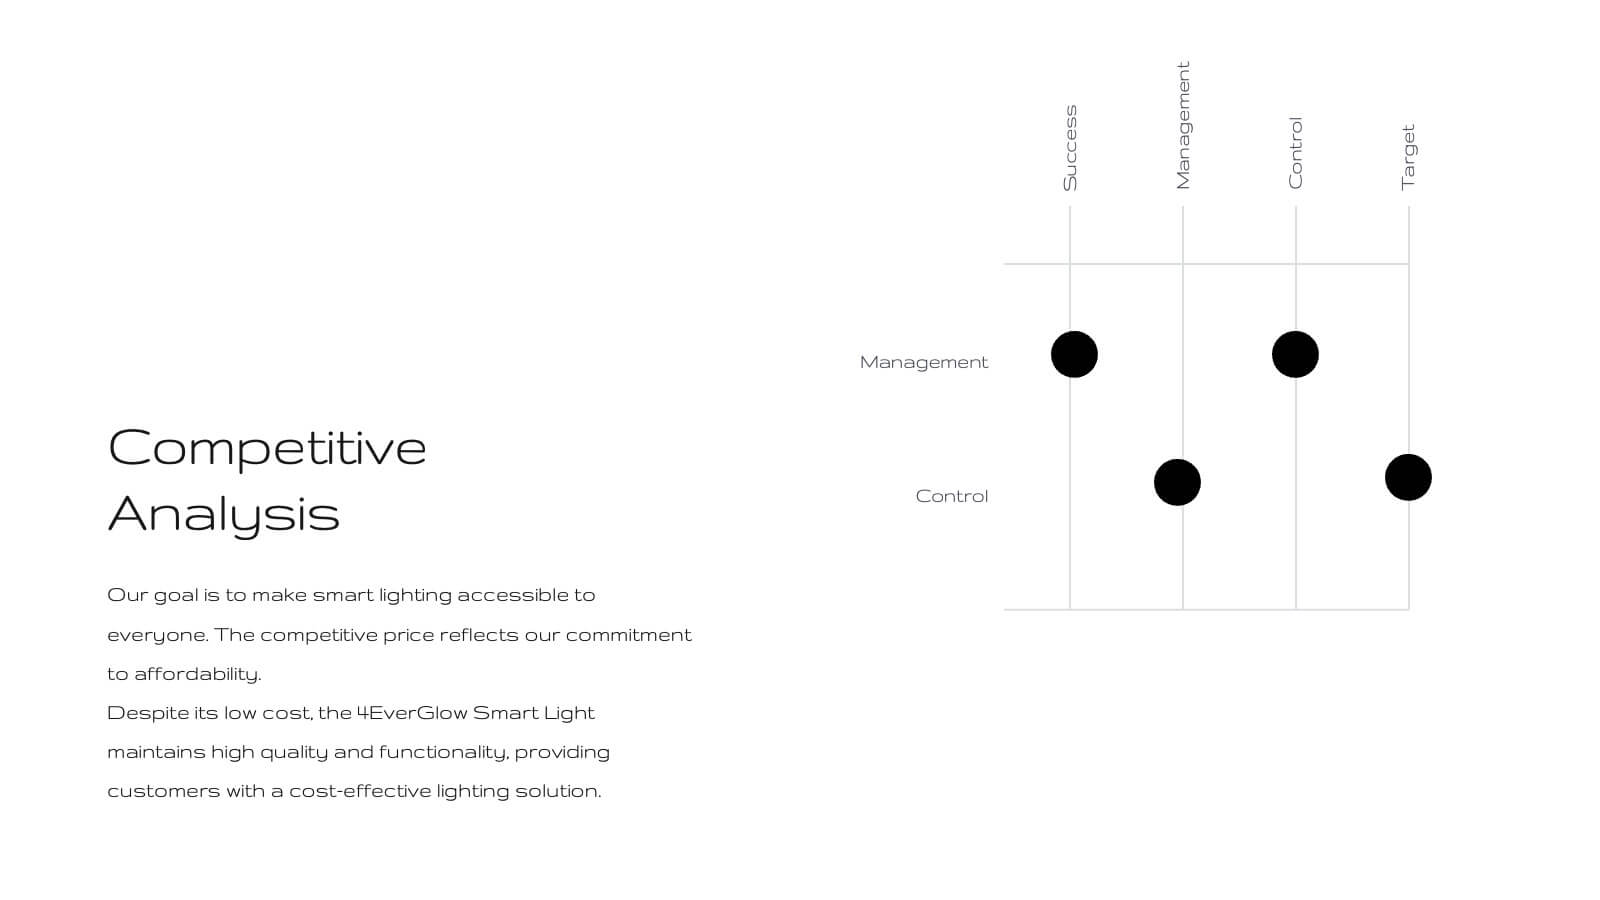
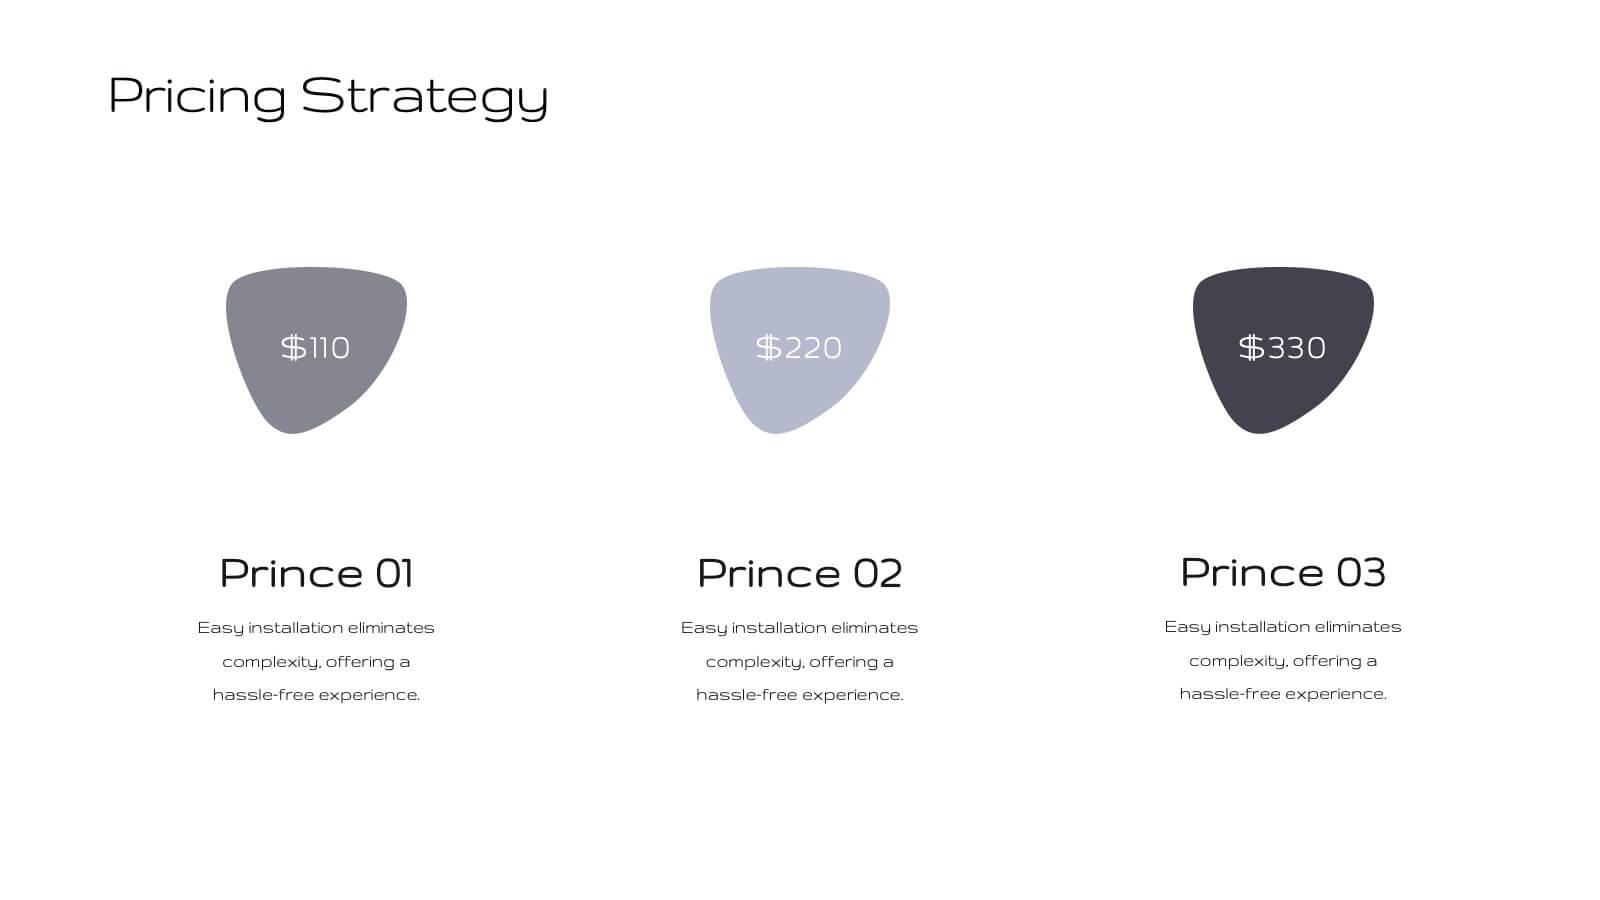
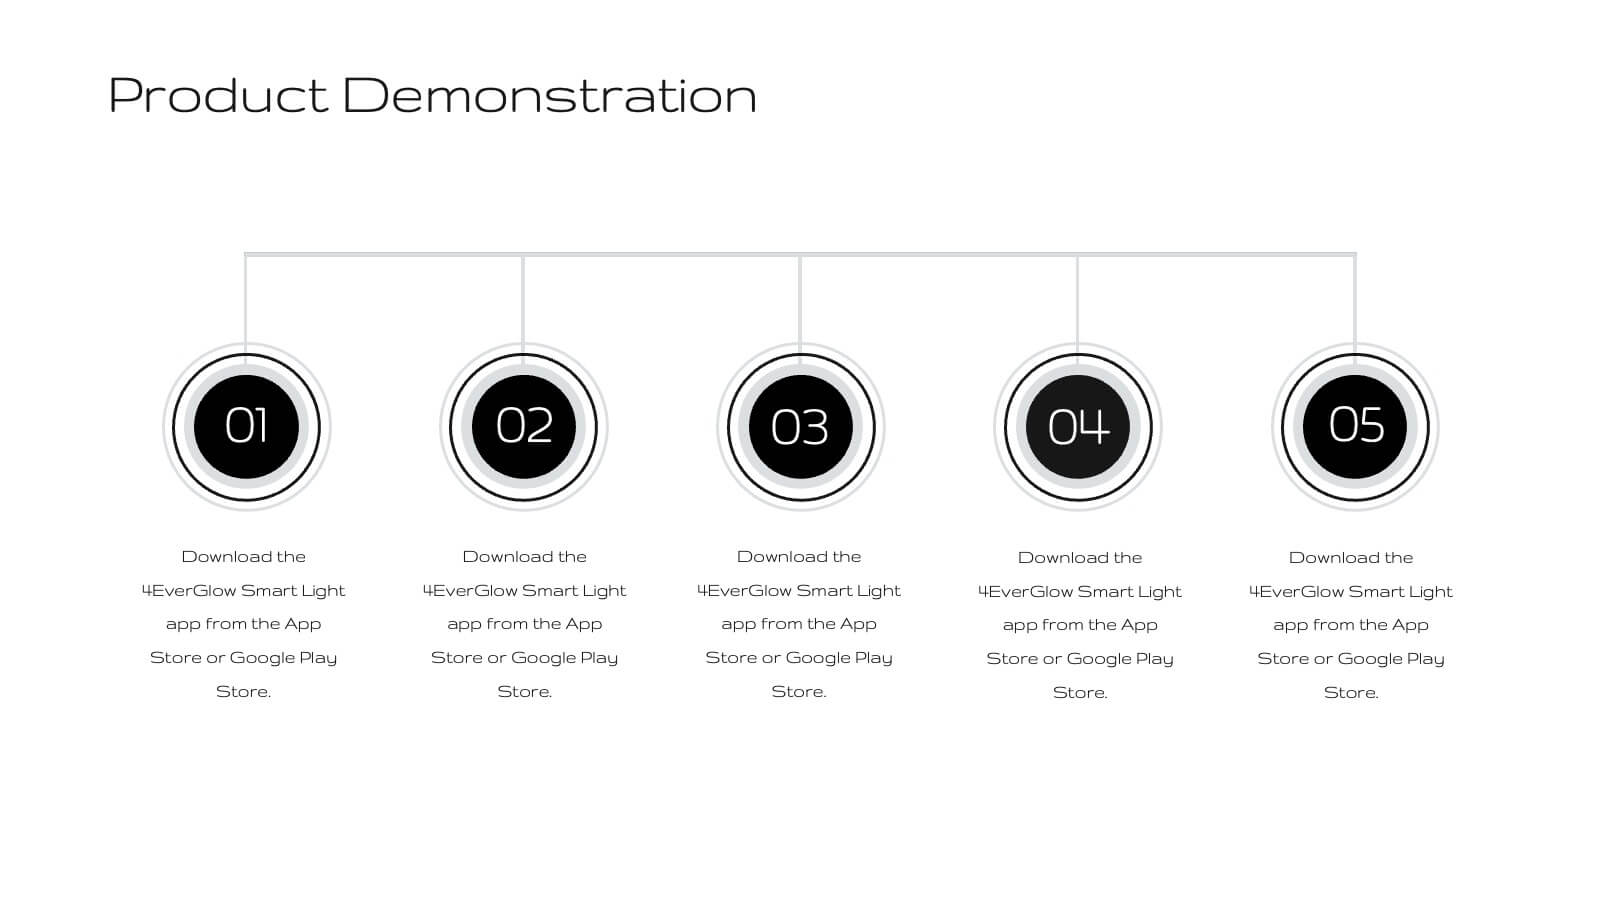
Unveil your product's potential with this elegant, minimalist presentation template. Perfect for detailing product development, features, and market strategies, it features a clean design that emphasizes clarity and professionalism. Highlight key aspects like customer pain points, competitive analysis, and pricing strategies to captivate your audience. Compatible with PowerPoint, Keynote, and Google Slides, it ensures seamless presentations on any platform.


21 slides
Duskflare Corporate Strategy Proposal Presentation
Present your corporate strategy effectively with this comprehensive template, featuring sections on market trends, SWOT analysis, strategic initiatives, and risk management. Designed for clarity and impact, it’s ideal for outlining high-level goals and action plans. Compatible with PowerPoint, Keynote, and Google Slides for seamless presentations.


7 slides
Positive Feedback Infographic Presentation
A Feedback Infographic presents information related to feedback, including what it is, why it is important, and how to provide and receive it effectively. Feedback is important to help understand performance or behavior and make improvements. This template is designed to help you effectively communicate the importance of feedback and provide tips and strategies for giving and receiving it. This template is compatible with Powerpoint, Keynote, and Google Slides, allowing you to easily add your images and data to illustrate your points, and customize content to fit your specific needs.


21 slides
Twilight Project Milestones Report Presentation
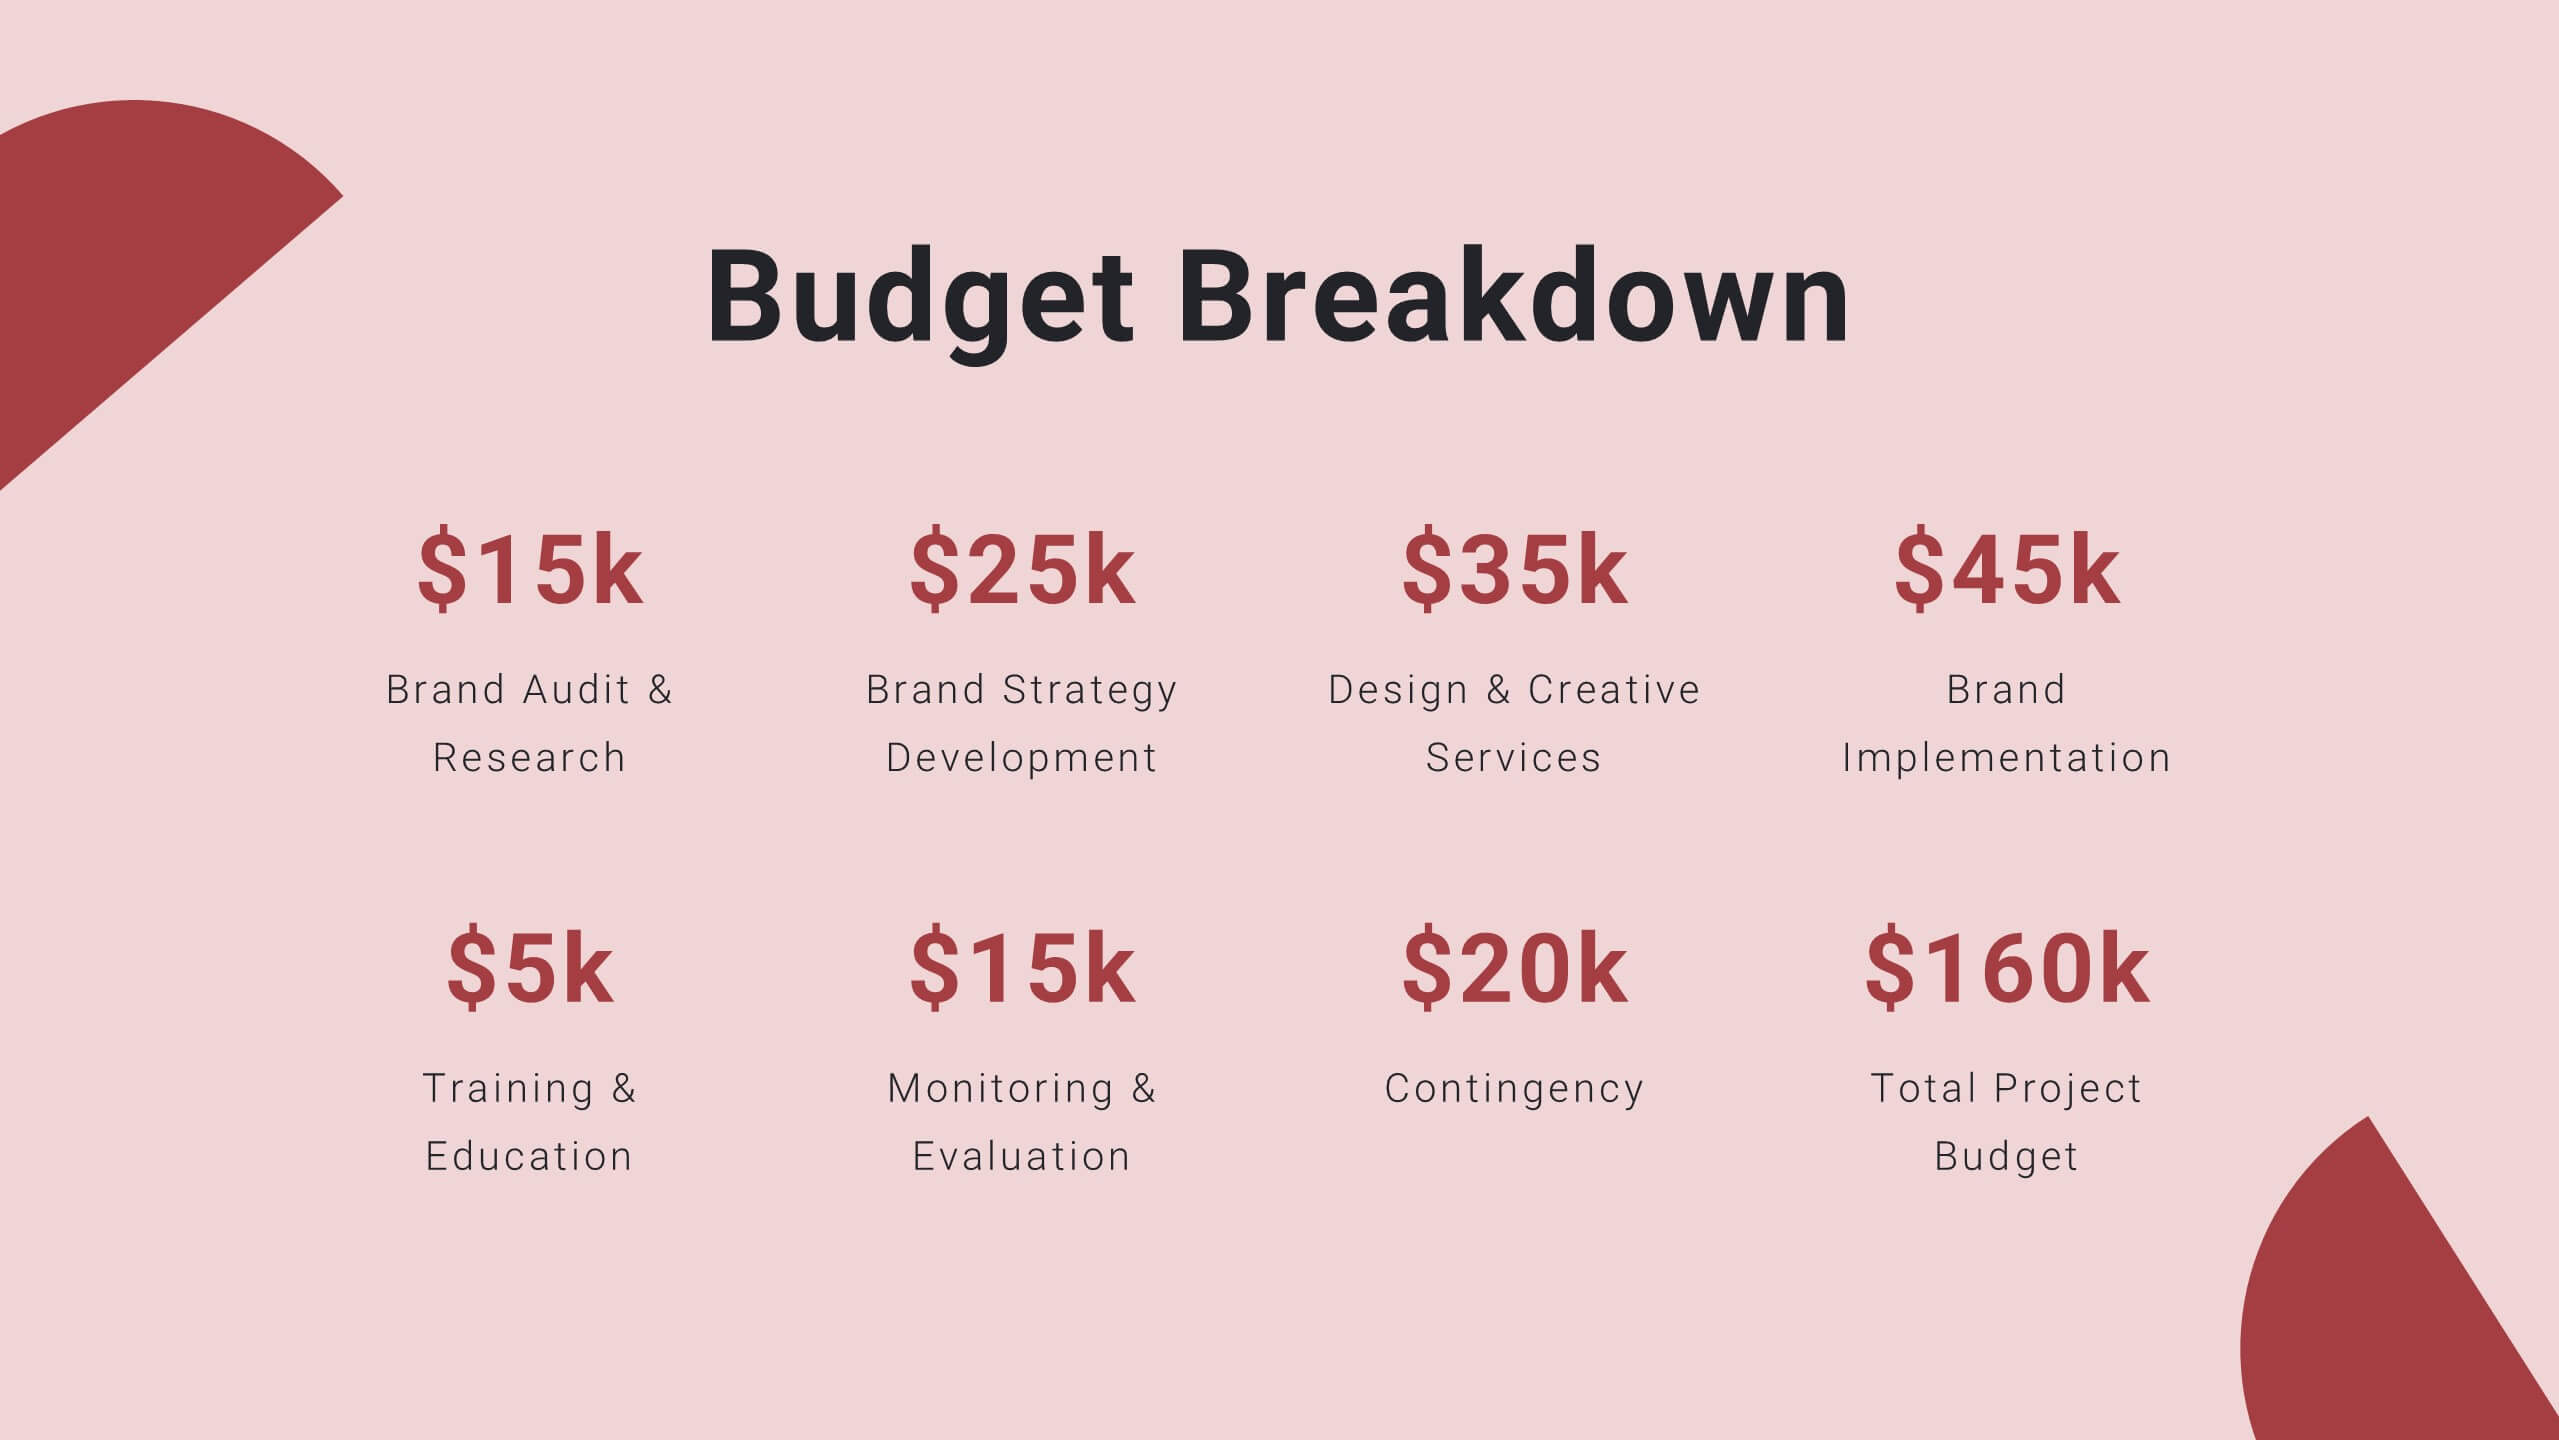
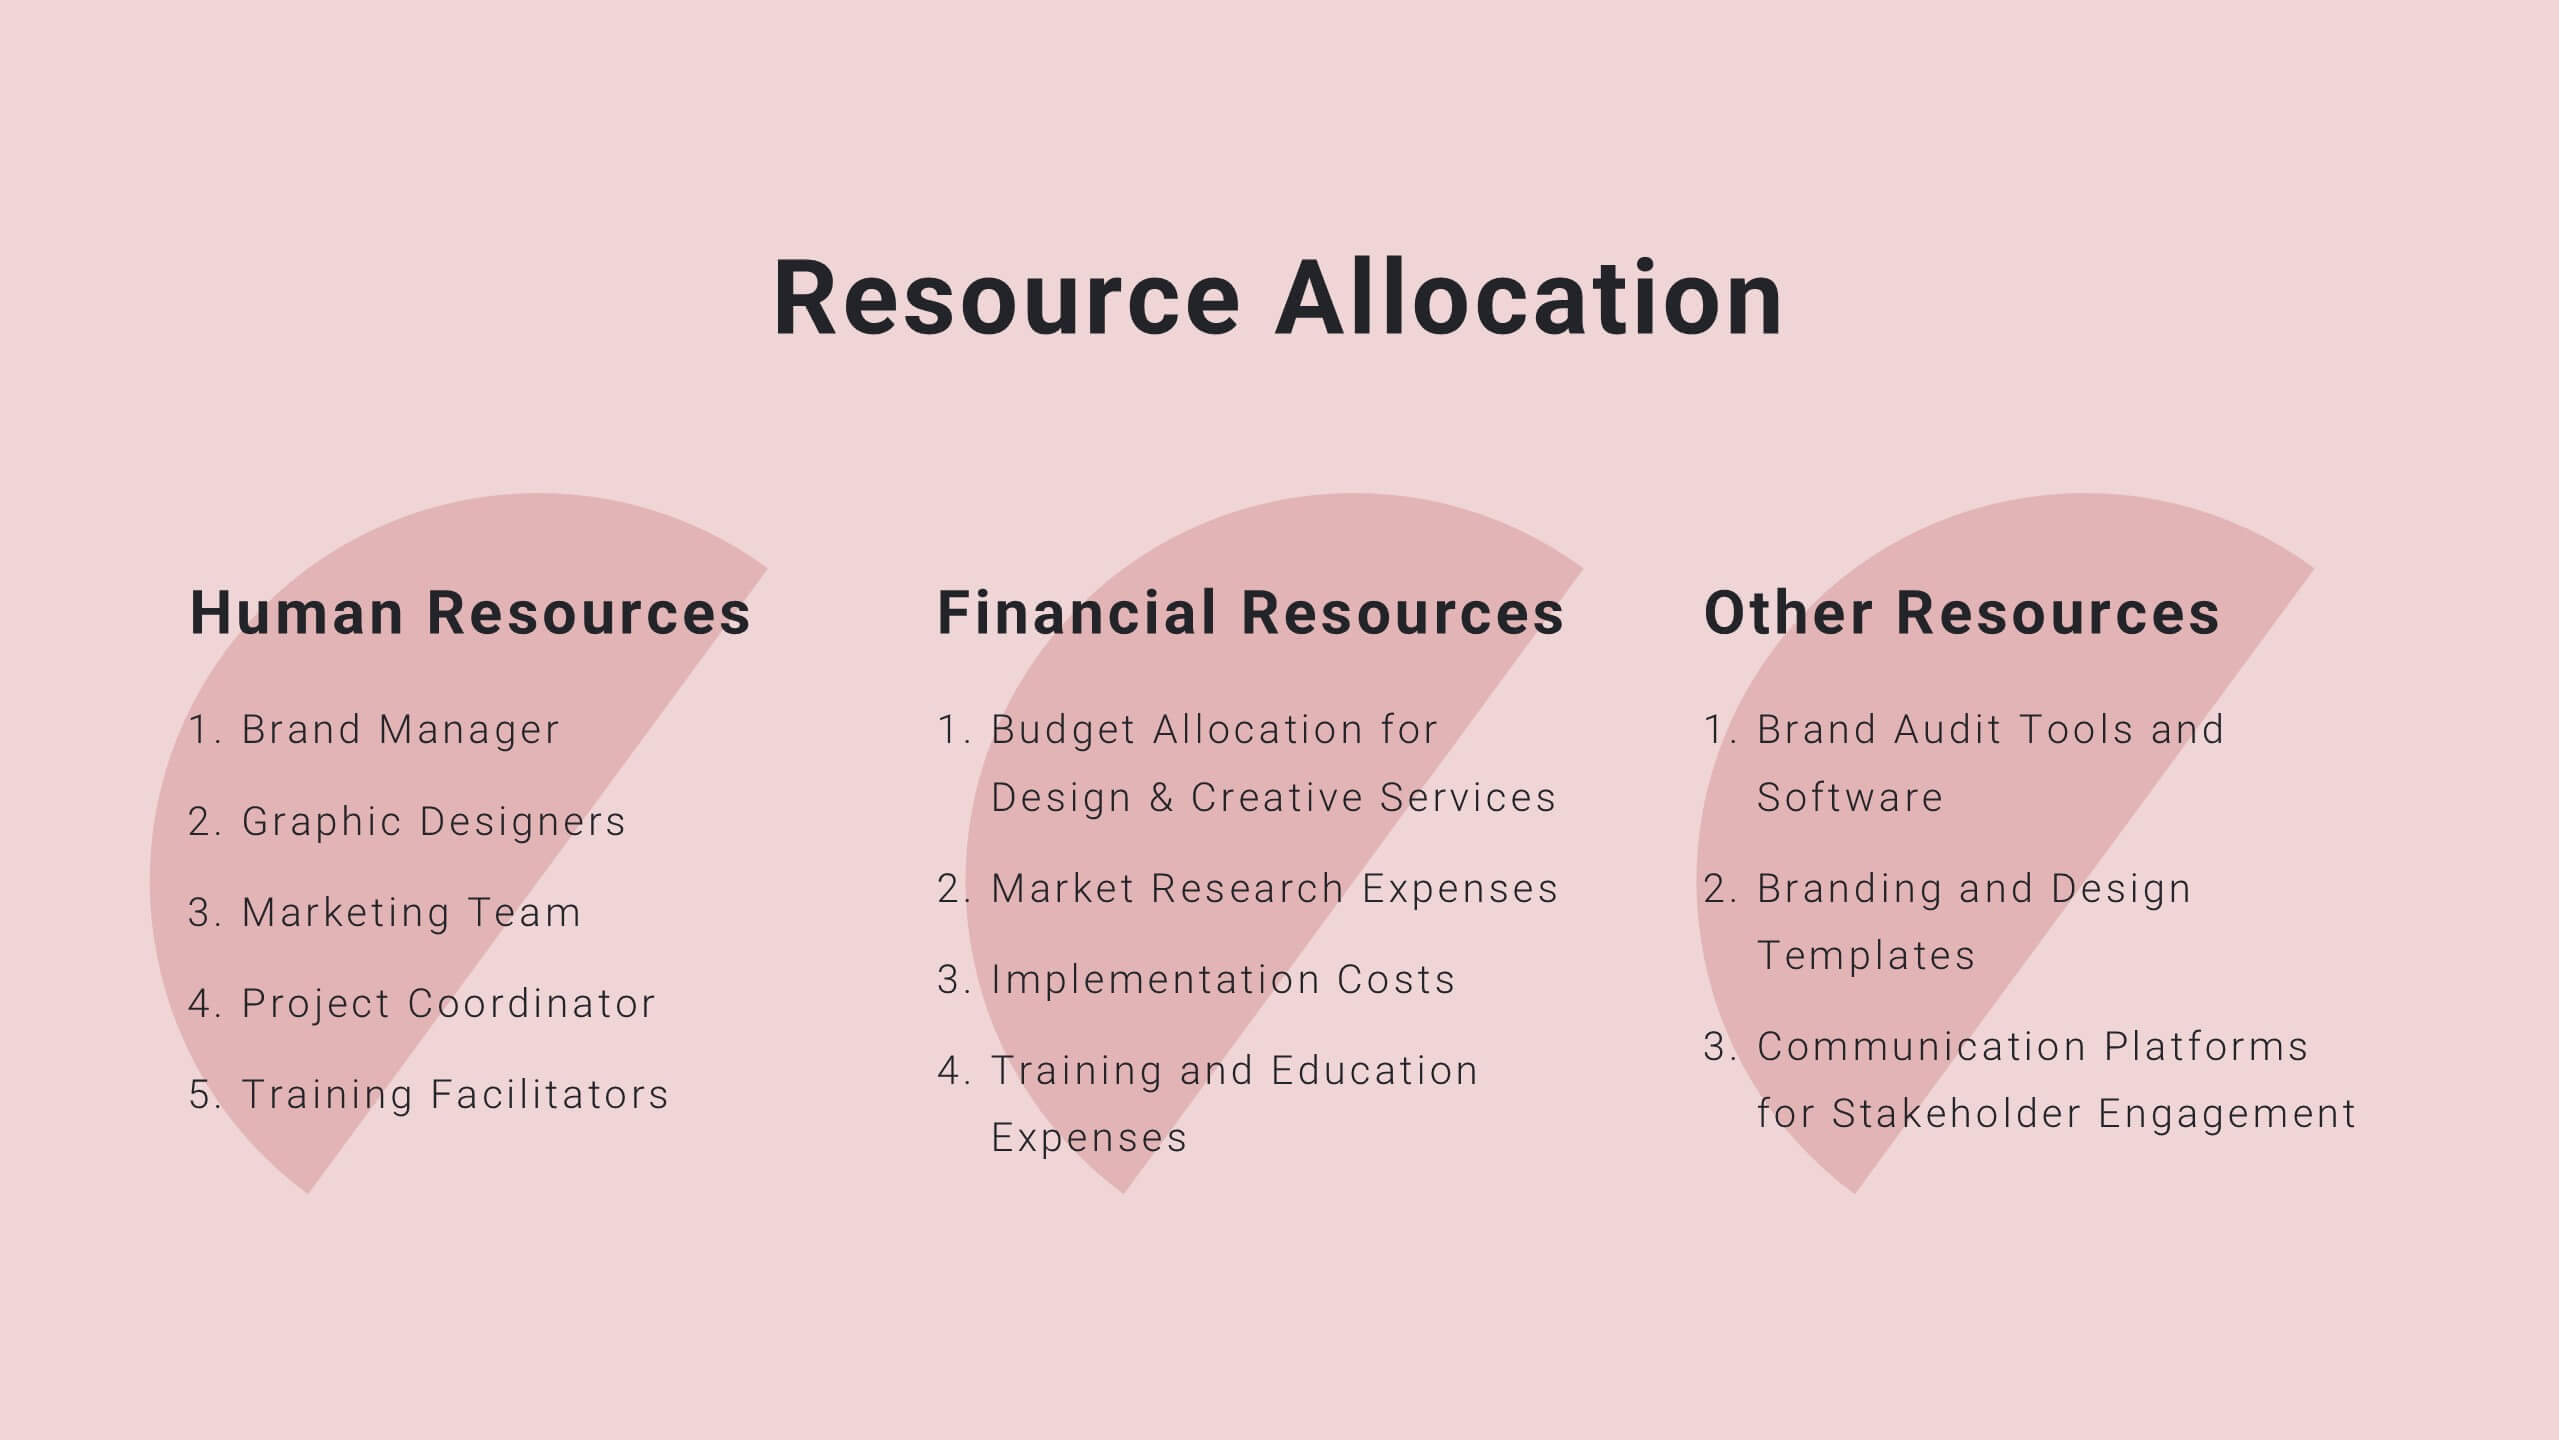
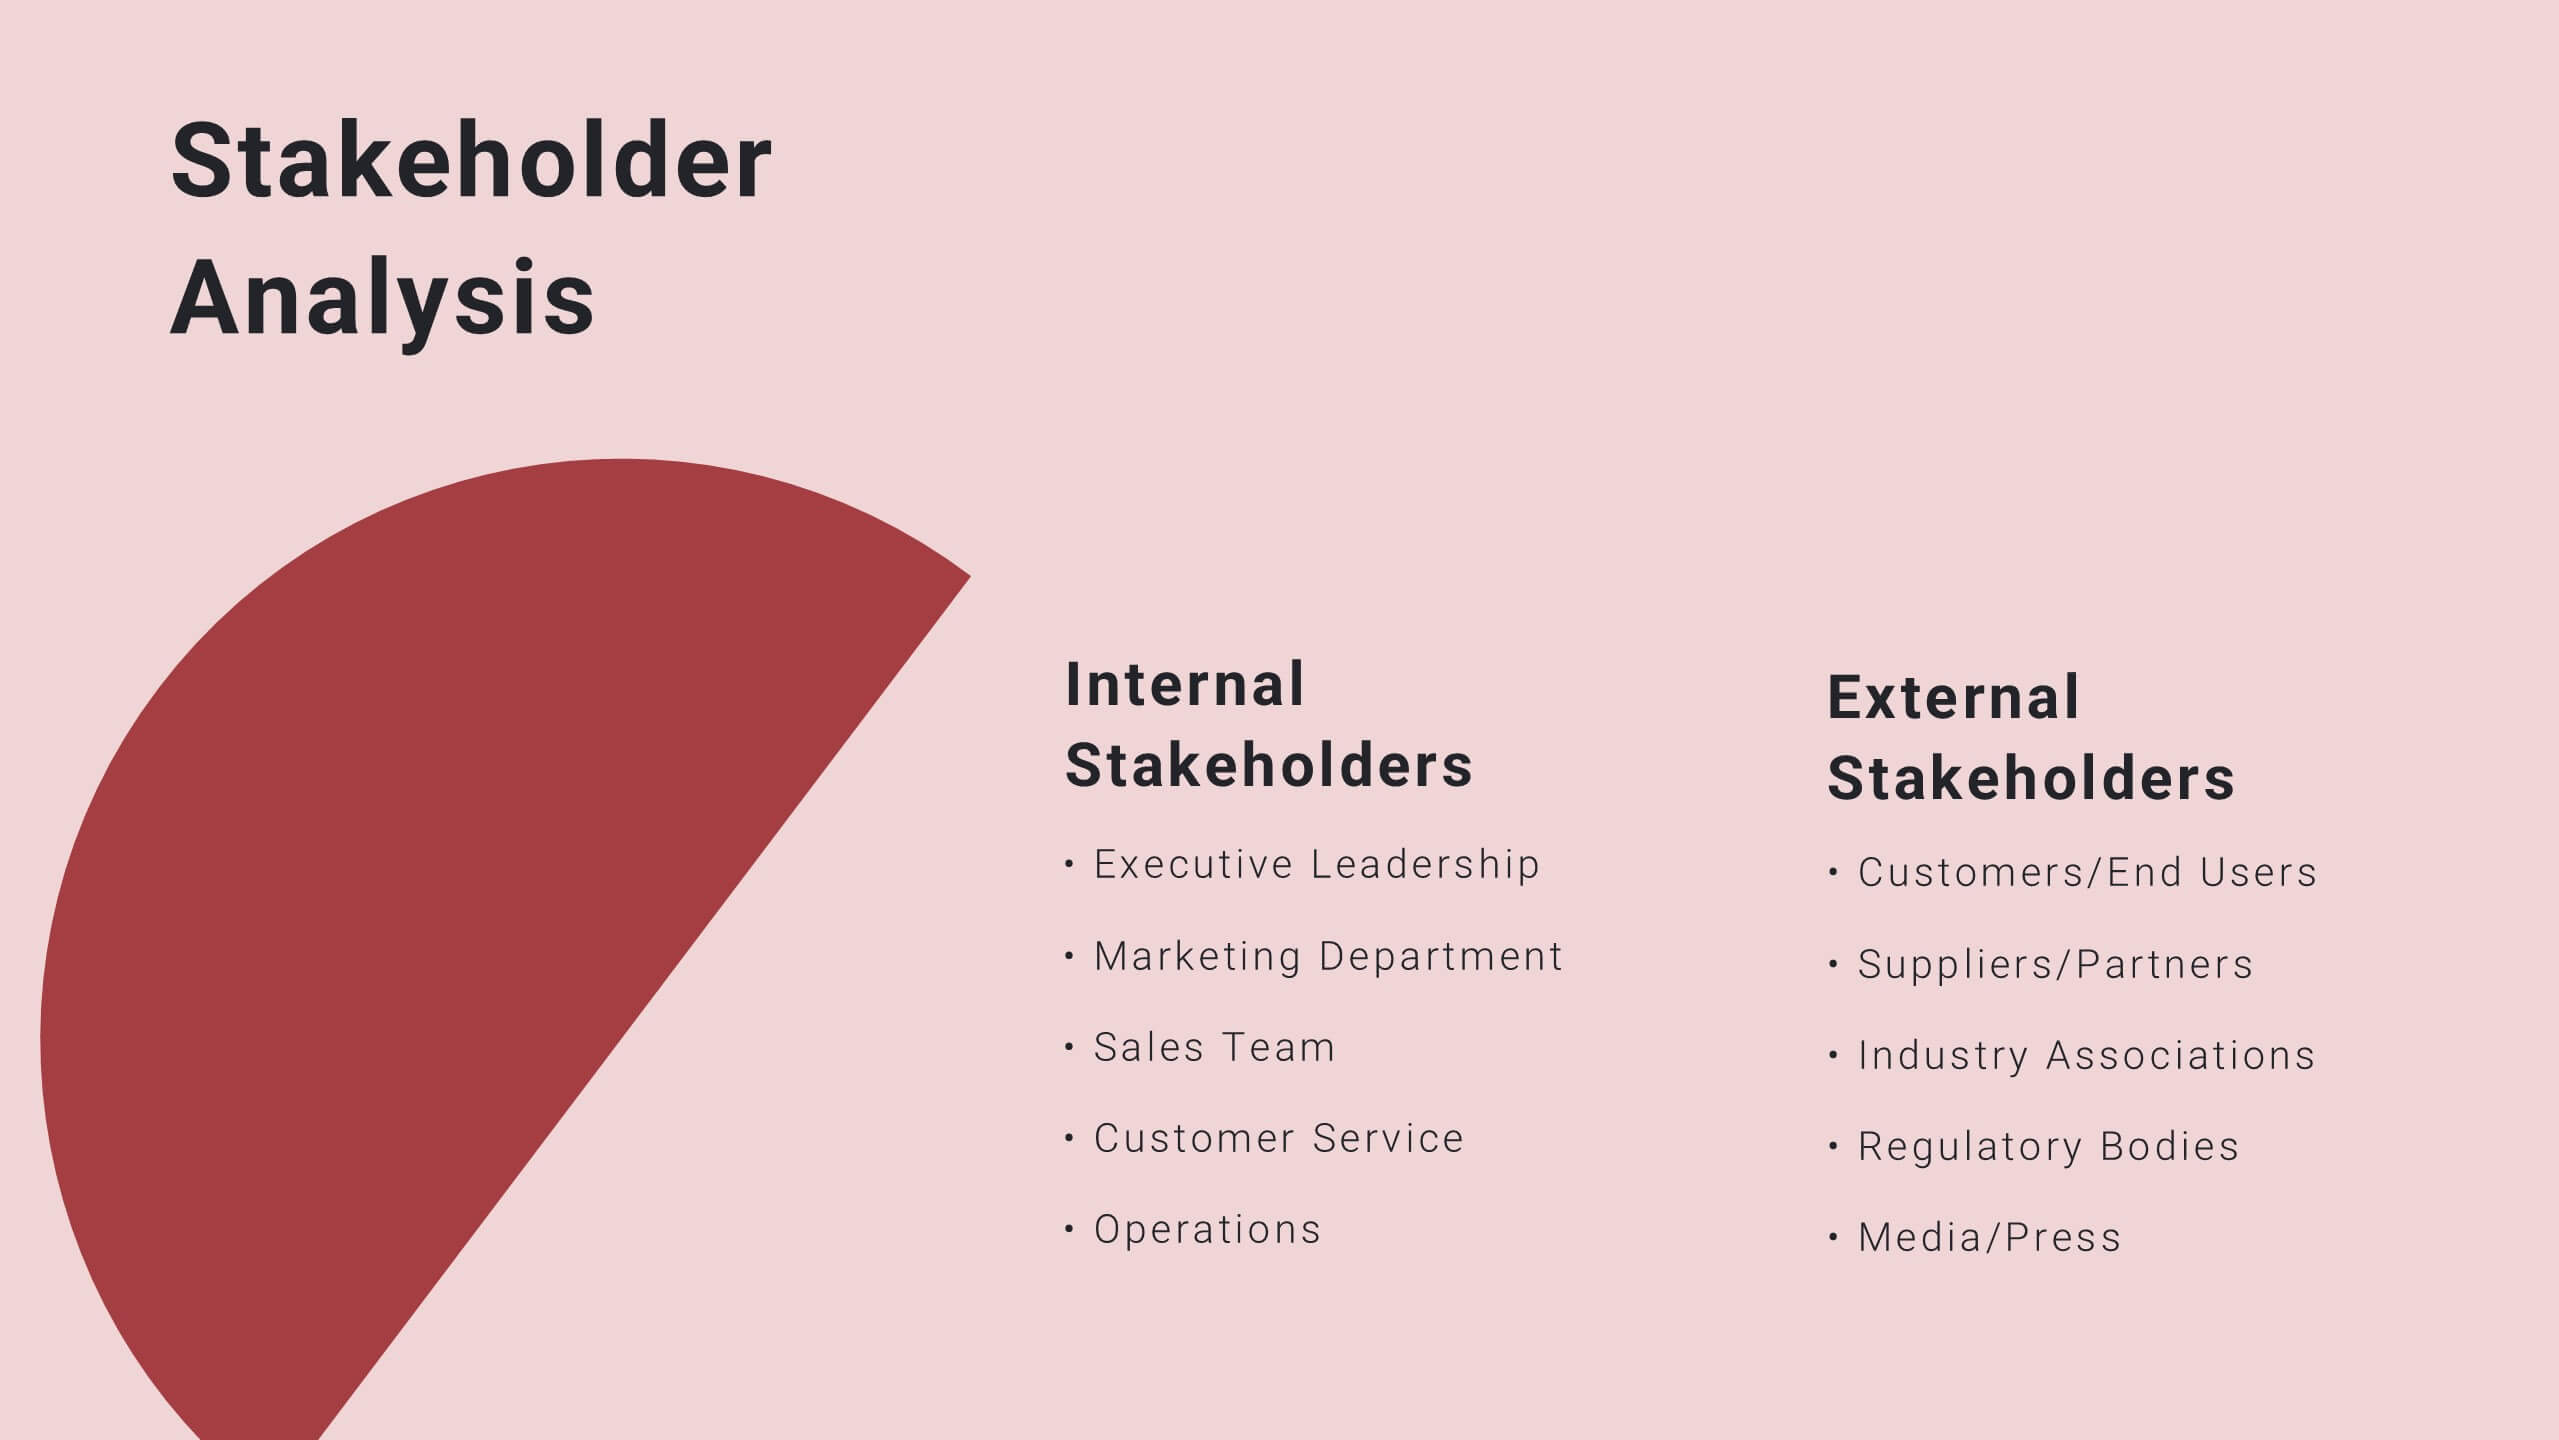
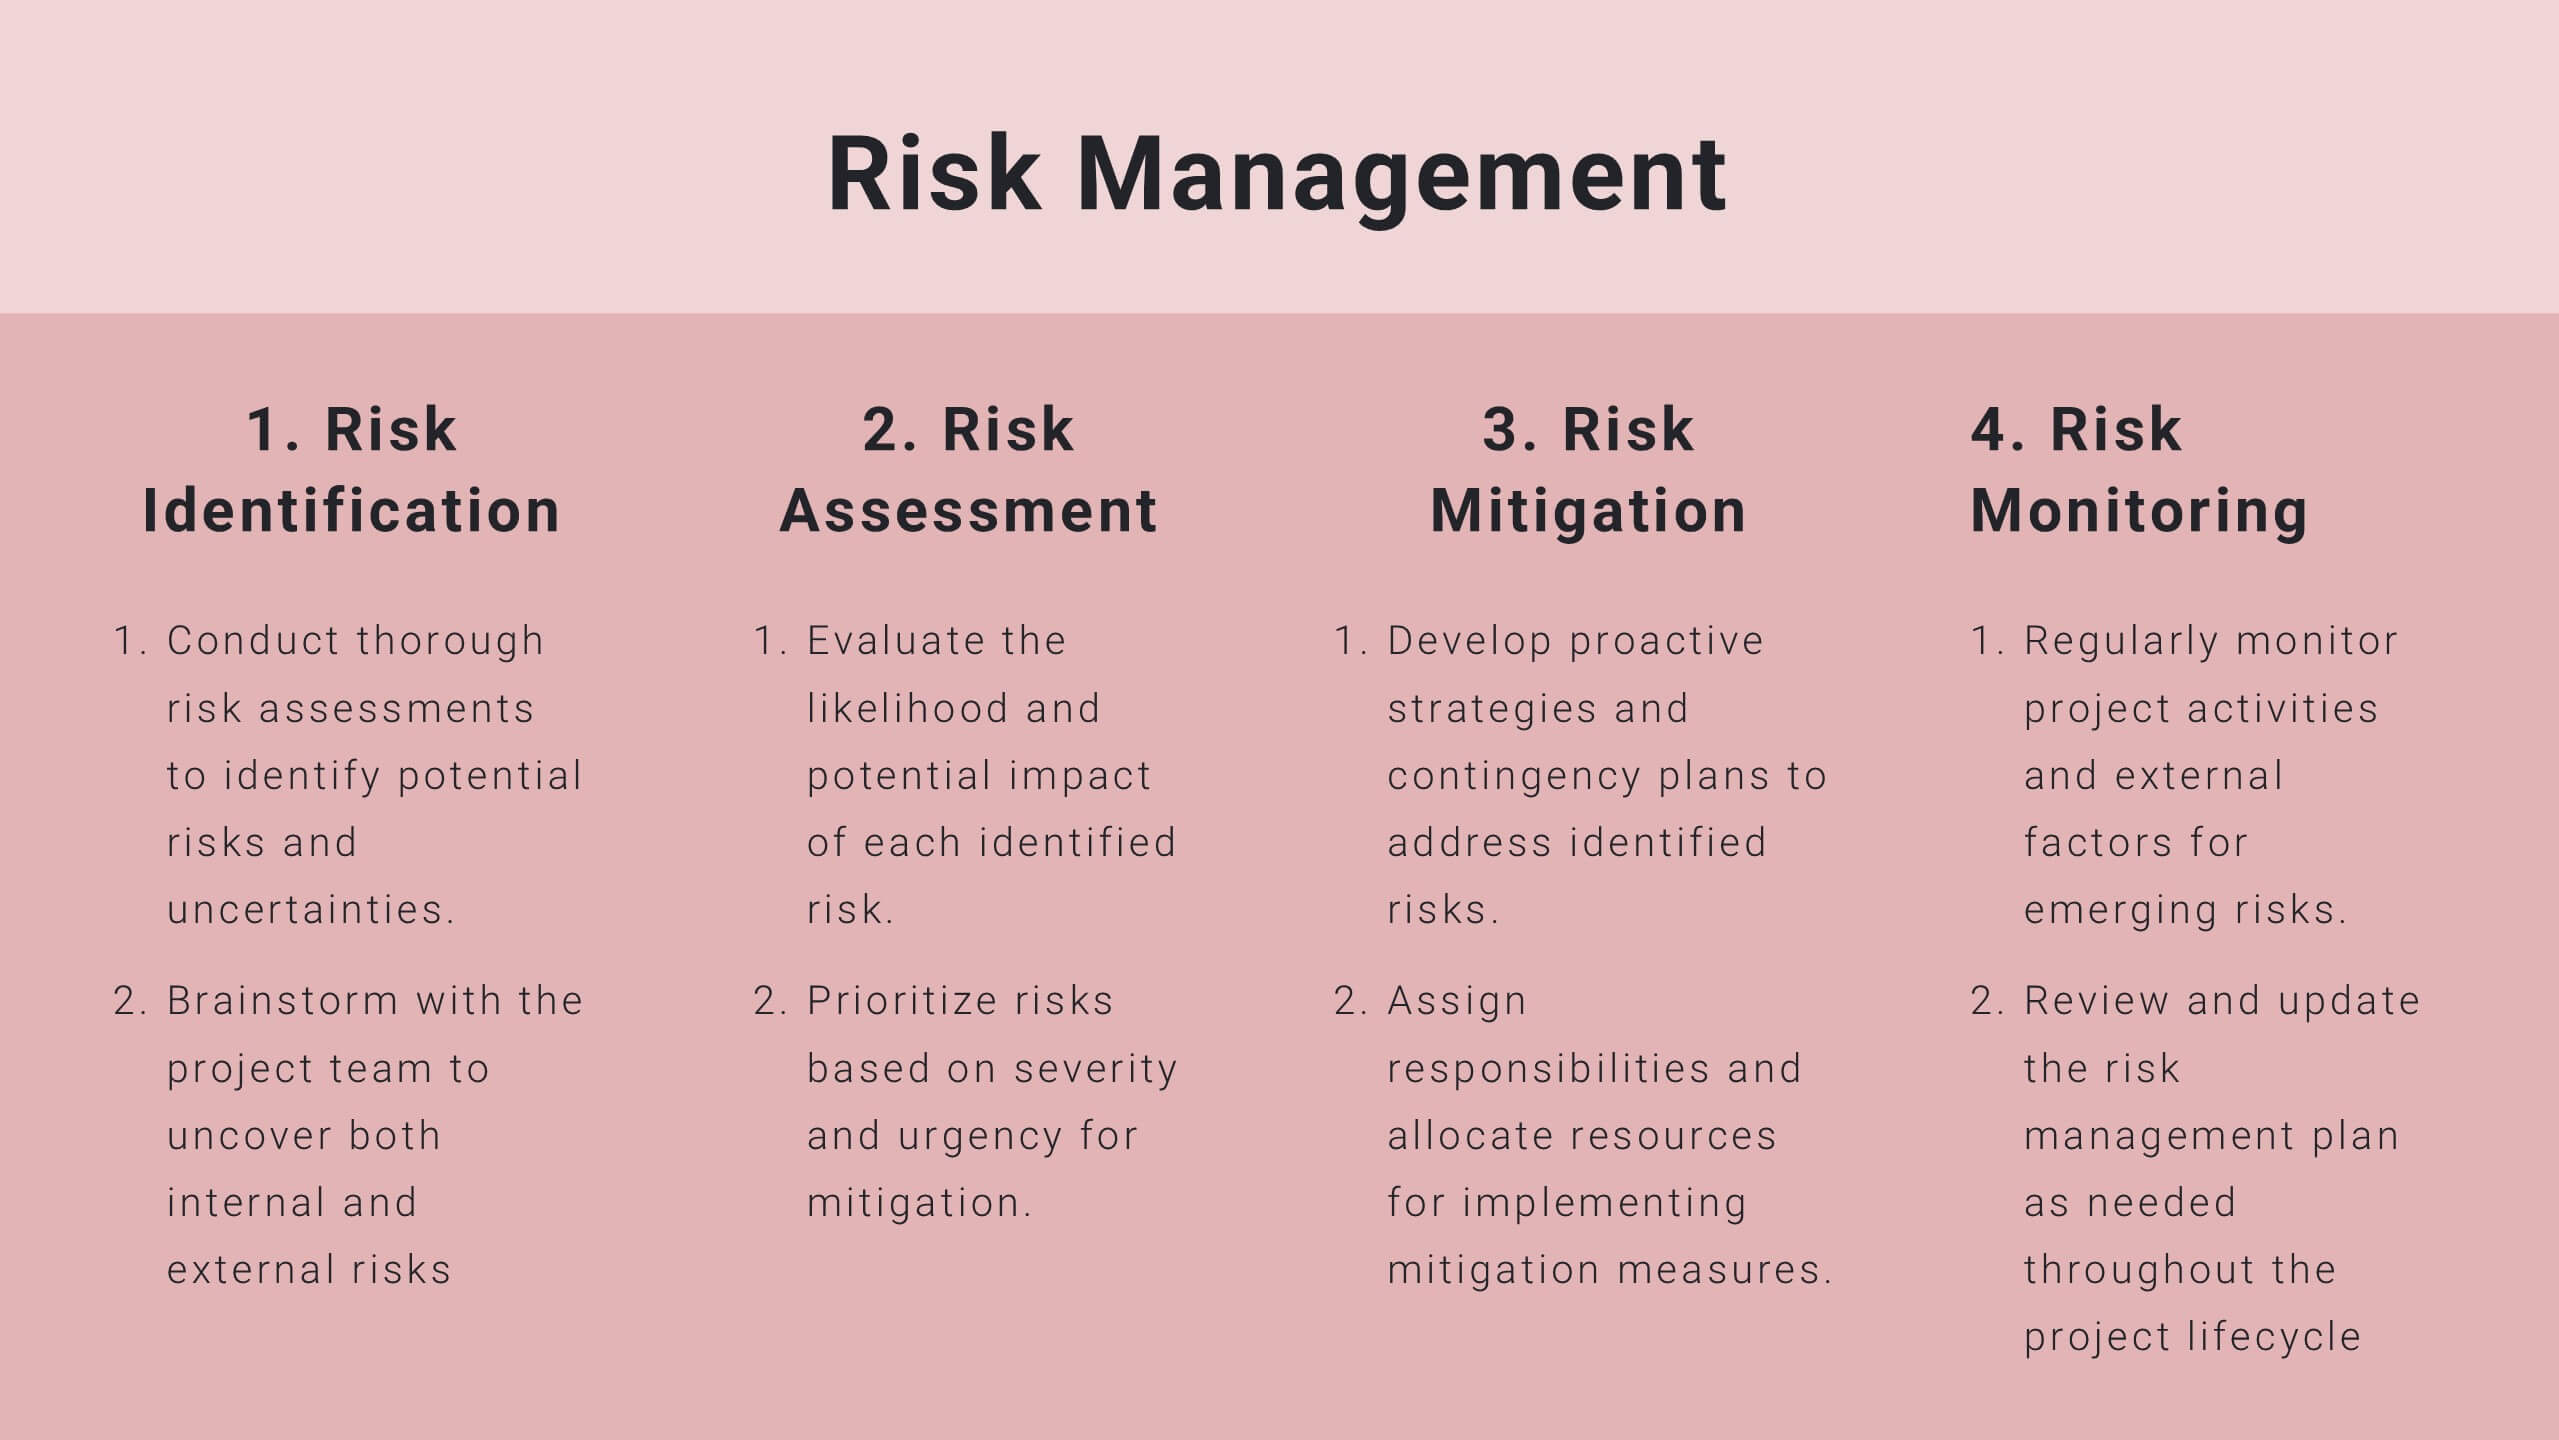
Present your project milestones and plan with clarity using this sleek project proposal template! It includes sections for objectives, timelines, budget breakdowns, and risk management. Perfect for organizing and presenting complex project plans, it’s fully customizable and compatible with PowerPoint, Keynote, and Google Slides, ensuring a professional presentation every time.


5 slides
Business Opportunity in Europe Map Presentation
Identify key growth areas across Europe with this clean, data-driven presentation. Highlight business potential using country-based color coding and progress indicators. Perfect for market analysis, investment pitches, or strategic expansion reports. Fully editable and compatible with PowerPoint, Keynote, and Google Slides for effortless customization and professional presentation delivery.


21 slides
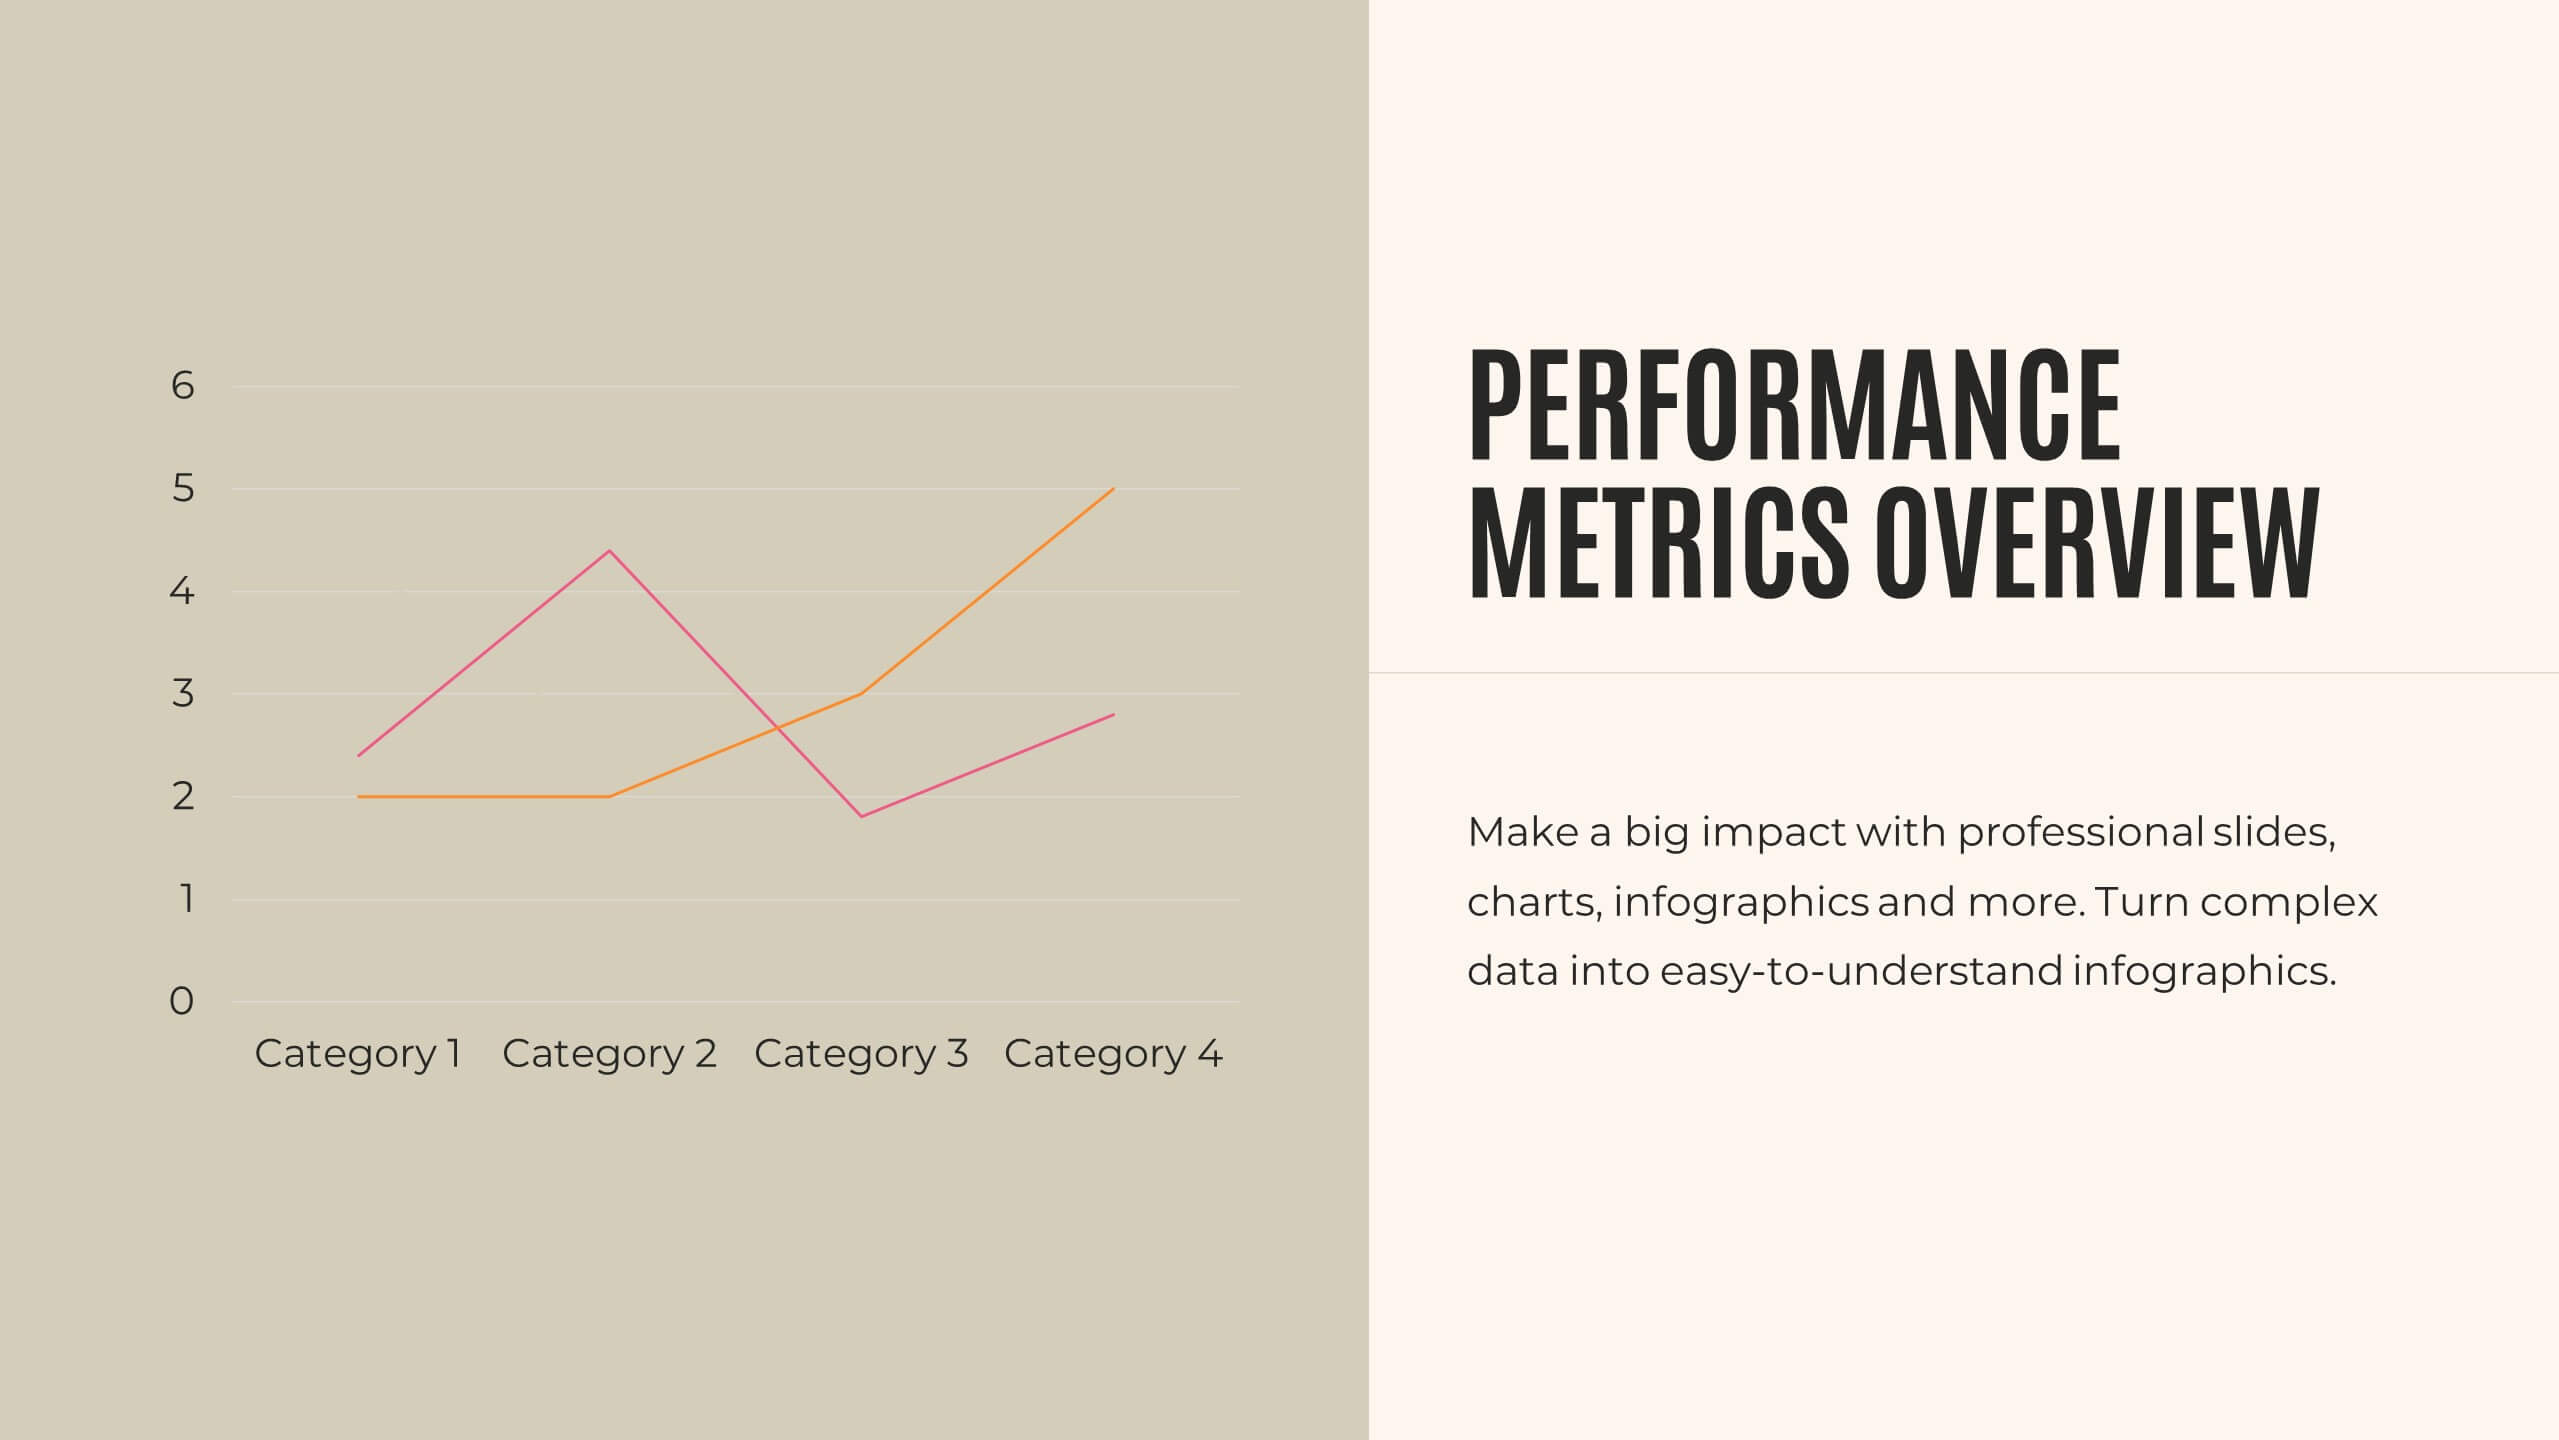
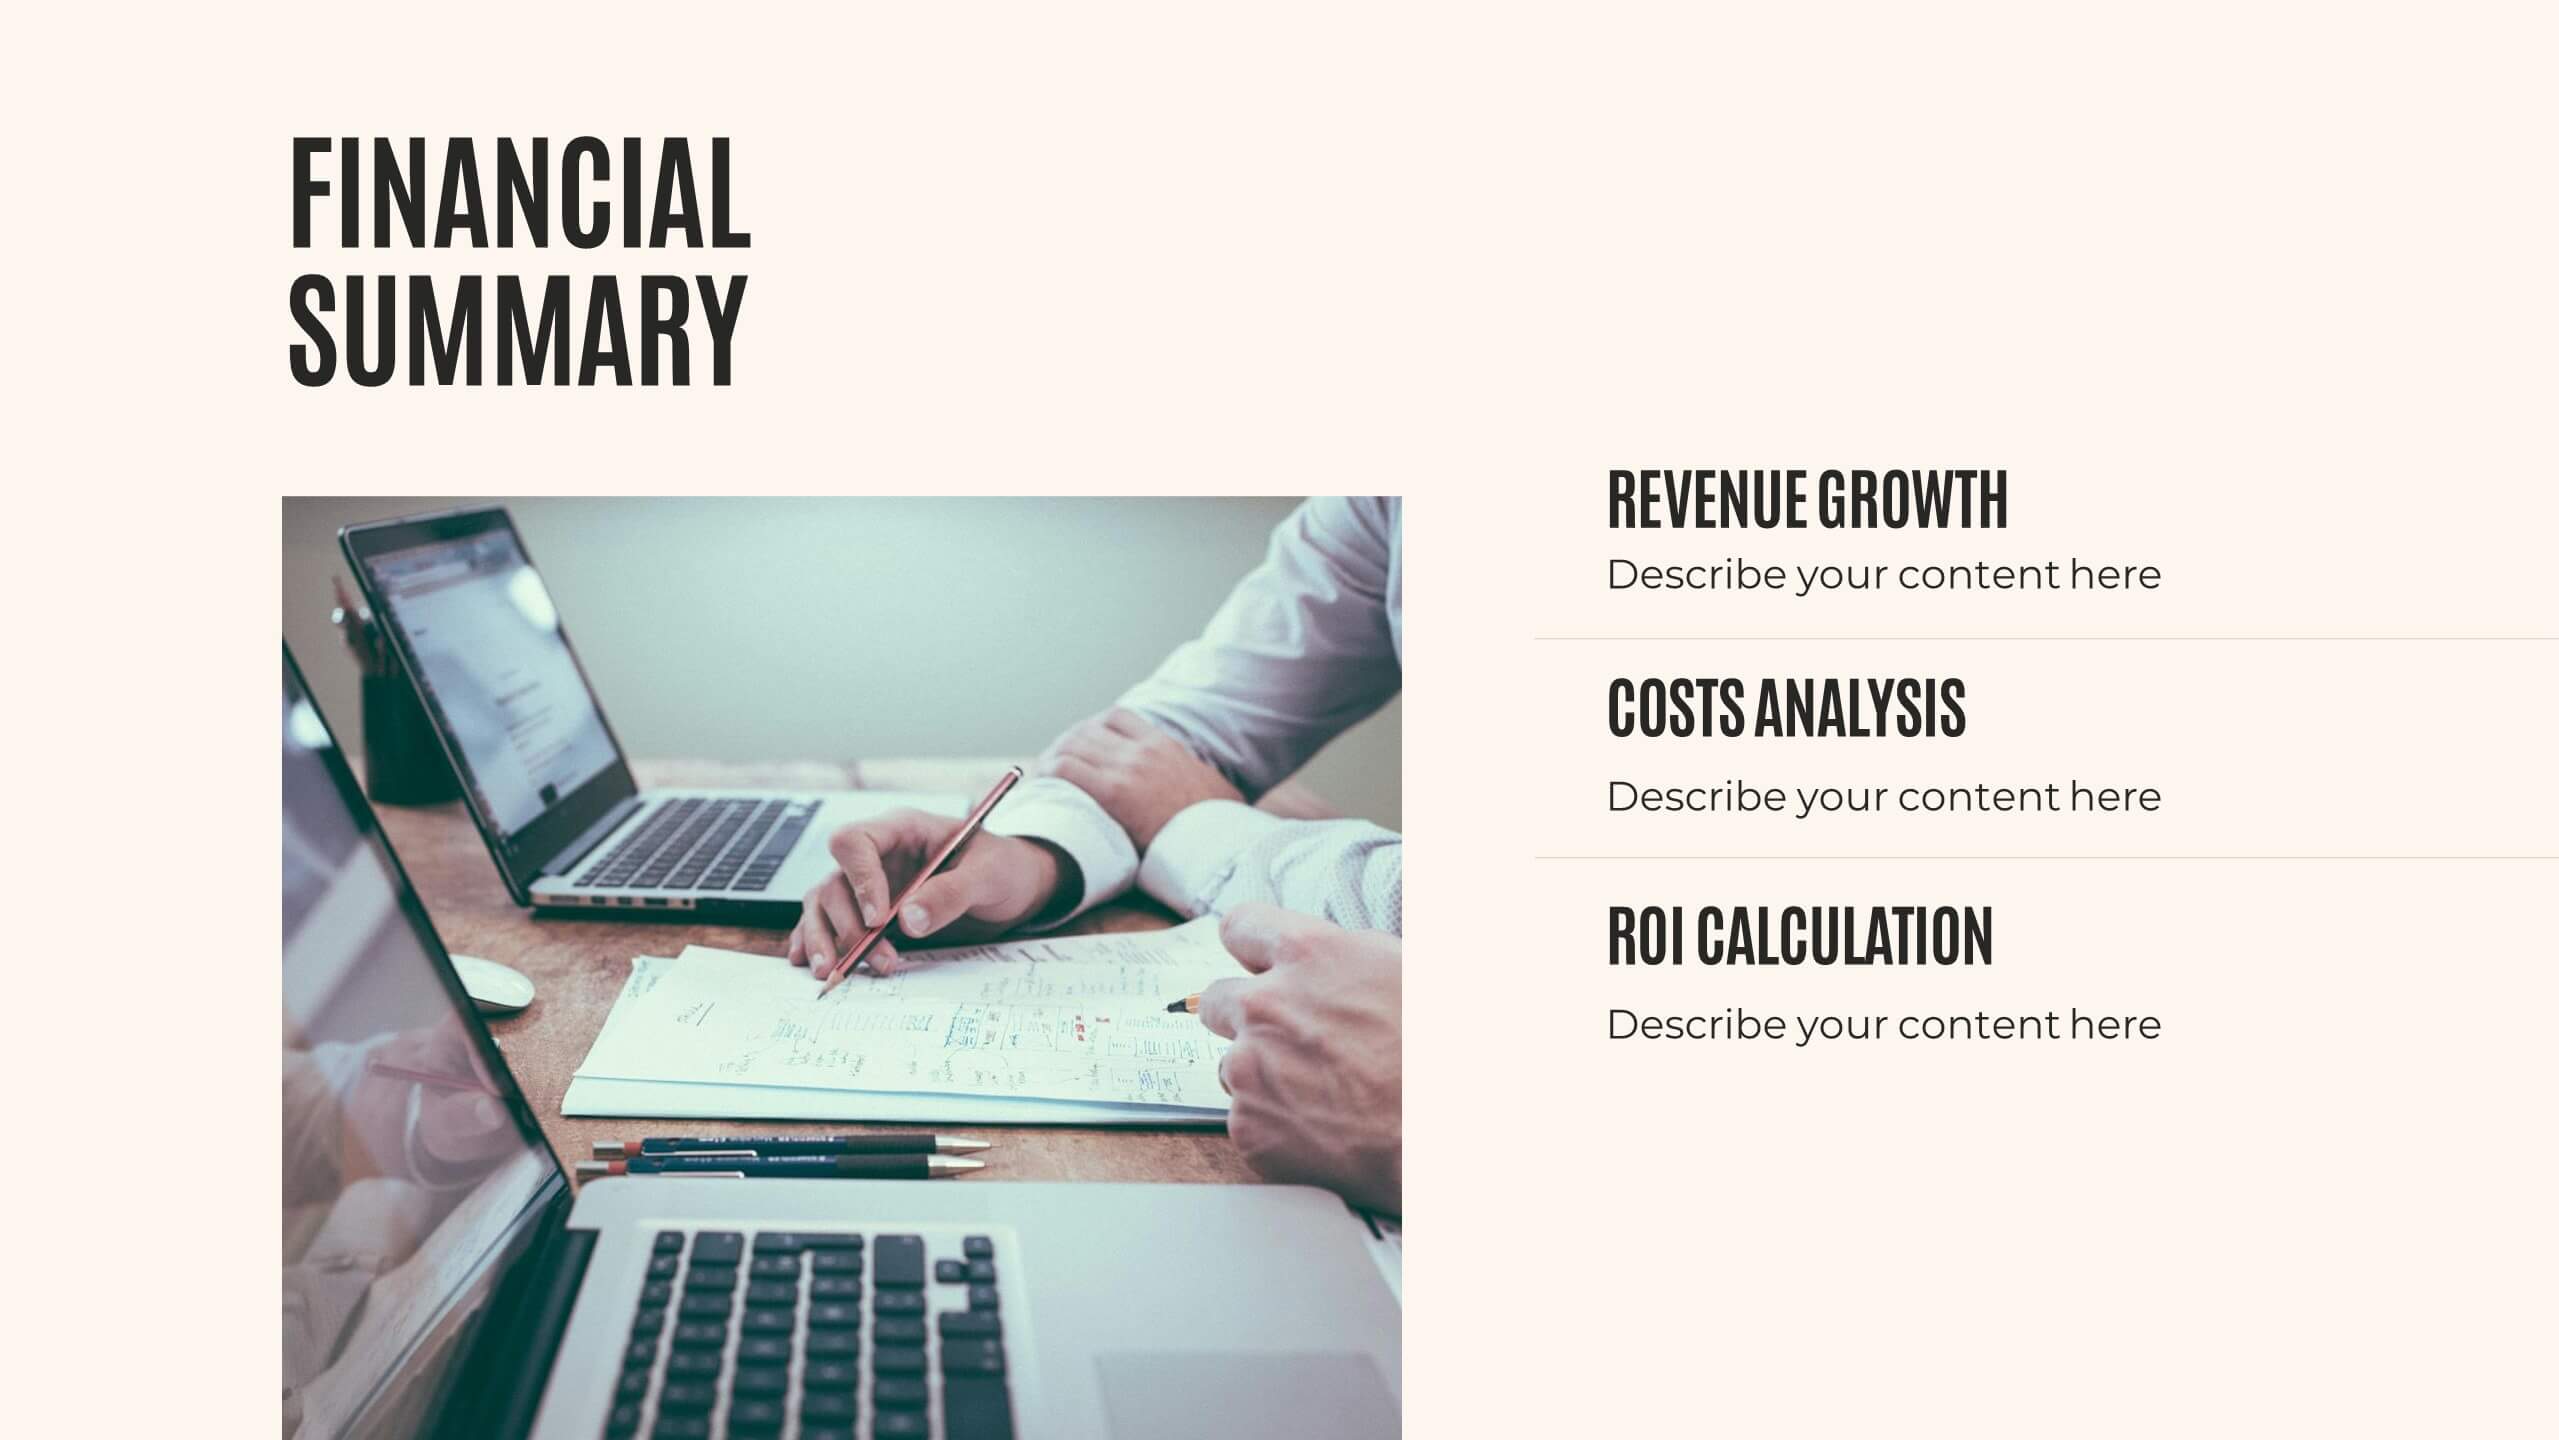
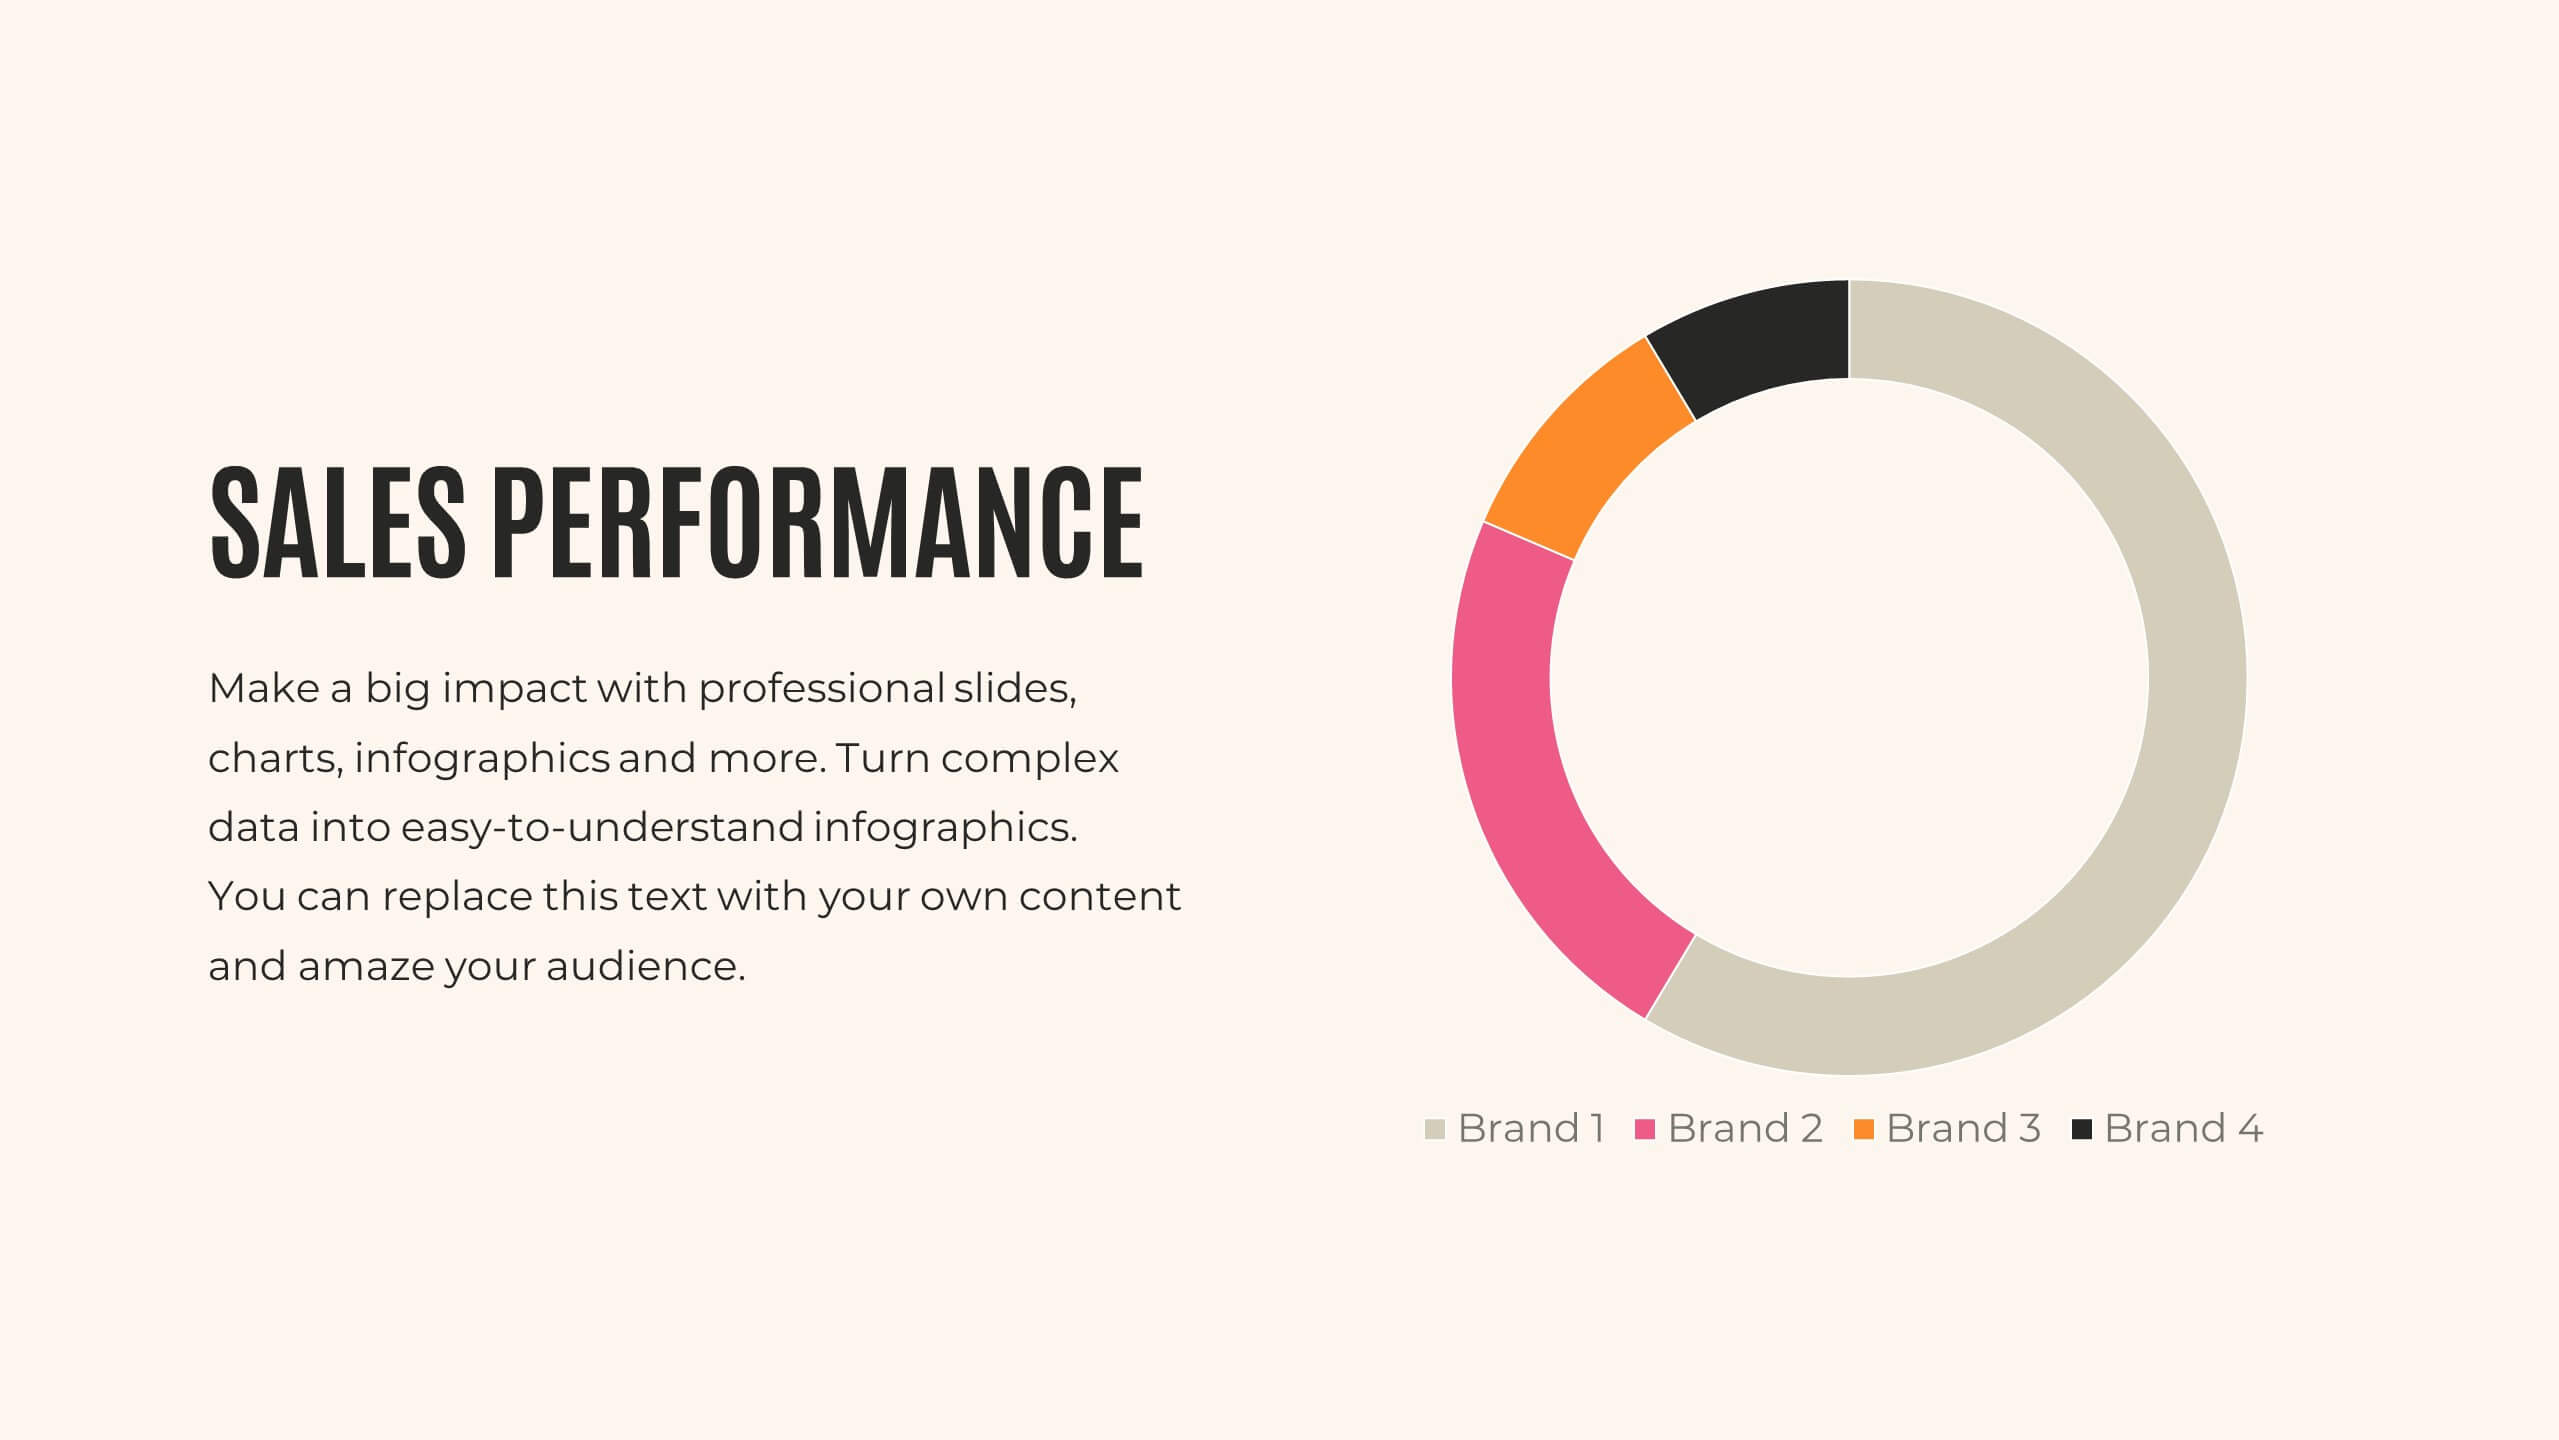
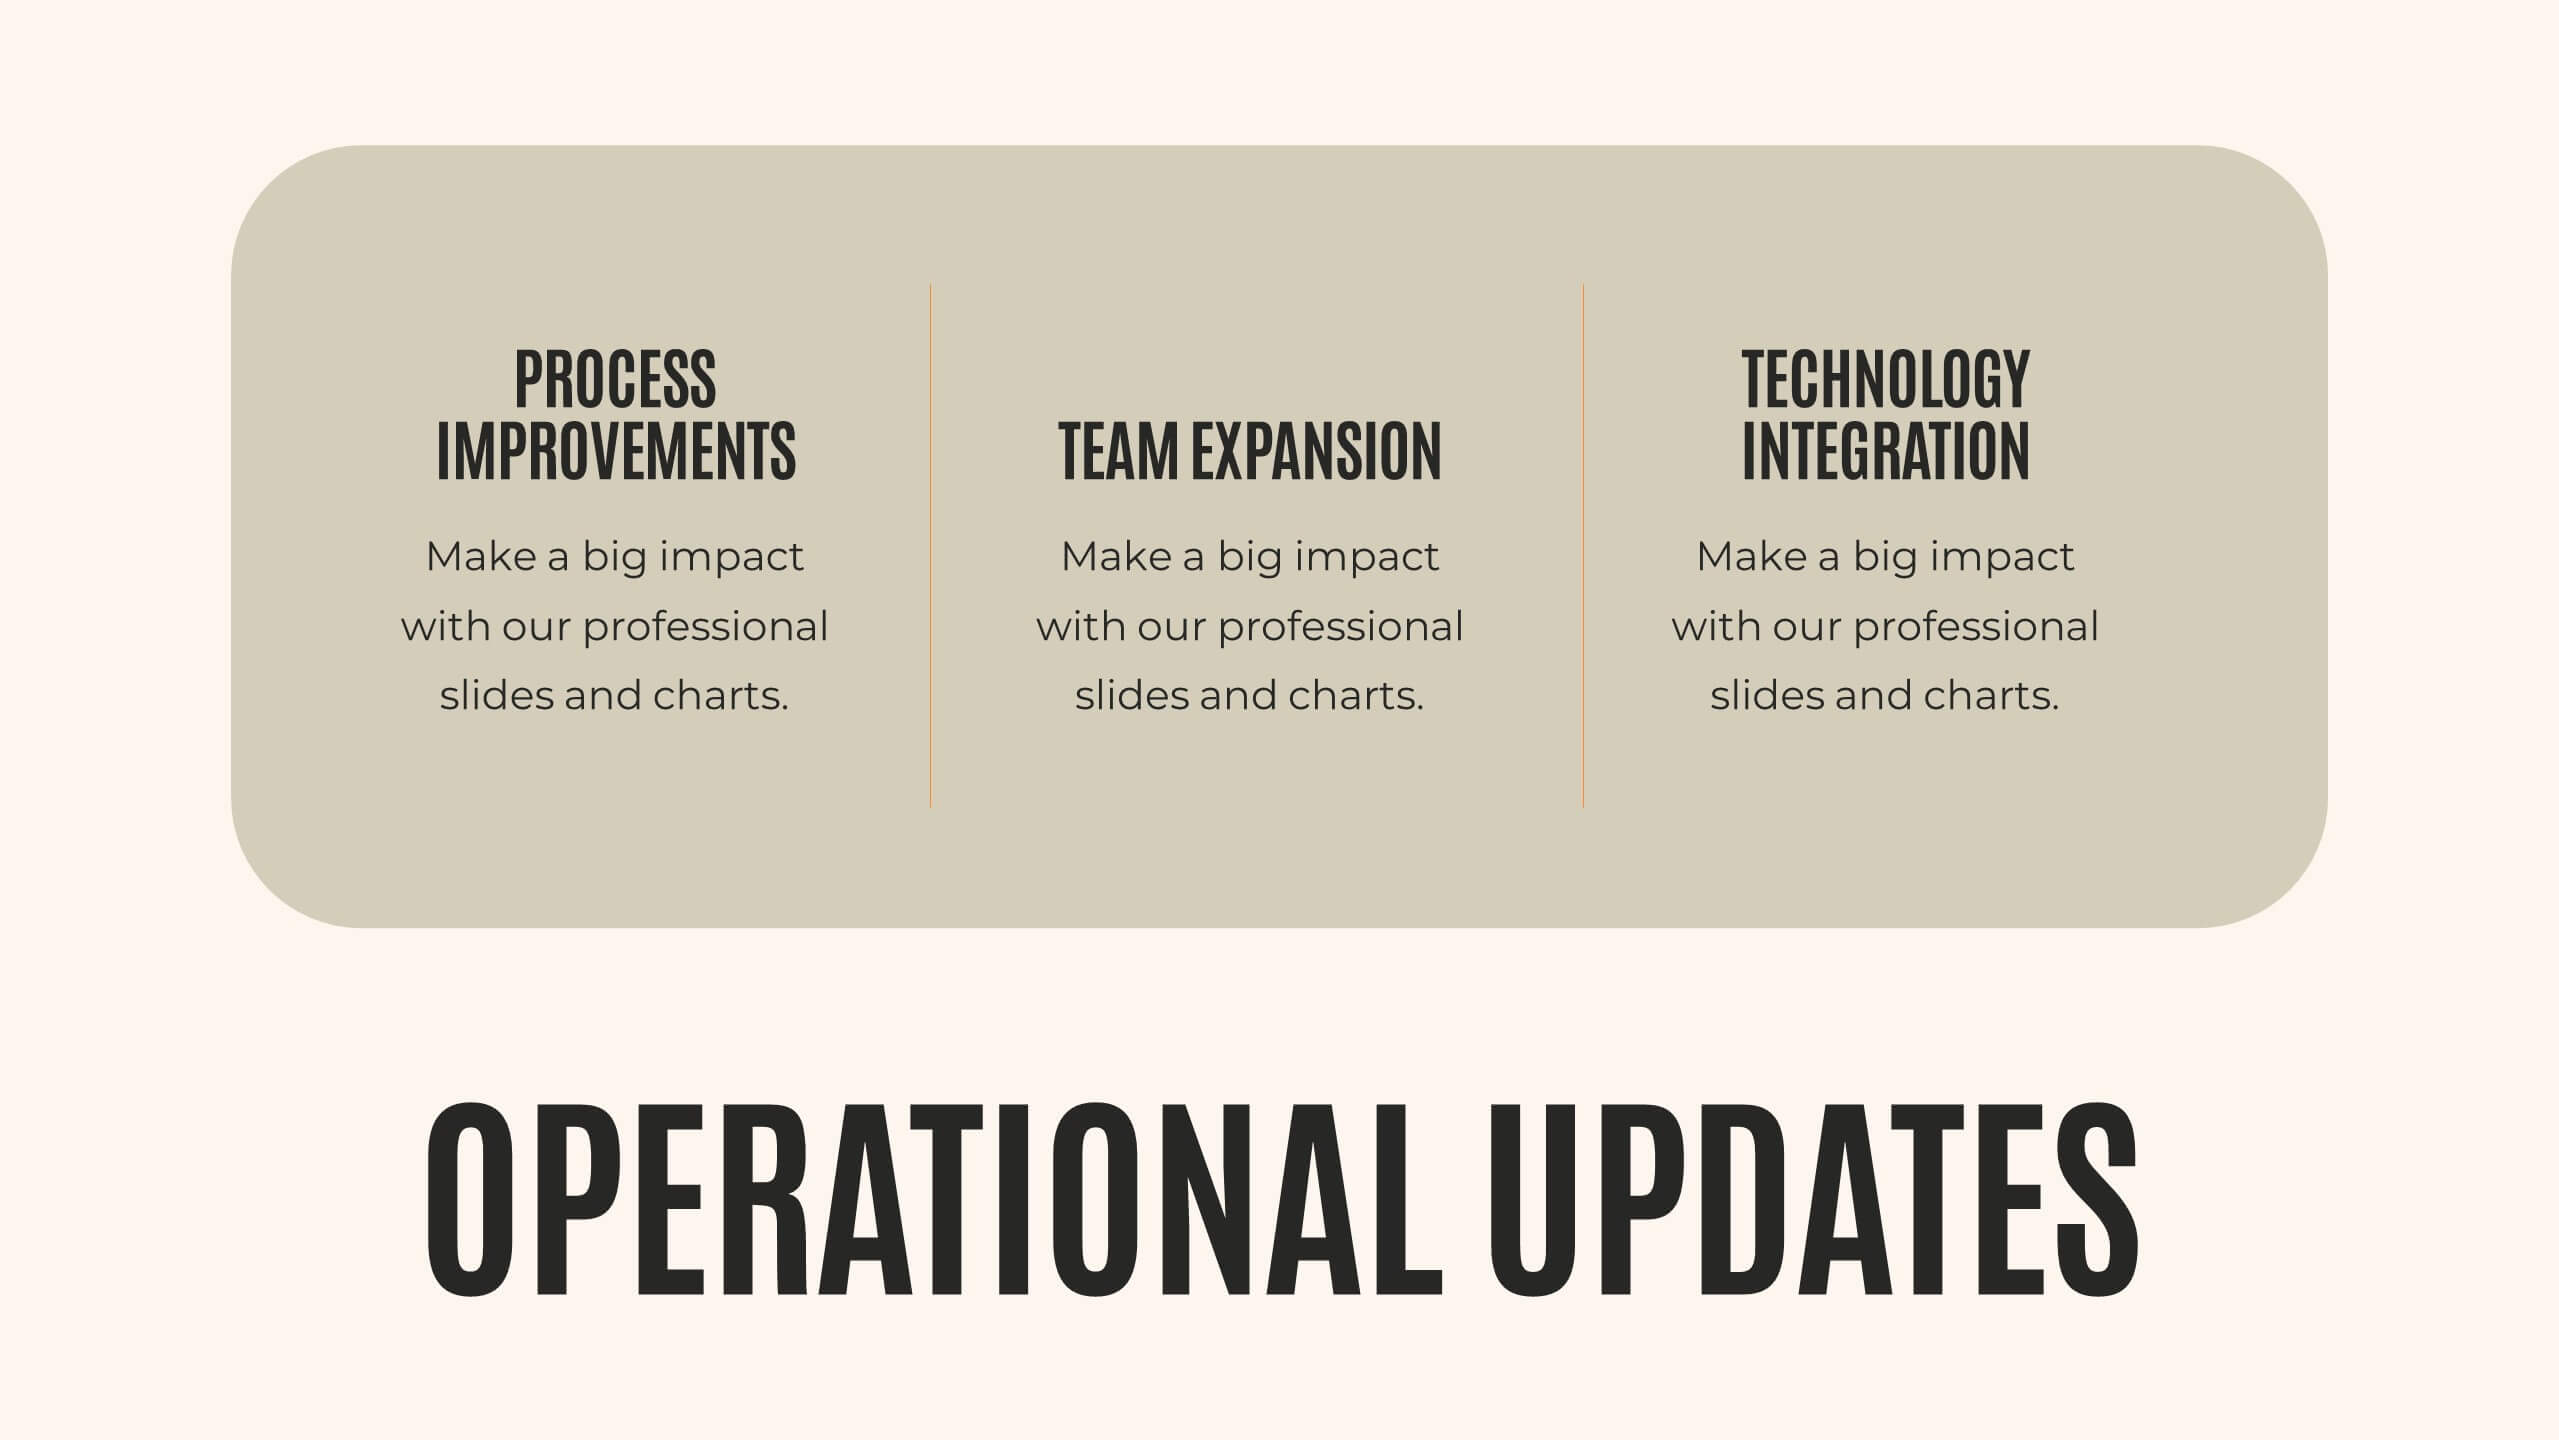
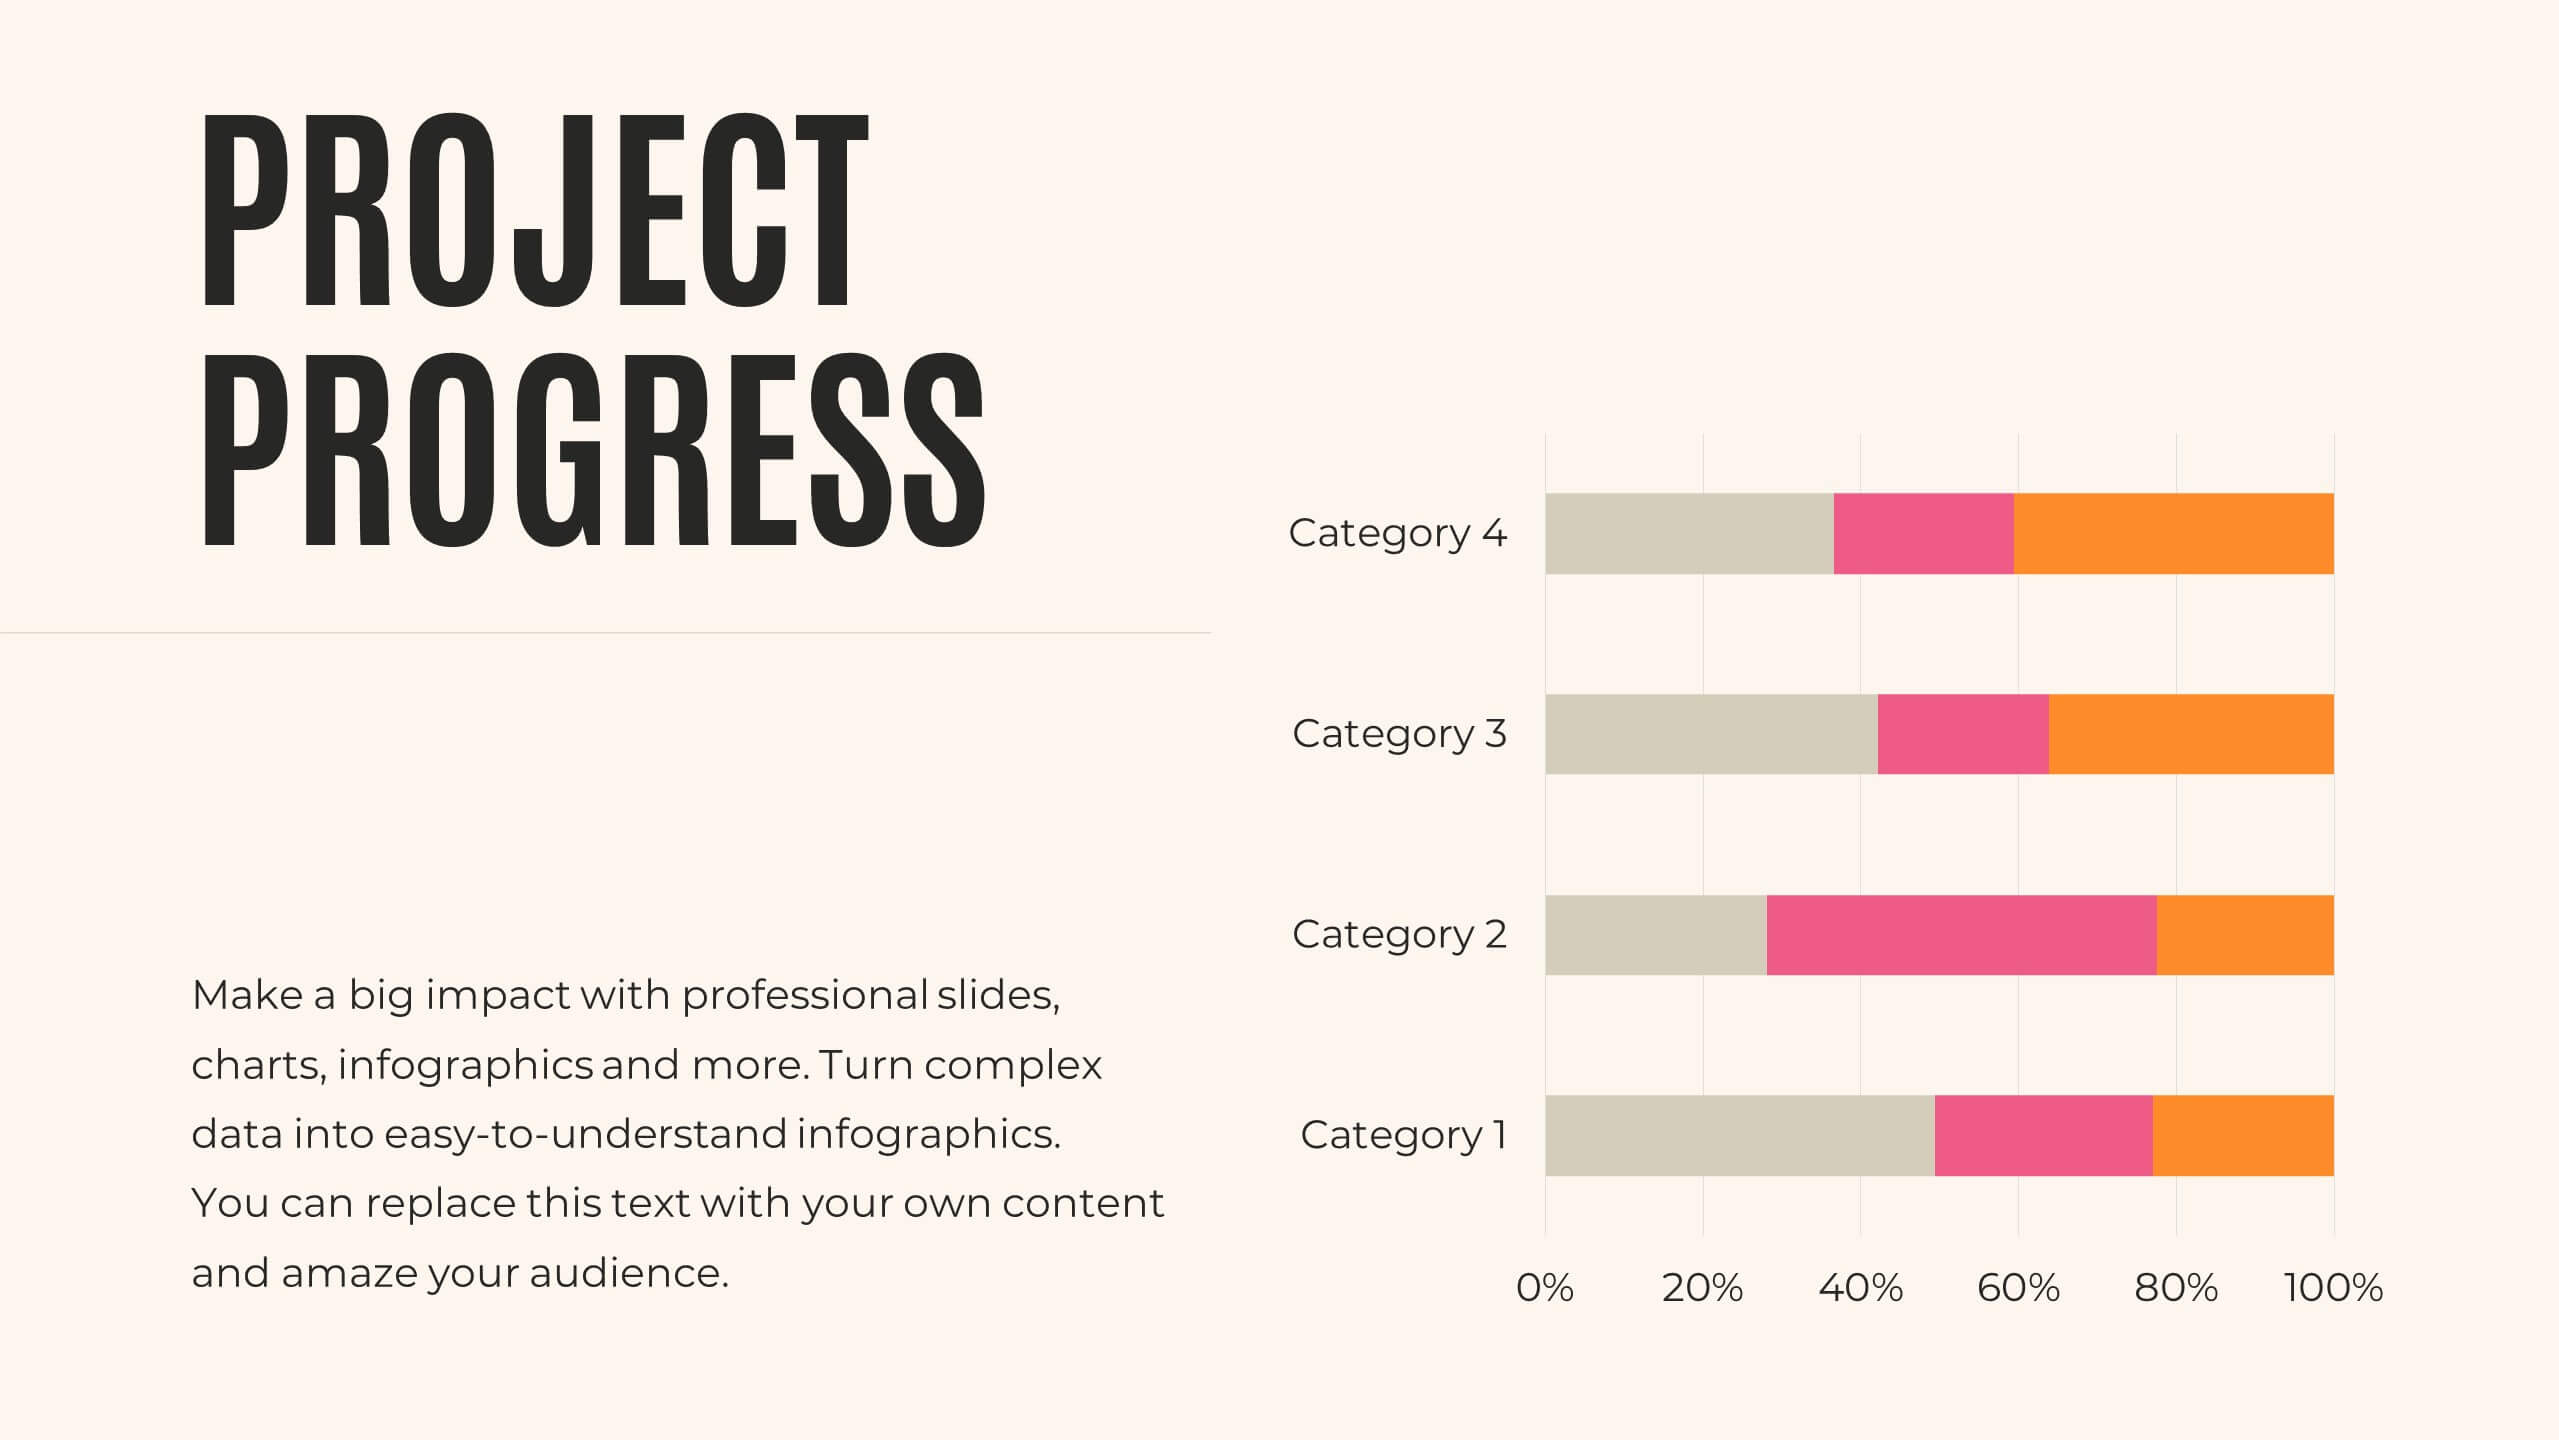
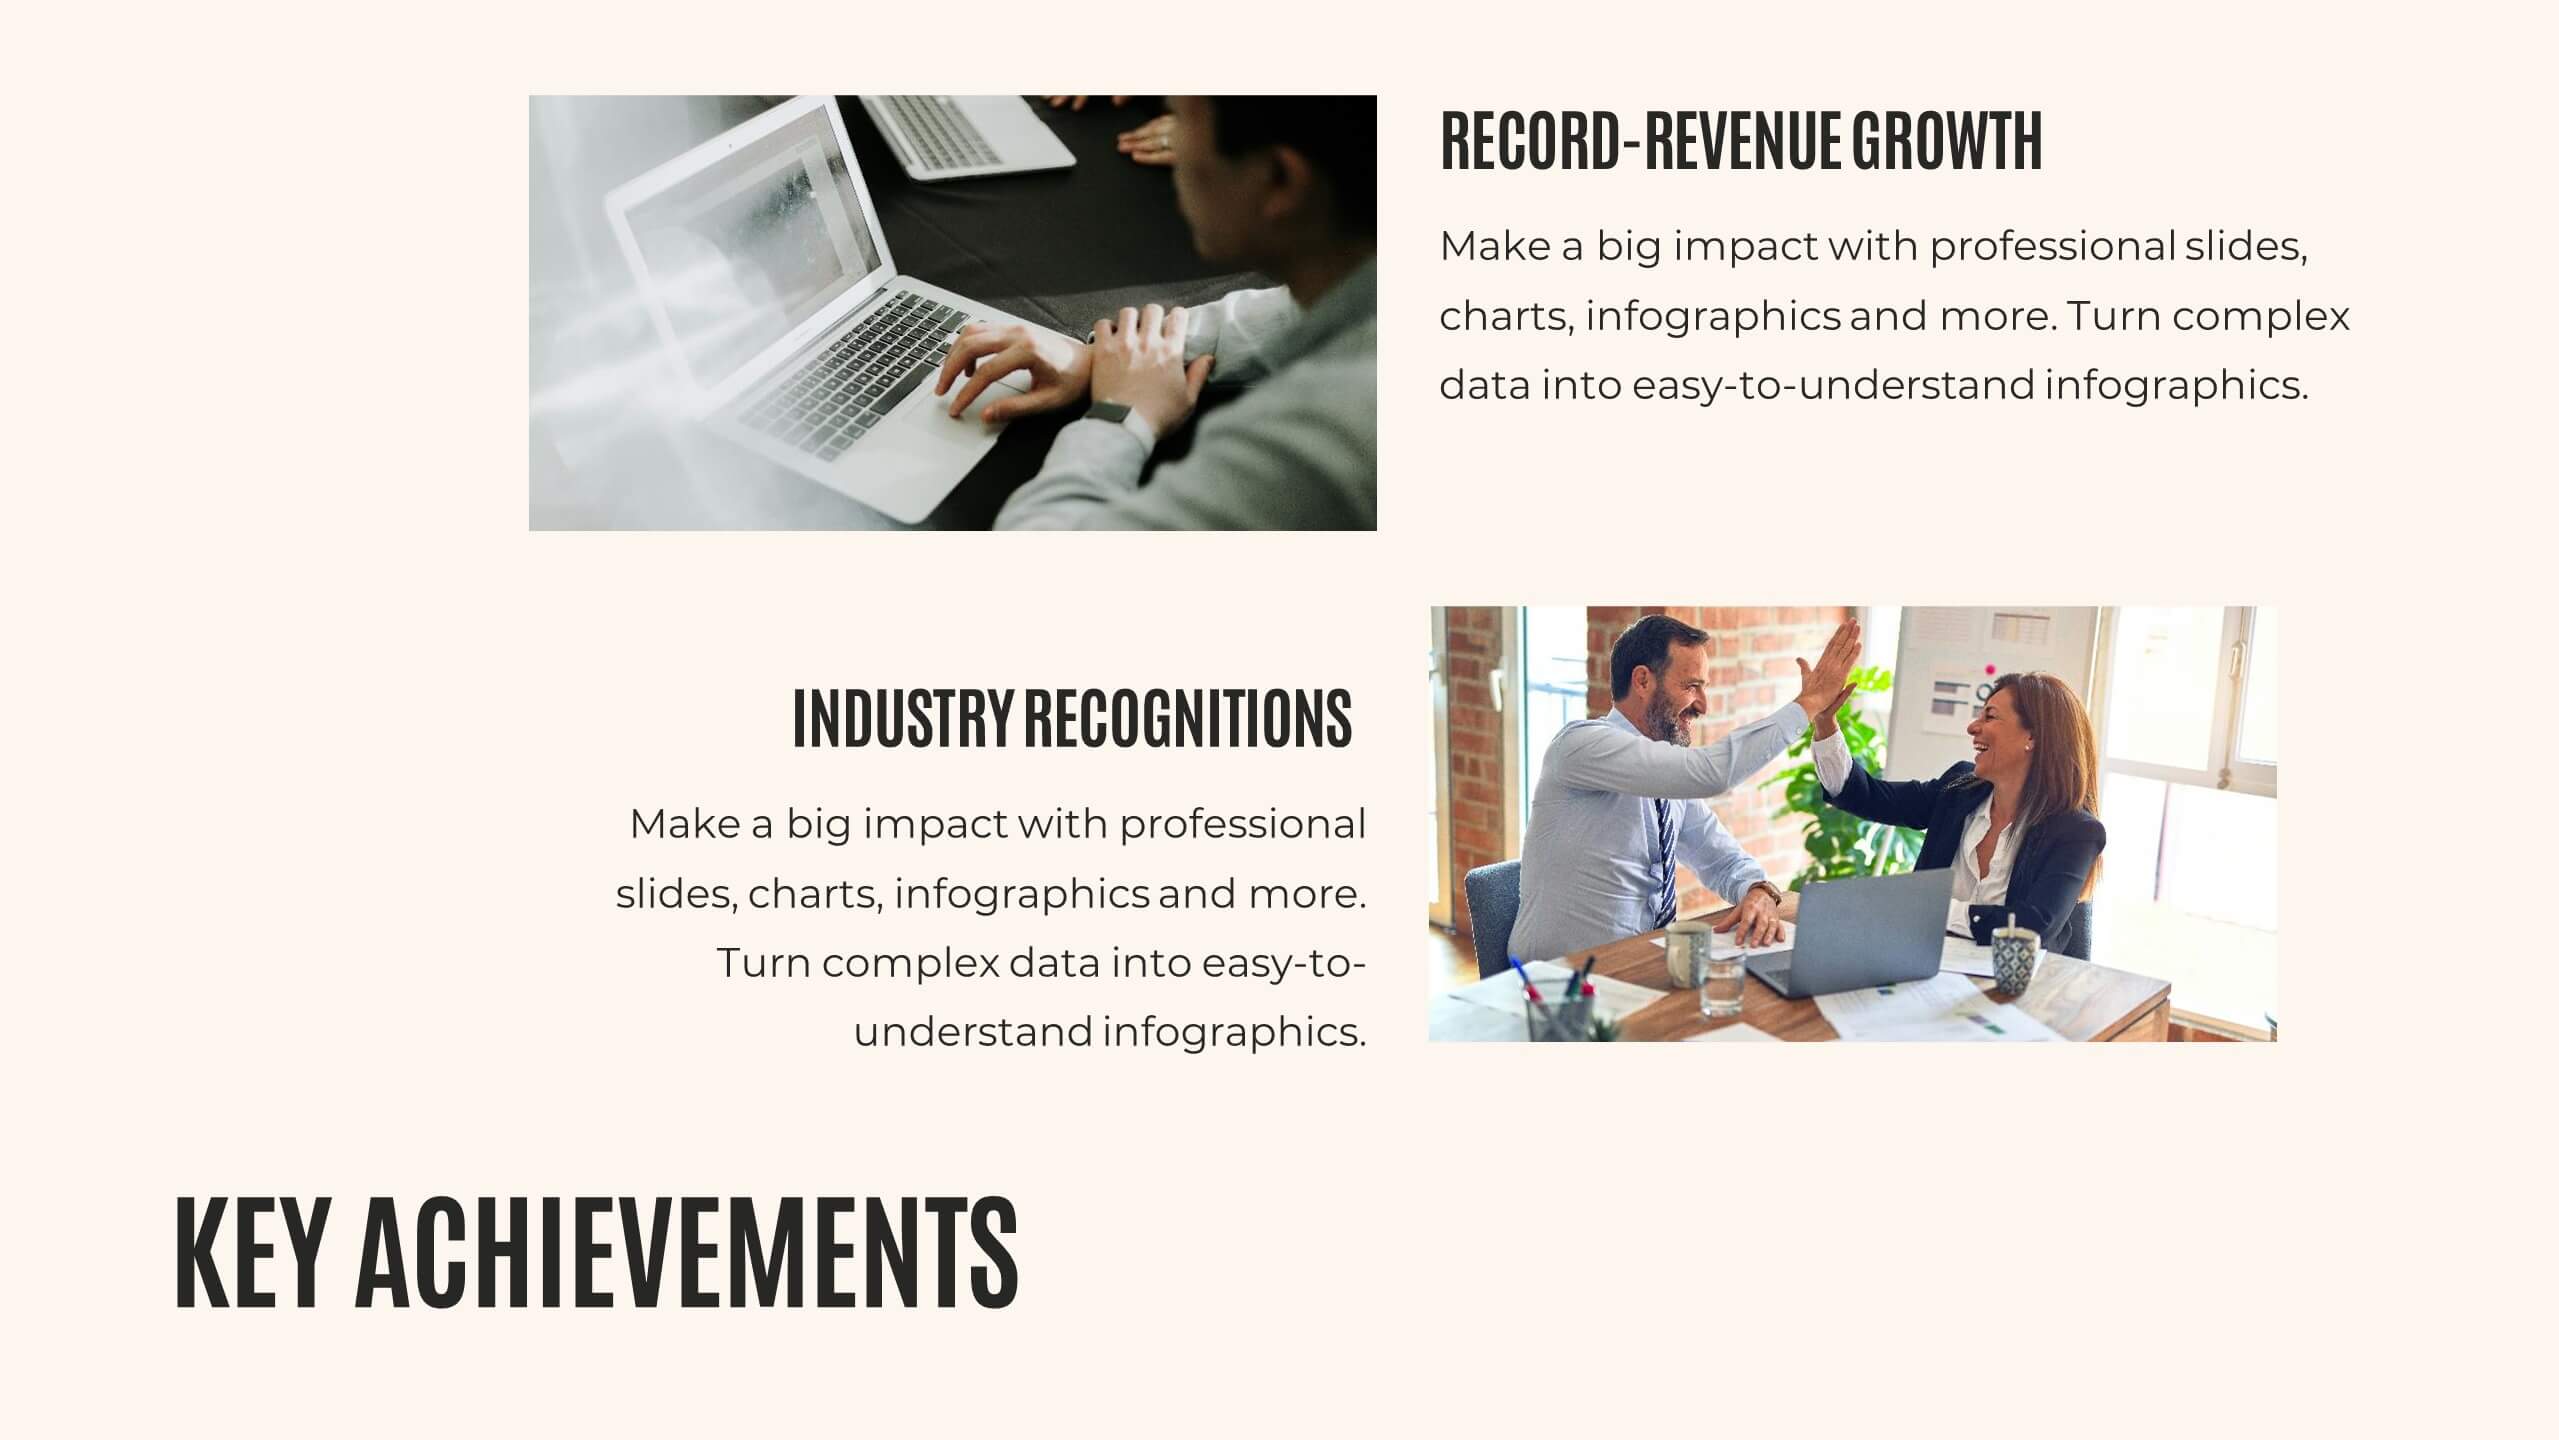
Journey Annual Report Presentation
Present your annual report with clarity and impact! This template covers agenda, key highlights, financial summary, sales performance, and project progress. Ideal for detailing achievements, insights, and future priorities. Compatible with PowerPoint, Keynote, and Google Slides, it ensures your data is visually compelling and easy to understand. Showcase your success effortlessly!


5 slides
North American Business Overview and Map Presentation
Showcase regional performance data across North America with this clean, data-driven map slide. Highlight four key statistics using pinpoint markers and modern percentage indicators. Ideal for market overview, financial reporting, or strategic insights. Fully customizable and compatible with PowerPoint, Keynote, and Google Slides for seamless business presentations.


8 slides
Investor Business Plan Presentation
The "Investor Business Plan Presentation" template is innovatively designed to illustrate the balance and interdependence of various business elements critical for attracting investors. Utilizing a seesaw mechanism as a metaphor, this template vividly demonstrates how key aspects like Partners, Resources, Activities, and Channels contribute to maintaining a stable and functional business model. Each section of the seesaw is colored differently to distinguish between the categories, providing a clear visual hierarchy. This presentation format is excellent for startups and existing businesses preparing to pitch to investors, highlighting how each strategic component is vital for overall success and stability in the market.


6 slides
Product Development Cycles Presentation
A great product starts with a clear, engaging story—this presentation brings that journey to life. It outlines each stage of the development cycle in a simple, visual flow that helps teams communicate progress, milestones, and next steps. Perfect for strategy, planning, and updates. Fully compatible with PowerPoint, Keynote, and Google Slides.


7 slides
Company Profile Overview Infographic
This set of company profile templates is expertly designed to help organizations succinctly and effectively convey their corporate identity and core values. Ideal for businesses seeking to outline their brand, history, and capabilities, each template is structured to enhance the presentation of company data to stakeholders and clients. The templates feature professional layouts that prioritize ease of reading and aesthetic appeal, ensuring that critical information like company achievements, mission, and service offerings are highlighted effectively. The designs incorporate a clean, contemporary style with ample space for customization, allowing companies to adapt the visuals and text to match their branding requirements. This adaptability makes the templates suitable for a wide range of industries and purposes, from corporate introductions and annual reports to marketing materials and business proposals. By providing a coherent structure that businesses can personalize with their specific details, these templates serve as a valuable tool in building a strong, professional image. They offer practical solutions for companies to present themselves in a polished and organized manner, fostering a positive impression among potential investors, clients, and partners.


7 slides
Innovation Strategy Infographic Presentation
An Innovation Infographic presents information related to innovation, including why it is important, and how it can be managed in different contexts. Innovation is the process of developing new ideas and products that create value and drive progress. This template is designed to help you effectively communicate the importance of innovation and provide tips and strategies for managing it. This template includes seven customizable layouts and charts, and allows you to include your own images. The template also includes editable text boxes and bullet points to present your information.