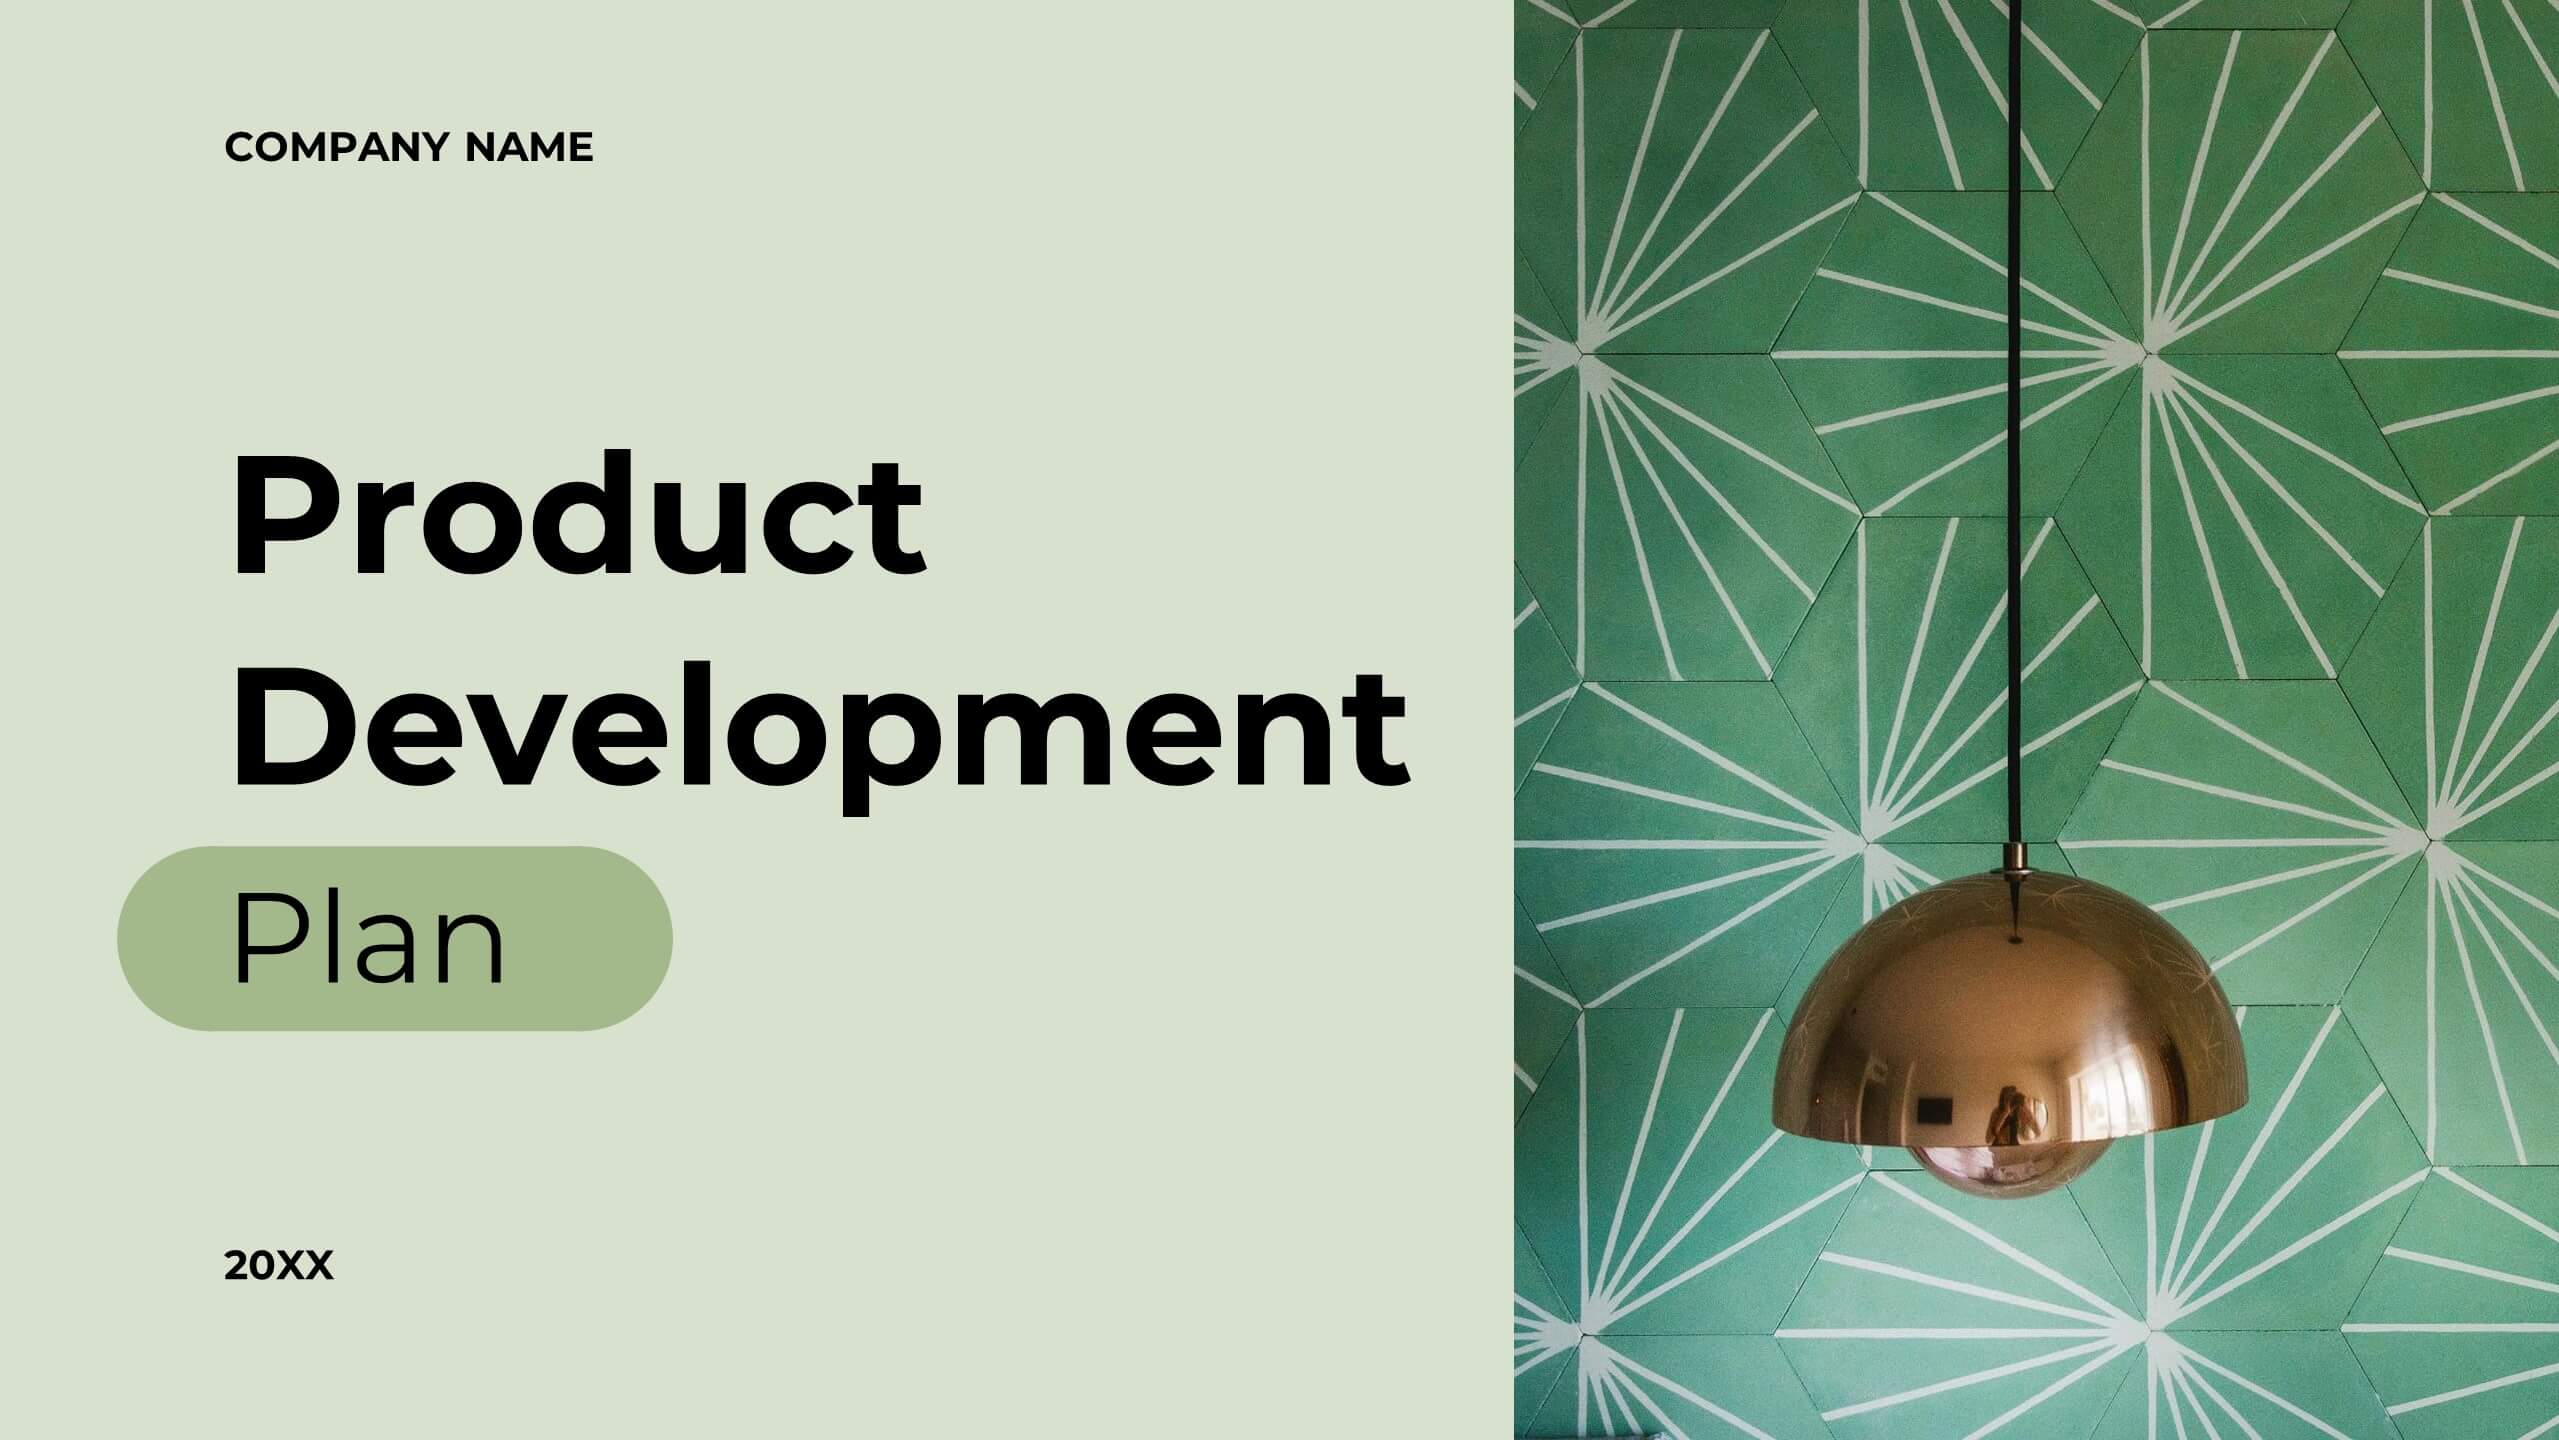
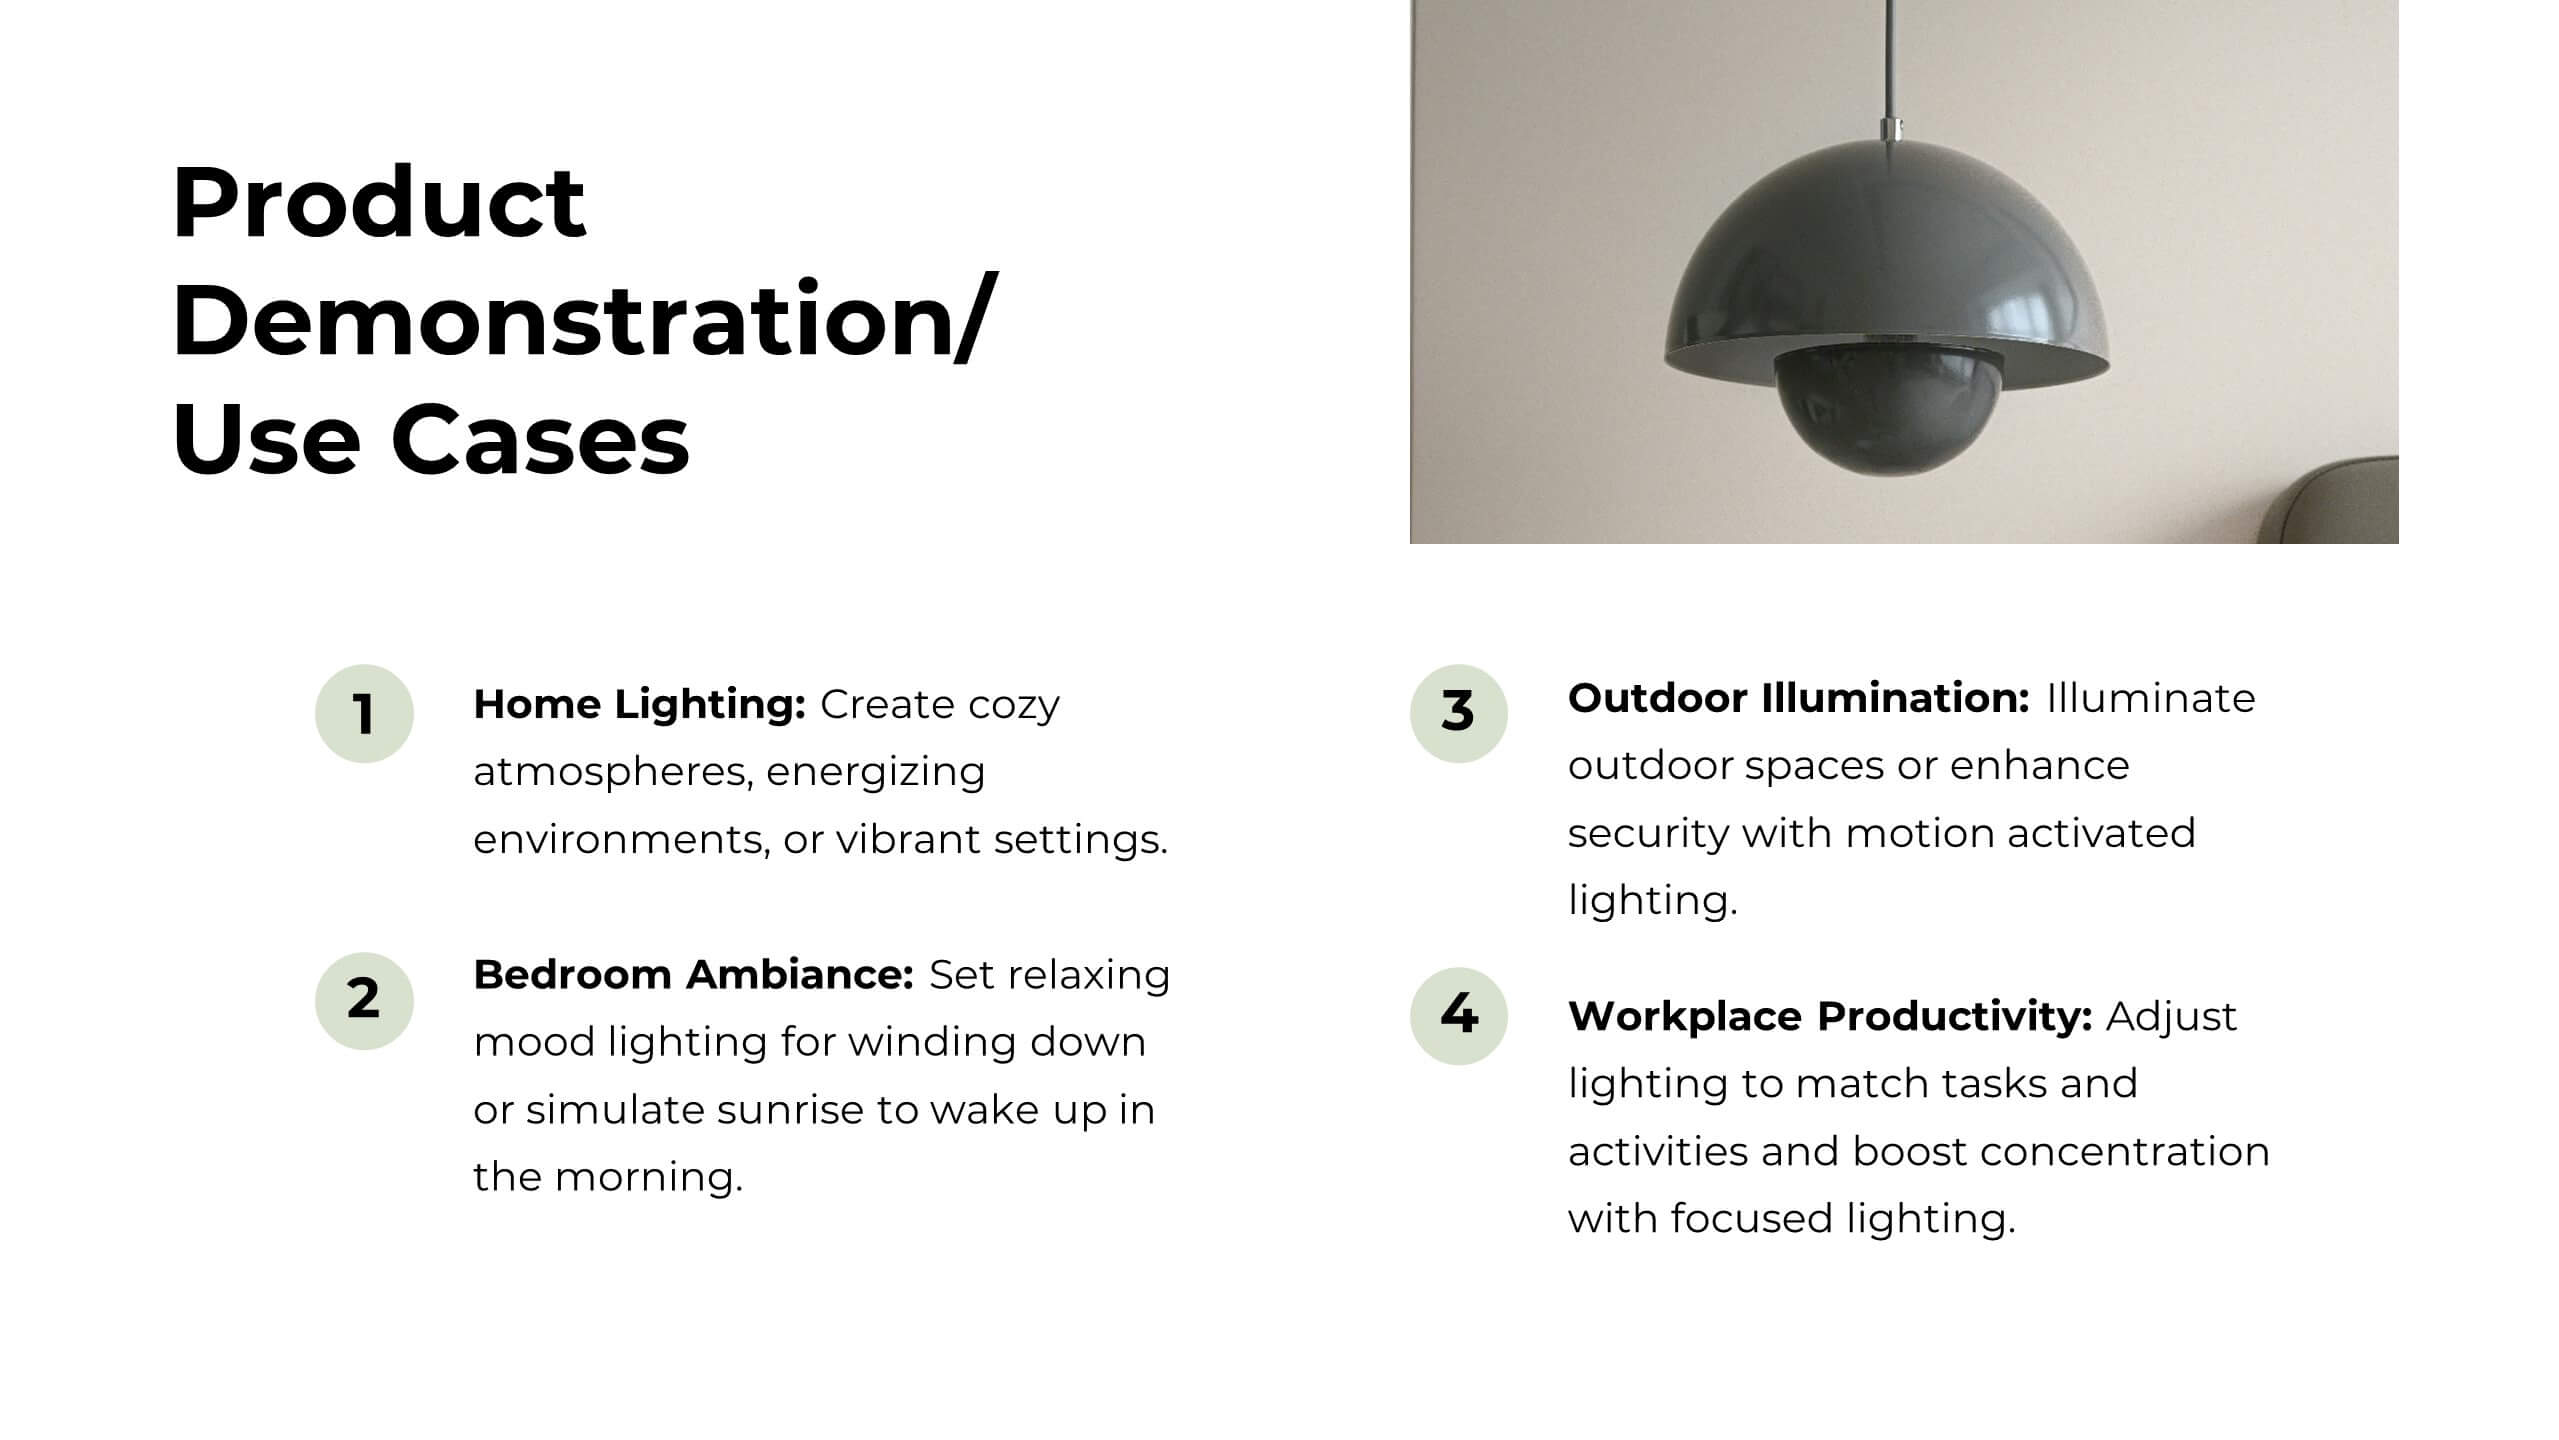


Features
- 20 Unique Slides
- Fully editable and easy to edit in Microsoft Powerpoint, Keynote and Google Slides
- 16:9 widescreen layout
- Clean and professional designs
- Export to JPG, PDF or send by email


Do you have any questions?
Recommend


6 slides
Executive Leadership Training Presentation
Enhance professional development with this executive leadership training template, designed with a step-by-step staircase layout symbolizing career progression. Perfect for leadership programs, corporate training, and skill-building workshops, it visually organizes six key topics for clarity. Fully editable in Canva, PowerPoint, or Google Slides, making customization effortless for any organization’s needs.


6 slides
RAPID Roles and Responsibilities Slide Presentation
Make teamwork crystal clear with a structured chart that defines who does what and when. This organized layout helps map decision-making roles, streamline collaboration, and prevent confusion in complex projects. Easy to edit and ready to use, it’s fully compatible with PowerPoint, Keynote, and Google Slides for smooth customization.


6 slides
Customer Empathy Mapping Presentation
Step into your audience’s world with a visual layout that brings their thoughts, feelings, and motivations into focus. This presentation helps teams understand customer needs more clearly, creating stronger products and experiences through structured empathy insights. Fully compatible with PowerPoint, Keynote, and Google Slides.


6 slides
Sales Strategy 30-60-90 Day Plan Presentation
Drive sales success with this structured 30-60-90 day strategy template! Designed to help sales teams and professionals set clear objectives, track progress, and optimize performance, this layout ensures a smooth transition from planning to execution. Fully customizable and compatible with PowerPoint, Keynote, and Google Slides for seamless presentations.


6 slides
Internal Communication Framework Presentation
Foster stronger collaboration with this visual internal communication framework template. Ideal for showcasing how information flows within departments, this layout helps clarify messaging channels, responsibilities, and feedback loops. Whether you're streamlining communication strategies or presenting team structures, it’s fully editable and works seamlessly with PowerPoint, Keynote, and Google Slides.


26 slides
Orion Creative Agency Pitch Deck Presentation
The Orion Creative Agency Portfolio is a visually stunning and comprehensive presentation template designed to showcase your agency's unique strengths and achievements. The first slide sets the tone with a clean and modern design, perfect for capturing your audience's attention. Following the introduction, the template takes you through an impressive journey of client success stories, highlighting the impact and value your agency brings to the table. The industry trend analysis and competitive landscape sections offer a deep dive into the market, positioning your agency as a leader in the field. You'll also find dedicated slides for your approach, creative process, and campaign execution, ensuring every detail of your agency's methodology is presented clearly. Testimonials and partnership opportunities add credibility, while the future outlook and social impact initiatives highlight your agency's forward-thinking and commitment to positive change. This template is fully compatible with PowerPoint, Keynote, and Google Slides, making it an ideal choice for any agency presentation.


25 slides
Keystone Market Research Presentation
Present your market research with confidence using this stylish, contemporary template. Perfect for detailing research objectives, data collection, and key findings, it features a sleek design with vibrant colors. Highlight critical aspects like market trends, results interpretation, and recommendations to captivate your audience. Compatible with PowerPoint, Keynote, and Google Slides, it ensures seamless presentations on any platform.


4 slides
Risk Assessments Matrix Presentation
Bring clarity to complex decisions with this bold, color-coded layout designed to pinpoint threats, compare impact levels, and communicate risks with confidence. This presentation makes evaluation simple, structured, and visually clear for any audience. Fully editable and ready for professional use. Compatible with PowerPoint, Keynote, and Google Slides.


4 slides
Employee Performance Feedback
Showcase progress clearly with this Employee Performance Feedback presentation. Featuring skill-based metrics, productivity scores, and analysis ratings, this layout uses visual data bars to evaluate team performance at a glance. Perfect for HR reviews, team assessments, or quarterly check-ins. Fully editable in PowerPoint, Keynote, and Google Slides.


5 slides
Employee Training Roadmap Presentation
Take your team on a visual journey that maps out success, one milestone at a time. This roadmap presentation is perfect for outlining employee training stages in a clear, engaging way. Each point leads naturally to the next. Fully editable and compatible with PowerPoint, Keynote, and Google Slides for seamless use.


23 slides
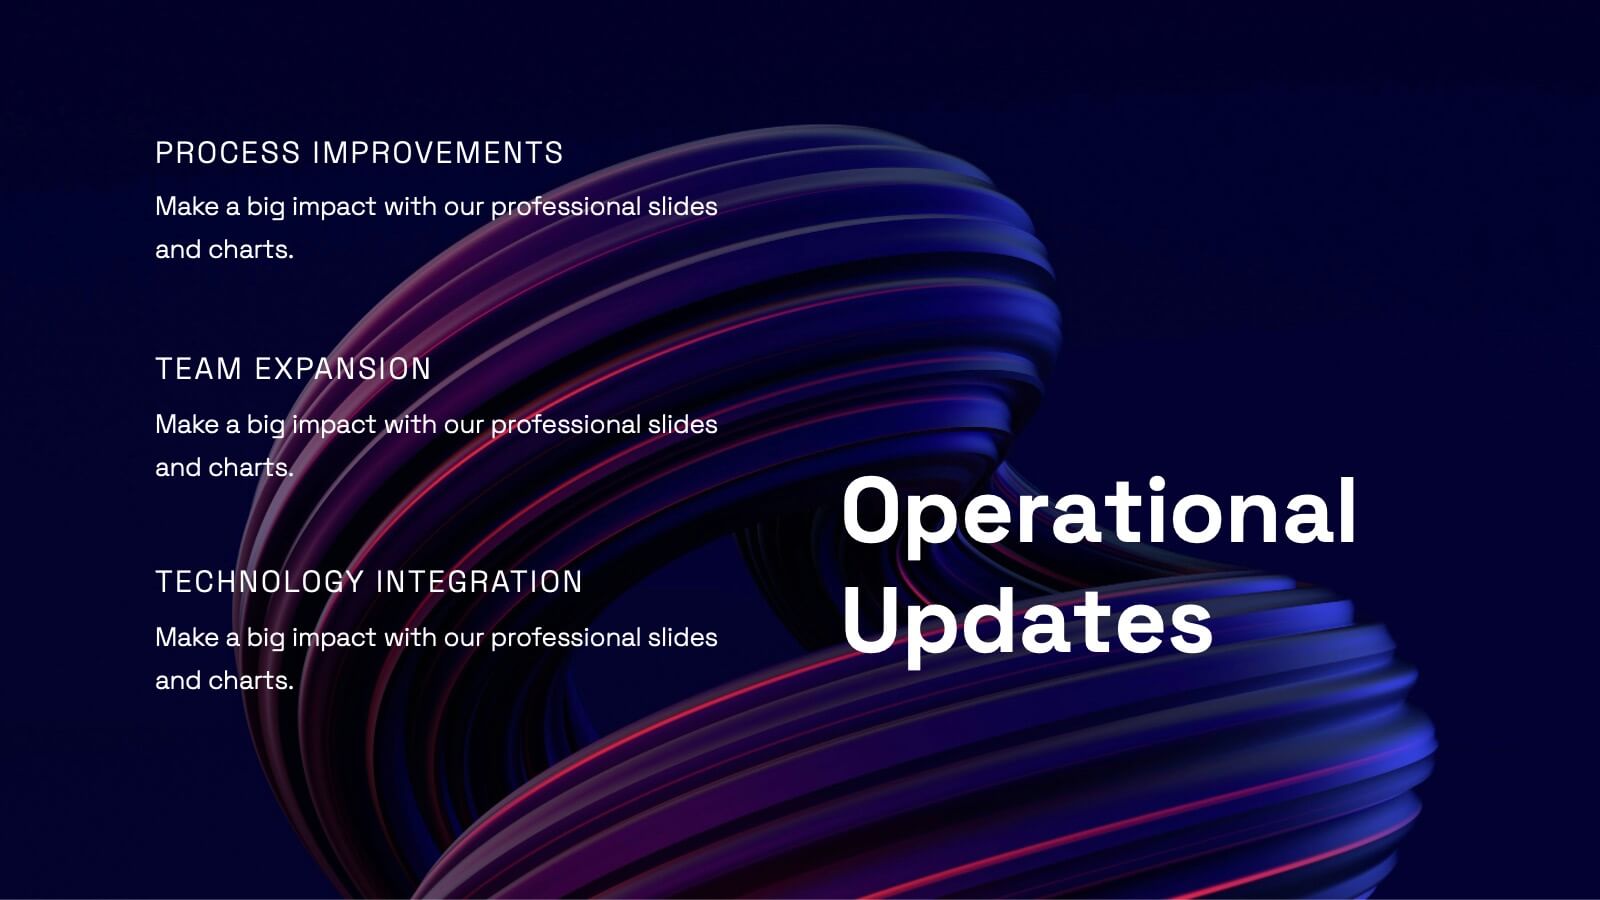
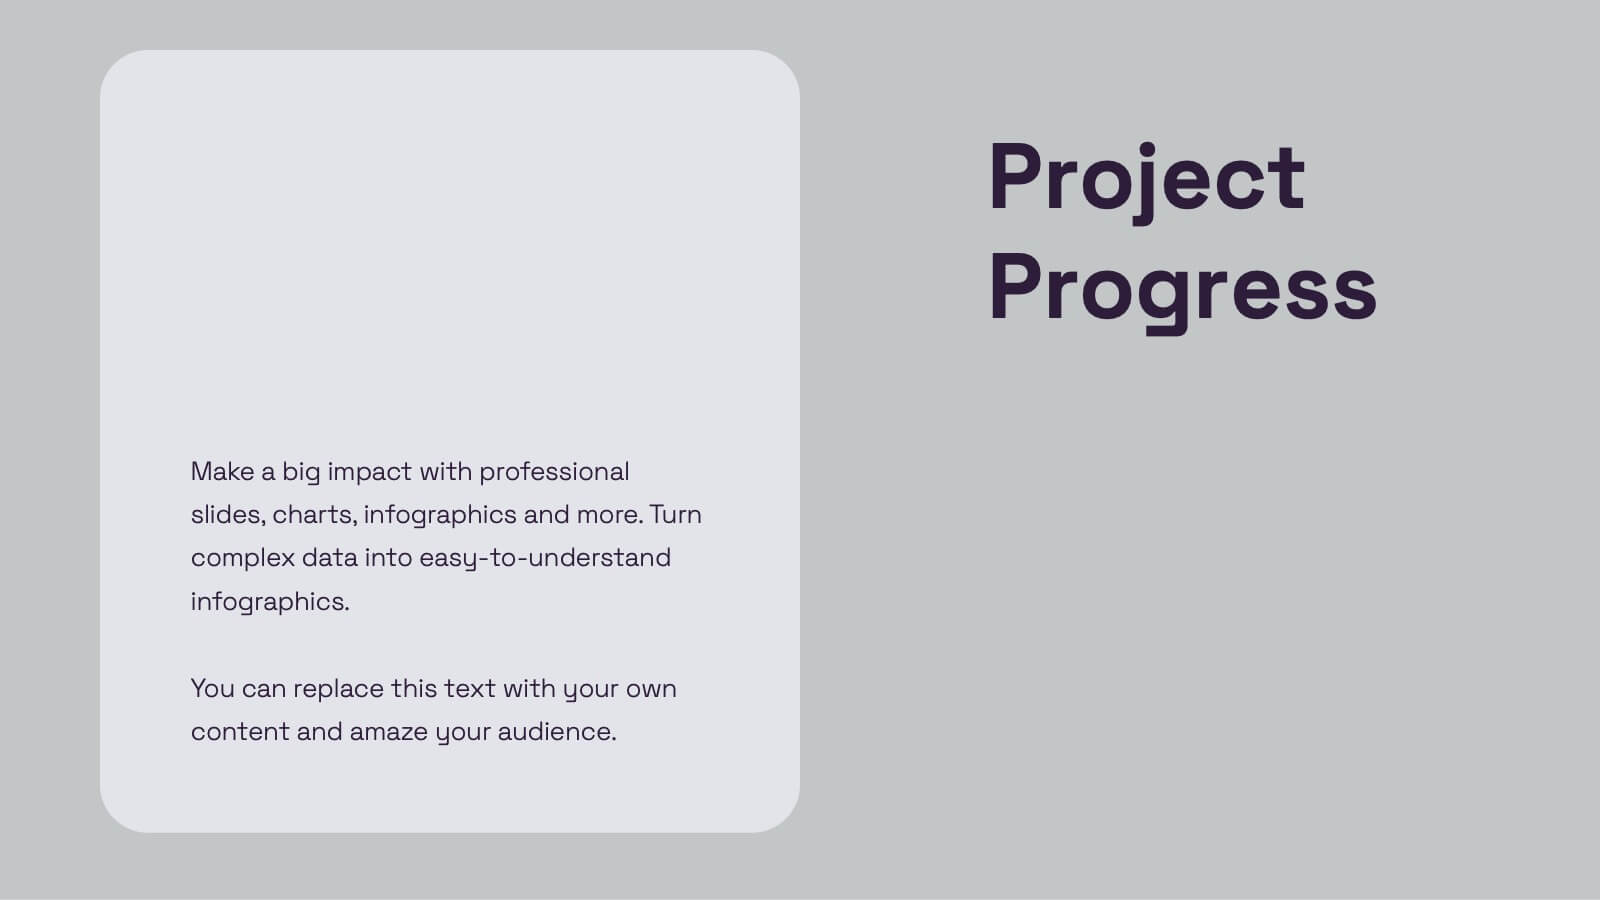
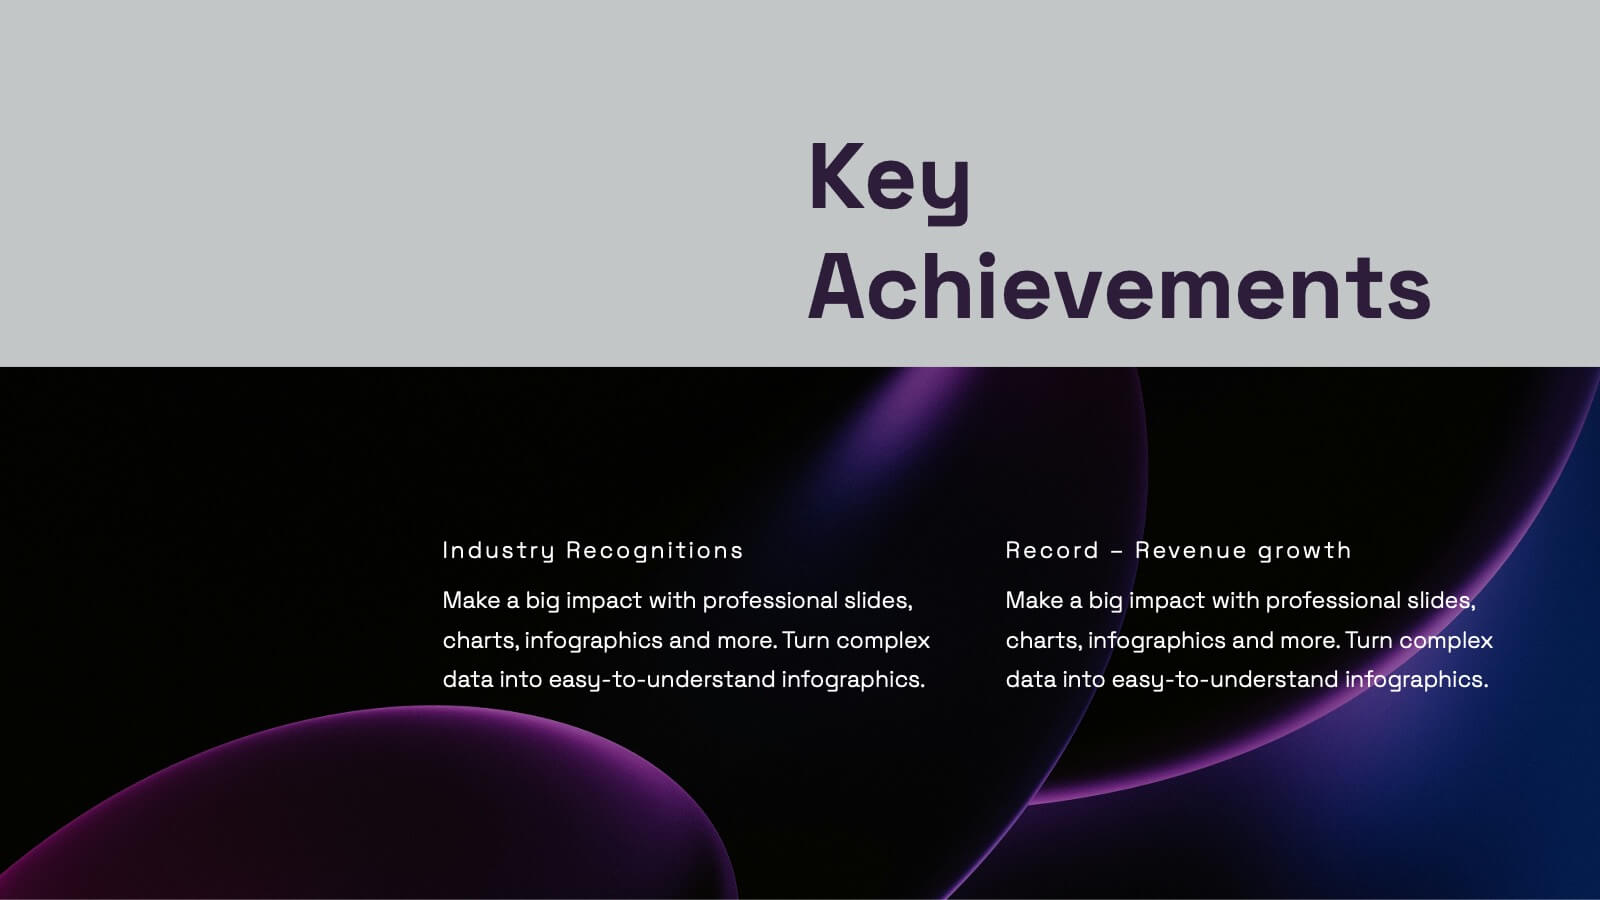
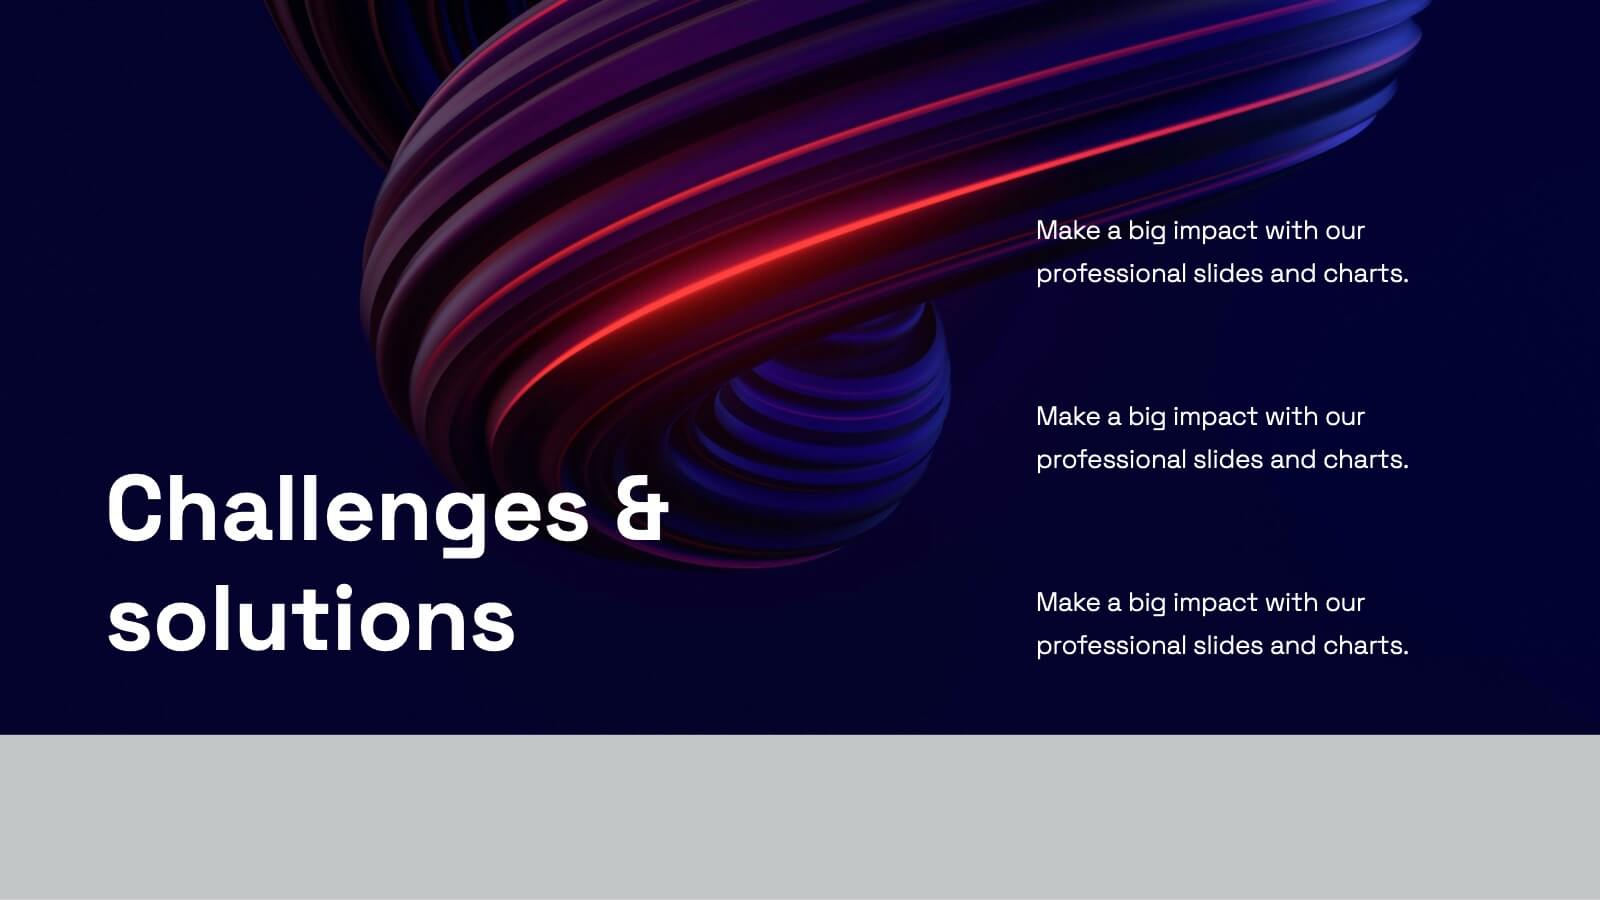
Supernova Business Plan Presentation
The Supernova Business Presentation template is a sleek, professional tool designed to elevate your corporate presentations. With a dark-themed aesthetic, it exudes sophistication and modernity, making it perfect for business meetings, project updates, and strategy sessions. The template covers essential aspects like team updates, key achievements, collaboration opportunities, performance metrics, and more, allowing you to deliver a comprehensive overview of your business operations. It's also ideal for discussing upcoming events, departmental goals, and company policies, providing a structured and impactful way to communicate with your team or stakeholders. The template is fully compatible with PowerPoint, Keynote, and Google Slides, ensuring easy customization and a seamless presentation experience across different platforms. Use the Supernova Business Presentation template to make a powerful impression with your next business presentation.


20 slides
Aurumix Agency Portfolio Presentation
Make a lasting impression with this bold and creative agency portfolio presentation. Designed to showcase your services, case studies, client success stories, and campaign strategies, this template helps highlight your agency’s expertise with confidence. Fully customizable and compatible with PowerPoint, Keynote, and Google Slides for a seamless, professional presentation experience.


21 slides
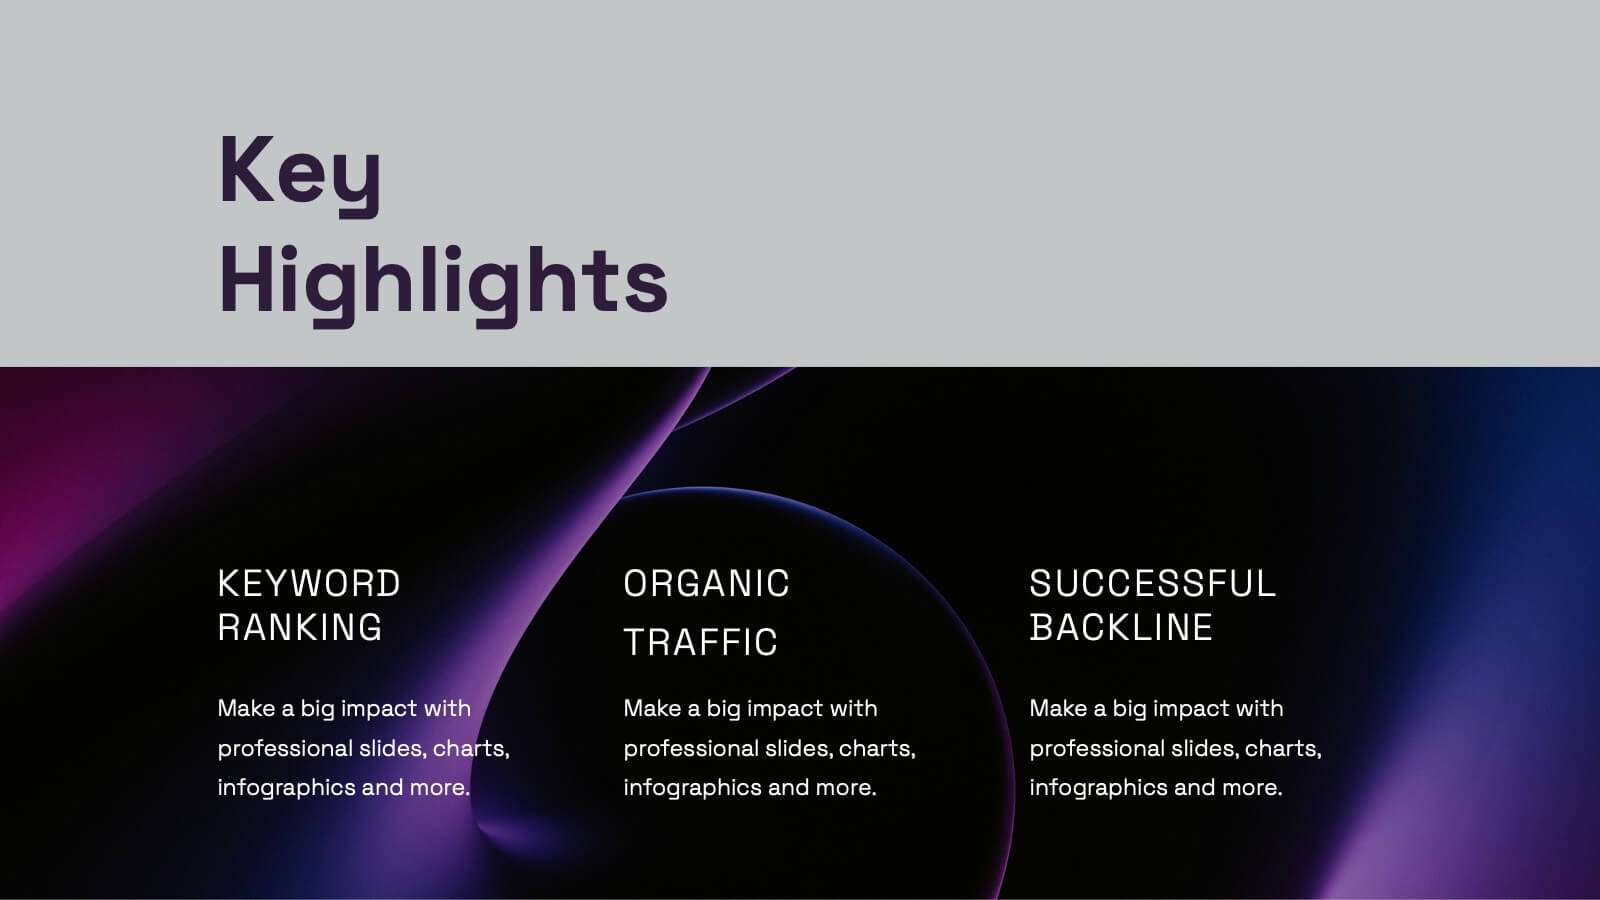
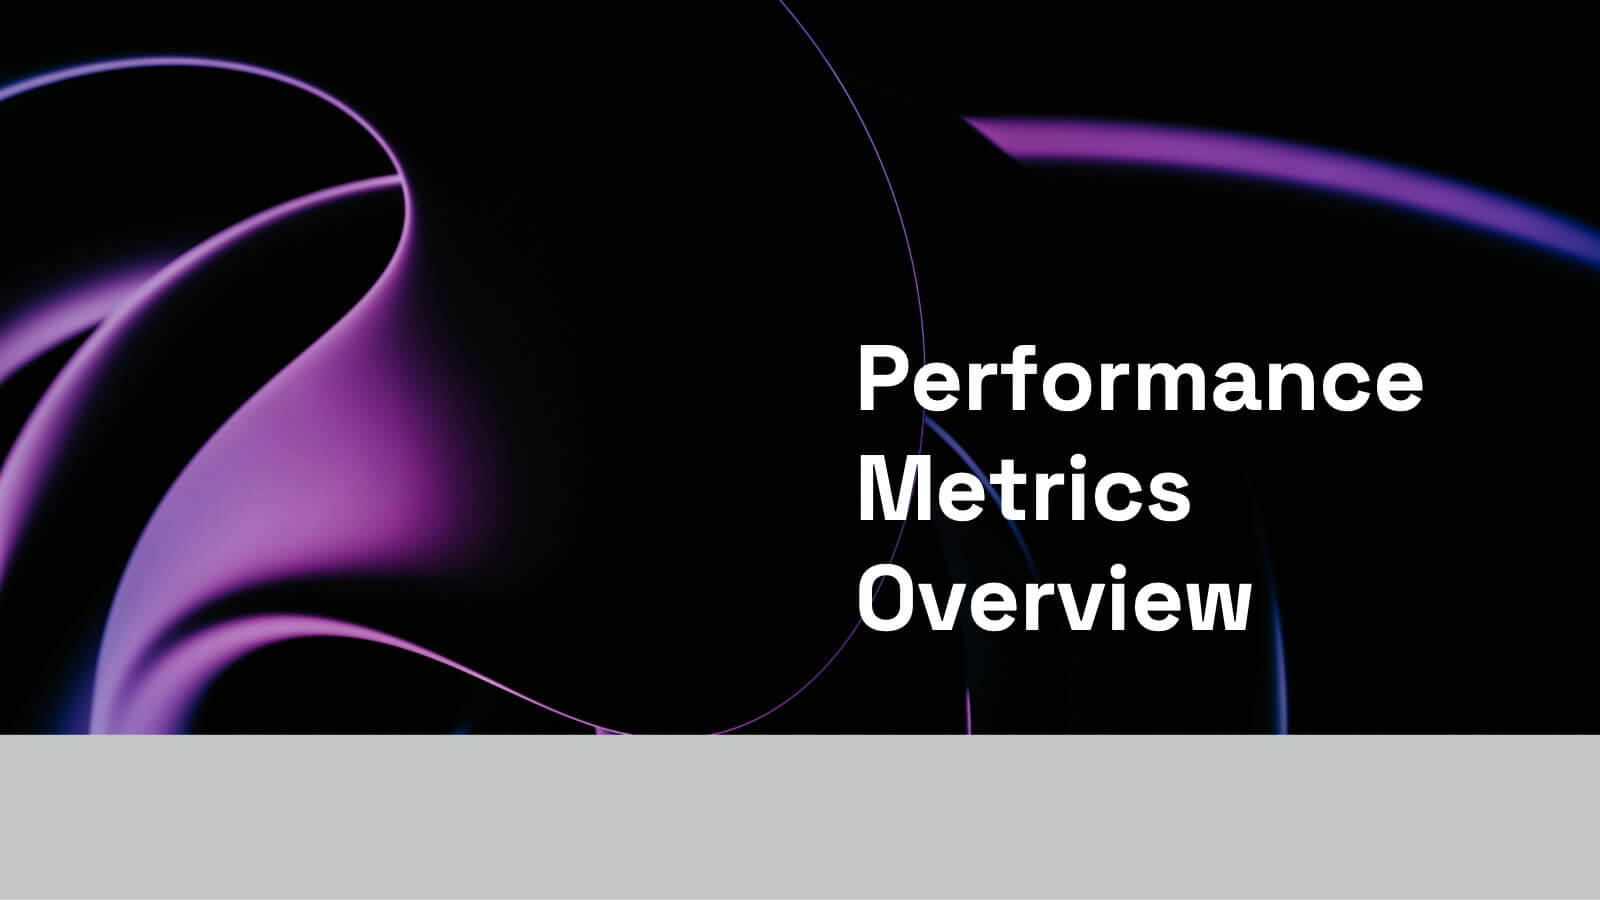
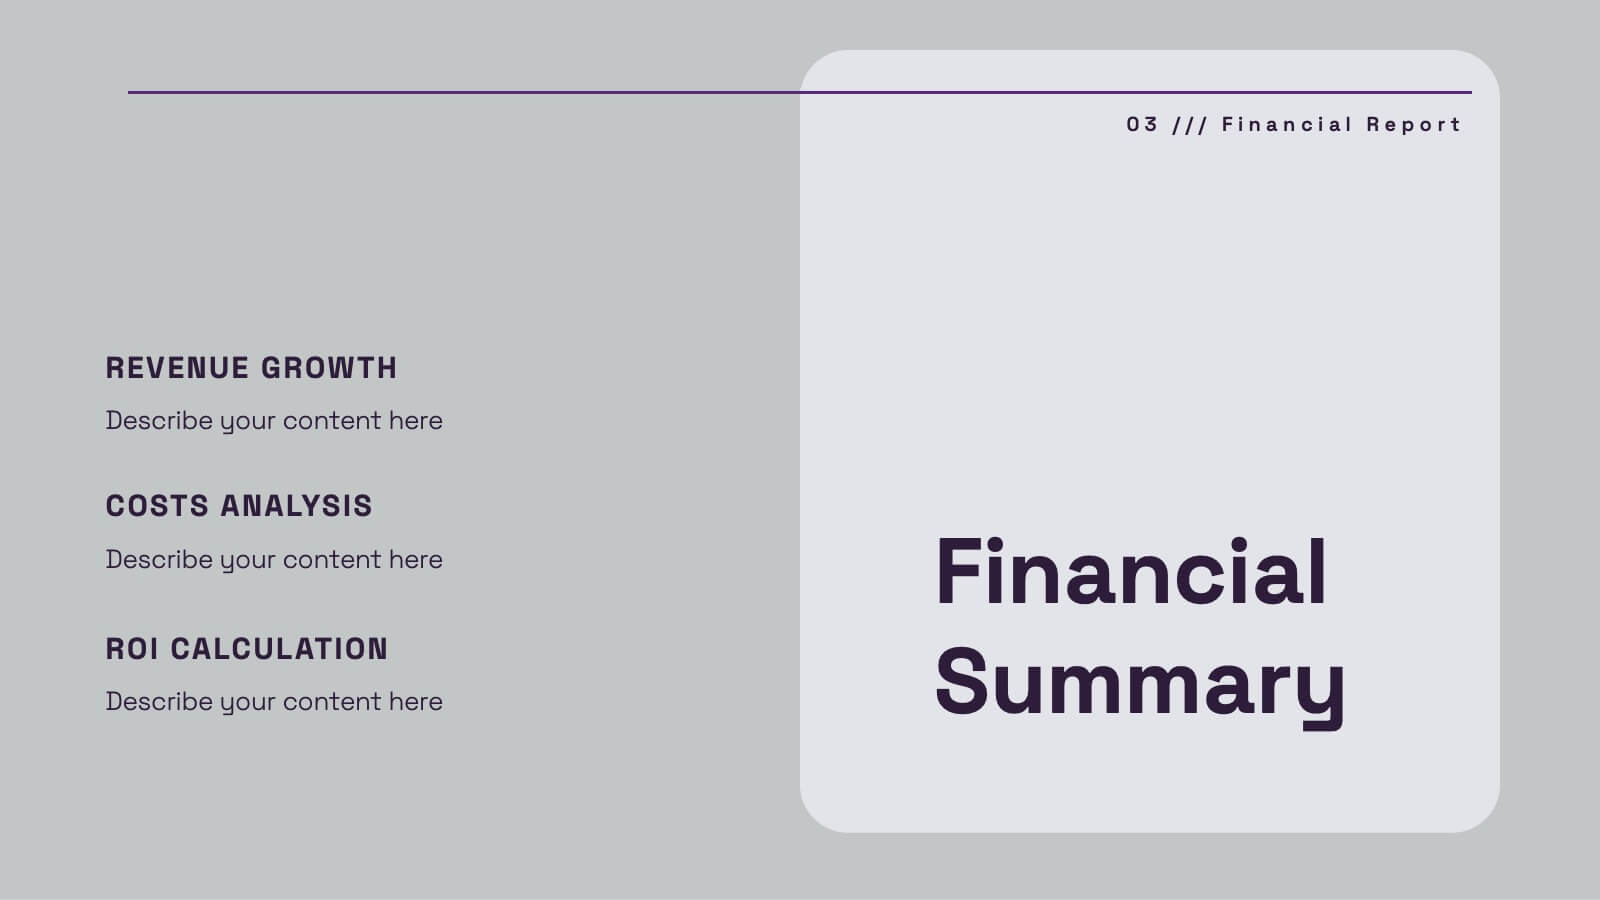
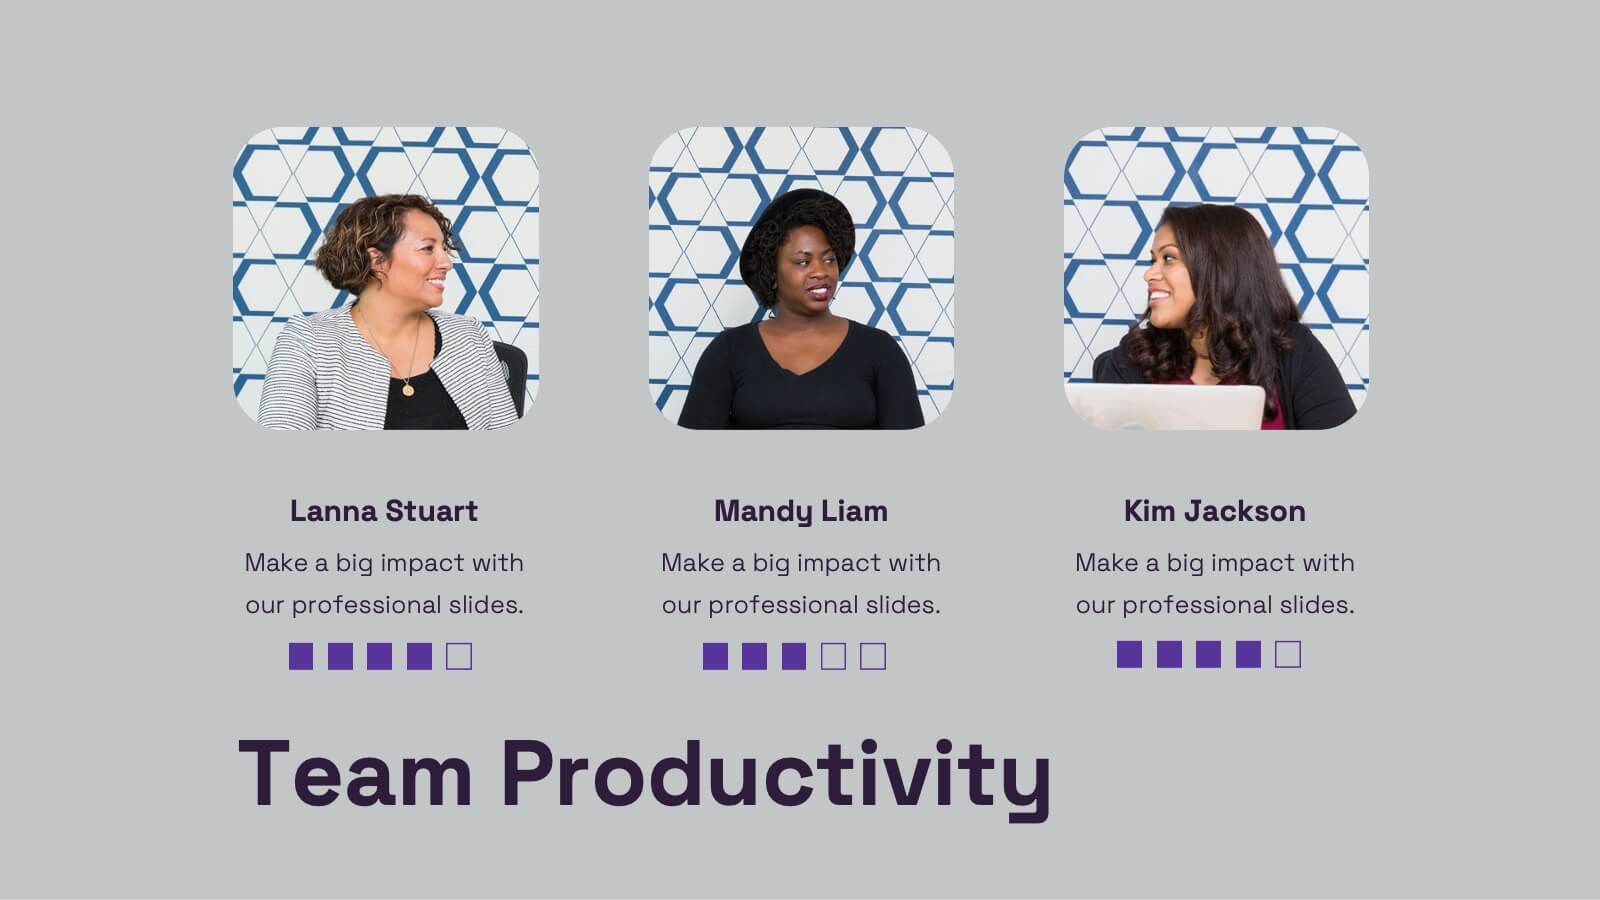
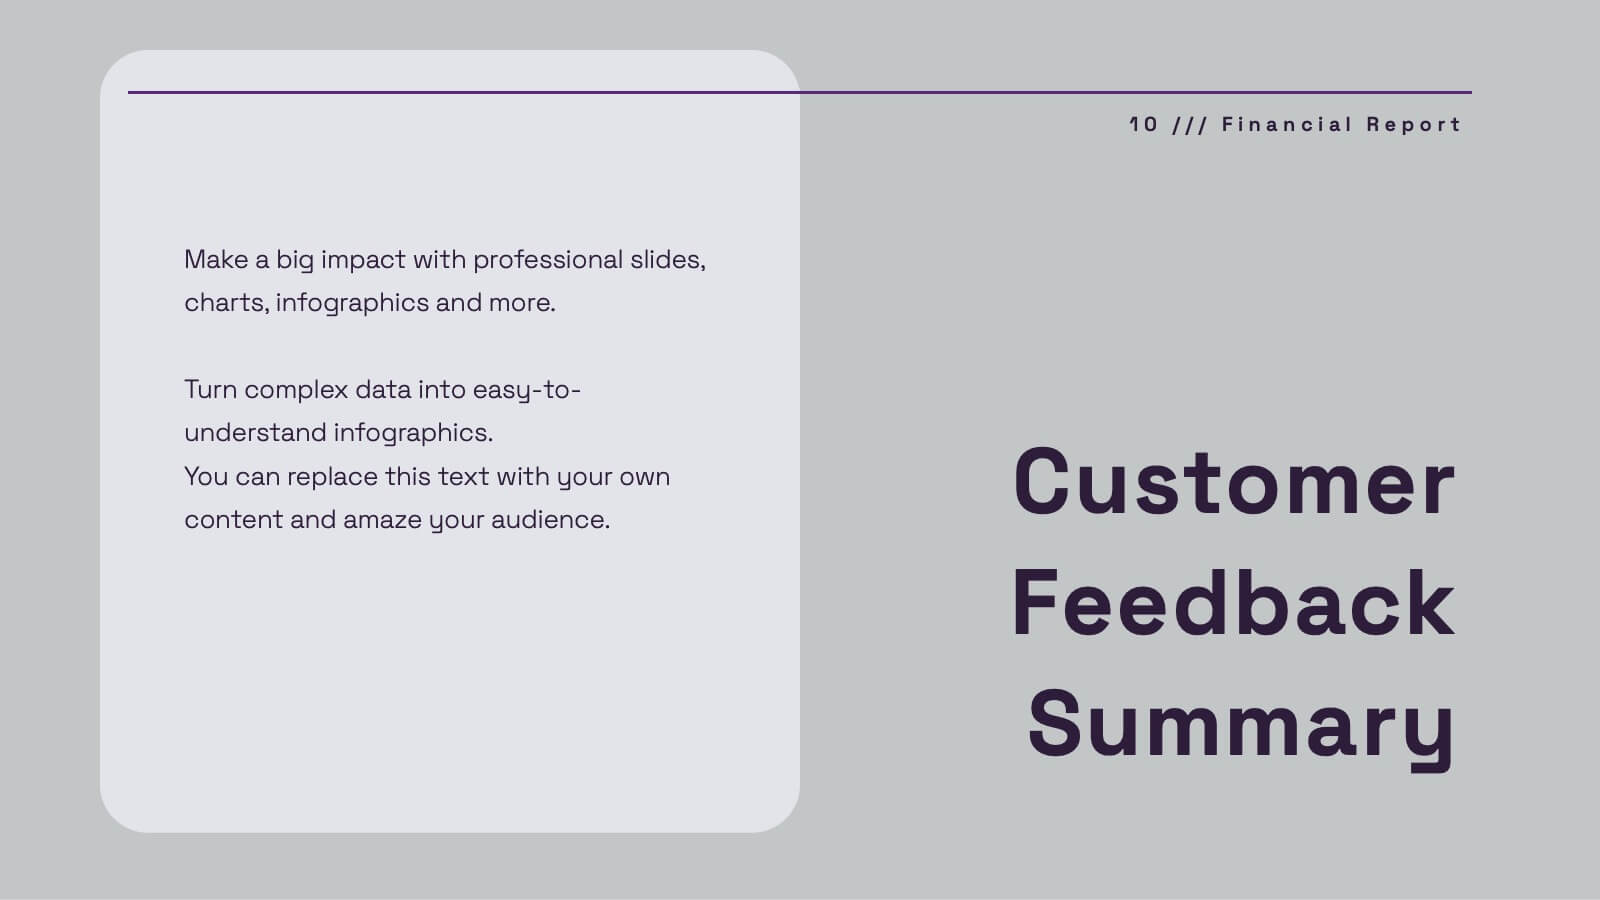
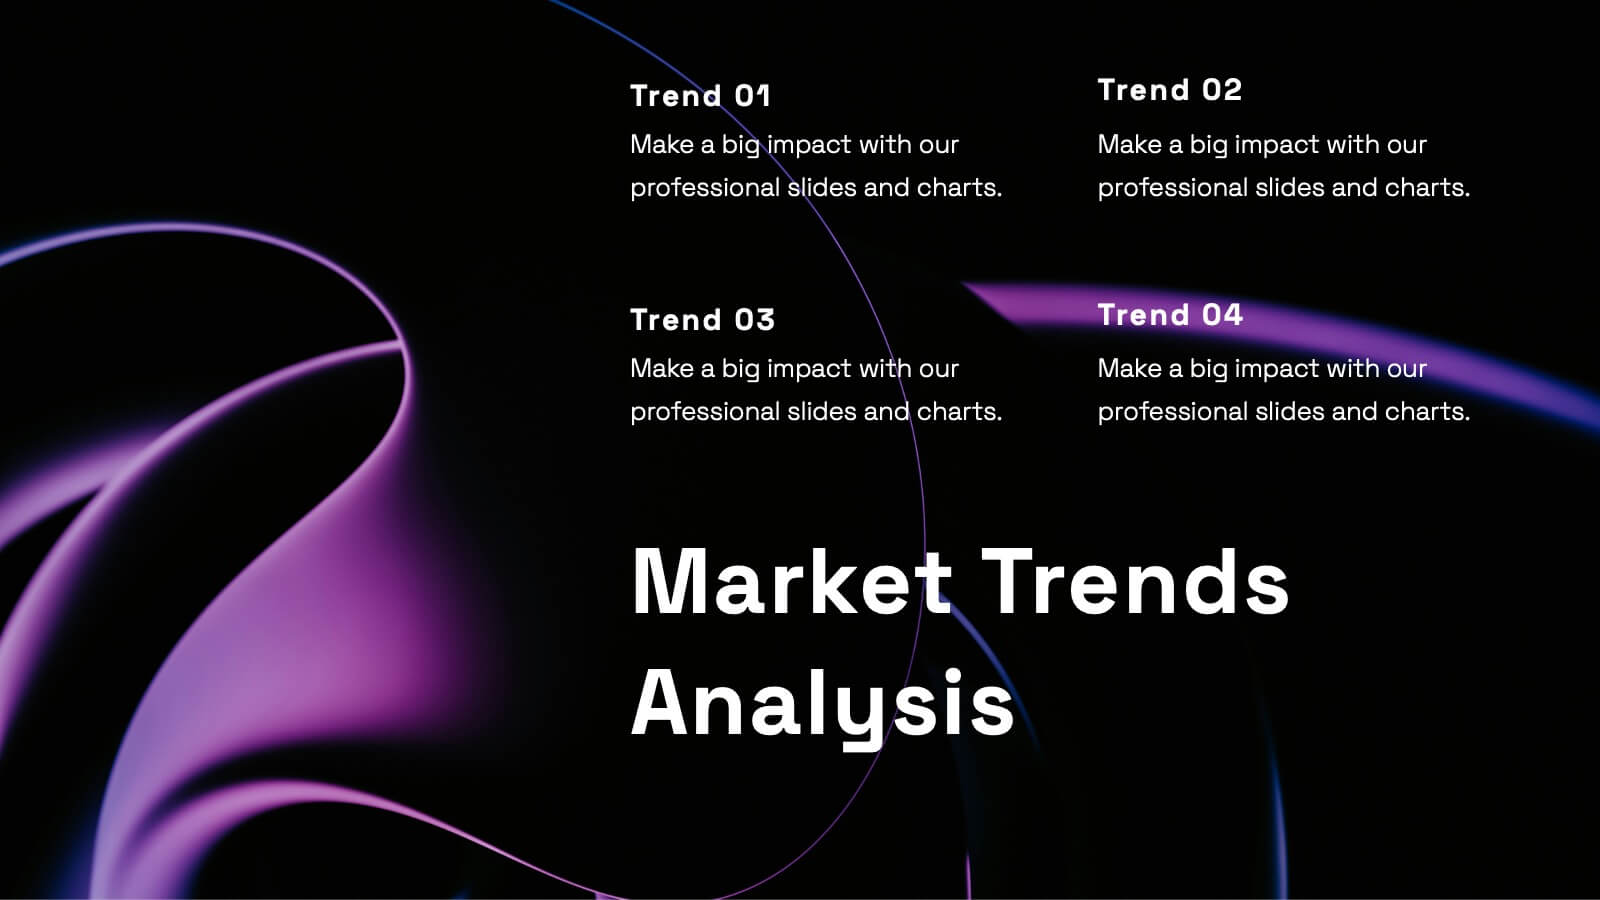
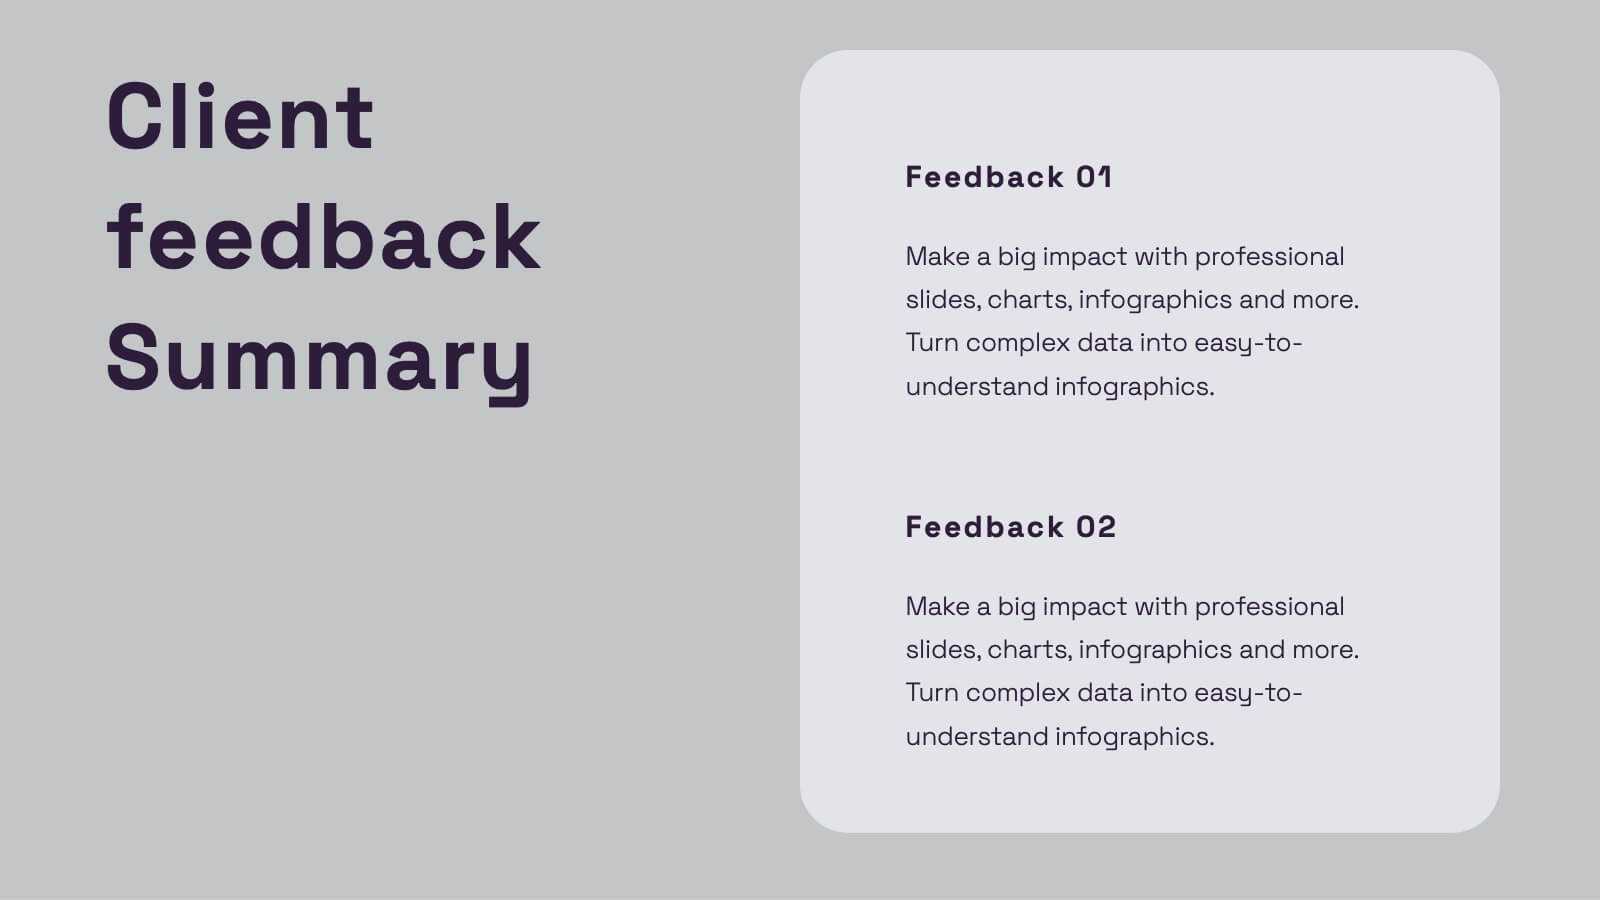
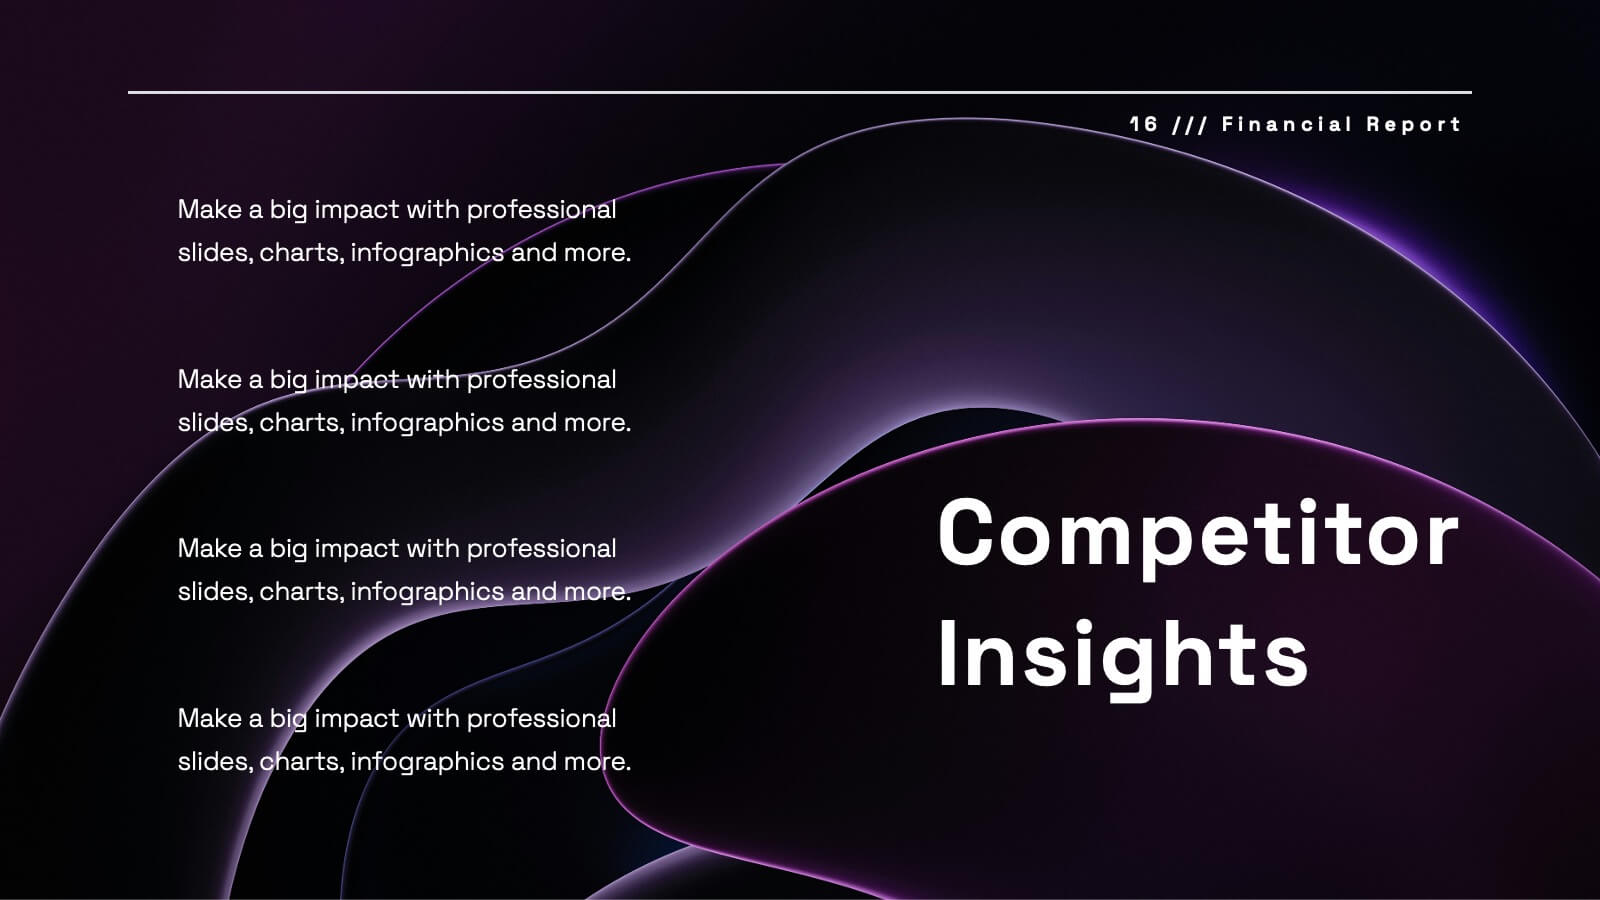
Uplift Financial Report Presentation
Present your financial or business report with this sleek and modern presentation template! It includes essential sections such as performance metrics, financial summaries, project progress, and market trends analysis, ensuring a comprehensive overview. Whether you're discussing key achievements or competitor insights, this template is perfect for delivering a professional and polished report. Compatible with PowerPoint, Keynote, and Google Slides for easy use and customization.


6 slides
Team Leadership and Management
Foster stronger collaboration with this team-focused circular diagram. Designed to showcase six key areas of team leadership, this template is perfect for outlining communication, goal-setting, delegation, performance, feedback, and development strategies. Ideal for managers, trainers, and HR professionals. Fully customizable in PowerPoint, Keynote, and Google Slides.


7 slides
Sports Training Camp Schedule Deck Presentation
Plan and present weekly training programs with this Sports Training Camp Schedule Deck. Featuring a clean, color-coded layout for Monday to Saturday, this slide helps coaches organize sessions clearly. Ideal for team meetings, camp planning, or fitness schedules. Fully editable in PowerPoint, Keynote, and Google Slides for easy customization.


22 slides
Eclipser Qualitative Research Findings Presentation
This Qualitative Research Findings Presentation is designed to effectively showcase research insights with a clean and modern layout. It covers key areas such as research objectives, methodology, data analysis, findings, and recommendations. Fully customizable and compatible with PowerPoint, Keynote, and Google Slides for seamless editing and professional results.


4 slides
Strategic Business Plan Presentation
Bring your long-term vision to life with a clean, modern presentation that turns complex planning into an easy-to-follow growth path. This layout helps you explain goals, strategies, and key steps with clarity and confidence. Fully editable and compatible with PowerPoint, Keynote, and Google Slides.