


Features
- 4 Unique slides
- Fully editable and easy to edit in Microsoft Powerpoint, Keynote and Google Slides
- 16:9 widescreen layout
- Clean and professional designs
- Export to JPG, PDF or send by email


Do you have any questions?
Recommend


4 slides
Interactive Data Dashboard Display Presentation
Present data with clarity using this Interactive Data Dashboard Display presentation. Designed to showcase multiple metrics at once, it includes pie charts, donut charts, bubble graphs, and bar comparisons. Ideal for business reports, marketing insights, or performance reviews. Fully editable in Canva, PowerPoint, and Google Slides for flexible customization.


5 slides
IT Support and Systems Presentation
Streamline your tech communication with a clean, structured layout that highlights your IT services, support processes, and system workflows. Perfect for teams presenting solutions, infrastructure overviews, or technical strategies, this presentation brings clarity to complex topics. Fully compatible with PowerPoint, Keynote, and Google Slides for effortless editing and delivery.


6 slides
Puzzle Project Infographic
A puzzle infographic is a visual representation that combines the elements of a puzzle with informational content. This infographic template uses puzzle pieces or puzzle-related design elements to convey different sections or components of information. Each puzzle piece represents a specific section or element of the information being presented. The puzzle pieces act as sequential elements, guiding your viewer through the information in a logical and engaging manner. This infographic is visually appealing and use colors, illustrations, icons, and other design elements to enhance the overall presentation.


4 slides
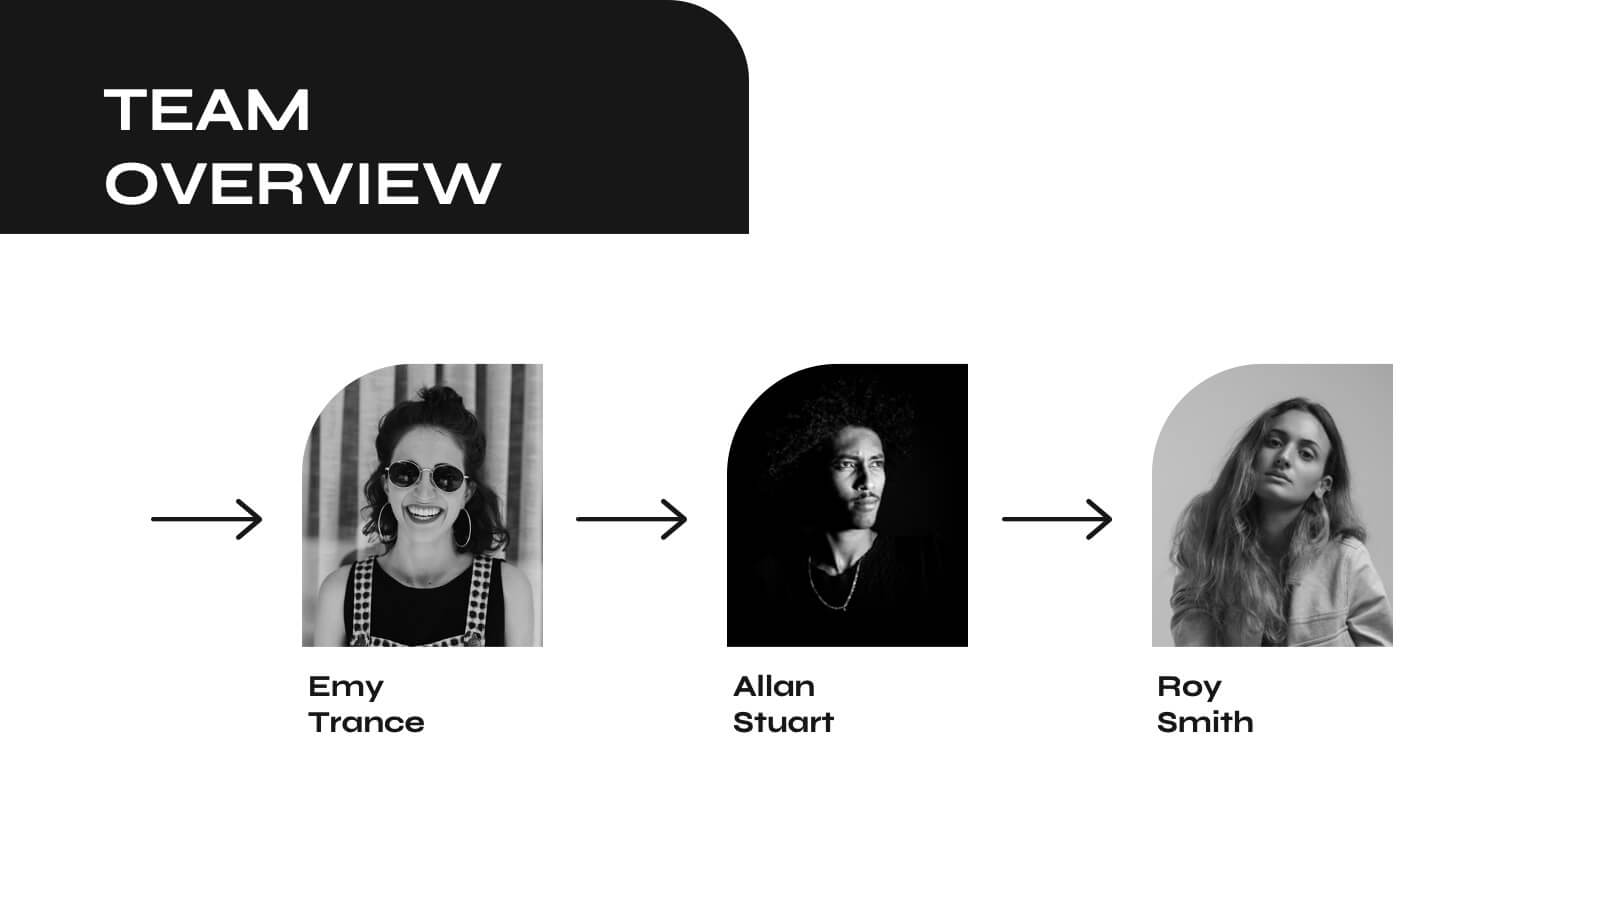
Workplace Collaboration and Team Scenes Presentation
Bring your teamwork story to life with this vibrant, arrow-based layout that guides the viewer through four clear steps. Perfect for visualizing collaboration strategies, team roles, or task flow, this template balances clean design with helpful icons. Easily customize it in PowerPoint, Keynote, or Google Slides for a polished presentation.


6 slides
WFH Tools and Productivity Tips
Level up your work-from-home game with this modern visual wheel that breaks down essential tools and actionable tips to boost productivity. Perfect for remote teams, solo entrepreneurs, or virtual training sessions, this layout keeps key info easy to digest and visually engaging. Fully compatible with PowerPoint, Keynote, and Google Slides.


6 slides
Medical Technologies Infographics
Explore the forefront of medical technology with this informative and sleek infographic template, tailored for professionals and students in the medical field. This template effectively presents key advancements and projects in medical technology, using a modern and clear design that is easy to follow. The slides are organized to detail different aspects of technology in healthcare, such as innovation in patient care, technological integration into existing systems, and future trends in the industry. Each section uses vibrant graphics and concise text to highlight important data and statistics, ensuring the information is both accessible and engaging. The color scheme is professionally chosen to represent trust and clarity, utilizing shades of blue and red to differentiate topics effectively. This not only enhances readability but also aligns with the themes of healthcare and technology. This template is a perfect tool for presenting at conferences, in educational settings, or during professional meetings where understanding the impact of technology on healthcare is crucial. It helps to convey complex information in a structured and visually appealing manner, making it an invaluable resource for anyone involved in the health technology sector.


6 slides
Personal Productivity Time Management Techniques Presentation
Streamline your workflow with the Personal Productivity Time Management Techniques presentation slide. Featuring a step-by-step staircase layout, this template visually maps out five core techniques or habits leading to improved efficiency and goal achievement. Each step includes an icon and placeholder text for easy customization. Ideal for productivity coaches, corporate trainers, or time management workshops. Fully editable in PowerPoint, Keynote, and Google Slides.


8 slides
Geographic Heat Map Analysis Presentation
Bring your data to life with a vibrant map that instantly reveals regional patterns and performance differences. Ideal for presenting location-based insights, sales metrics, or demographic trends, this presentation combines clarity with visual impact. Fully compatible with PowerPoint, Keynote, and Google Slides for easy editing and professional results.


6 slides
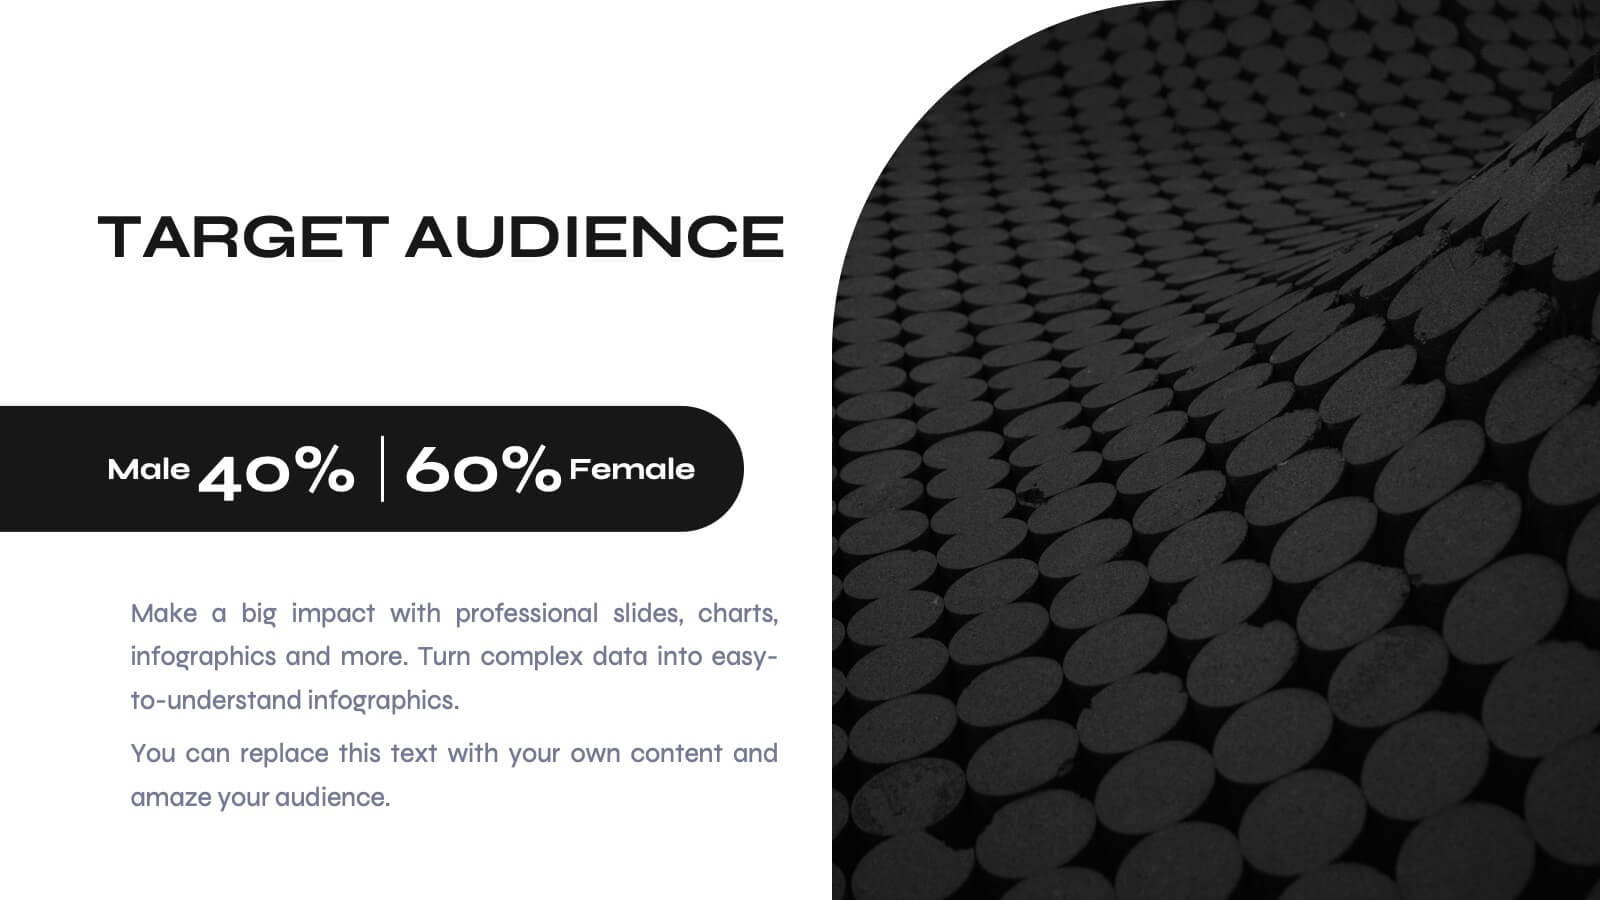
Demographic Data Analysis
Visualize key population insights with this Demographic Data Analysis slide, designed as a segmented pie chart with icon-based representation. Perfect for showcasing audience breakdowns, customer profiles, or survey results across five demographic categories. Fully editable in PowerPoint, Keynote, and Google Slides.


6 slides
Startup Unicorn Infographic
A "startup slide" usually refers to a slide within a presentation, often a pitch deck, that introduces and provides key information about a startup company. The purpose of this Startup Slide Infographic is to deliver a concise overview of the startup's value proposition and key information. Capturing the audience's attention and conveying essential details about the startup's mission and market opportunity. This can be used in presentations or marketing materials. This infographic design is clean, visually engaging, and easy to understand at a glance. Fully customizable and compatible with Powerpoint, Keynote, and Google Slides.
21 slides
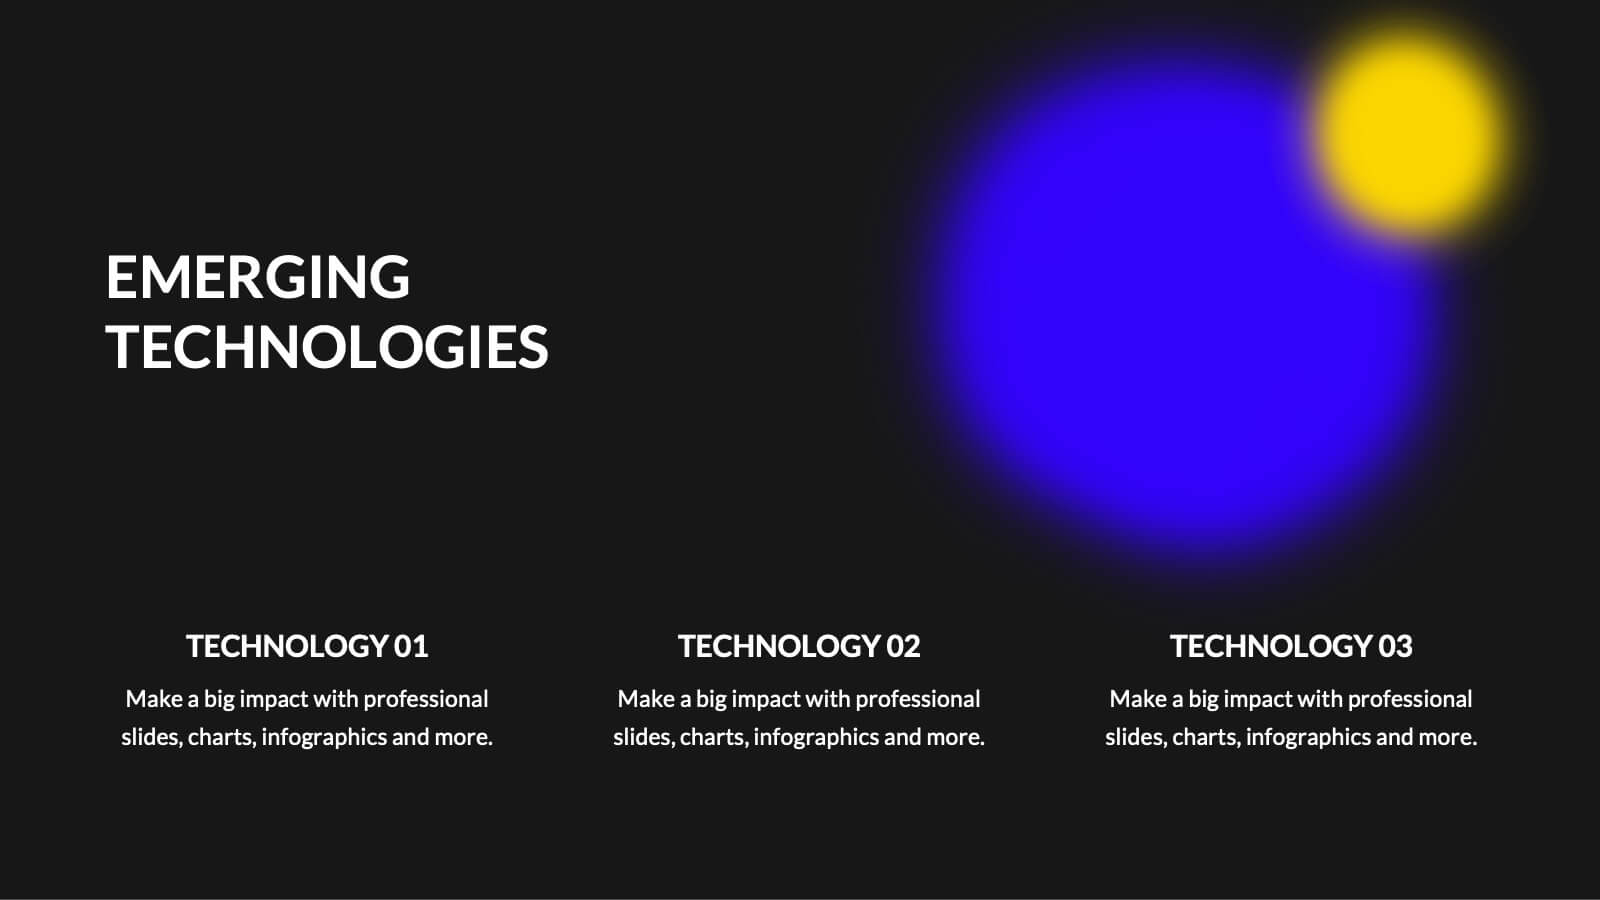
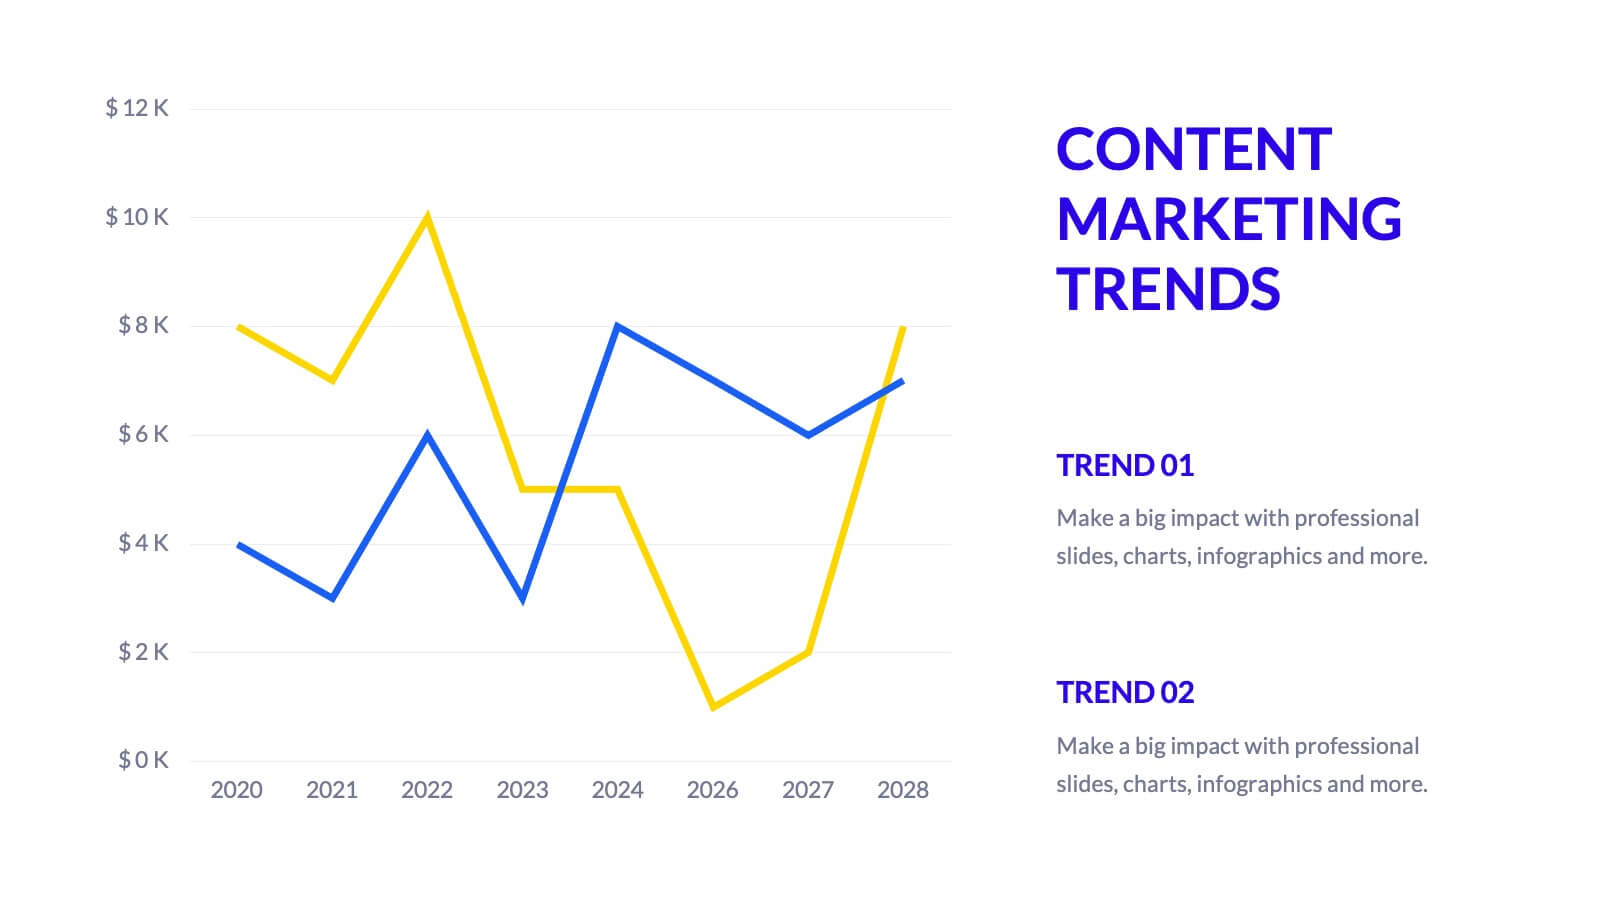
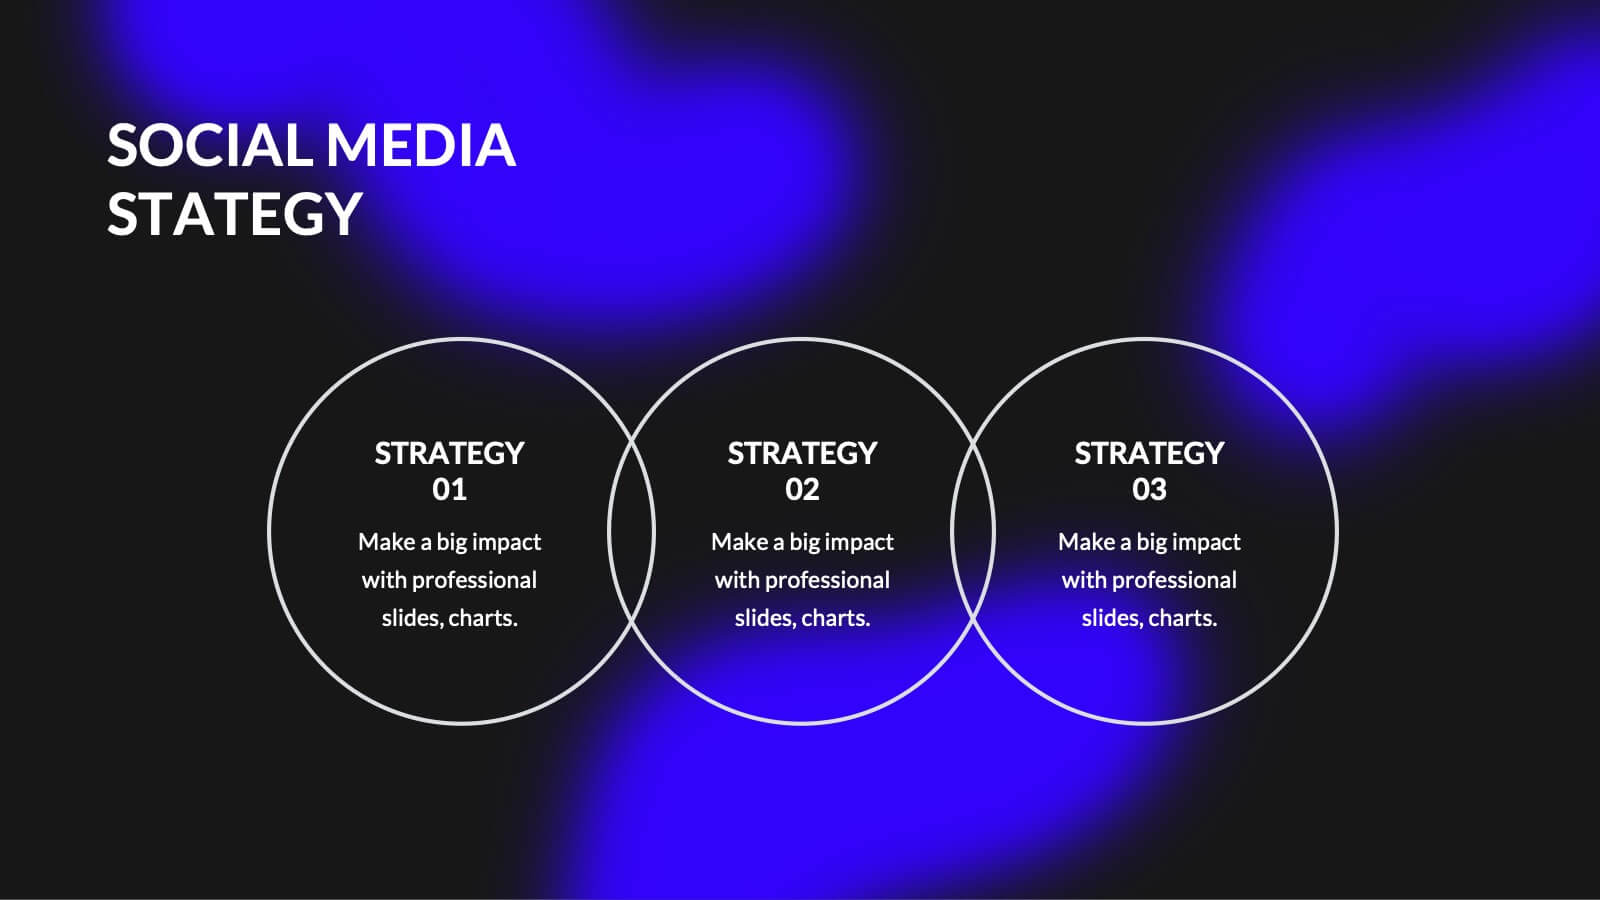
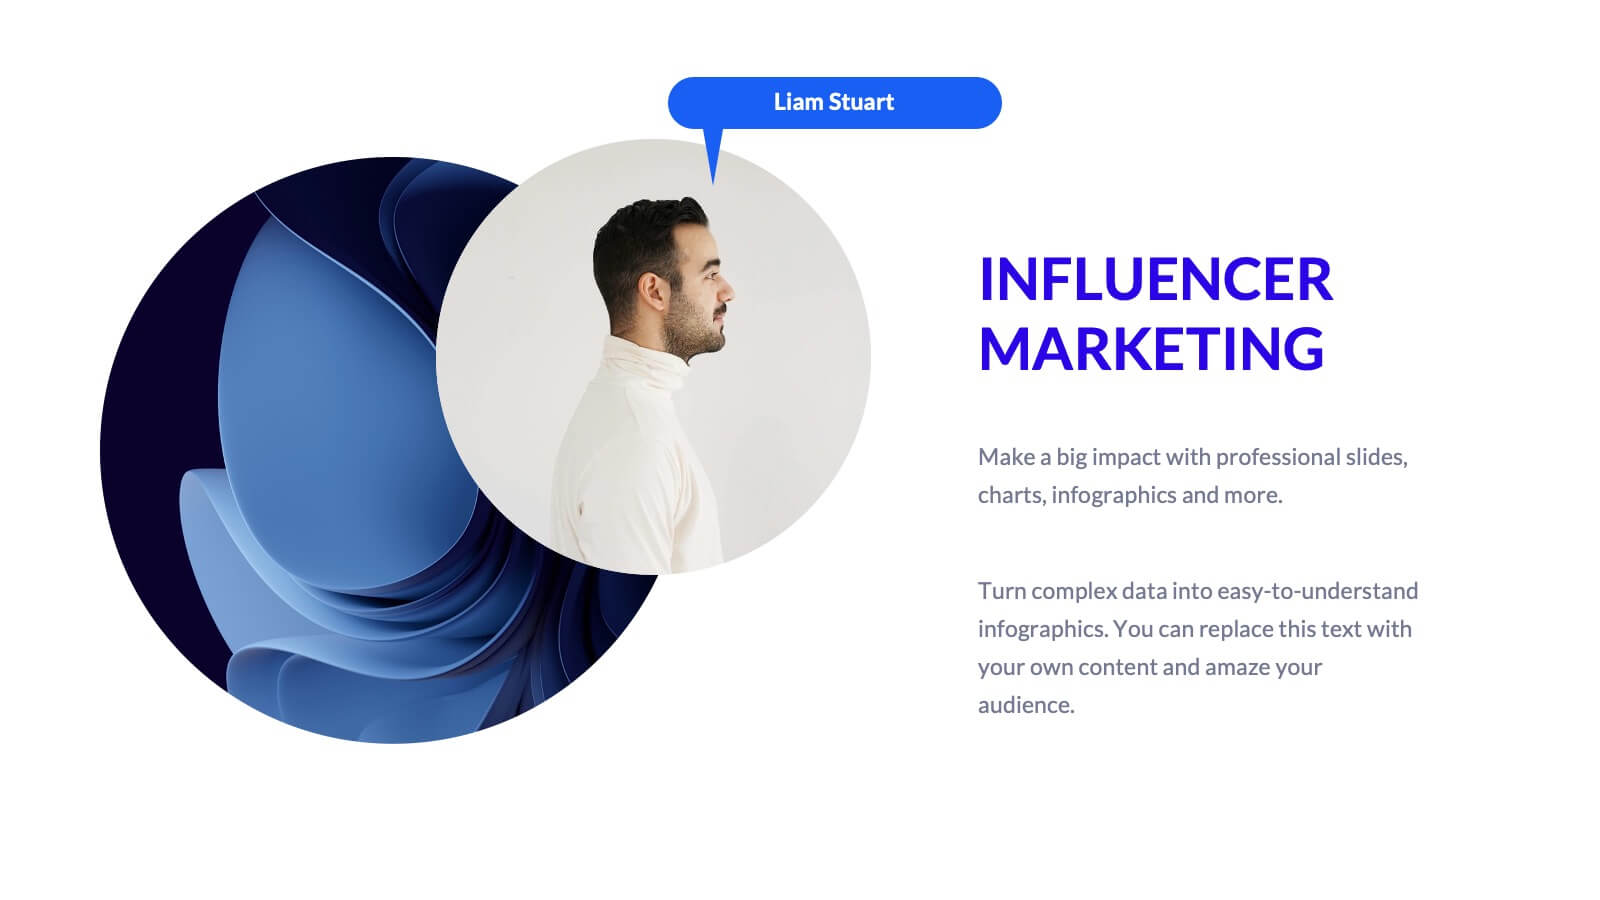
Catalyst Digital Marketing Strategy Plan Presentation
Supercharge your digital marketing strategy with this vibrant, modern presentation template. Perfect for detailing industry overviews, consumer behavior analysis, and social media strategies, it features a dynamic design that captures attention. Highlight key trends like SEO, influencer marketing, and e-commerce to engage your audience. Compatible with PowerPoint, Keynote, and Google Slides, it ensures seamless presentations on any platform.


23 slides
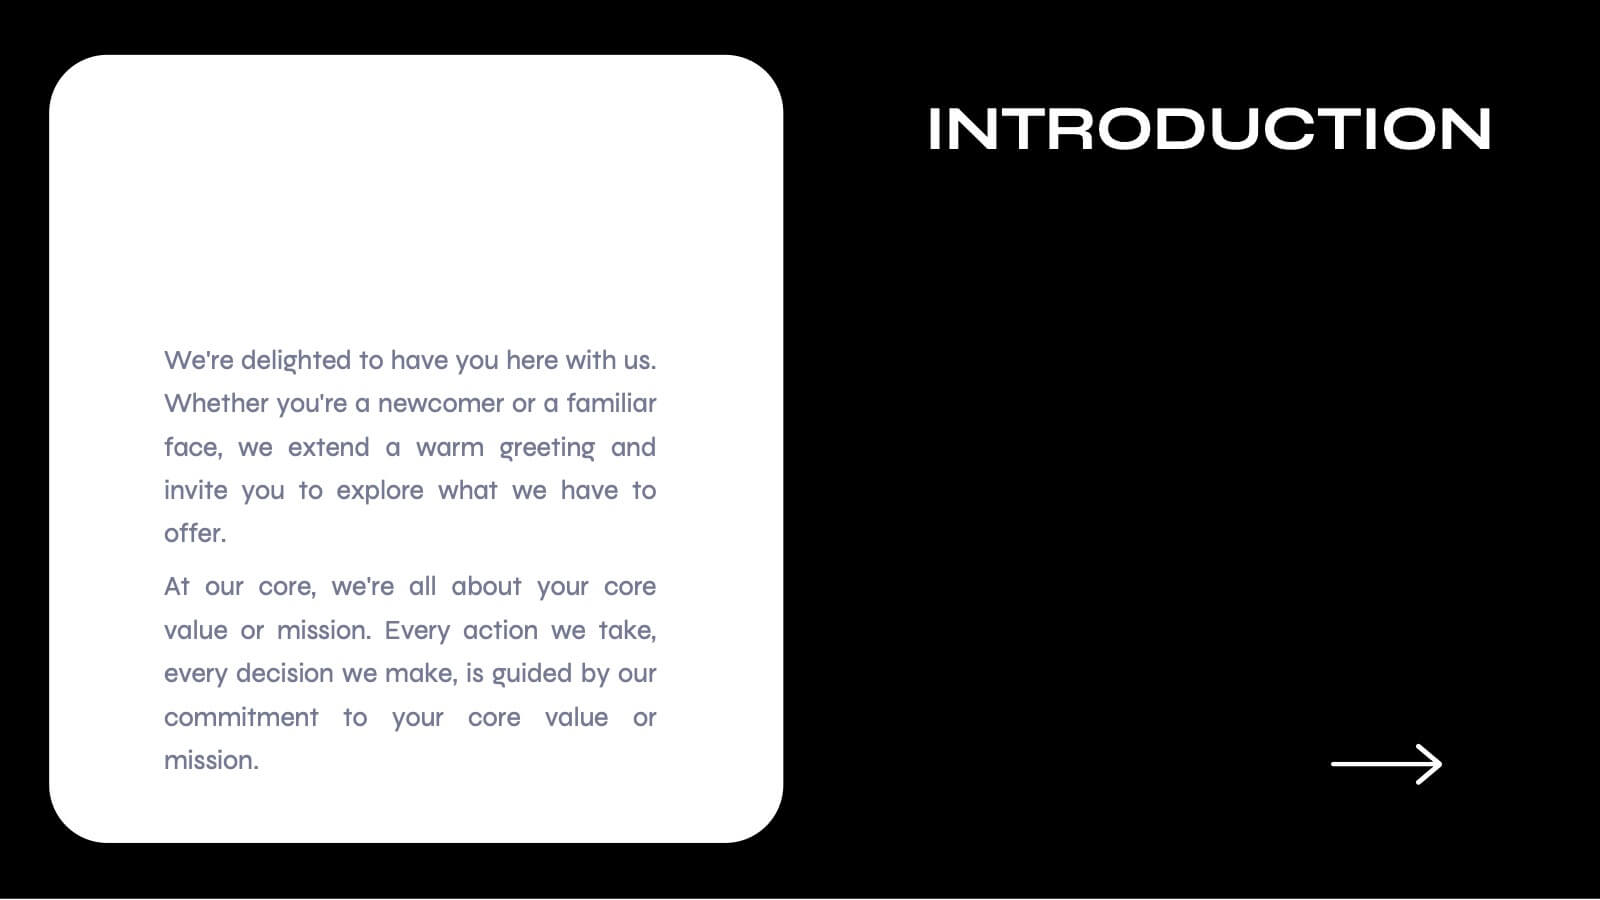
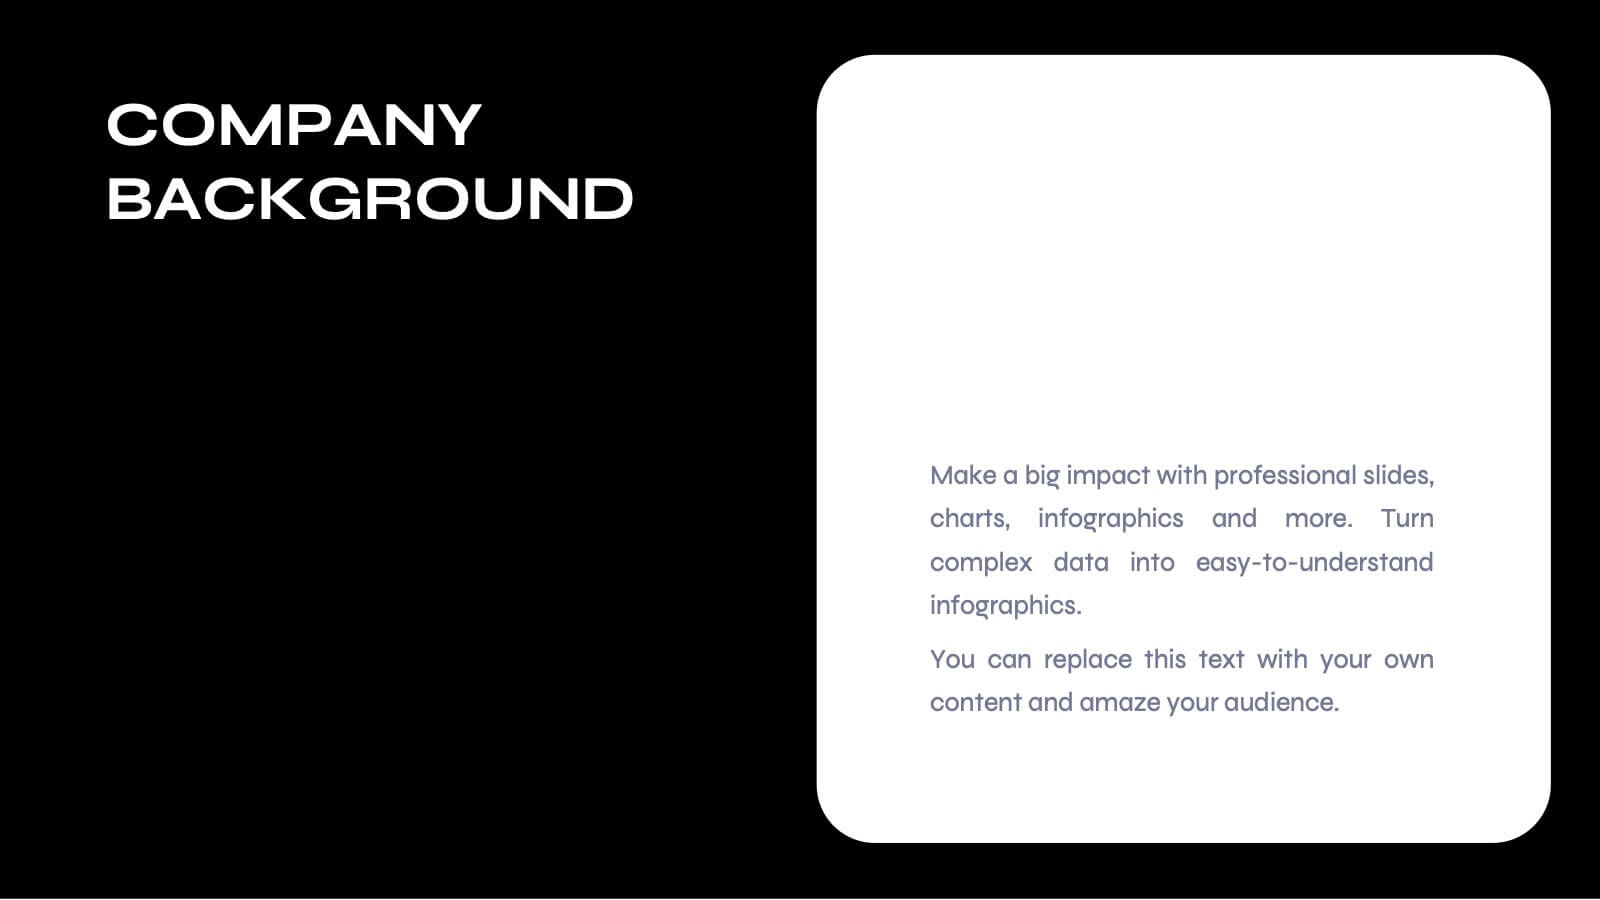
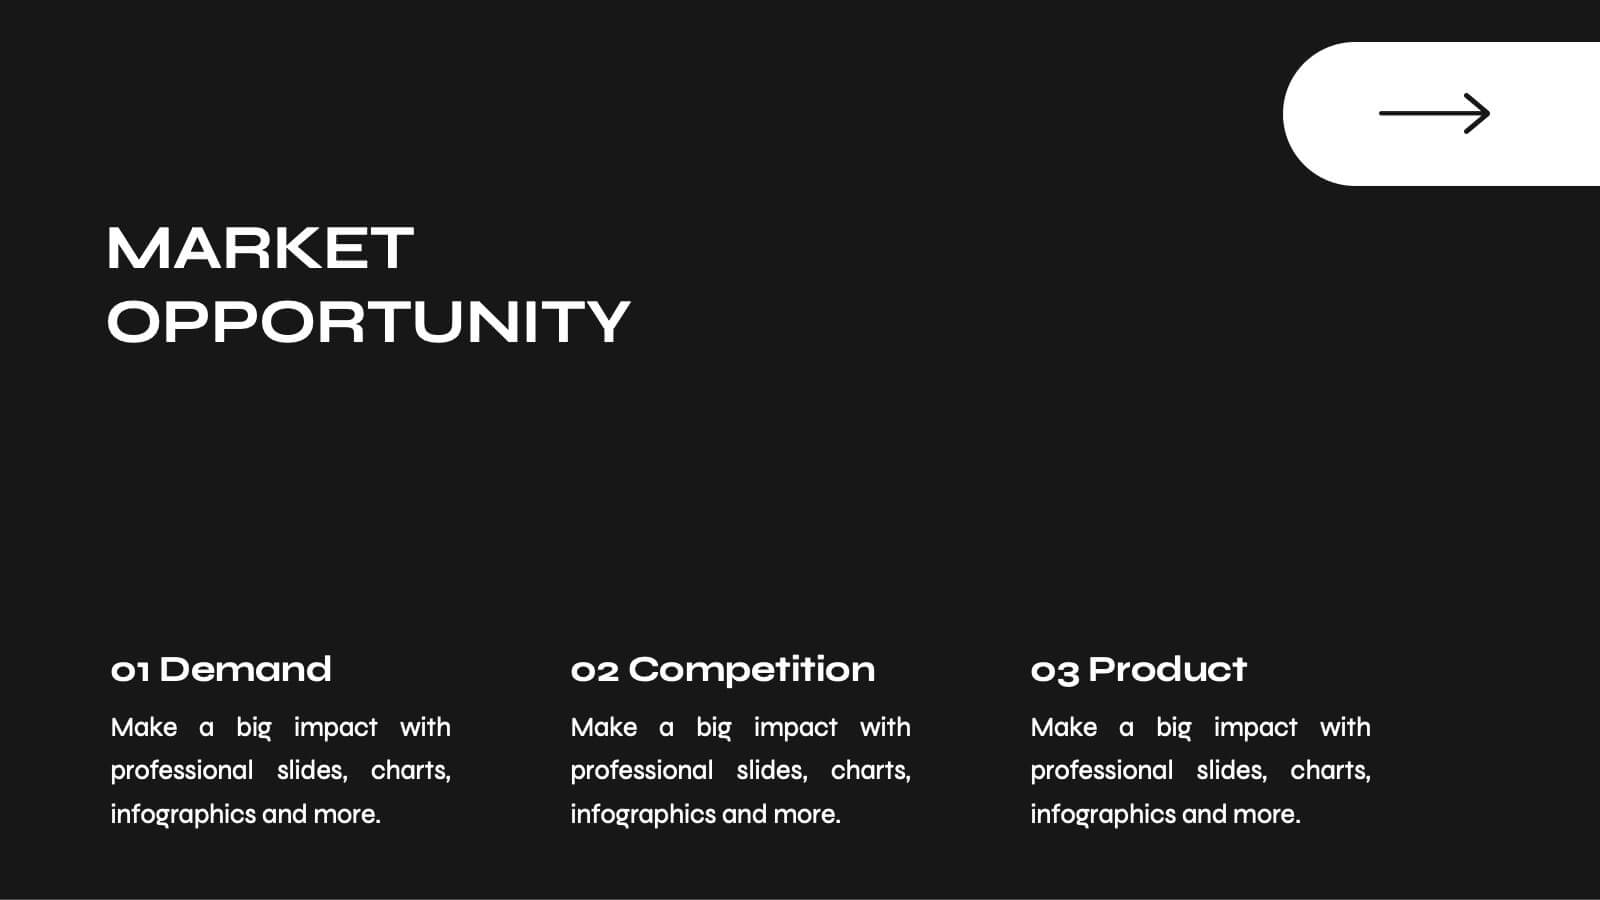
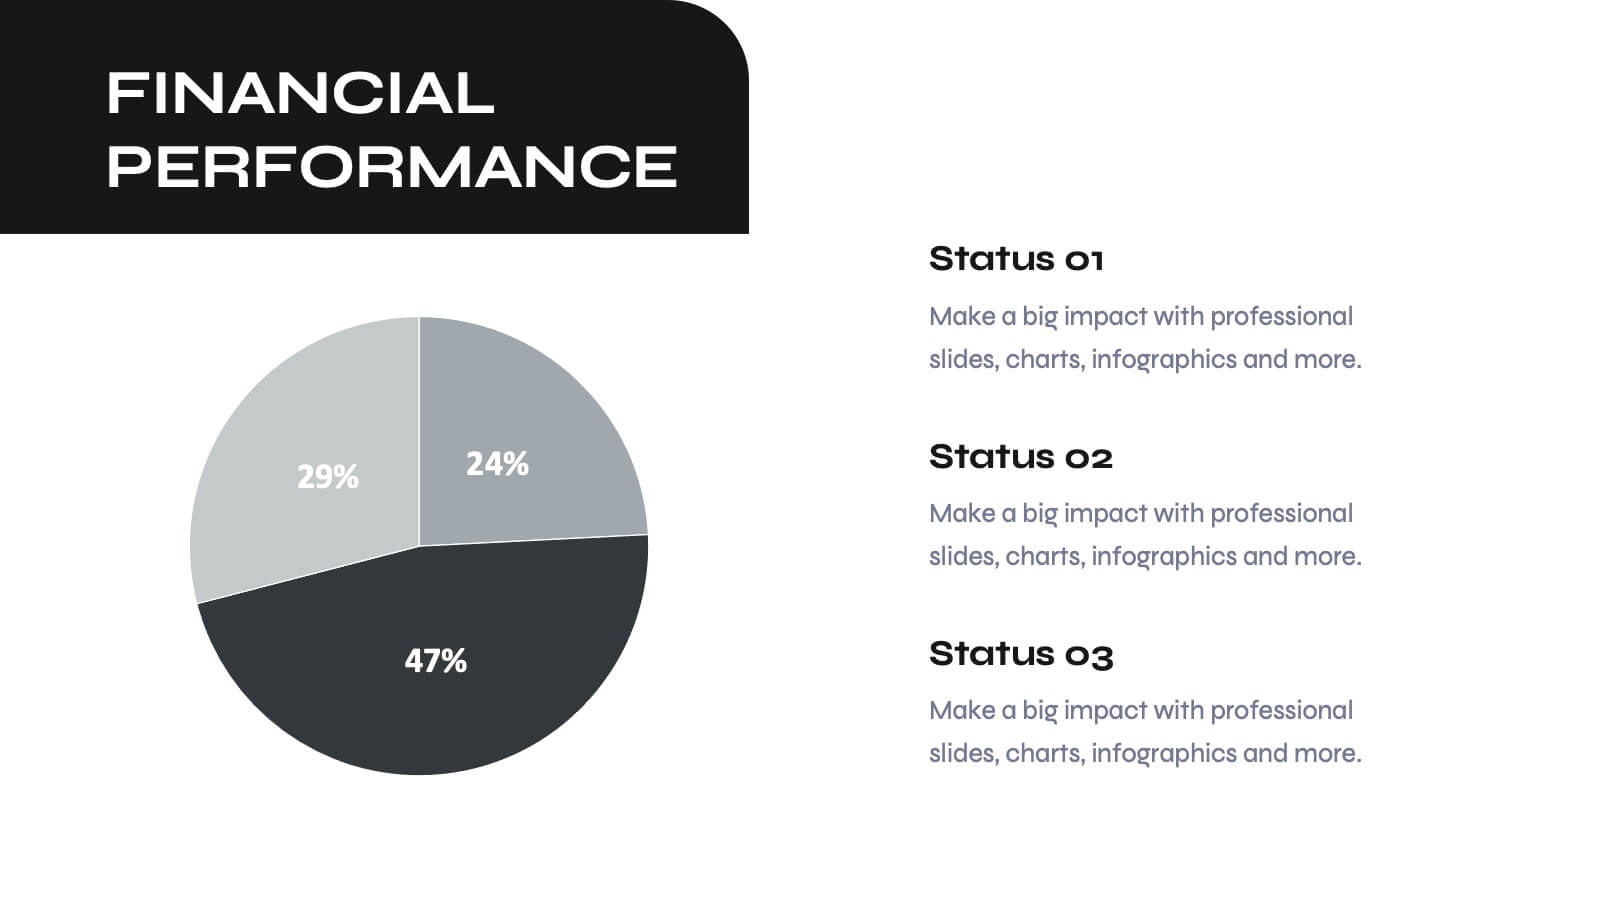
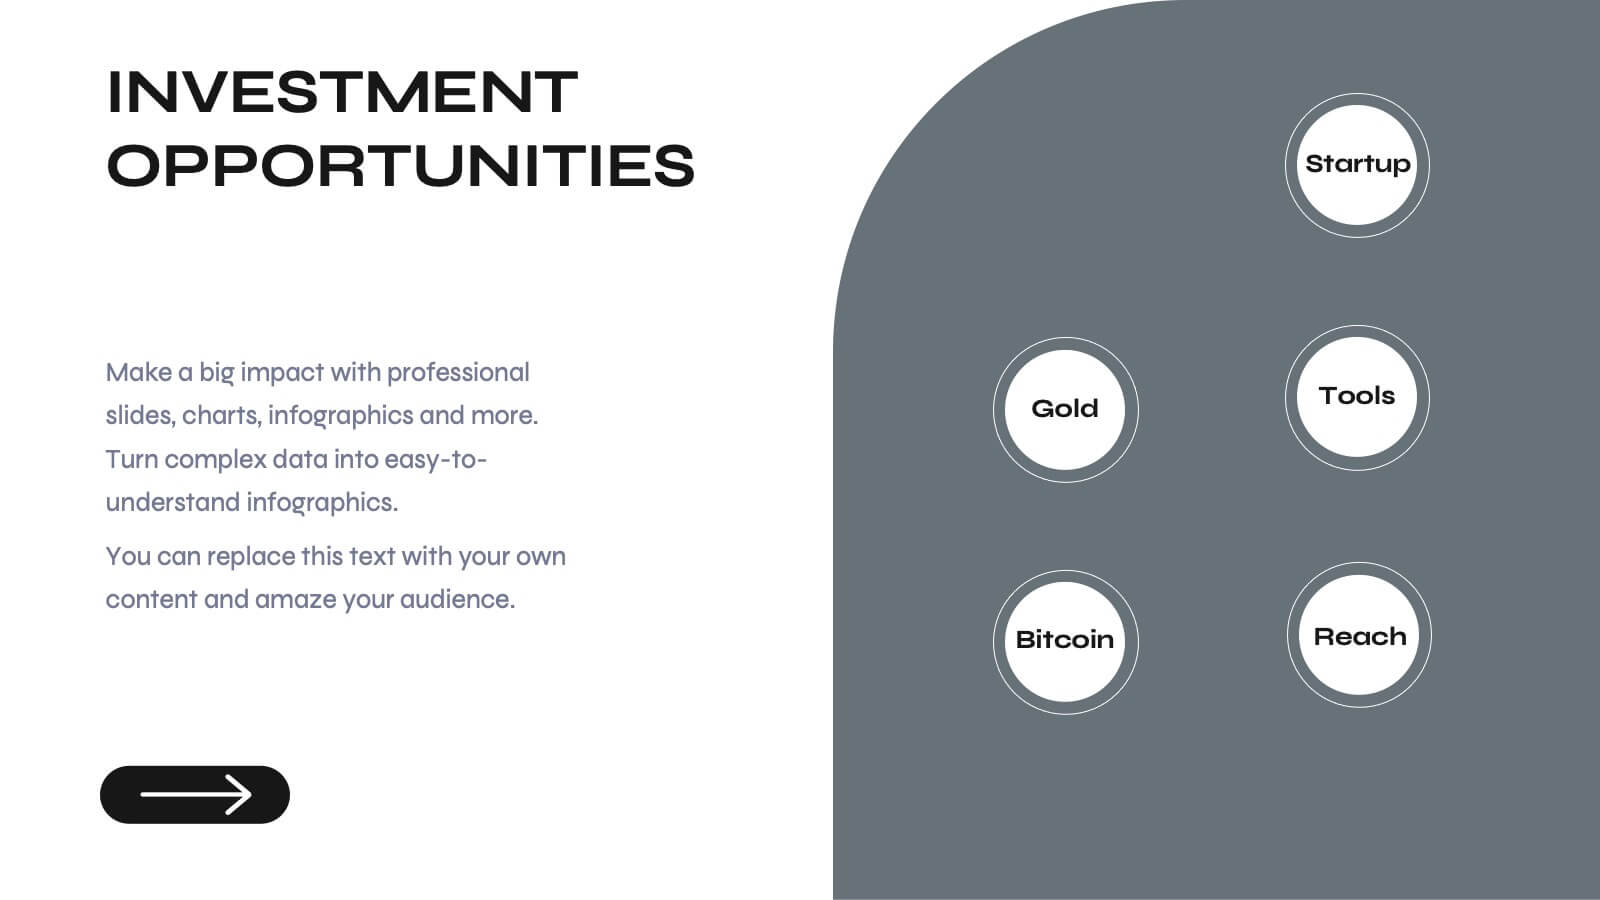
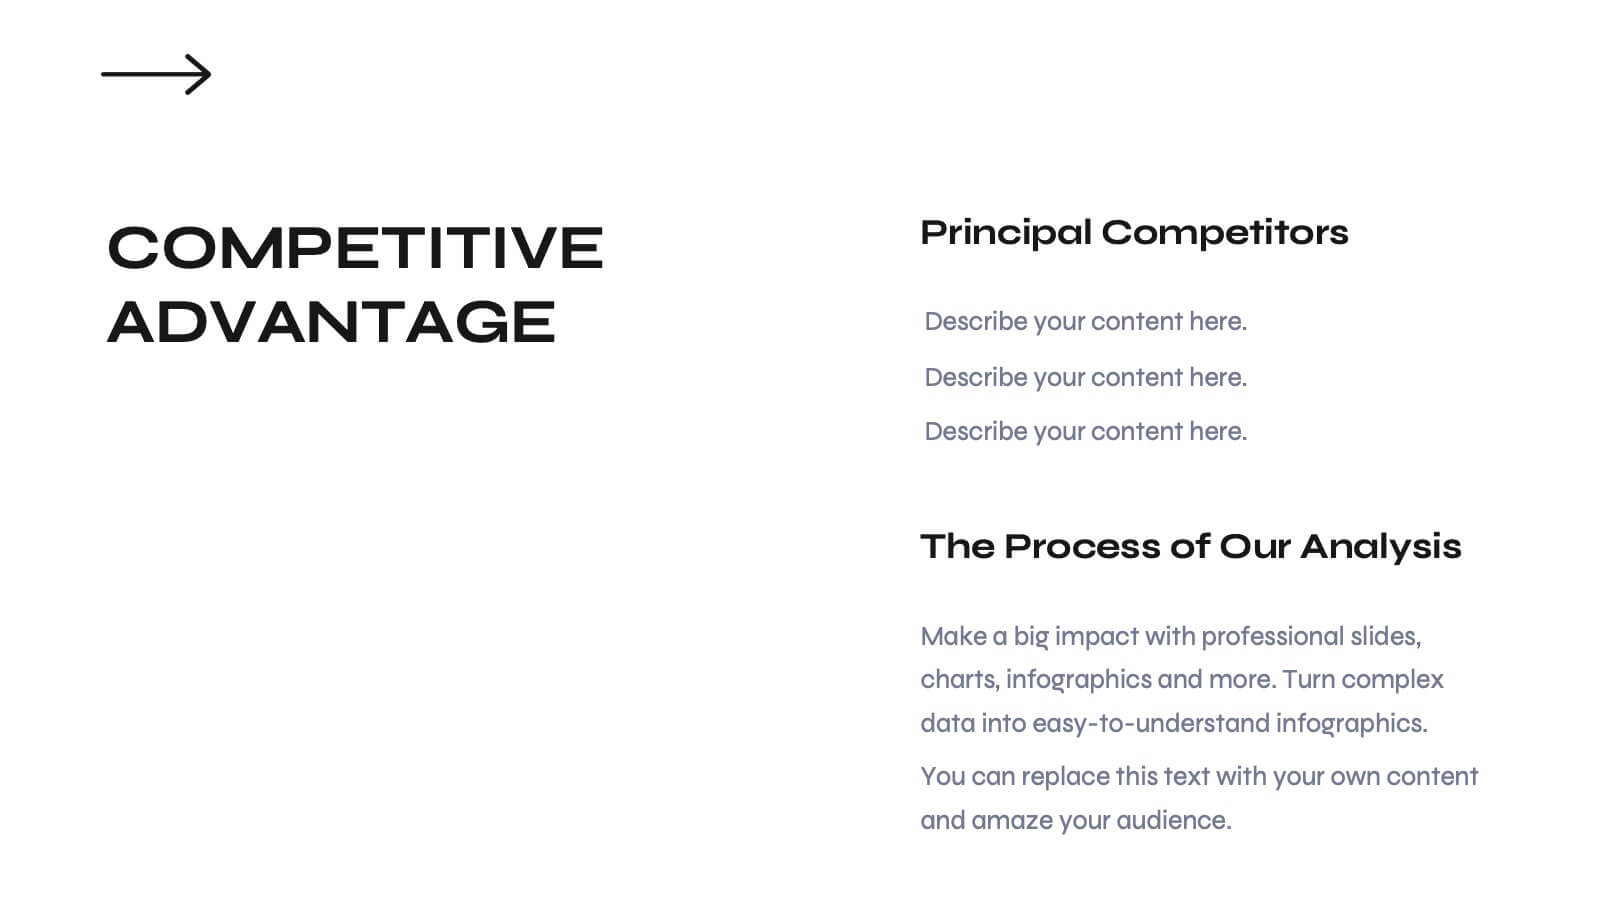
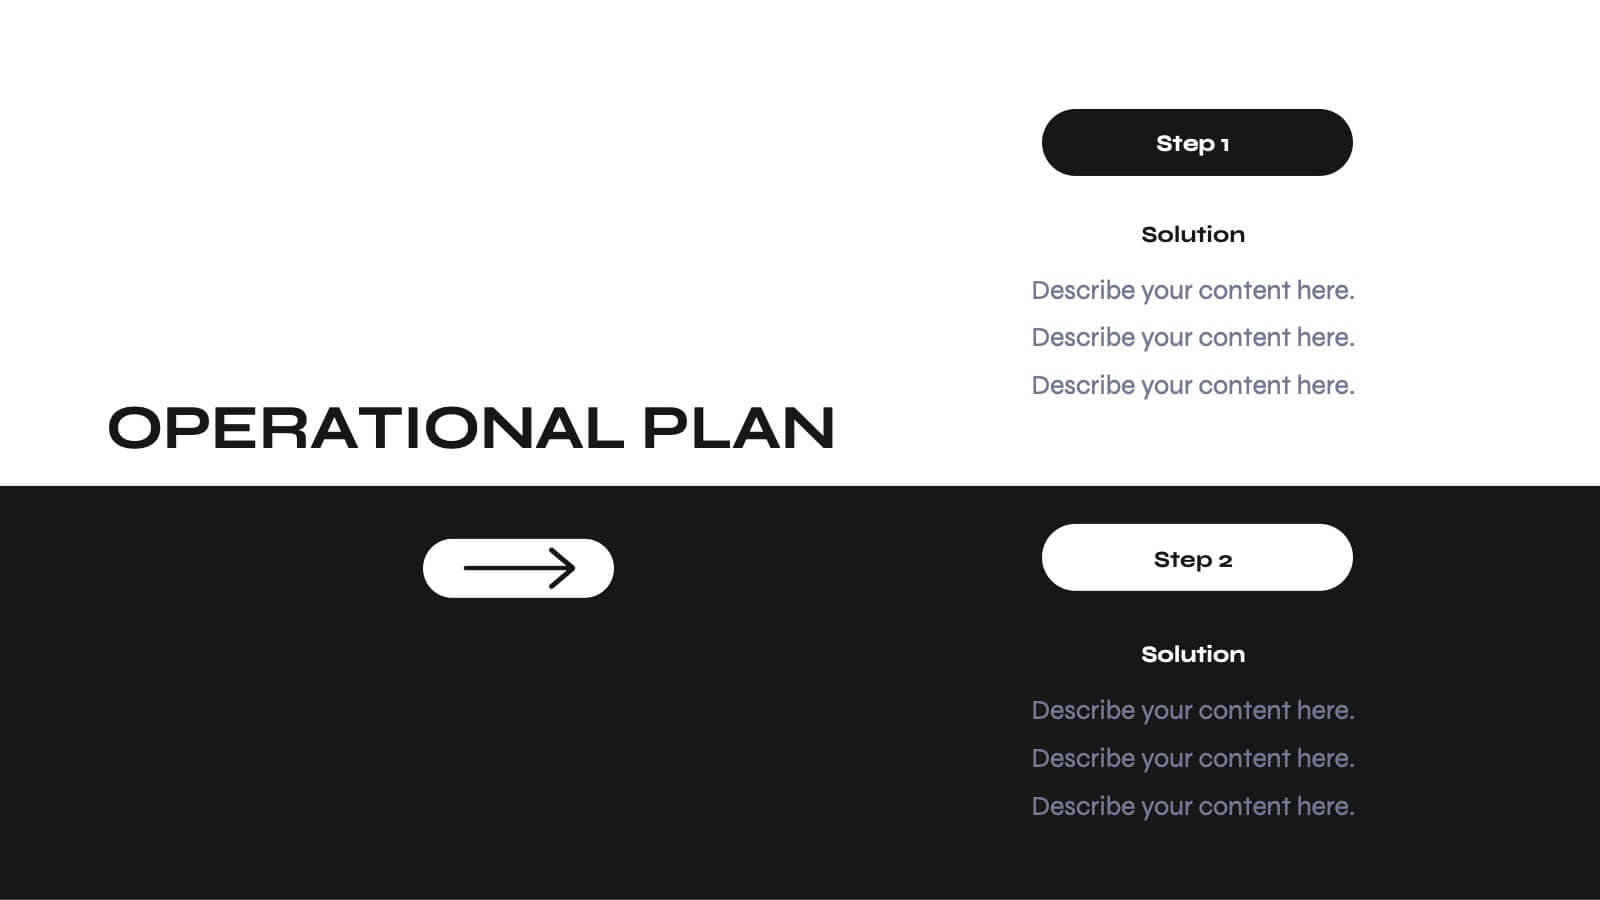
Odyssey Small Business Pitch Deck Presentation
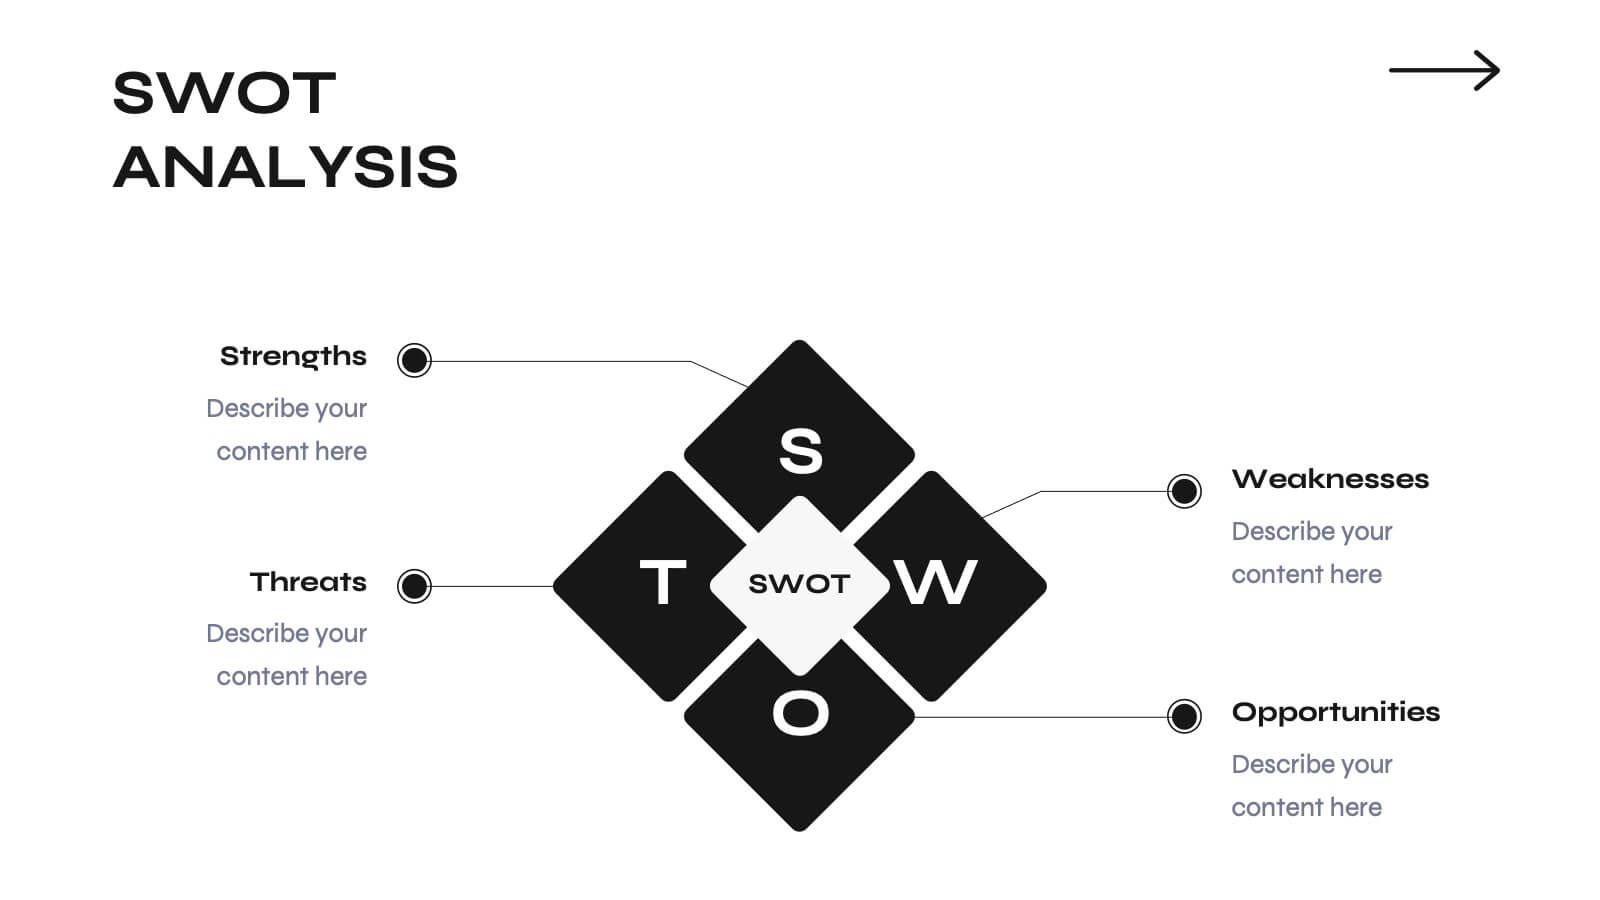
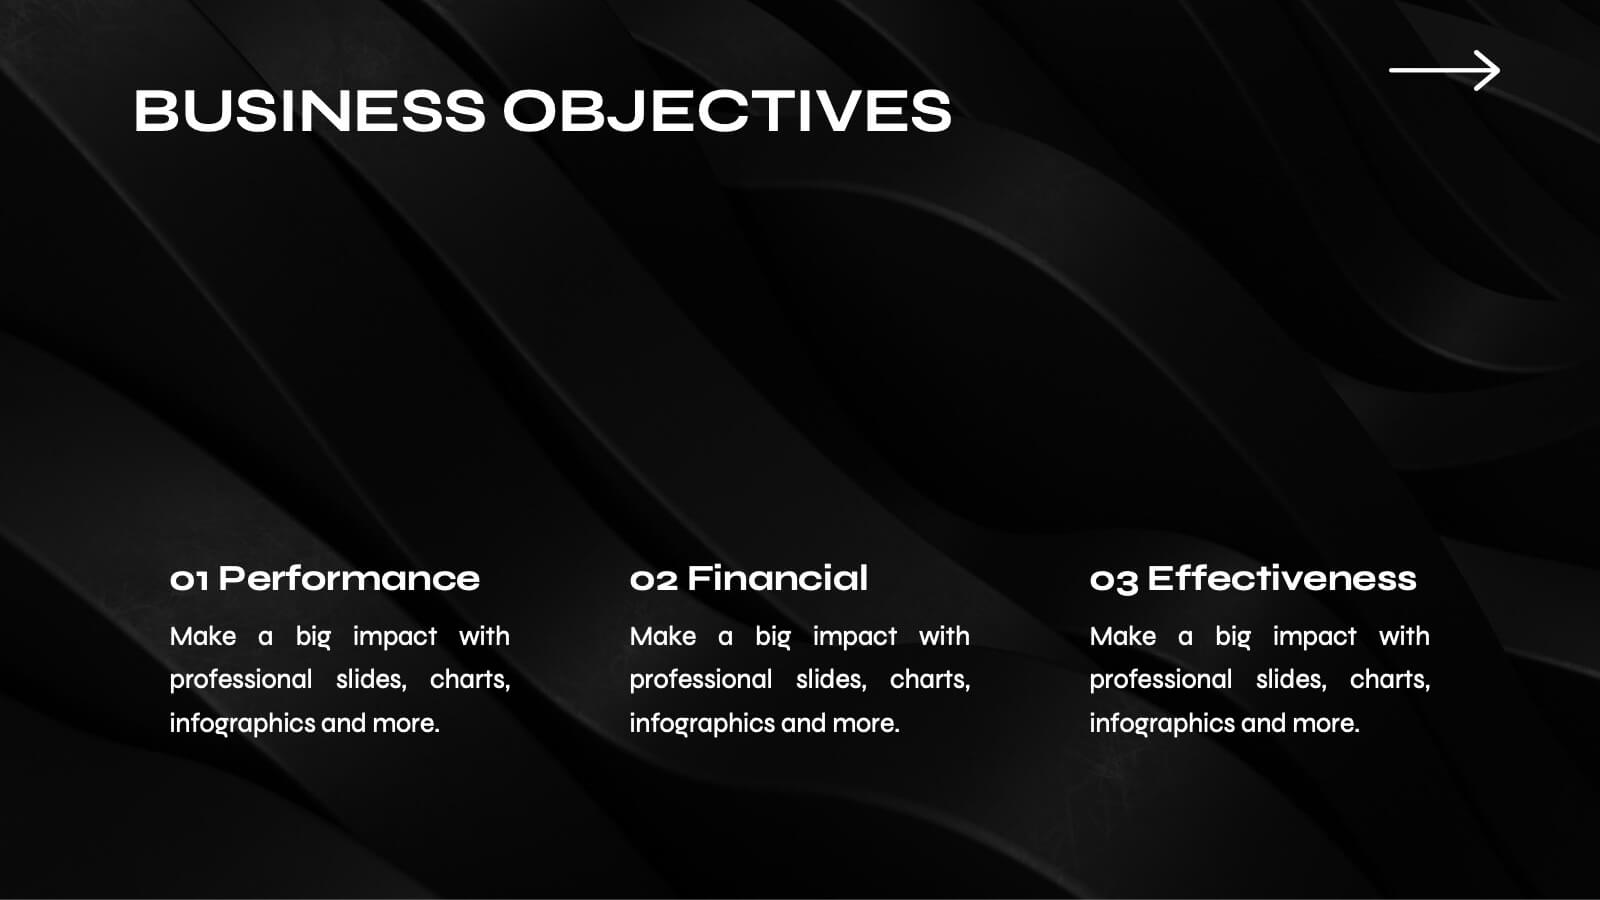
Elevate your business pitch with this sleek, monochrome presentation template. Perfect for presenting company backgrounds, market opportunities, and financial performance, it features a minimalist design that enhances clarity and impact. Highlight your value proposition and strategic plans to captivate investors. Compatible with PowerPoint, Keynote, and Google Slides, it ensures seamless presentations on any platform.


5 slides
Oceania Business Opportunities Map Presentation
Unlock growth potential with the Oceania Business Opportunities Map template, crafted to showcase key investment zones and emerging markets across the region. Utilize interactive mapping tools to analyze market viability and sector-specific opportunities effectively. Ideal for businesses looking to expand in Oceania. Compatible with PowerPoint, Keynote, and Google Slides.


8 slides
Blue Ocean Strategy Business Model Presentation
Chart unexplored market territories with our Blue Ocean Strategy Business Model template! This dynamic presentation tool, designed to simplify complex business strategies, illustrates the pivotal elements of cost reduction and value innovation to unlock new buyer value. Compatible with PowerPoint, Keynote, and Google Slides, it's ideal for strategists aiming to create uncontested market spaces and make competition irrelevant. Perfect for workshops, business meetings, or strategy sessions.


26 slides
Jacob Free Powerpoint Template
Are you looking for a classy designer template? Then the Jacob is for you. The Jacob template is a chic, beautiful, modern and easy to use template. It's suitable for all types of businesses, from small business accounts, to large corporate companies and even personal use. It has a very hip aesthetic, with pink tones giving it a very fresh appealing look. The pictures and charts are easy to understand as well as easy to read without too much confusion on reading informative content. Easy to use high quality charts and graphs makes this template best for all types of businesses.


6 slides
Real-Life Business Case Study Review Presentation
Break down complex scenarios into clear, visual insights with the Real-Life Business Case Study Review Presentation. This template uses a 5-step horizontal hexagon layout to guide your audience through each stage of a business case—ideal for timelines, project phases, or outcome reviews. Fully editable in PowerPoint, Keynote, and Google Slides.


26 slides
Crypto Currency Dark Presentation
Navigate the dynamic world of digital finance with our Crypto Currency presentation template, compatible with PowerPoint, Keynote, and Google Slides. This template is an invaluable tool for financial analysts, crypto enthusiasts, and educators in the realm of digital currencies. The design boasts a bold and modern aesthetic, with cryptocurrency motifs that capture the essence of this revolutionary market. With this template, you can present complex financial data and crypto concepts with clarity. Its range of slides includes comparative analyses, timeline infographics, and process diagrams, enabling a thorough exploration of the cryptocurrency landscape. The vibrant colors and creative graphics make it easy to highlight market trends, investment opportunities, and the technology behind cryptocurrencies. By using our Crypto Currency template, you'll engage and educate your audience on the nuances of blockchain and digital assets. Download it today to deliver a presentation that's as innovative and forward-thinking as the topic itself.