


Features
- 26 Unique Slides
- Fully editable and easy to edit in Microsoft Powerpoint, Keynote and Google Slides
- 16:9 widescreen layout
- Clean and professional designs
- Export to JPG, PDF or send by email


Do you have any questions?
Recommend


22 slides
Virtus Qualitative Research Findings Presentation
This qualitative research findings template features a modern design with geometric shapes and a professional palette of blue, gold, and black. It’s structured to showcase research details effectively, covering objectives, methodology, findings, limitations, and future directions. Compatible with PowerPoint, Keynote, and Google Slides for seamless presentations.


23 slides
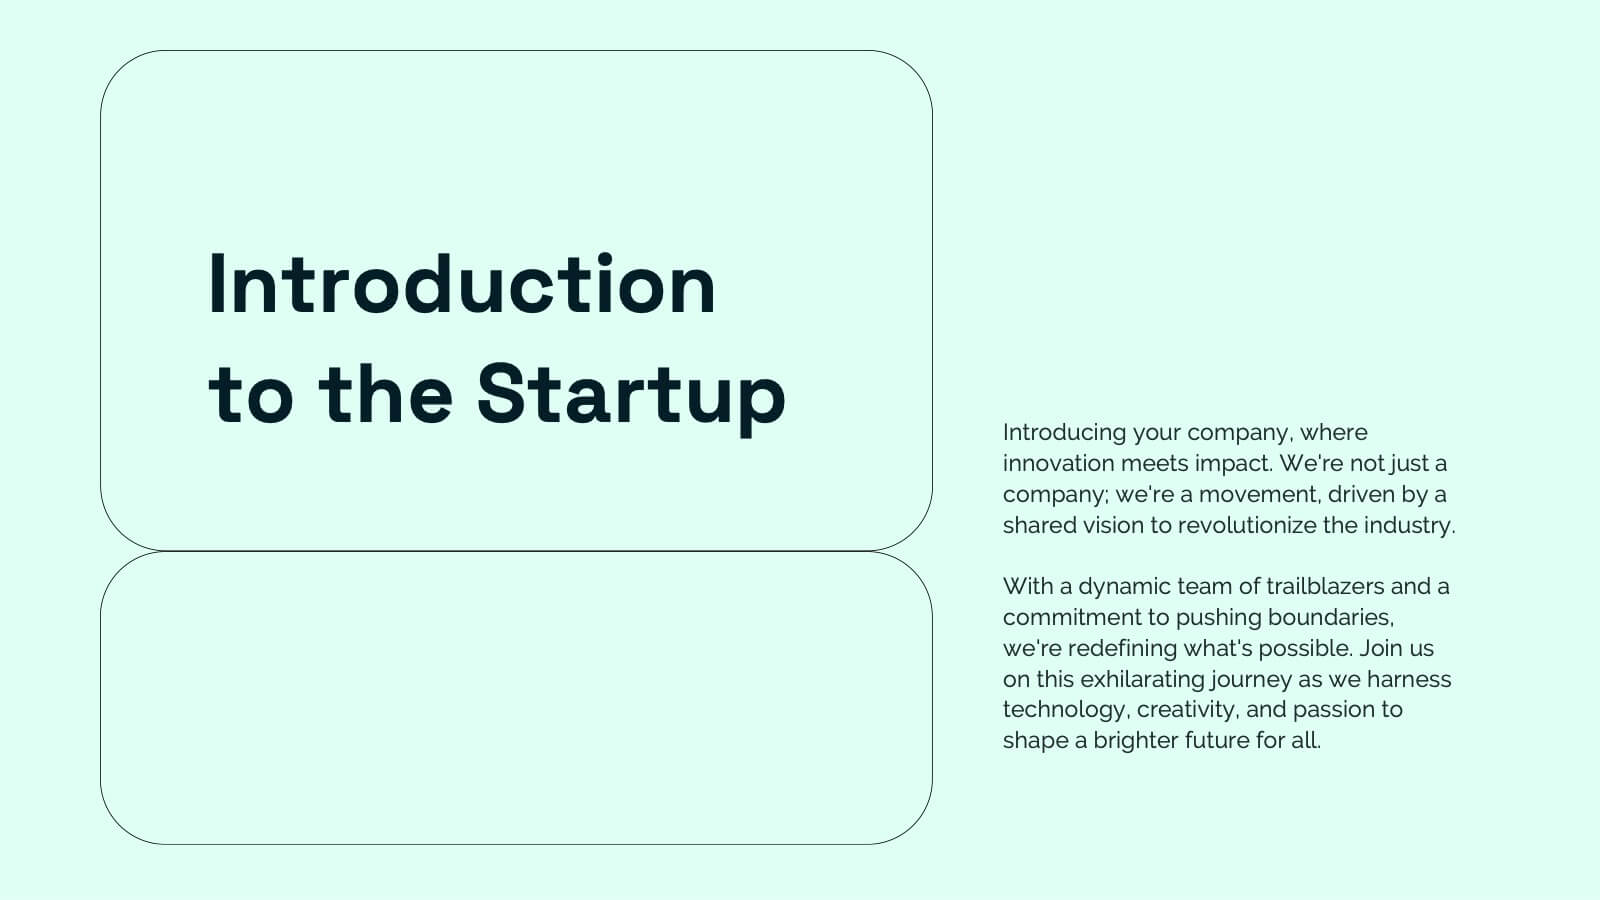
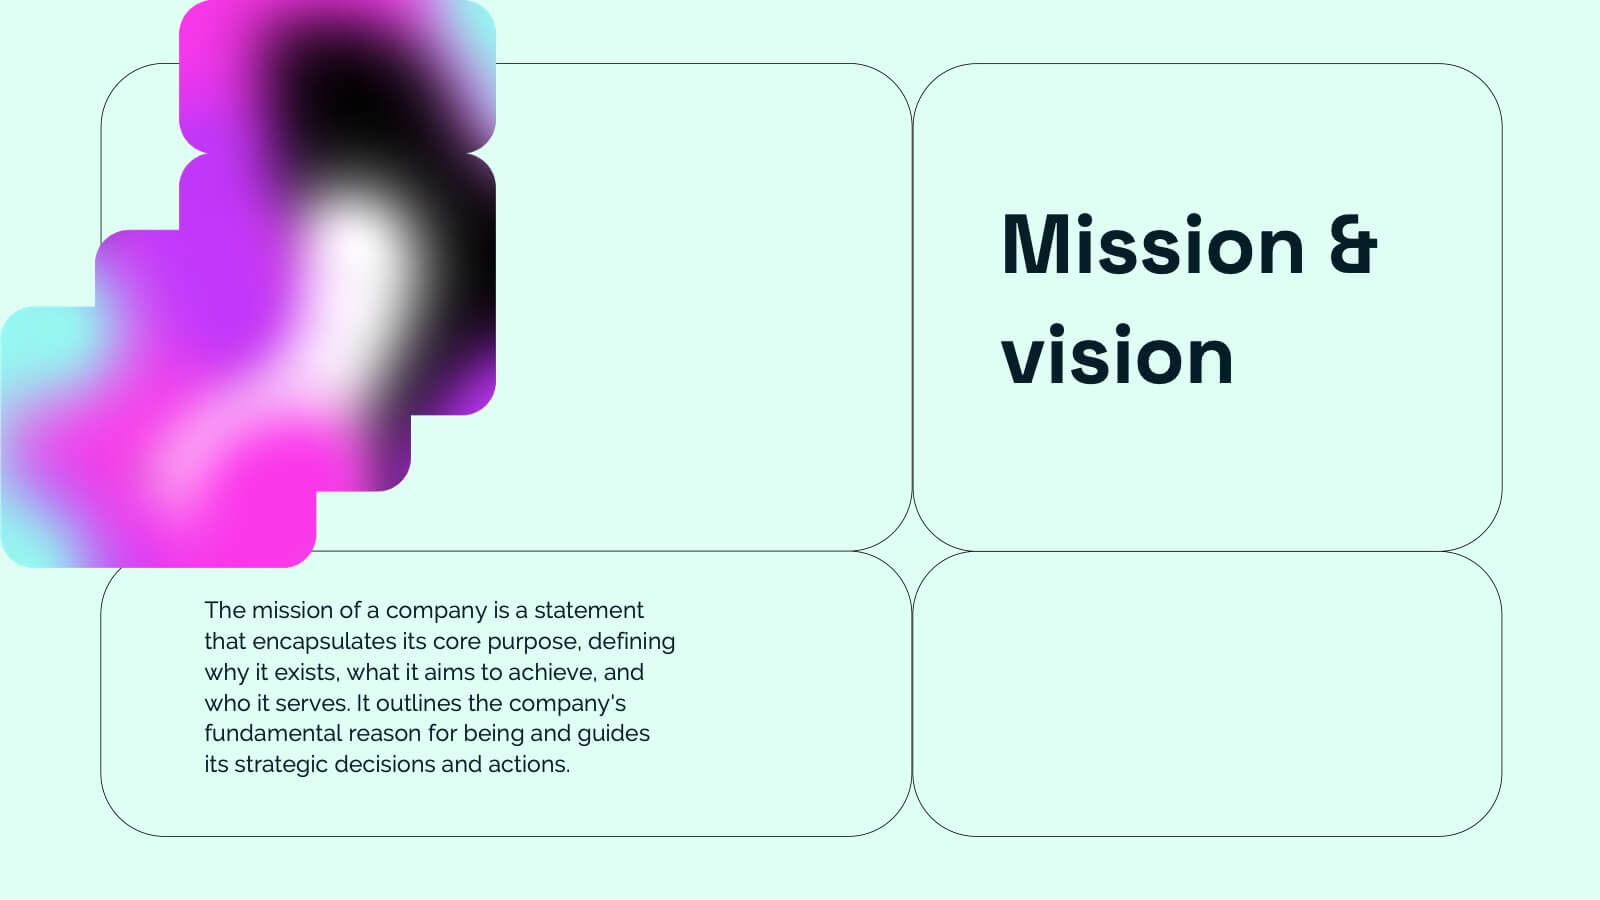
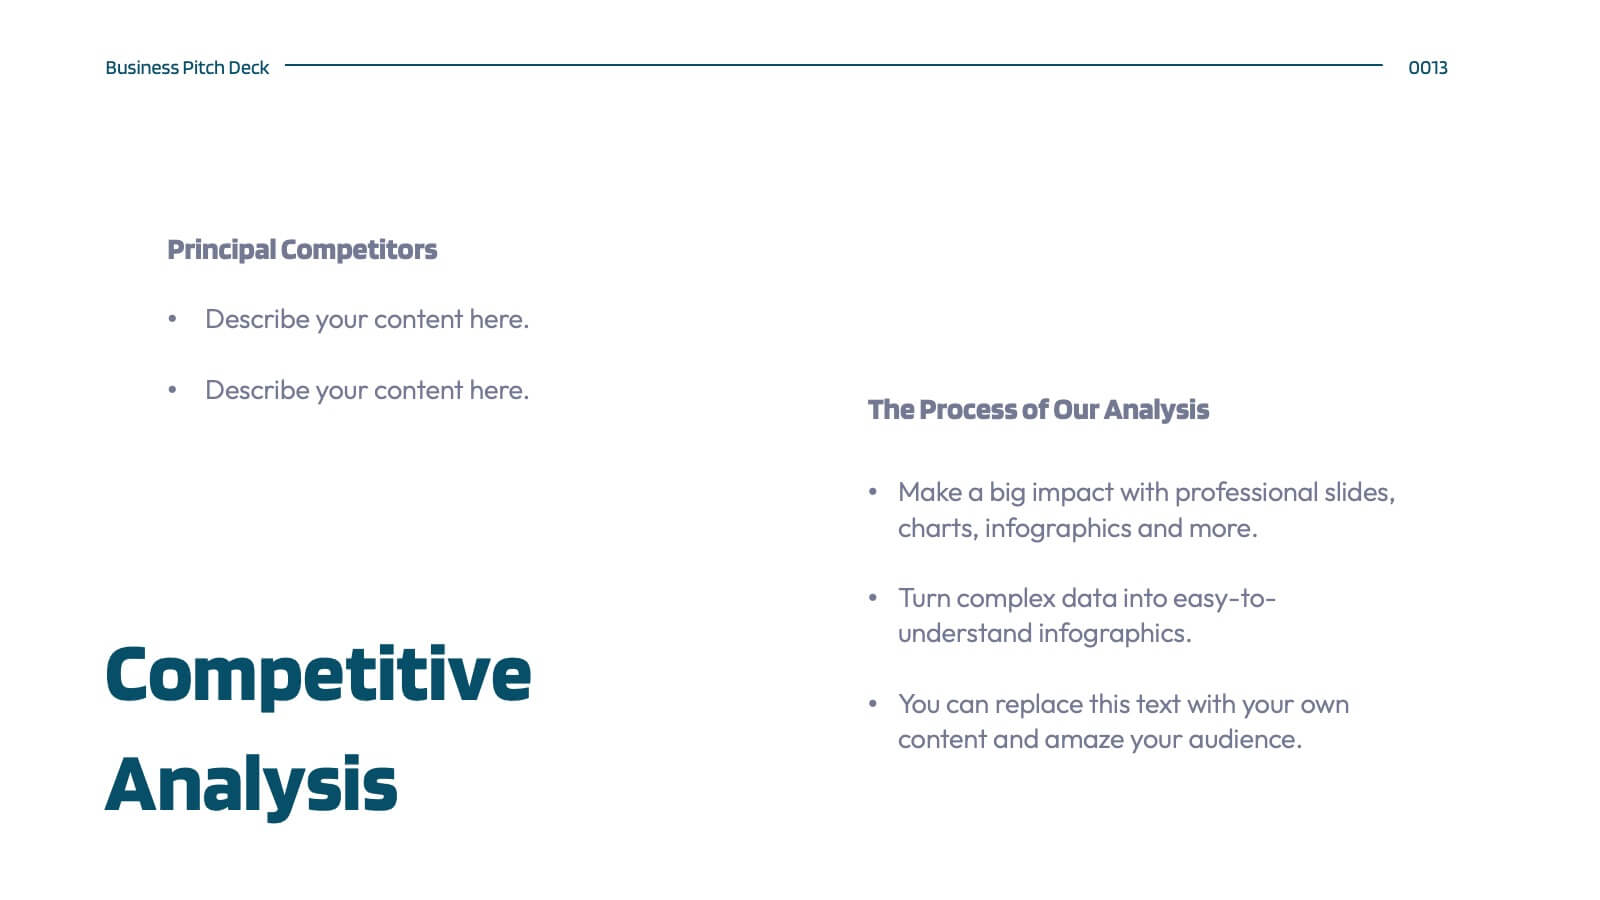
Nymph Startup Pitch Deck Presentation
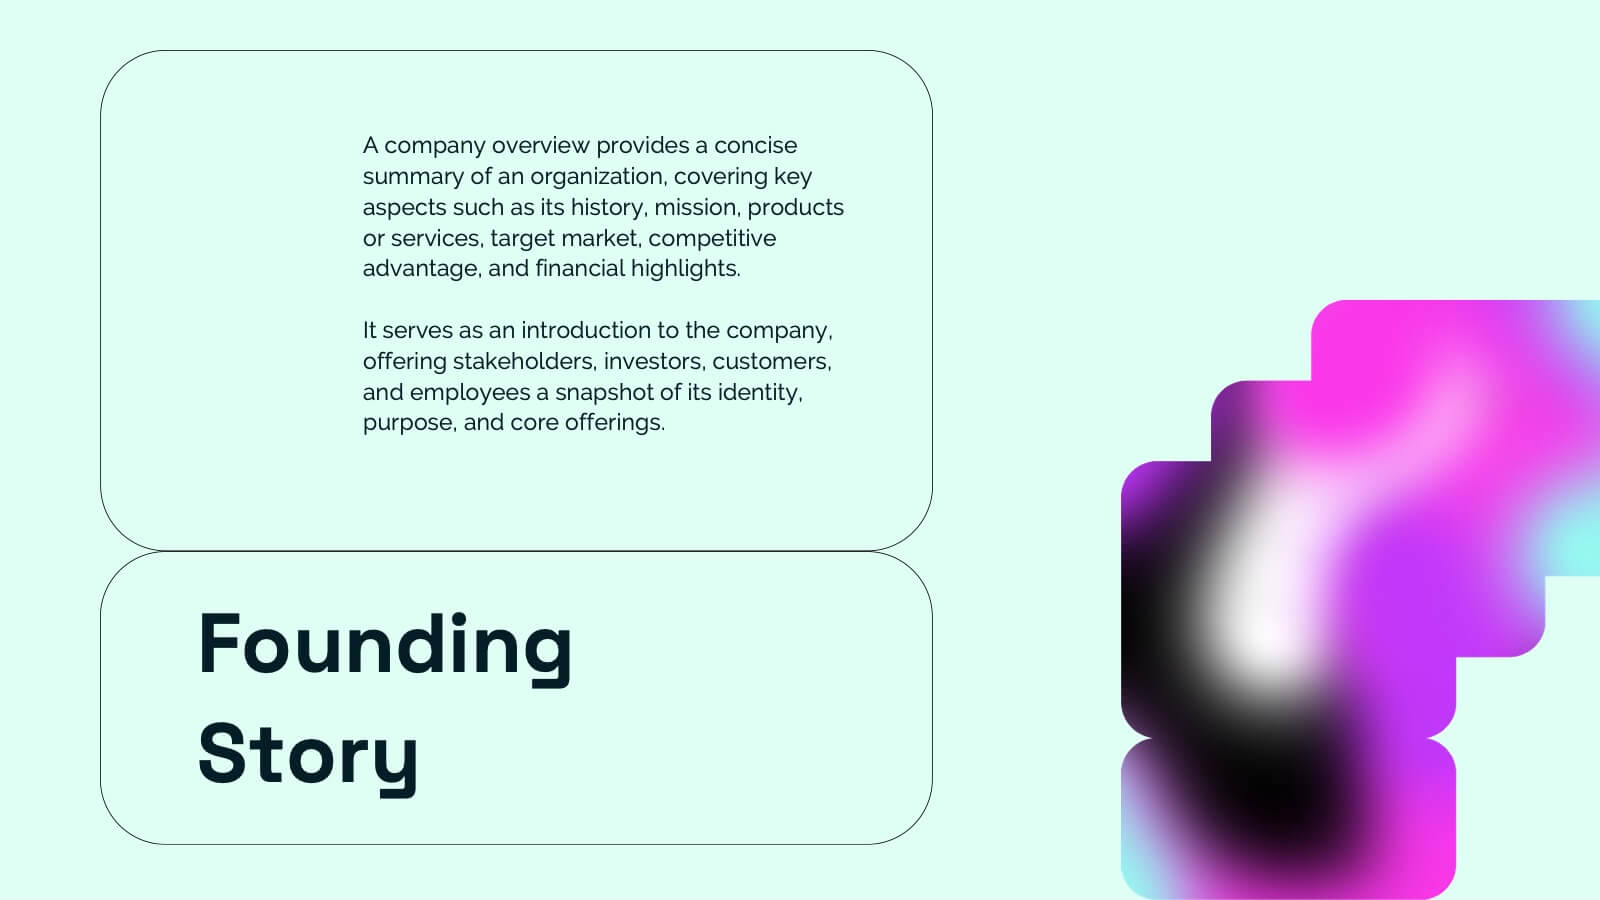
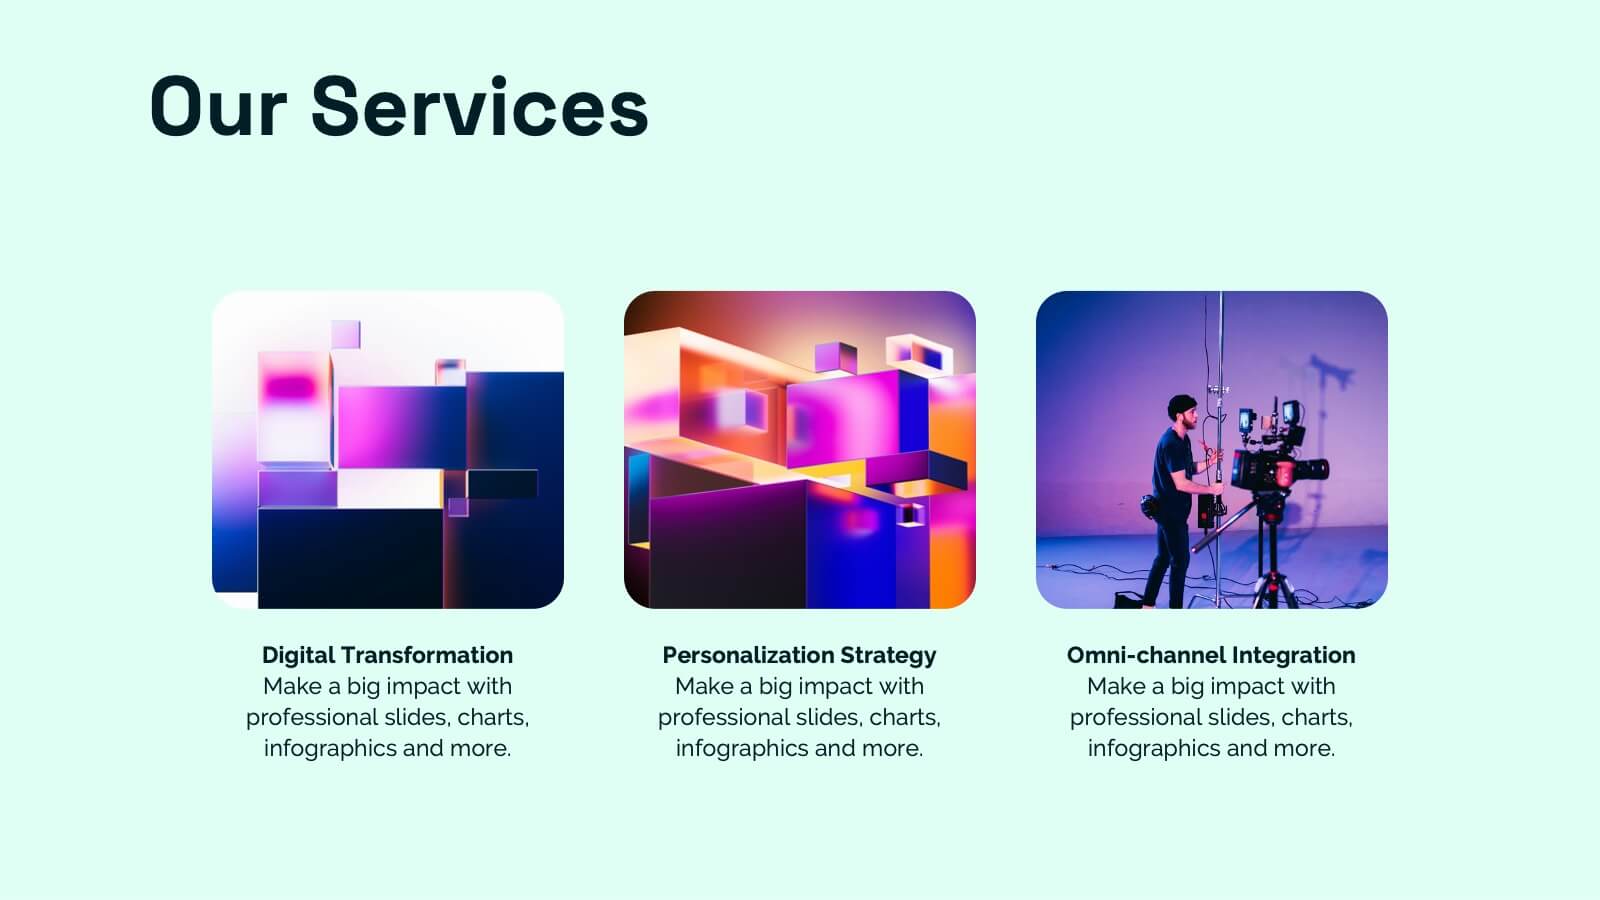
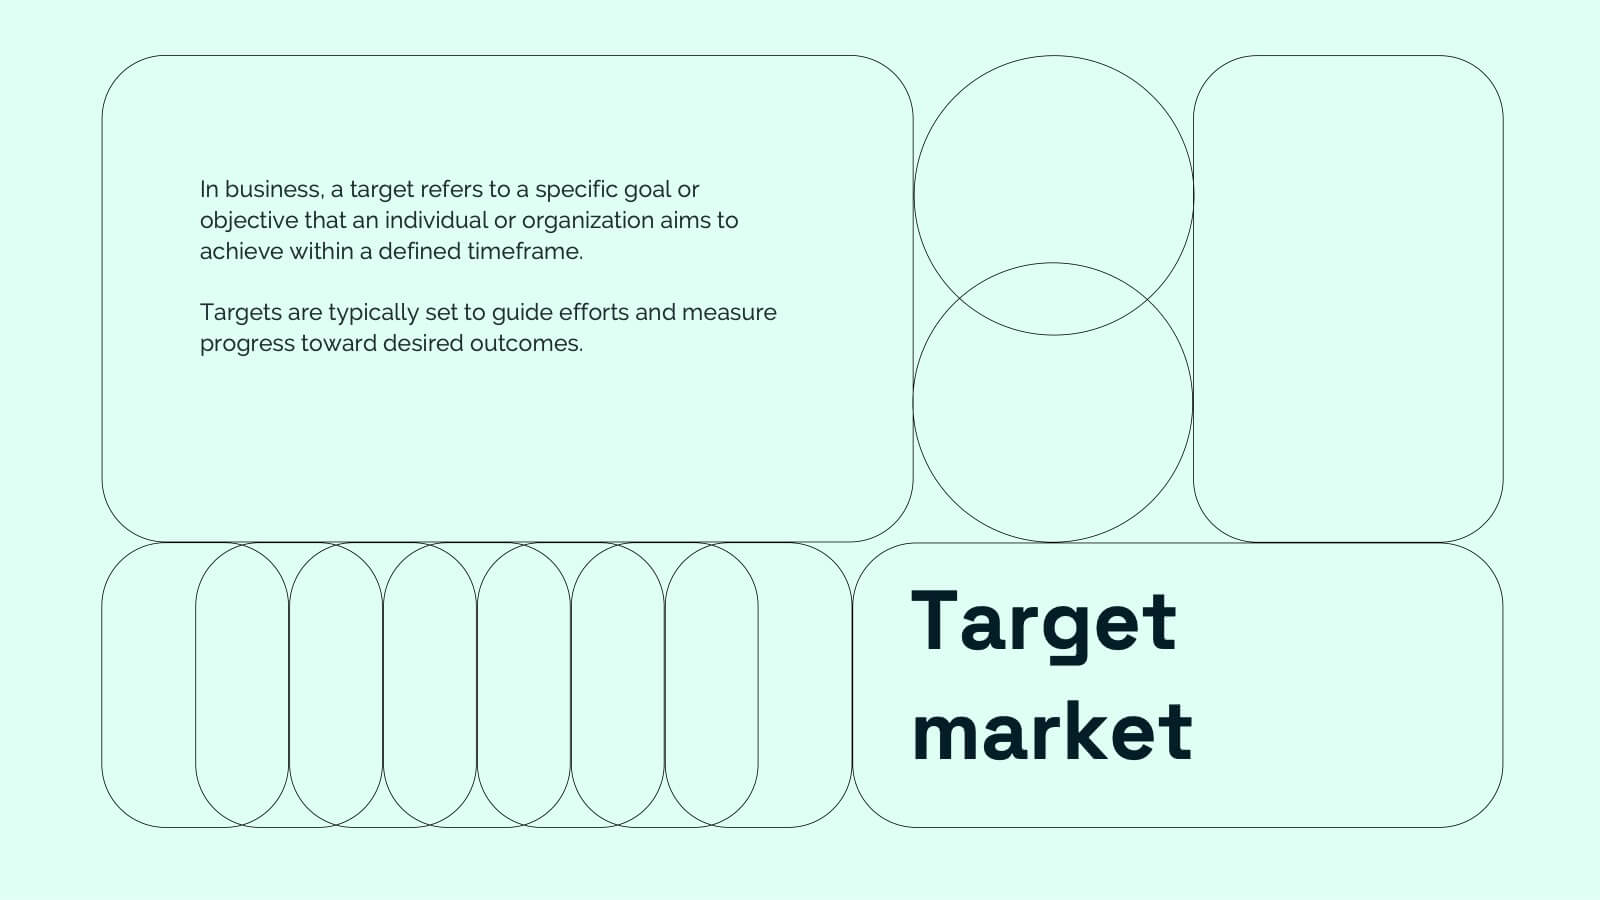
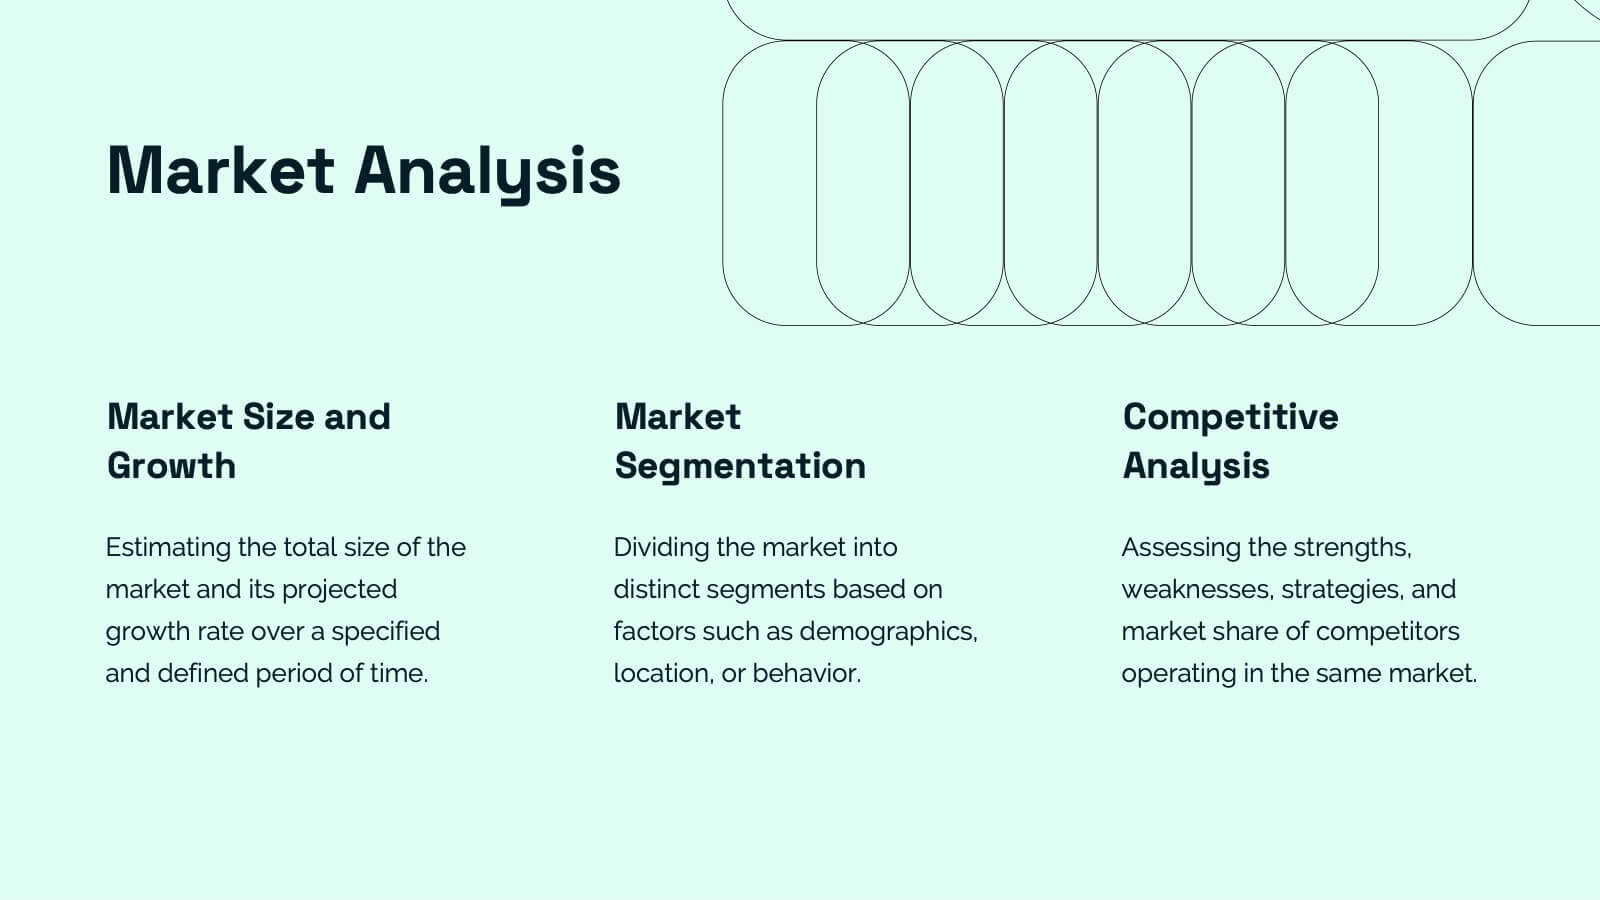
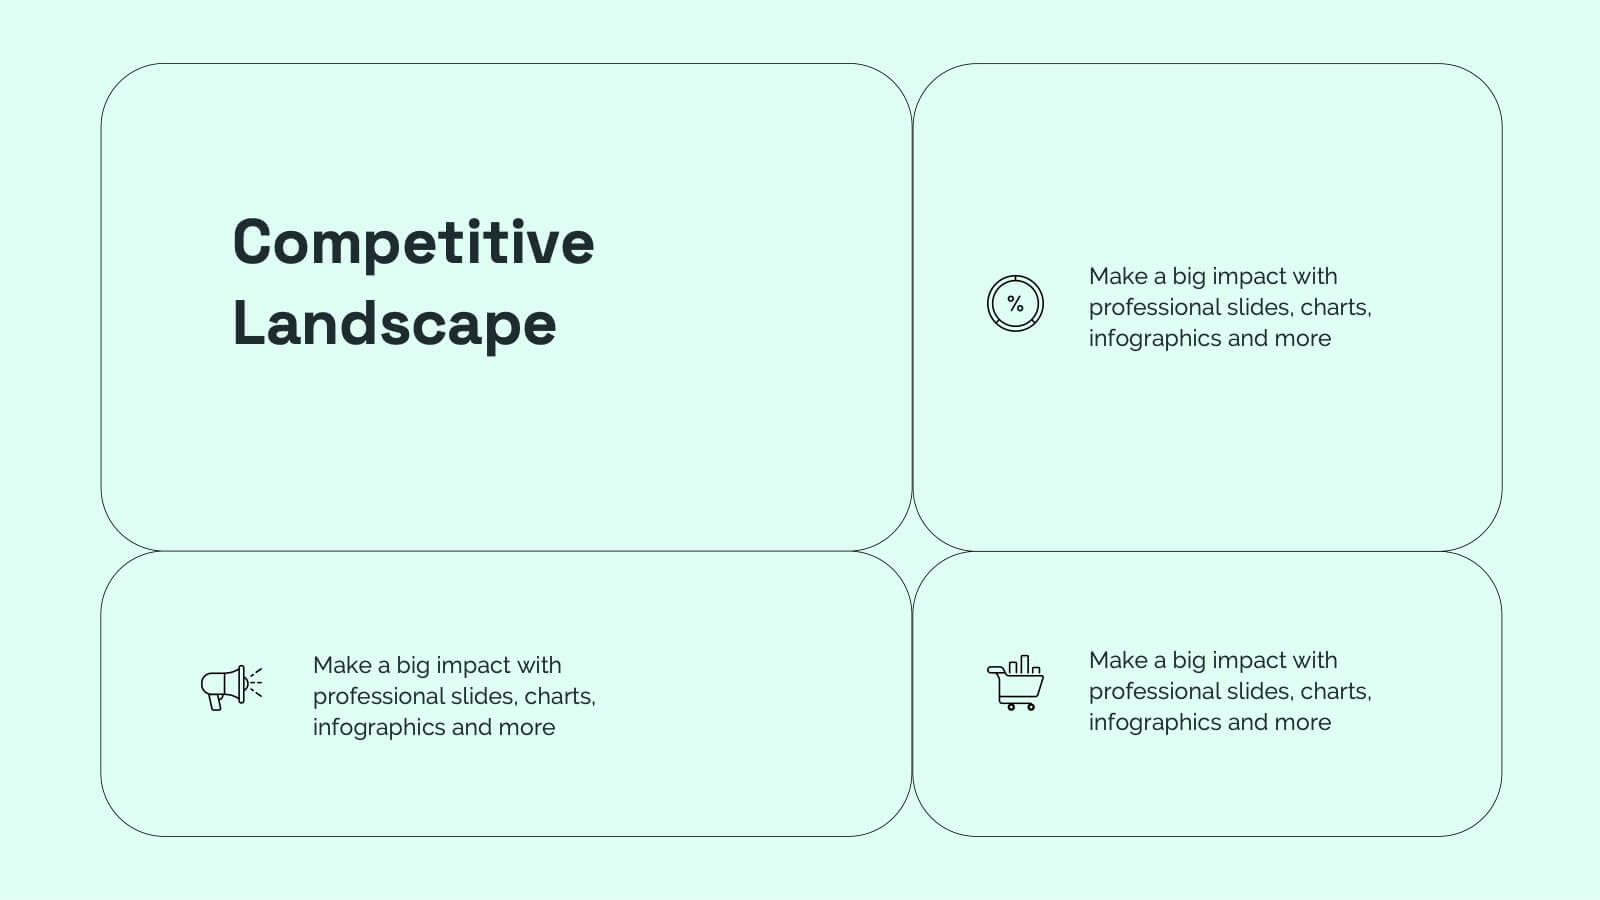
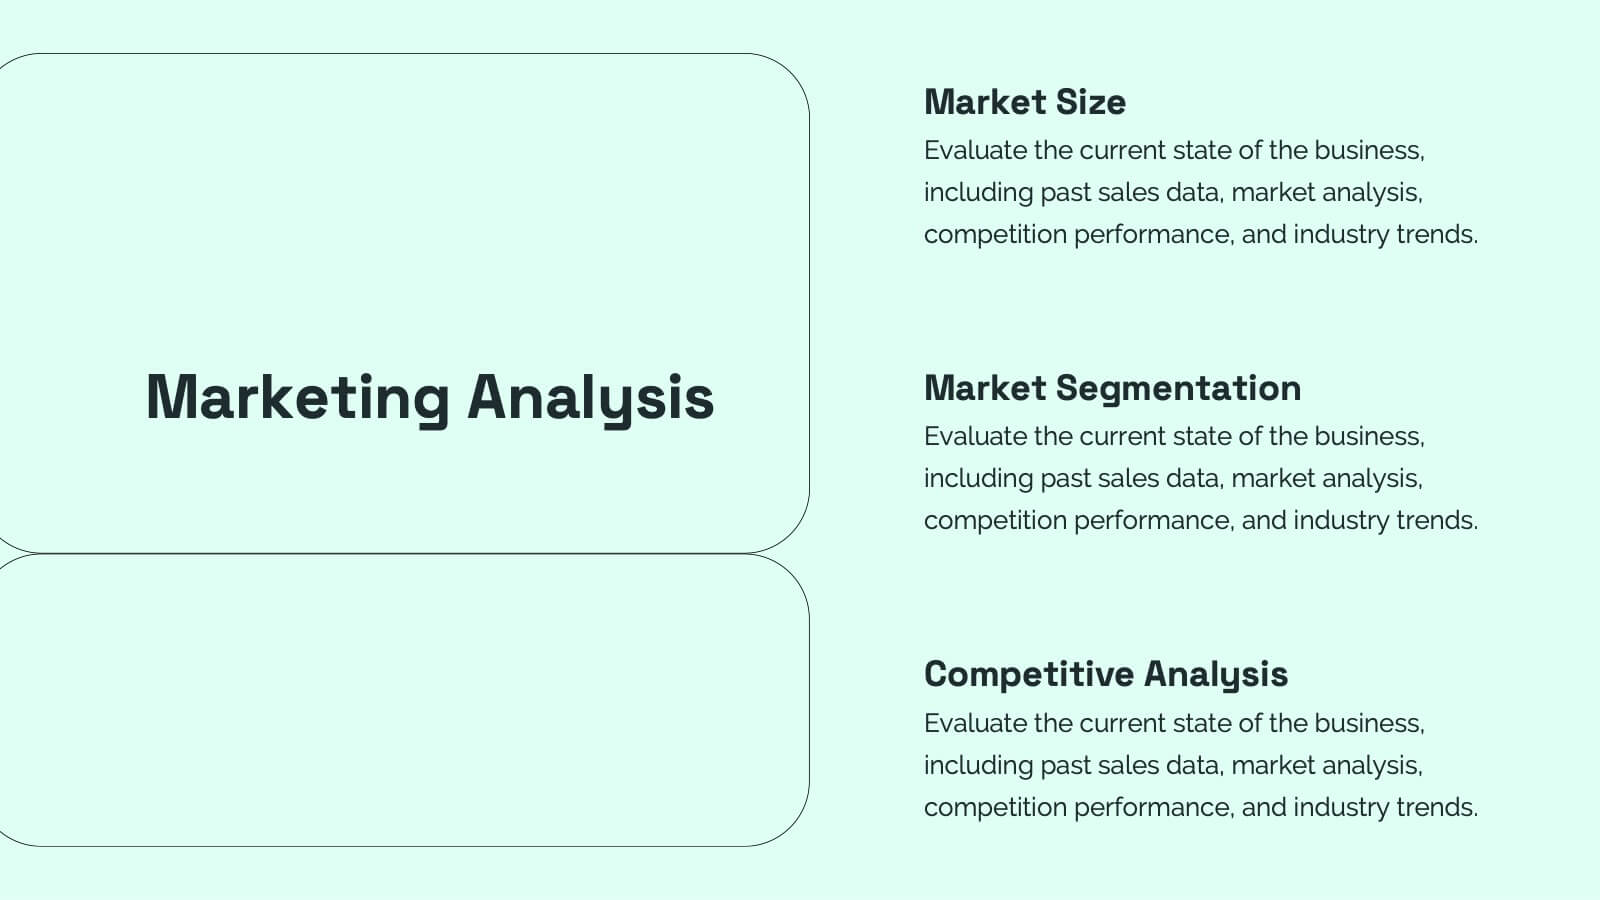
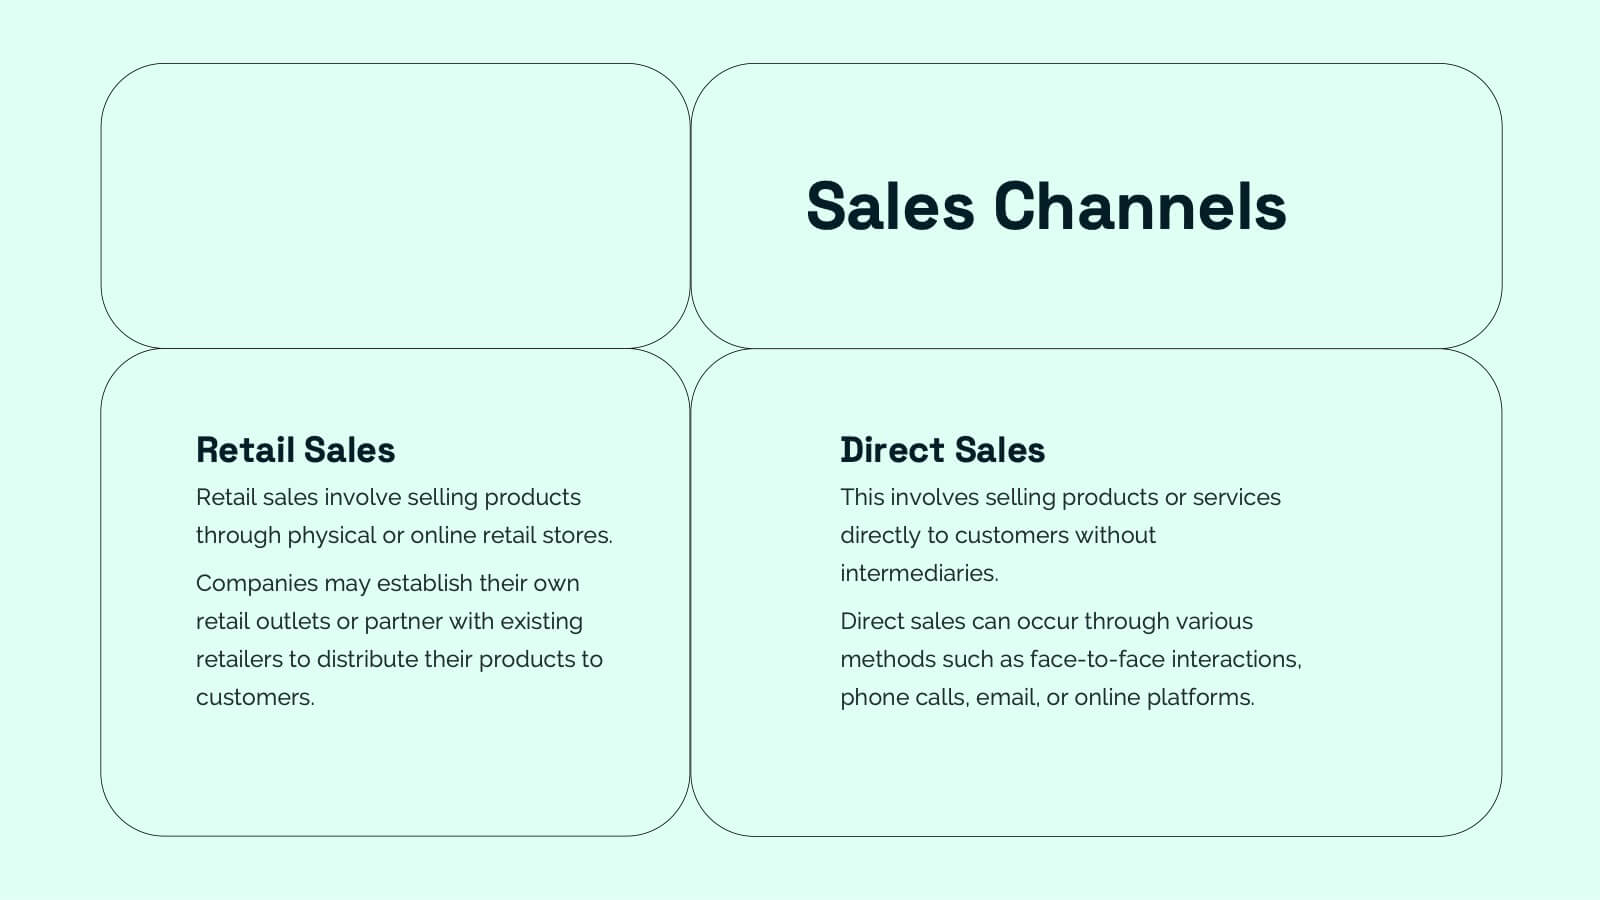
This startup pitch deck template covers all the essentials for presenting a business. It includes slides for mission and vision, business model, market analysis, value proposition, and financial overview. Easily customizable for any startup industry, this modern design makes presenting your ideas a breeze. Compatible with PowerPoint, Keynote, and Google Slides.


5 slides
Perspective of Economic Trends in Africa Map Presentation
Visualize key economic insights across Africa with this data-driven map layout. Use labeled progress bars and highlighted countries to present regional performance, sector growth, or market distribution. Fully editable in PowerPoint, Keynote, or Google Slides, this clean template is ideal for business reports, financial reviews, and investment-focused presentations.


6 slides
Business Challenges and Solutions Presentation
Address challenges with strategic solutions using this Business Challenges and Solutions template. Featuring a clear side-by-side layout, this design helps visualize business obstacles and their corresponding solutions for effective decision-making. Perfect for problem-solving discussions, strategy meetings, and brainstorming sessions, this template ensures your content remains structured and impactful. Fully customizable for PowerPoint, Keynote, and Google Slides.


6 slides
Organizational Change Management Strategy Presentation
Navigate organizational change effectively with this dynamic and structured presentation slide. Featuring a puzzle-piece design, this template visually represents the interconnected steps of change management. Ideal for business leaders, HR professionals, and consultants, it helps illustrate transition processes, strategic adjustments, and team alignment. Fully editable, allowing you to customize text, colors, and layout to fit your business needs. Compatible with PowerPoint, Keynote, and Google Slides for effortless use.


5 slides
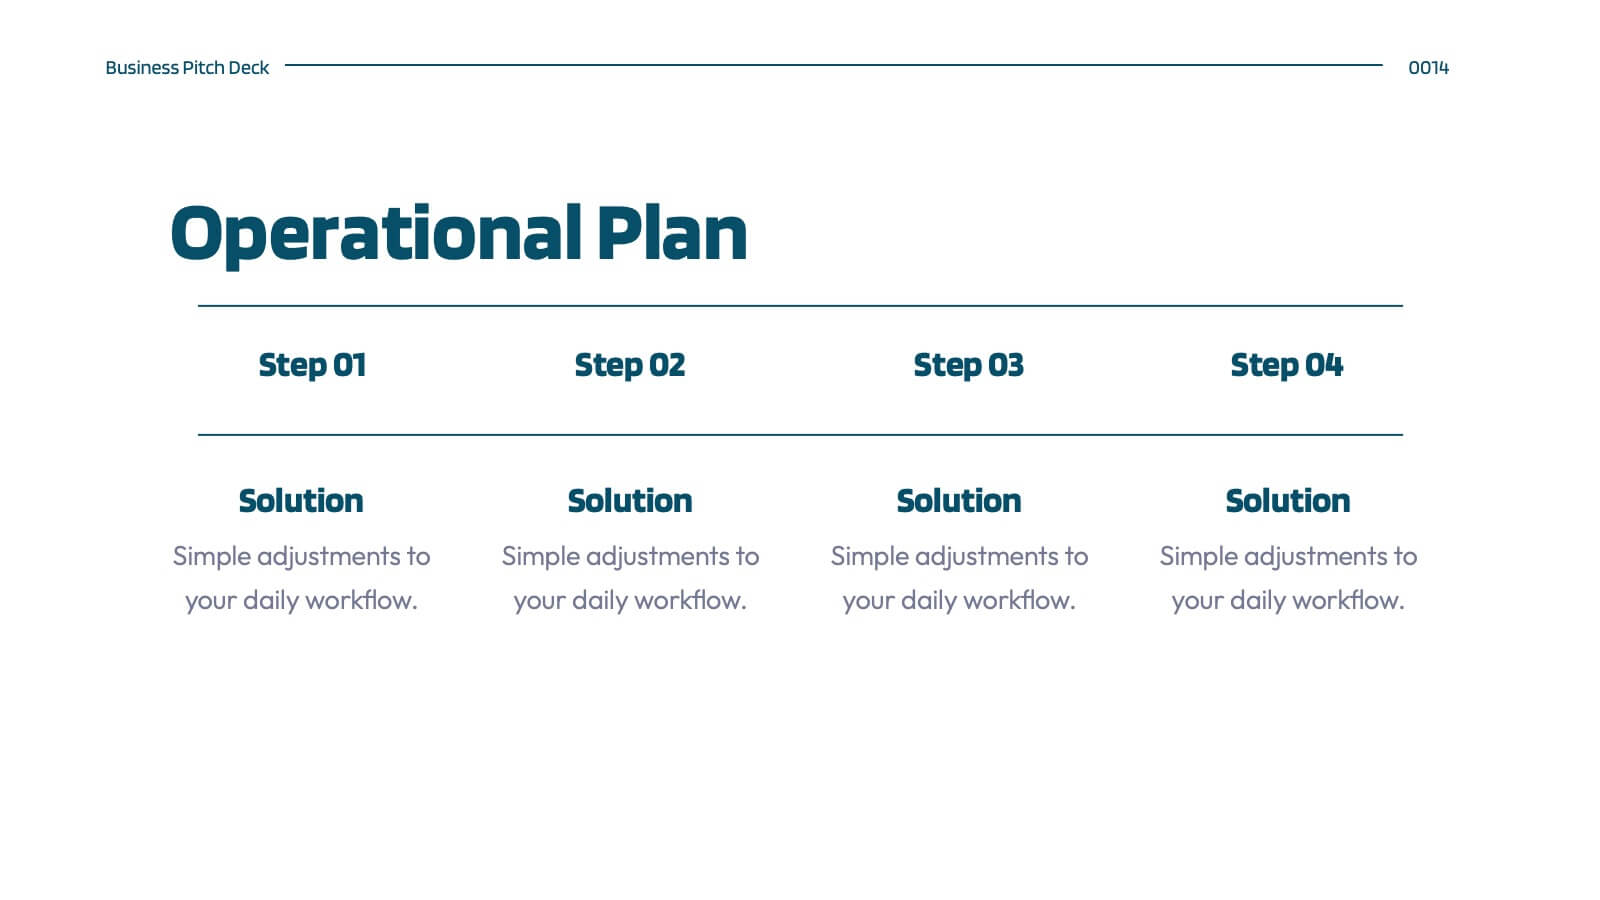
Operational Planning in 5 Key Steps Presentation
Present your operational roadmap with this dynamic 5-step arrow diagram. Each line represents a strategic input streamlined toward a unified goal. Ideal for workflows, business processes, or implementation plans. Fully editable in PowerPoint, Keynote, and Google Slides—perfect for team planning, operations meetings, and project execution strategies.


4 slides
Target Market Strategy Map Presentation
Bring your strategy to life with a bold visual that makes your target market impossible to miss. This presentation helps you outline customer priorities, growth opportunities, and key competitive insights in a clean, intuitive format that keeps teams aligned and focused. Fully compatible with PowerPoint, Keynote, and Google Slides.


5 slides
Watercolor Accent Style Template Presentation
Add subtle creativity to your slides with this Watercolor Accent Style Template. Ideal for timelines, progressions, or process visualization, this layout features numbered brushstroke segments in soft, hand-painted textures. Use it to highlight key points with elegance and clarity. Fully editable in PowerPoint, Google Slides, and Canva.


26 slides
Quantum Computing Presentation
Step into the future of technology with this fascinating presentation on quantum computing. Covering key concepts like quantum bits, superposition, entanglement, and real-world applications, this template helps simplify complex ideas for any audience. Fully customizable and compatible with PowerPoint, Keynote, and Google Slides for a seamless and insightful presentation experience.


6 slides
SEO Ads and Social Media Planning Presentation
Boost your online presence with the SEO, Ads, and Social Media Planning Presentation. This layout features engaging iconography and a central post mockup to highlight content strategy, paid advertising, engagement metrics, and platform-specific insights. Ideal for marketing teams and campaign proposals. Fully editable in PowerPoint, Keynote, and Google Slides.


4 slides
Current vs Future State Gap Presentation
Take your audience on a journey of progress with this dynamic slide, designed to clearly compare where things stand today and where they’re headed next. It helps highlight key gaps, improvement areas, and strategic opportunities with a simple, visual flow. Fully compatible with PowerPoint, Keynote, and Google Slides.

22 slides
Hellenic Small Business Pitch Deck Presentation
Unleash the spirit of entrepreneurship with this captivating Hellenic-themed presentation! Designed specifically for small business pitches, this template allows you to showcase your business concept, market analysis, and financial plans with elegance and clarity. Its vibrant visuals will engage your audience and leave a lasting impression. Compatible with PowerPoint, Keynote, and Google Slides.


6 slides
Business Revenue Break-Even Strategy
Visualize profitability with clarity using this dynamic break-even strategy template. Ideal for business analysts, finance teams, and consultants, this diagram highlights the balance between cost, loss, and profit at the break-even point. With intuitive icons and space for key metrics, it's fully editable in PowerPoint, Keynote, and Google Slides.


4 slides
Root Cause Problem Solving Presentation
Uncover insights with a clear, visual approach that makes complex issues easy to understand and communicate. This presentation guides audiences through identifying underlying problems, mapping causes, and highlighting solutions in a structured, memorable way. Clean icons and tree-based visuals keep your message engaging. Fully compatible with PowerPoint, Keynote, and Google Slides.


6 slides
Monthly Business Calendar Planning Presentation
Stay on top of your schedule with this clean and effective business calendar template. Designed for monthly planning, each slide features a weekly breakdown across Monday through Saturday, allowing you to map out initiatives, tasks, or events. Customize labels for meetings, milestones, or campaigns with color-coded weeks and neat icons for quick reference. Ideal for project managers, team leads, and small businesses. Fully editable in PowerPoint, Keynote, and Google Slides.


21 slides
Aetherial UX Research Report Presentation
A professional and modern template for UX research presentations. Highlight key elements such as user personas, journey mapping, wireframes, and testing processes. Includes slides for accessibility considerations, design systems, and feedback iteration. Fully customizable and compatible with PowerPoint, Keynote, and Google Slides to deliver impactful insights and research findings.


5 slides
Linear Business Process Flowchart Presentation
Visualize sequential processes with this clean linear flowchart layout. Ideal for workflows, decision-making steps, or procedural overviews. Featuring directional connectors and labeled shapes, this design keeps your message structured and easy to follow. Fully editable in PowerPoint, Keynote, or Google Slides—perfect for business processes, planning, and operations presentations.