


Features
- 10 Unique slides
- Fully editable and easy to edit in Microsoft Powerpoint, Keynote and Google Slides
- 16:9 widescreen layout
- Clean and professional designs
- Export to JPG, PDF or send by email


Do you have any questions?
Recommend


26 slides
Cassanra Presentation Template
Cassanra is a bold, professional template with a retro look. Its ravishing, modern aesthetic will stand out and grab your attention, while detailed design elements keep it readable. Packed with features like charts, timelines, and easy to edit text blocks, Cassanra is perfect for businesses as well as personal use. A mixture of bold colors are used to help keep the look appealing and easy to read. This template comes with a large amount of features from charts, timelines and an easy to edit text this template is perfect for businesses seeking to make an impression on their audience.


6 slides
Consumer Decision Infographic
Consumer decision-making refers to the process through which individuals make choices about purchasing goods or services. This infographic template visually represents the process that consumers go through when making purchasing decisions. This template can be used to serve as a valuable tool to help your audience understand the steps consumers go through before making a purchase. This infographic is designed to provide insights for businesses to tailor their marketing strategies accordingly. Fully customizable and compatible with Powerpoint, Keynote, and Google Slides. Include statistics and data to highlight trends in consumer behavior.


7 slides
Bowtie Risk Management Diagram Presentation
Visualize cause and consequence with a clean, symmetrical flow that simplifies complex risk scenarios. This presentation helps you illustrate threats, controls, and outcomes in one cohesive framework, making decision-making clear and impactful. Fully customizable and compatible with PowerPoint, Keynote, and Google Slides for professional risk analysis presentations.


4 slides
Concentric Circles Business Model
Bring your ideas full circle—literally—with this bold and colorful diagram layout! This infographic template is ideal for presenting layered concepts, interconnected systems, or customer journeys using a visually engaging concentric circle design. It’s fully customizable and works seamlessly in PowerPoint, Keynote, and Google Slides for a polished, professional look.


6 slides
Organizational Change Management Strategy Presentation
Navigate organizational change effectively with this dynamic and structured presentation slide. Featuring a puzzle-piece design, this template visually represents the interconnected steps of change management. Ideal for business leaders, HR professionals, and consultants, it helps illustrate transition processes, strategic adjustments, and team alignment. Fully editable, allowing you to customize text, colors, and layout to fit your business needs. Compatible with PowerPoint, Keynote, and Google Slides for effortless use.


6 slides
Employment Law Infographic
Employment law, also known as labor law, is a legal framework that governs the rights, responsibilities, and relationships between employers and employees in the workplace. This infographic template can be an effective way to convey key information about various aspects of employment law in a visually engaging manner. This template allows you to illustrate the importance of workplace safety regulations and the employer's responsibility to provide a safe working environment. The goal of this infographic is to educate and inform your audience about important aspects of employment law while maintaining a visually engaging and easily digestible format.


10 slides
Digital Transformation Strategy Presentation
The "Digital Transformation Strategy Presentation" template is designed to clearly showcase the stages of digital transformation initiatives. It features a visually appealing layout with concentric circles or varying targets that focus on key elements of transformation strategy. This format is ideal for emphasizing the progression from planning to execution and monitoring of digital strategies. Each section is distinctly colored and provides a space for succinctly labeled titles and detailed descriptions, making it perfect for presenting strategic initiatives, technology implementation, or progress metrics in corporate settings. The template ensures that complex strategies are communicated in an understandable and visually engaging manner.


7 slides
Science Research Infographic
Science research, is a systematic and organized inquiry that aims to generate new knowledge, validate existing knowledge, or solve specific problems using scientific methods and principles. This infographic template aims to present your science research initiatives, achievements, and vision to the audience in an engaging and informative way. This is essential to convey complex scientific data and discoveries in a visually appealing manner. Fully customizable and compatible with Powerpoint, Keynote, and Google Slides. Adapt and personalize the content to align with your specific research center's focus and mission.


5 slides
Geographic Distribution Heat Map Layout Presentation
Visualize regional trends at a glance with the Geographic Distribution Heat Map Layout Presentation. This template helps you showcase location-based performance, market presence, or demographic data across the U.S. using a clean gradient heat map. Ideal for sales reports, marketing reach, or expansion strategies. Fully editable in Canva, PowerPoint, Keynote, and Google Slides.


10 slides
HR Management Presentation
The HR Management Presentation template is expertly designed to communicate crucial aspects of human resource management. It features a visually engaging layout that systematically breaks down important HR elements such as recruitment, training, employee engagement, and performance metrics. Each section is clearly labeled and accompanied by intuitive icons that aid in quick comprehension, making it an ideal choice for HR professionals aiming to present complex data in an accessible format. This template enhances audience engagement through its structured presentation of information, focusing on strategic management within HR. It is perfectly suited for showcasing HR strategies, policy updates, or organizational improvements in a clear and effective manner.


3 slides
Stock Market Investment Analysis Presentation
Unlock the secrets of the stock market with our "Stock Market Investment Analysis" presentation templates. Ideal for financial analysts and investors, these templates provide a clear framework for analyzing trends and making informed decisions. With easy-to-edit elements and professional design, they are perfect for delivering compelling investment insights. Compatible with PowerPoint, Keynote, and Google Slides, they ensure your analysis looks sharp and persuasive across all platforms.


8 slides
Vision-Oriented Goal Roadmap Presentation
Achieve alignment with the Vision-Oriented Goal Roadmap Presentation. Featuring a clear bullseye target and directional arrows, this layout highlights priority goals and action steps. Perfect for strategic planning, leadership briefings, or team objectives. Easily editable in PowerPoint, Keynote, and Google Slides to match your brand and vision.


6 slides
Eco-Friendly Operations and Compliance
Promote sustainable practices with the Eco-Friendly Operations and Compliance Presentation. This sleek, leaf-themed diagram is perfect for showcasing environmentally responsible workflows, green policies, or ESG initiatives. Designed to visually align with eco-branding, it's easy to customize in PowerPoint, Keynote, or Google Slides. Ideal for internal teams or client presentations.
19 slides
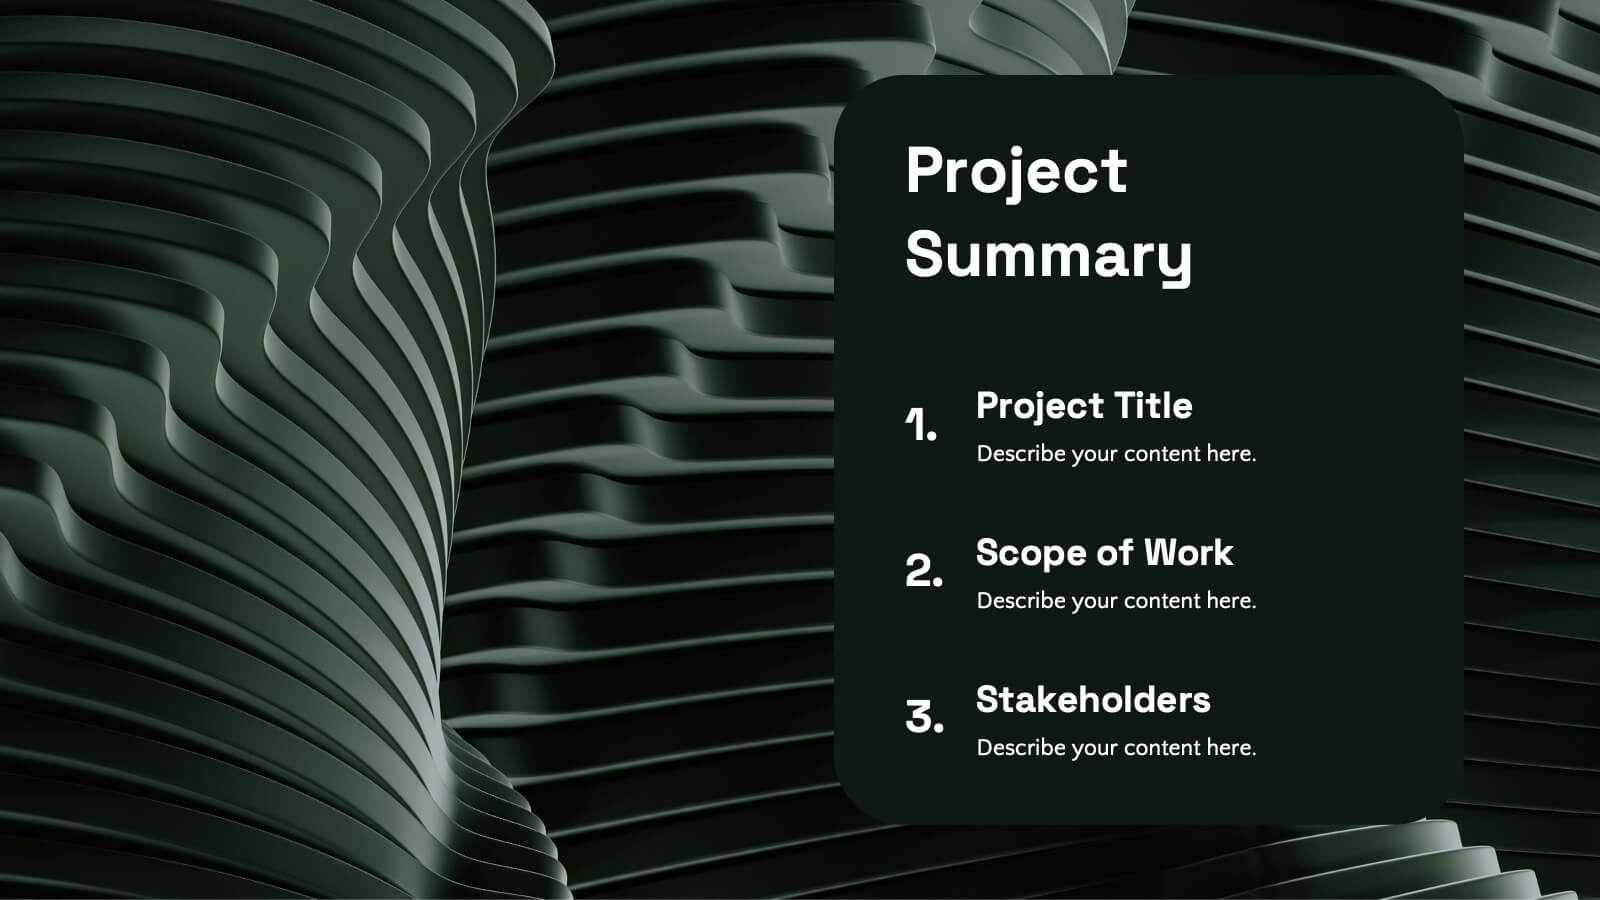
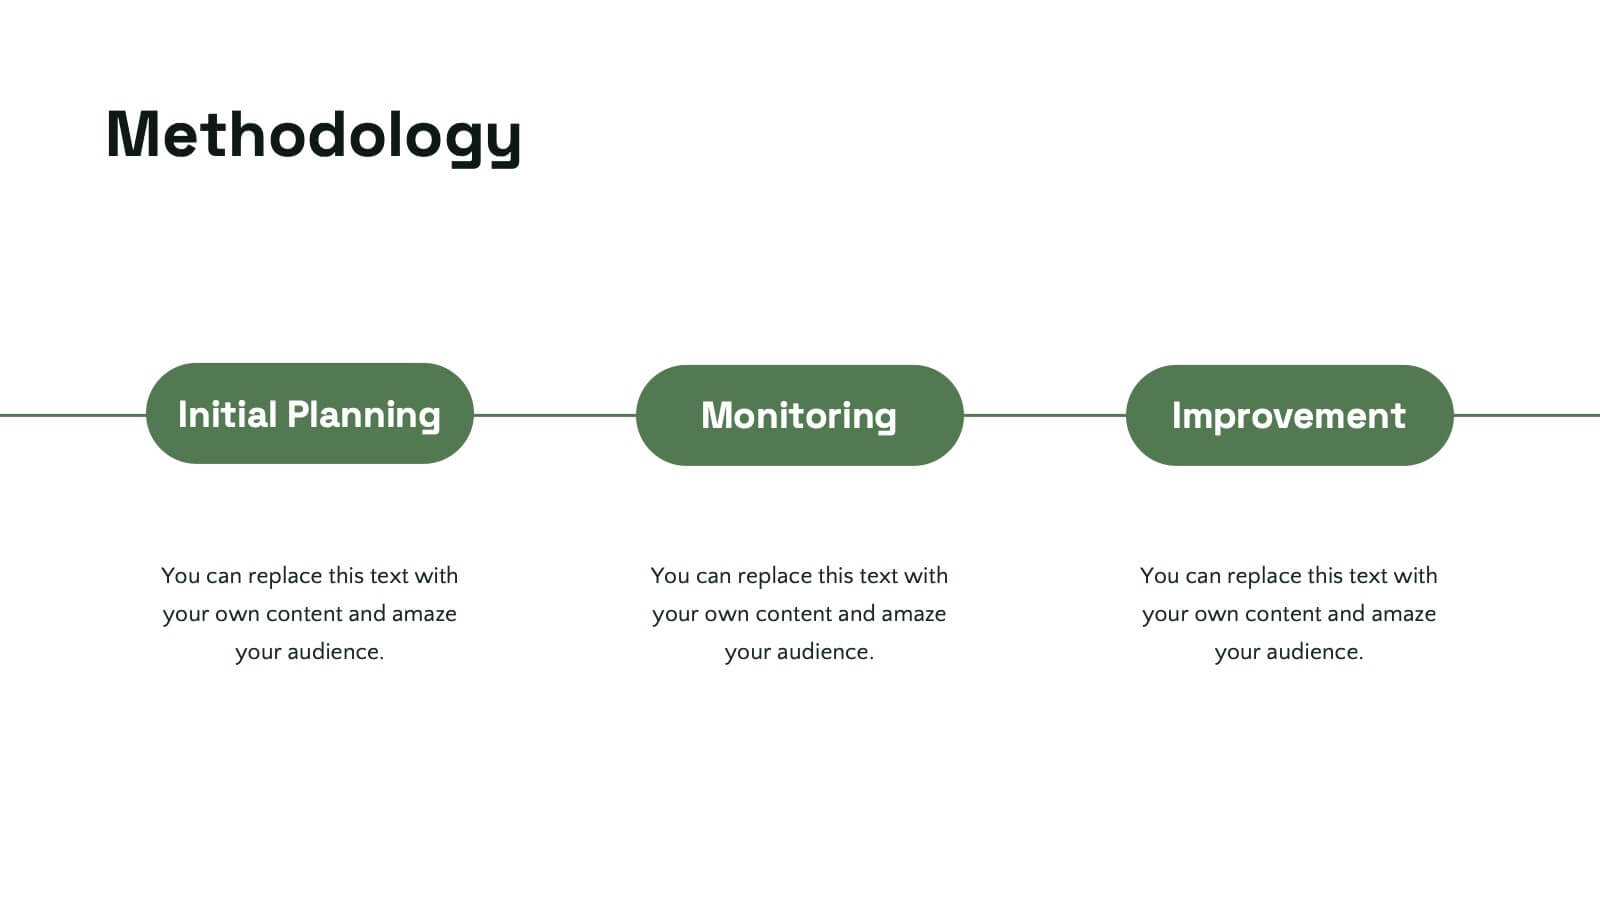
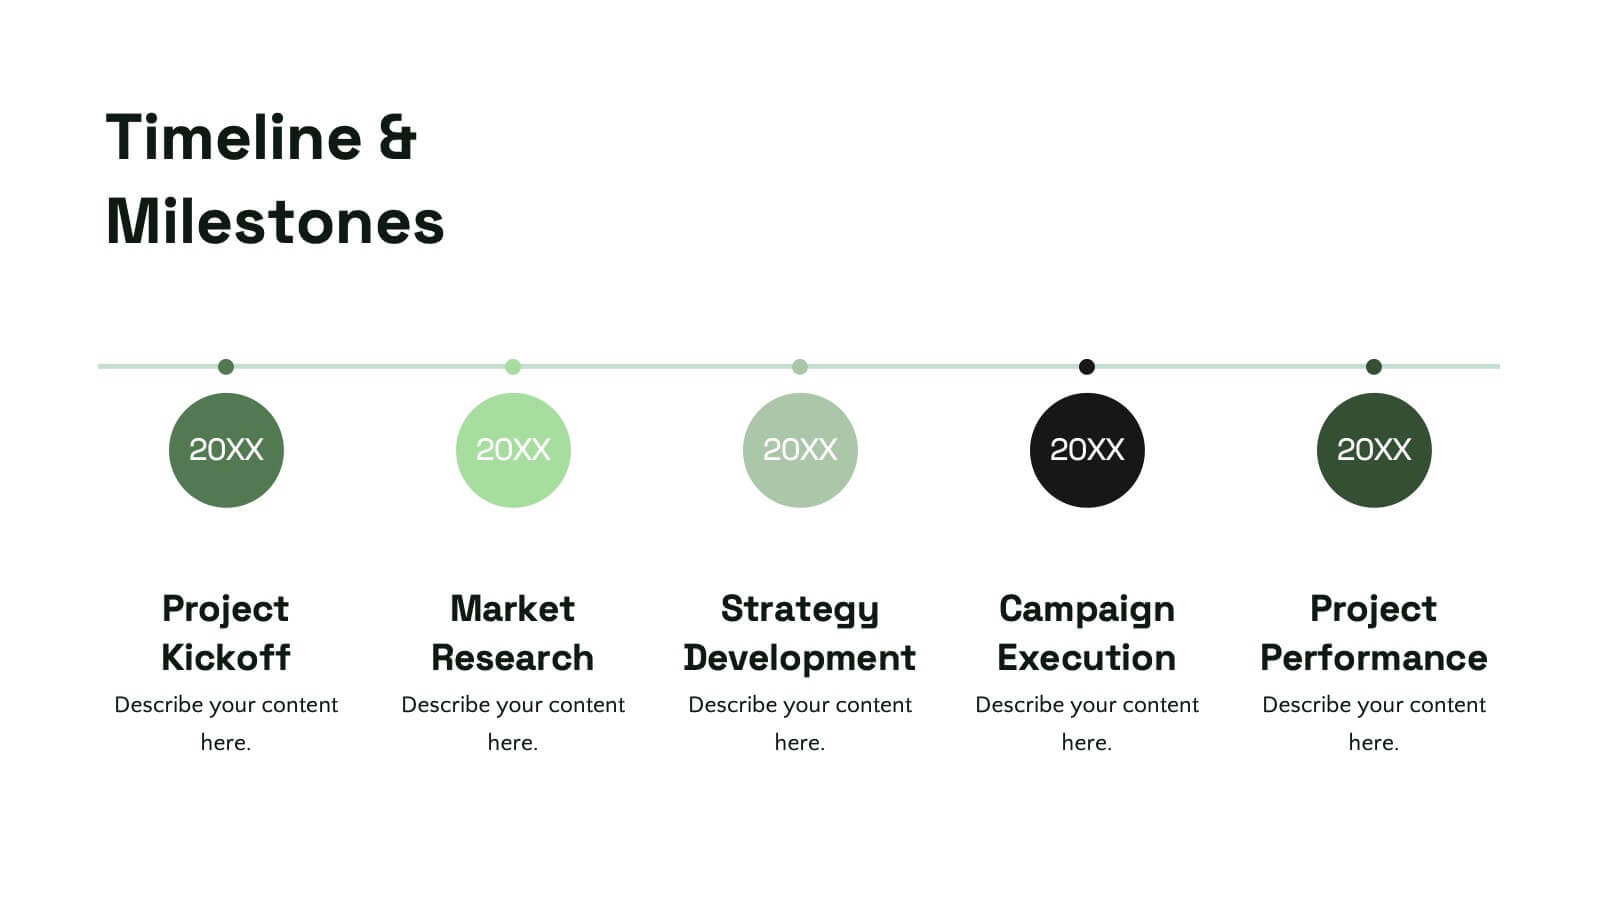
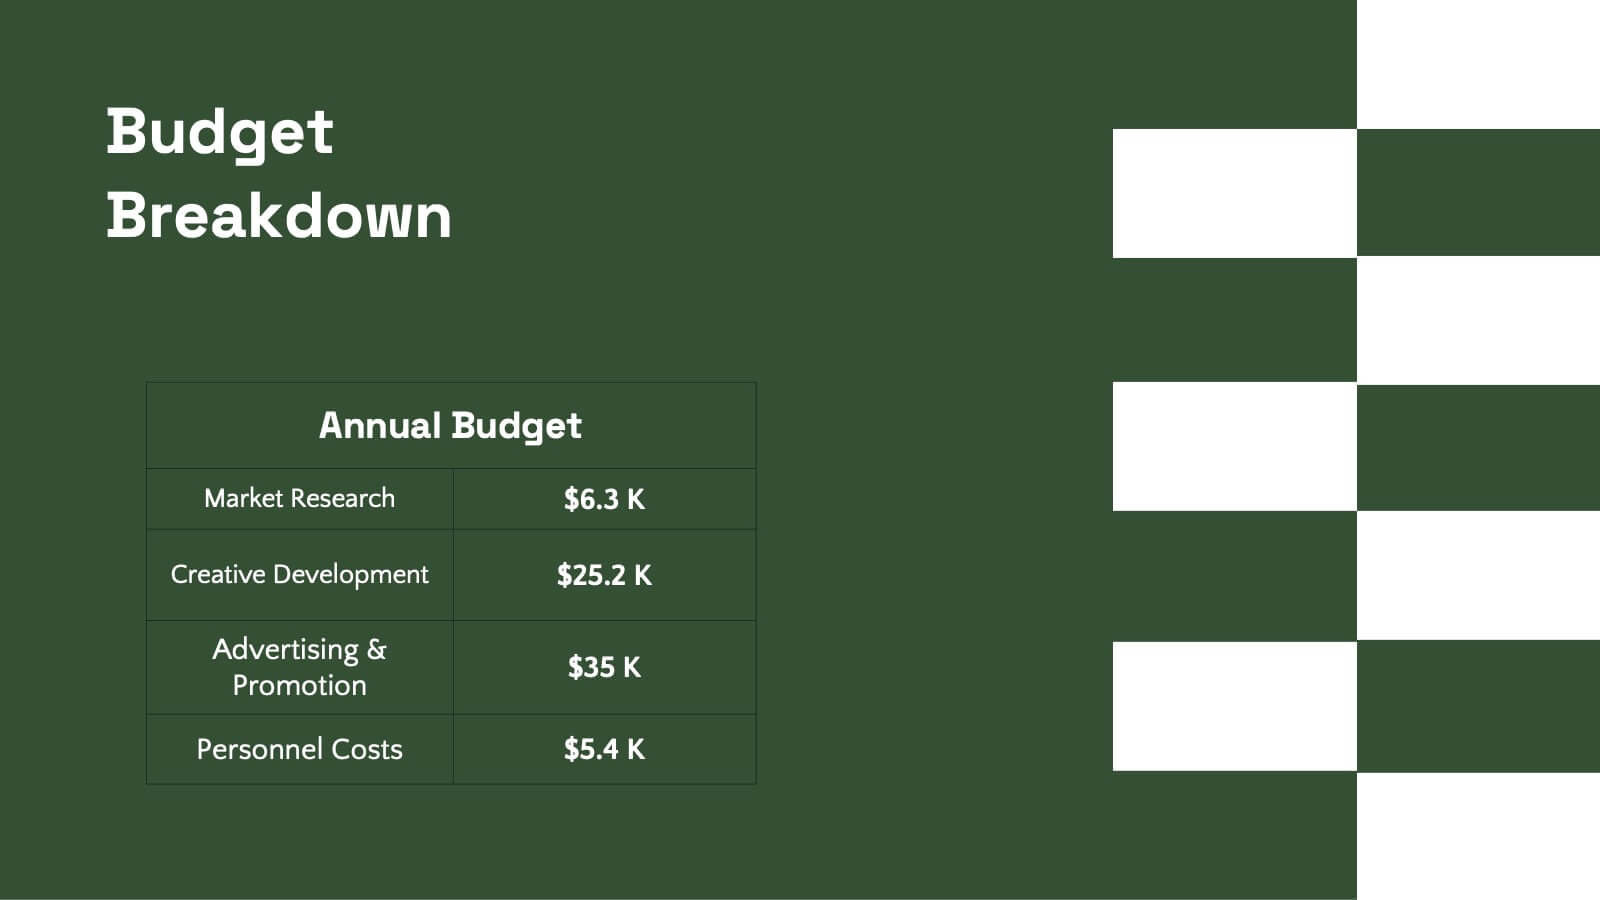
Tidal Design Proposal Presentation
Elevate your pitch with this sleek design proposal template! Perfect for presenting project details, objectives, methodology, and milestones, it ensures your ideas stand out. Impress stakeholders with clear, structured slides and professional aesthetics. Compatible with PowerPoint, Keynote, and Google Slides for a seamless presentation experience across all platforms.


7 slides
Digital Marketing Infographics Presentation Template
Digital marketing is essential for your business and brand awareness. From website design to social media advertising, learn about all the ways digital marketing can help grow your company with this template. Digital marketing can be a powerful and effective way to promote your business.


10 slides
Medical Anatomy Overview Presentation
Bring your audience into the world of medical insight with a slide that makes anatomy feel clear, modern, and easy to follow. This presentation highlights key organs and body systems in a clean visual layout, helping you explain health data with confidence. Fully compatible with PowerPoint, Keynote, and Google Slides.


12 slides
6-Step Timeline Presentation
Visualize milestones effortlessly with this 6-Step Timeline template. Ideal for project planning, business strategies, and process tracking, this fully customizable timeline offers a clear, structured layout. Easily adjust text, colors, and elements to match your branding. Compatible with PowerPoint, Keynote, and Google Slides for seamless integration.