


Features
- 10 Unique slides
- Fully editable and easy to edit in Microsoft Powerpoint, Keynote and Google Slides
- 16:9 widescreen layout
- Clean and professional designs
- Export to JPG, PDF or send by email


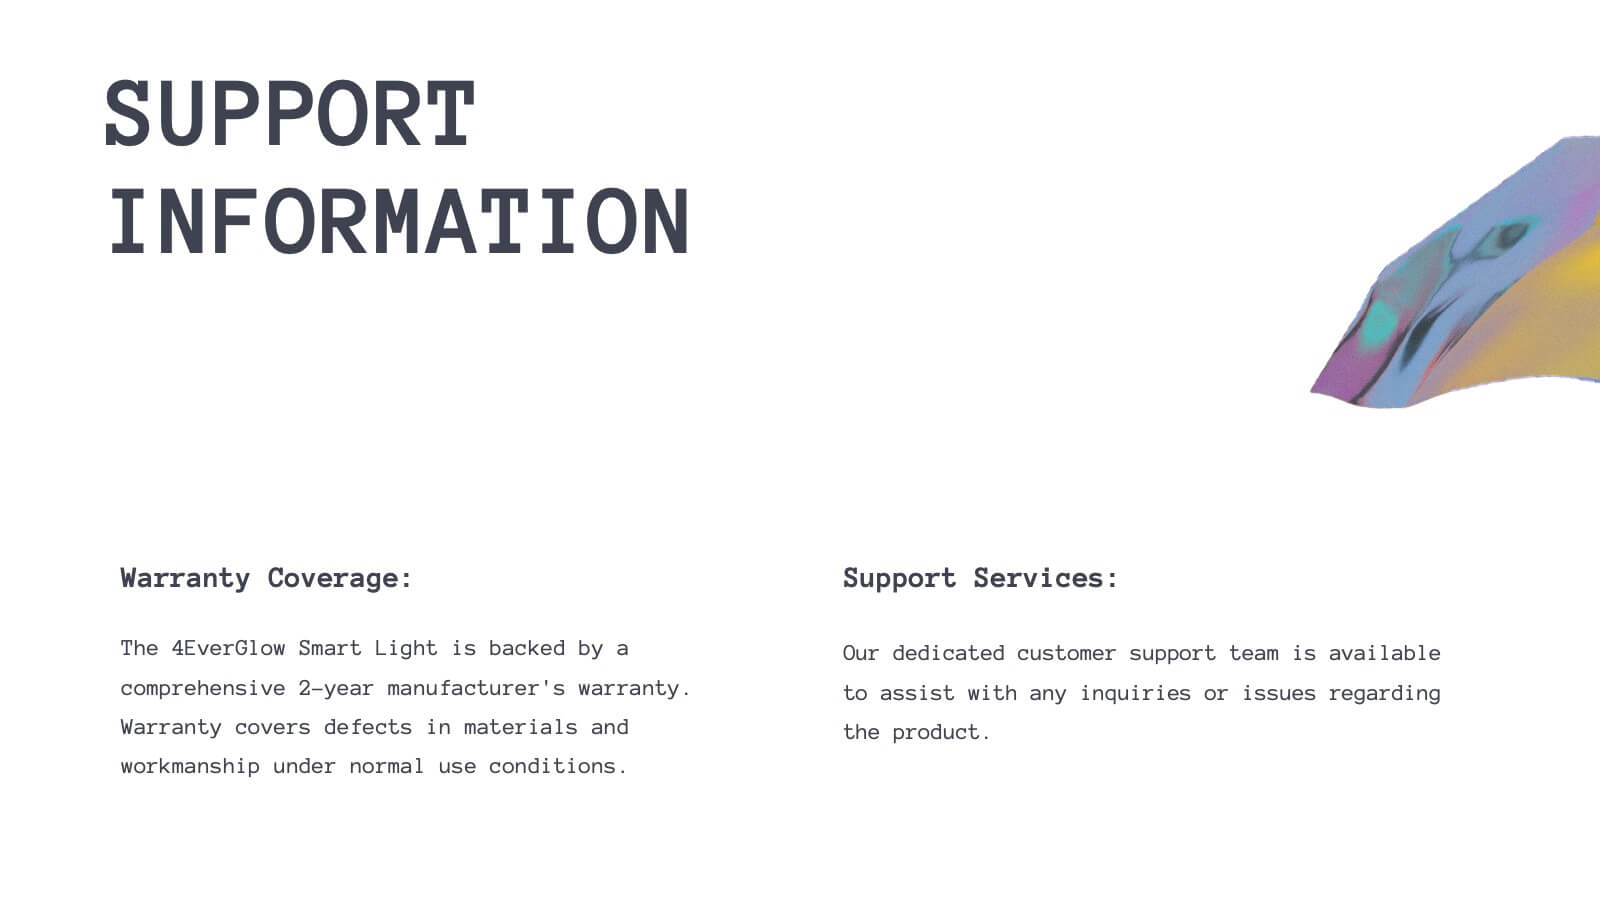
Do you have any questions?
Recommend


6 slides
Corporate Hierarchy Structure
Visualize your organization’s leadership and team structure with this clean, modern hierarchy chart. Ideal for corporate overviews, HR planning, or team introductions in company profiles and proposals. Fully editable in PowerPoint, Keynote, and Google Slides.


21 slides
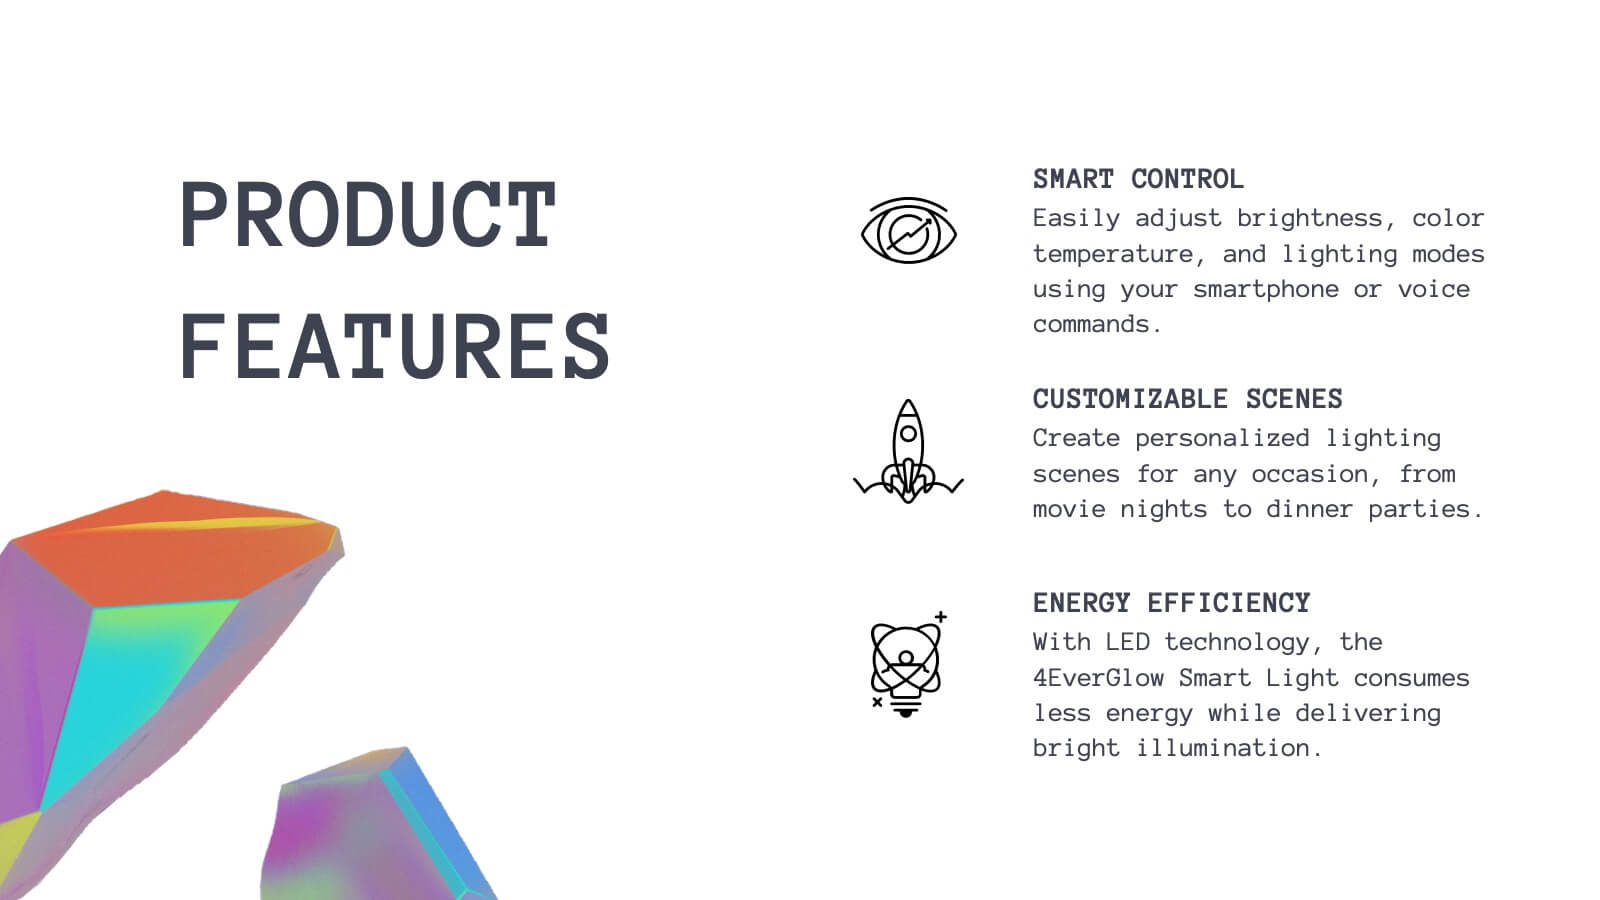
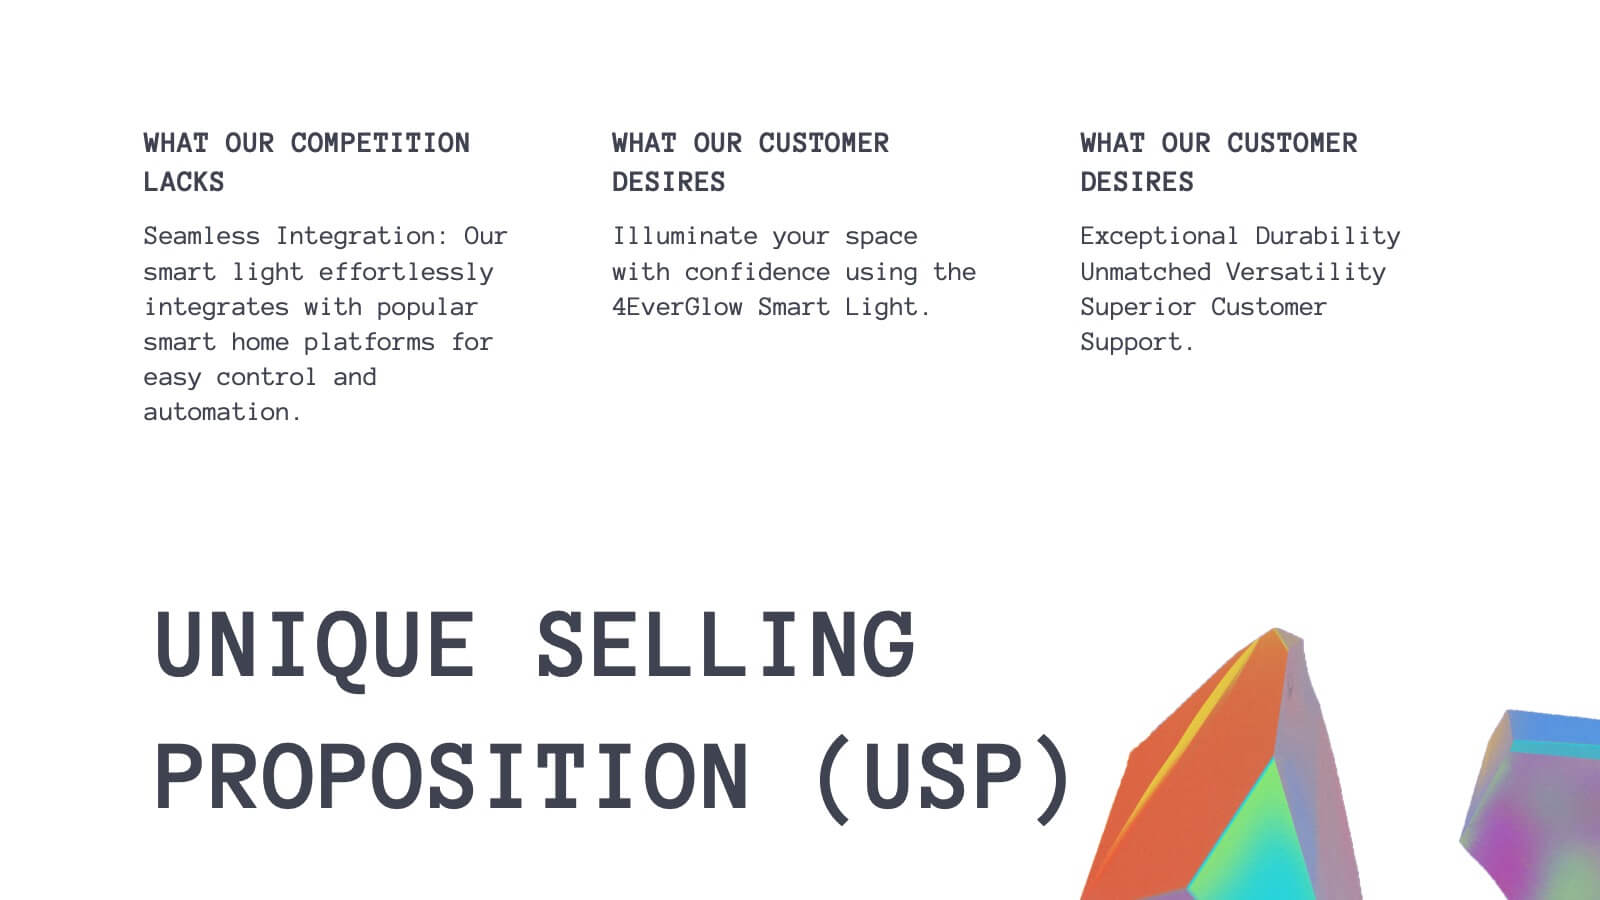
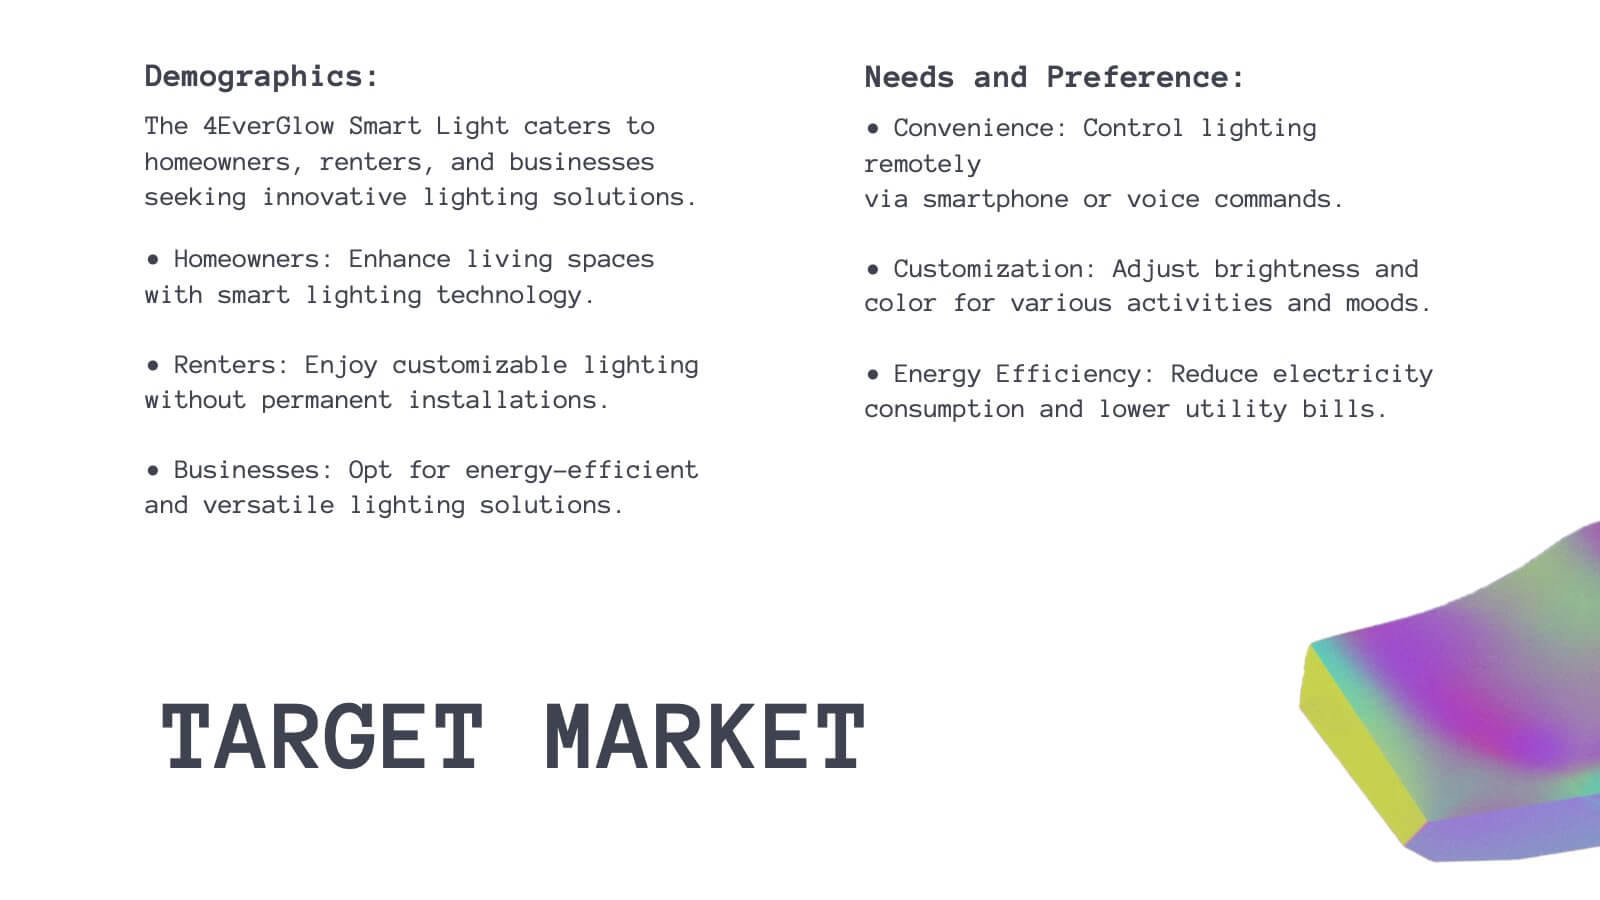
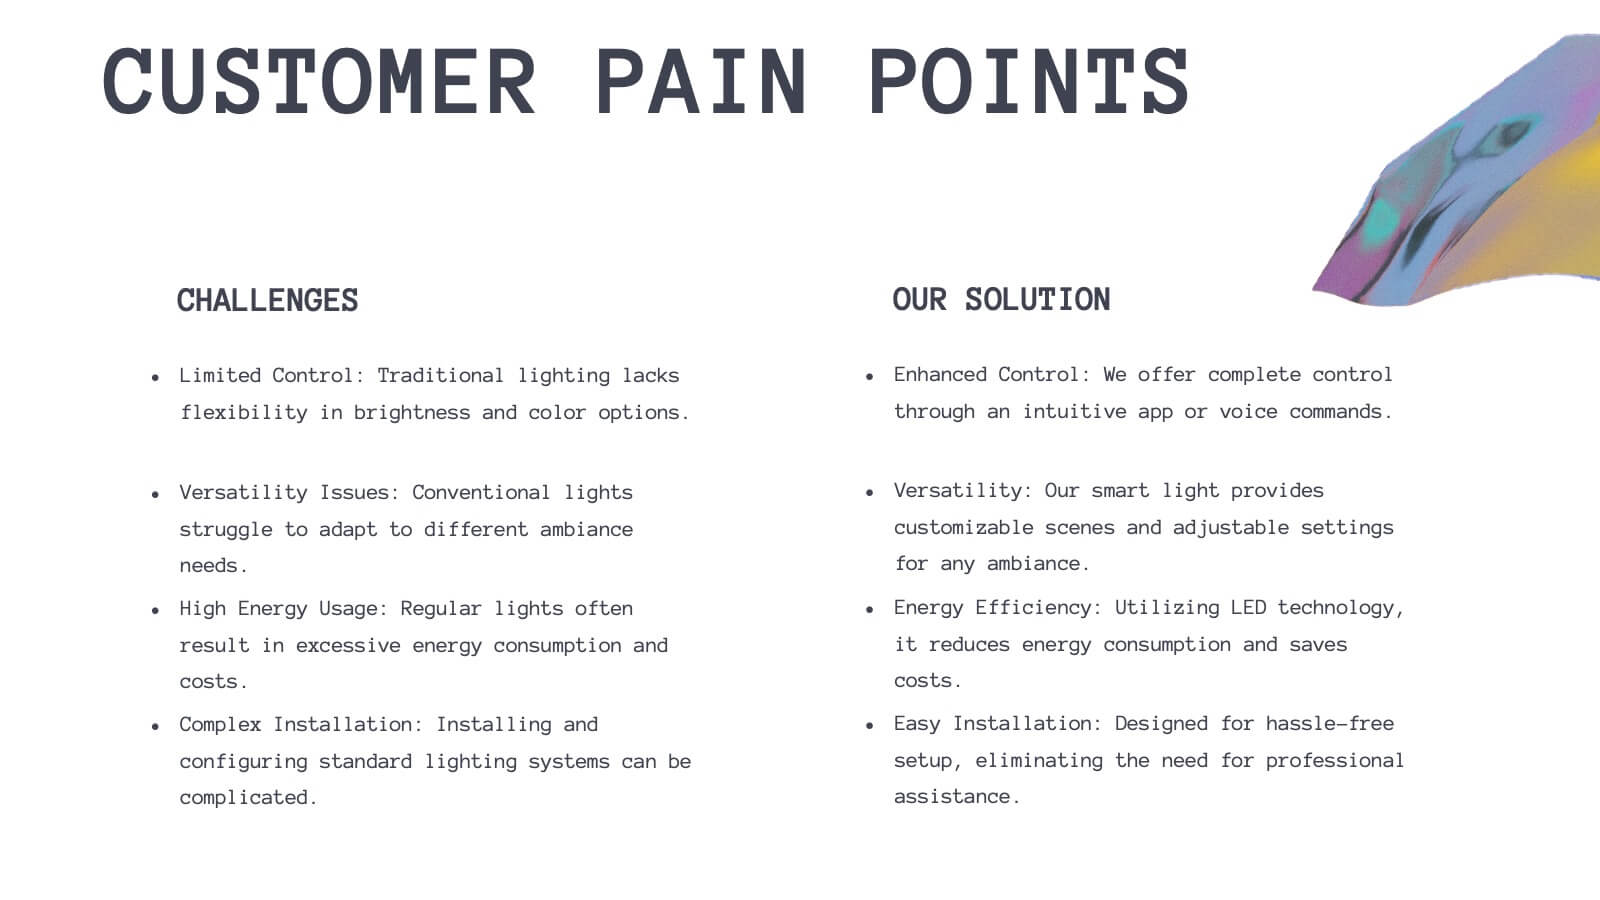
Luster Product Roadmap Presentation
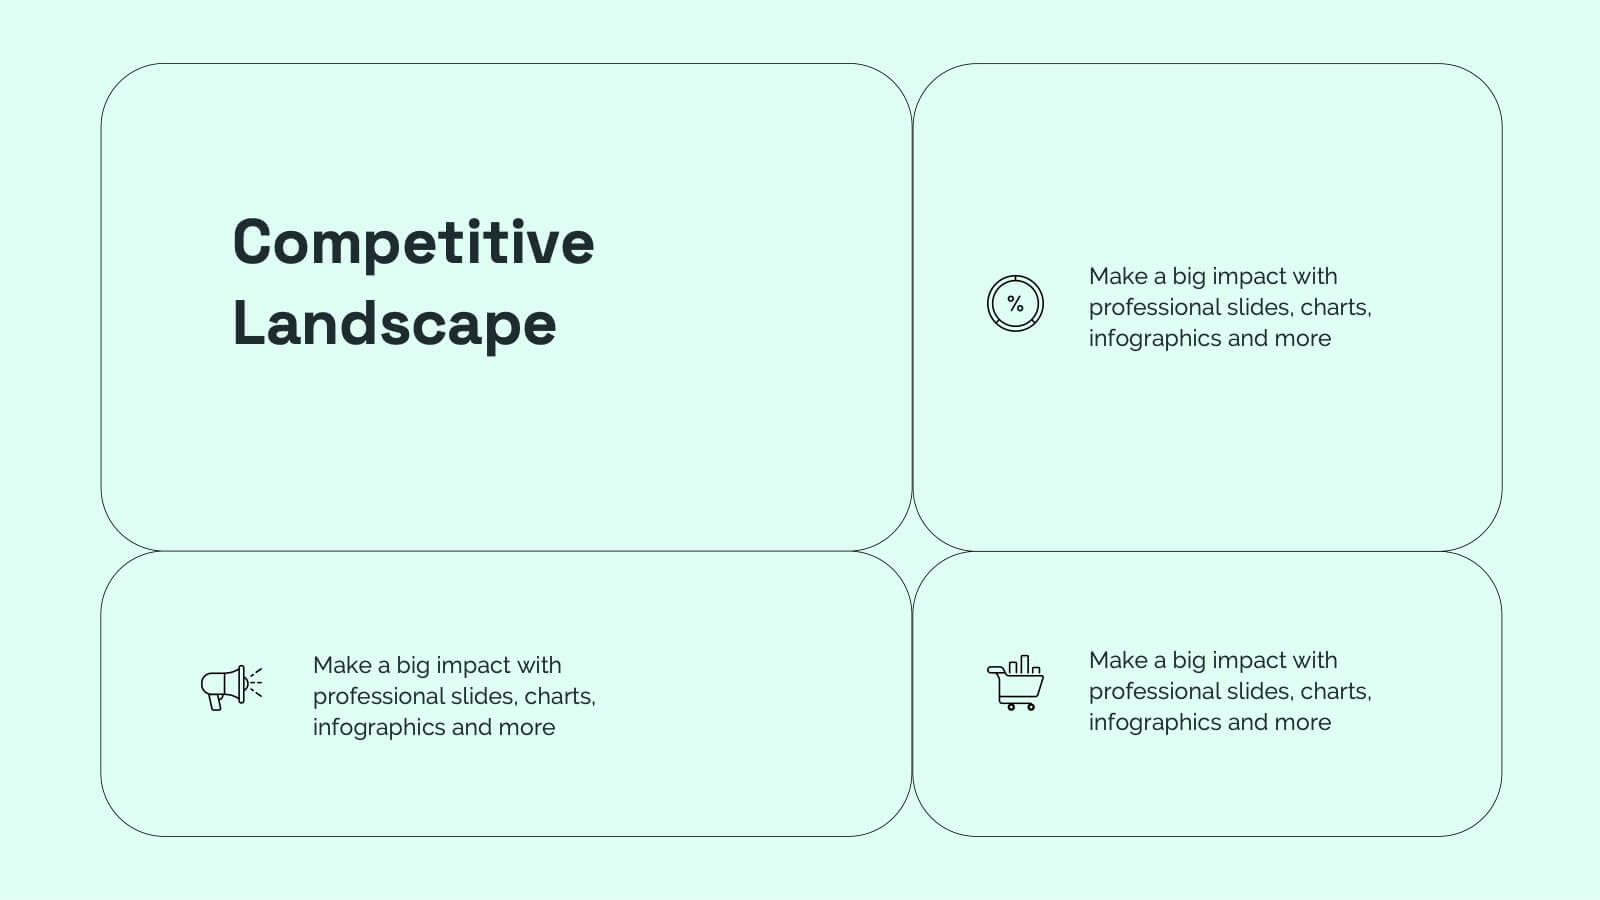
Bring your product journey to life with this vibrant, modern presentation template! Perfect for guiding your audience through product features, customer pain points, and competitive analysis, it’s designed for maximum clarity and engagement. Whether you’re showcasing technical specs or marketing strategies, this template fits all your needs. Compatible with PowerPoint, Keynote, and Google Slides.


7 slides
Urban Ecology Illustrated Infographics
Ecology is the scientific study of the interactions between organisms and their environment. This ecology template will help you explain the science behind our world. This is great for anyone who is presenting information about ecology, environment, or sustainability. You can use this infographic as is or customize it by changing the colors and fonts of each slide. You can also add your own images, and text by downloading in Powerpoint, Keynote, or Google Slides. This Template comes with a wealth of key facts and figures on eco-friendly living and presents them in an infographic style.


6 slides
Statistics and Figures Report Presentation
Present complex data with clarity using the Statistics and Figures Report Presentation template. Featuring scatter plots, radar charts, and key metric highlights, this template is perfect for performance tracking, analytics reports, and business reviews. Fully customizable for PowerPoint, Keynote, and Google Slides, it ensures professional and insightful data visualization.


6 slides
Constructive Feedback Infographics
Improve your feedback processes with our Constructive Feedback infographic template. This template is fully compatible with popular presentation software like PowerPoint, Keynote, and Google Slides, allowing you to easily customize it to illustrate and communicate the principles of providing effective constructive feedback. The Constructive Feedback infographic template offers a visually engaging platform to outline the key elements of delivering feedback that promotes growth and improvement. Whether you're a manager, team leader, educator, or simply interested in enhancing your feedback skills, this template provides a user-friendly canvas to create informative presentations and educational materials. Optimize your feedback delivery with this SEO-optimized Constructive Feedback infographic template, thoughtfully designed for clarity and ease of use. Customize it to showcase the importance of specific, actionable, and balanced feedback, helping you enhance communication and drive positive change within your team or organization. Start crafting your personalized infographic today to become more proficient in providing constructive feedback.


8 slides
Business KPI Dashboard Presentation
Track performance at a glance with the Business KPI Dashboard Presentation. This clean, professional layout includes a speedometer-style gauge and monthly bar chart to showcase progress, goals, or metrics clearly. Ideal for reporting, analysis, or executive summaries. Fully editable and compatible with PowerPoint, Keynote, and Google Slides.


4 slides
Breast Cancer Awareness Campaign Presentation
Raise awareness with impact using the Breast Cancer Awareness Campaign Presentation. This visually engaging design uses symbolic visuals to highlight key messages, educate audiences, and inspire action. Perfect for nonprofit initiatives, educational sessions, or health campaigns. Fully editable in PowerPoint, Google Slides, Keynote, and Canva for easy customization.


6 slides
Product Mockup Infographic
Showcase your products with unparalleled clarity using this collection of product mockup templates. Designed for versatility and impact, each template provides a vivid representation of your products on various digital devices, emphasizing detail and design with a polished, professional finish. These mockups are ideal for demonstrating the user interface and user experience aspects of digital products like apps, websites, and software. The templates feature intuitive layouts and a harmonious blend of colors that enhance the visual appeal while keeping the focus on your product's features. Customize each mockup with your own screenshots and descriptions to create a compelling presentation that speaks directly to your audience's needs. Ideal for tech startups, software developers, and digital marketers, this collection helps you communicate the value of your products in a straightforward yet captivating manner, whether for client presentations, marketing materials, or investor pitches.


4 slides
Colorful Workflow Process Chart Presentation
Bring your workflow to life with a vibrant, easy-to-follow layout that makes every stage feel connected and purposeful. This presentation helps you map processes, explain team roles, and simplify complex steps using a clean, visual flow. Fully compatible with PowerPoint, Keynote, and Google Slides.


5 slides
SEO Strategies Infographics
Immerse yourself in the dynamic world of digital marketing with our SEO strategies infographics. Rendered in bold black, vibrant orange, and various eye-catching colors, this creative and vertical template serves as a beacon for marketing professionals, digital strategists, and entrepreneurs who aim to conquer the digital space. Each element, from engaging graphics to interpretative icons, is specifically tailored to present SEO methodologies with clarity and charisma. This infographic template is not only a visual treat but a reservoir of insights, facilitating users to communicate influential SEO tactics effectively and drive their brand's online visibility forward.


5 slides
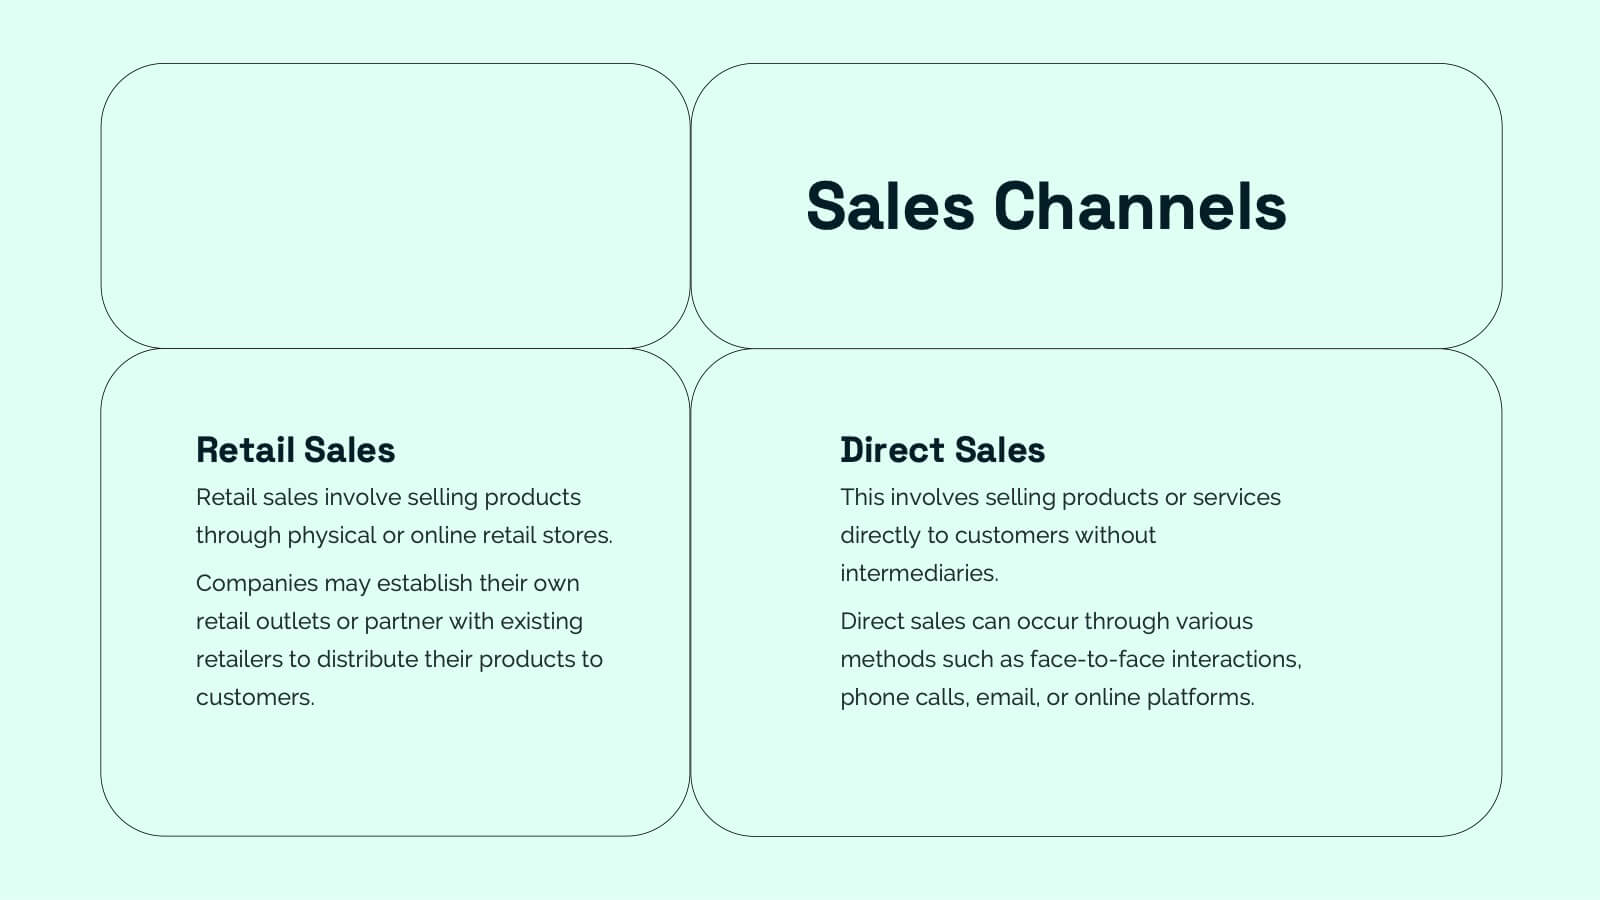
Business Process Workflow Presentation
Make your business processes crystal clear with this streamlined, modern layout. Designed to visualize every stage from start to success, this presentation helps communicate progress, efficiency, and key actions with precision. Perfect for business planning or reporting, it’s fully compatible with PowerPoint, Keynote, and Google Slides for easy customization.


7 slides
Project Stakeholder Analysis Infographic
Stakeholder analysis is a technique used in project management and organizational strategy to identify and understand the interests, influence, and impact of individuals or organizations that can significantly affect or be affected by a project or decision. This infographic template is your compass to navigating the intricate landscape of stakeholders, understanding their influence, and engaging them effectively for project success. Compatible with Powerpoint, Keynote, and Google Slides. The vibrant design and strategic insights of our template will empower you to navigate the stakeholder cosmos and steer your project towards triumph.


22 slides
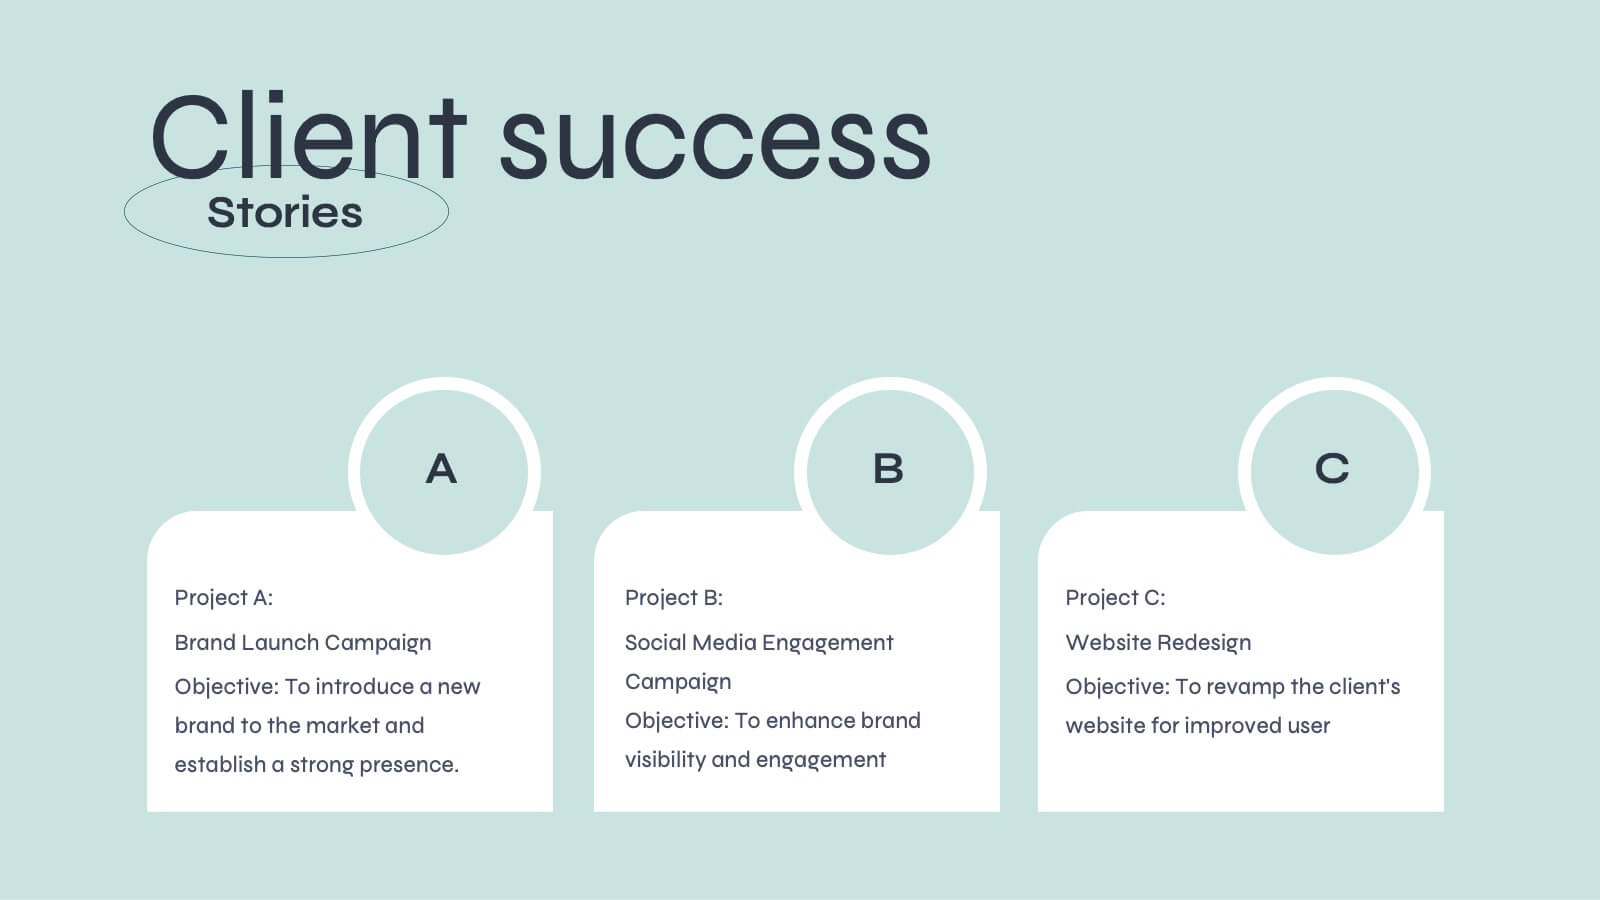
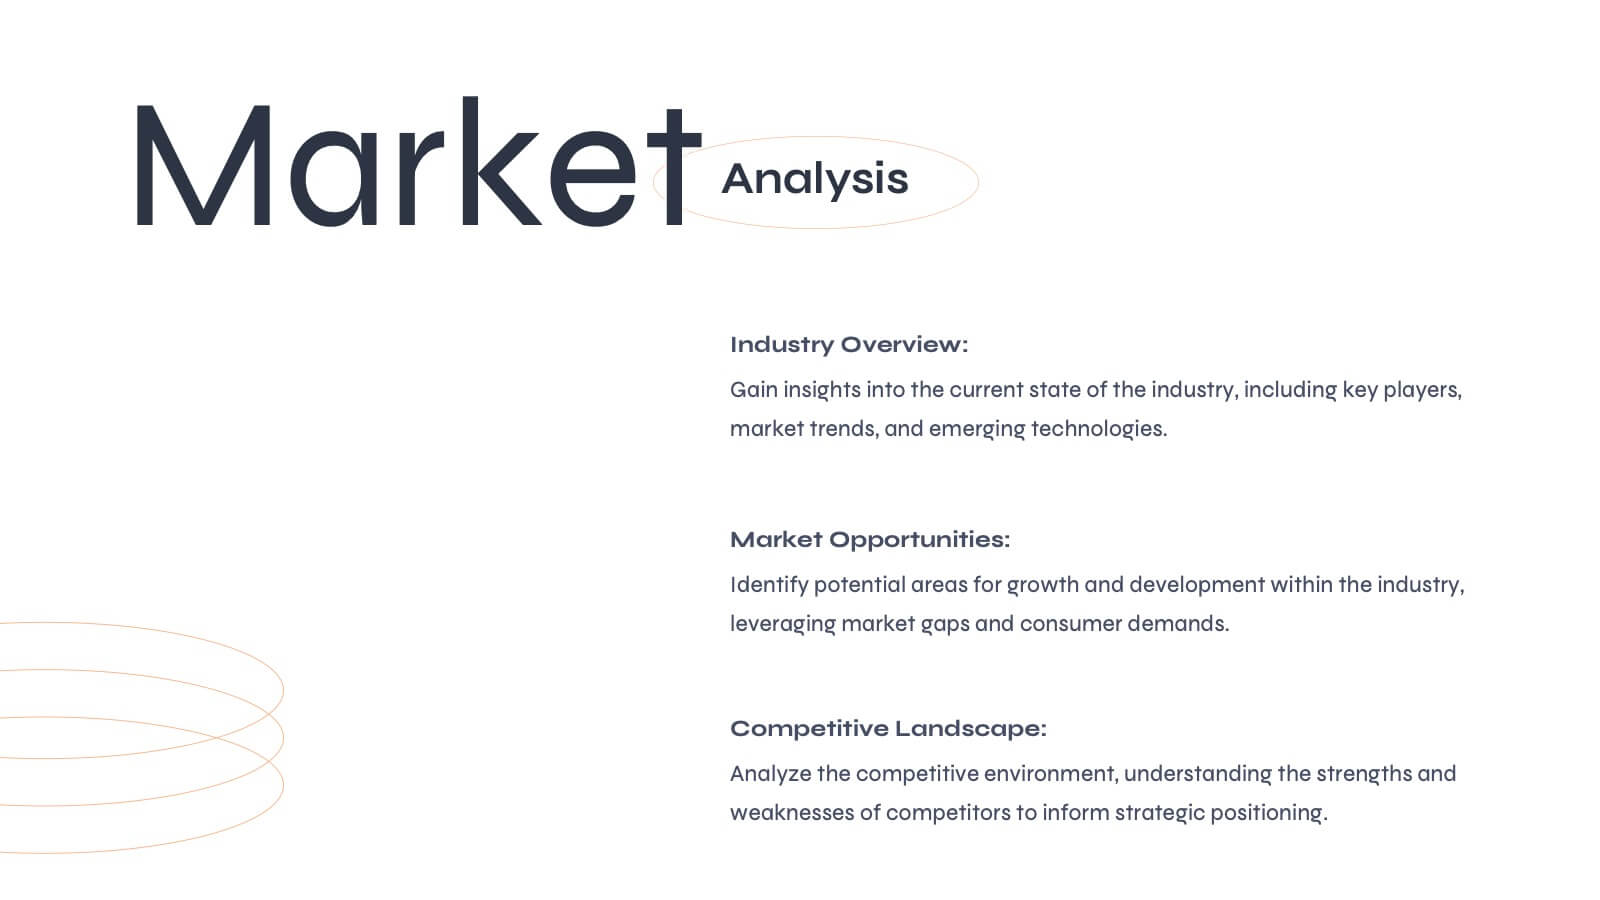
Aurora Agency Portfolio Presentation
Showcase your agency's strengths with this polished, modern presentation template. Perfect for presenting market analysis, client success stories, and creative processes, it features a clean and professional design. Highlight your team's expertise and strategic approach to impress potential clients. Compatible with PowerPoint, Keynote, and Google Slides, it ensures seamless presentations on any platform.


7 slides
Watercolor Strategy Infographic
Dive into a cascade of strategic insights with our watercolor strategy infographic. Presented on a crisp white canvas, the splash of yellow, green, and blue emanates a fluidity that mirrors the dynamic nature of business strategies. Each hue merges seamlessly to provide a visual treat while retaining the core informational value. Tailored for Powerpoint, Keynote, and Google Slides, this template is embellished with customizable graphics, intricate icons, and flexible image placeholders, making it an ideal choice for any strategic visualization. Let your strategy flow, vivid and vibrant, just like watercolors on paper.


21 slides
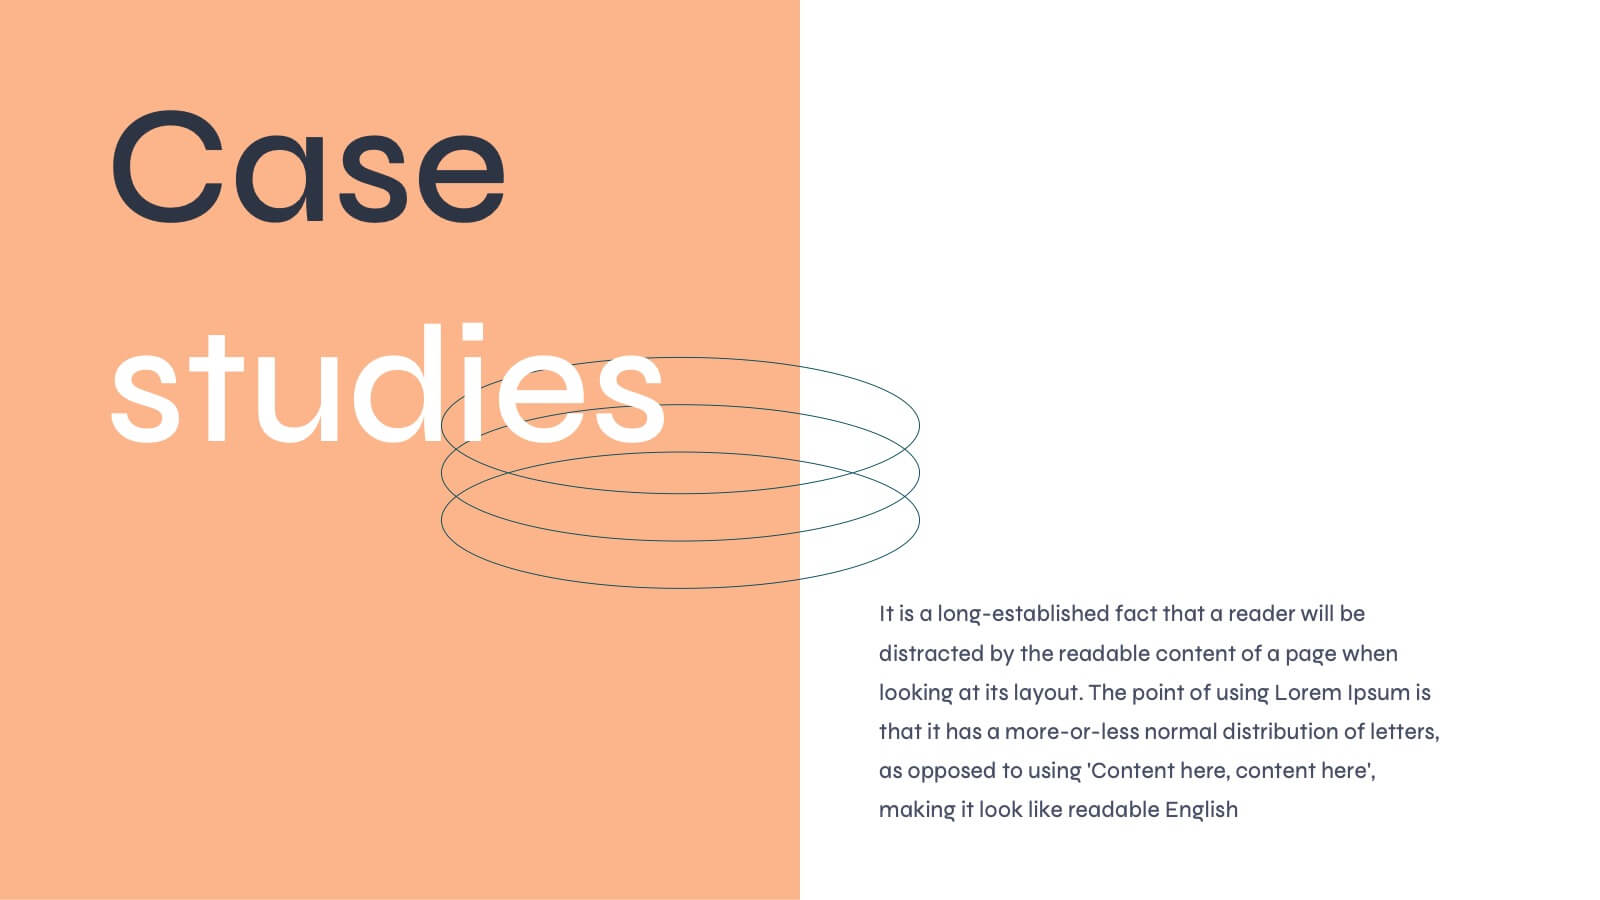
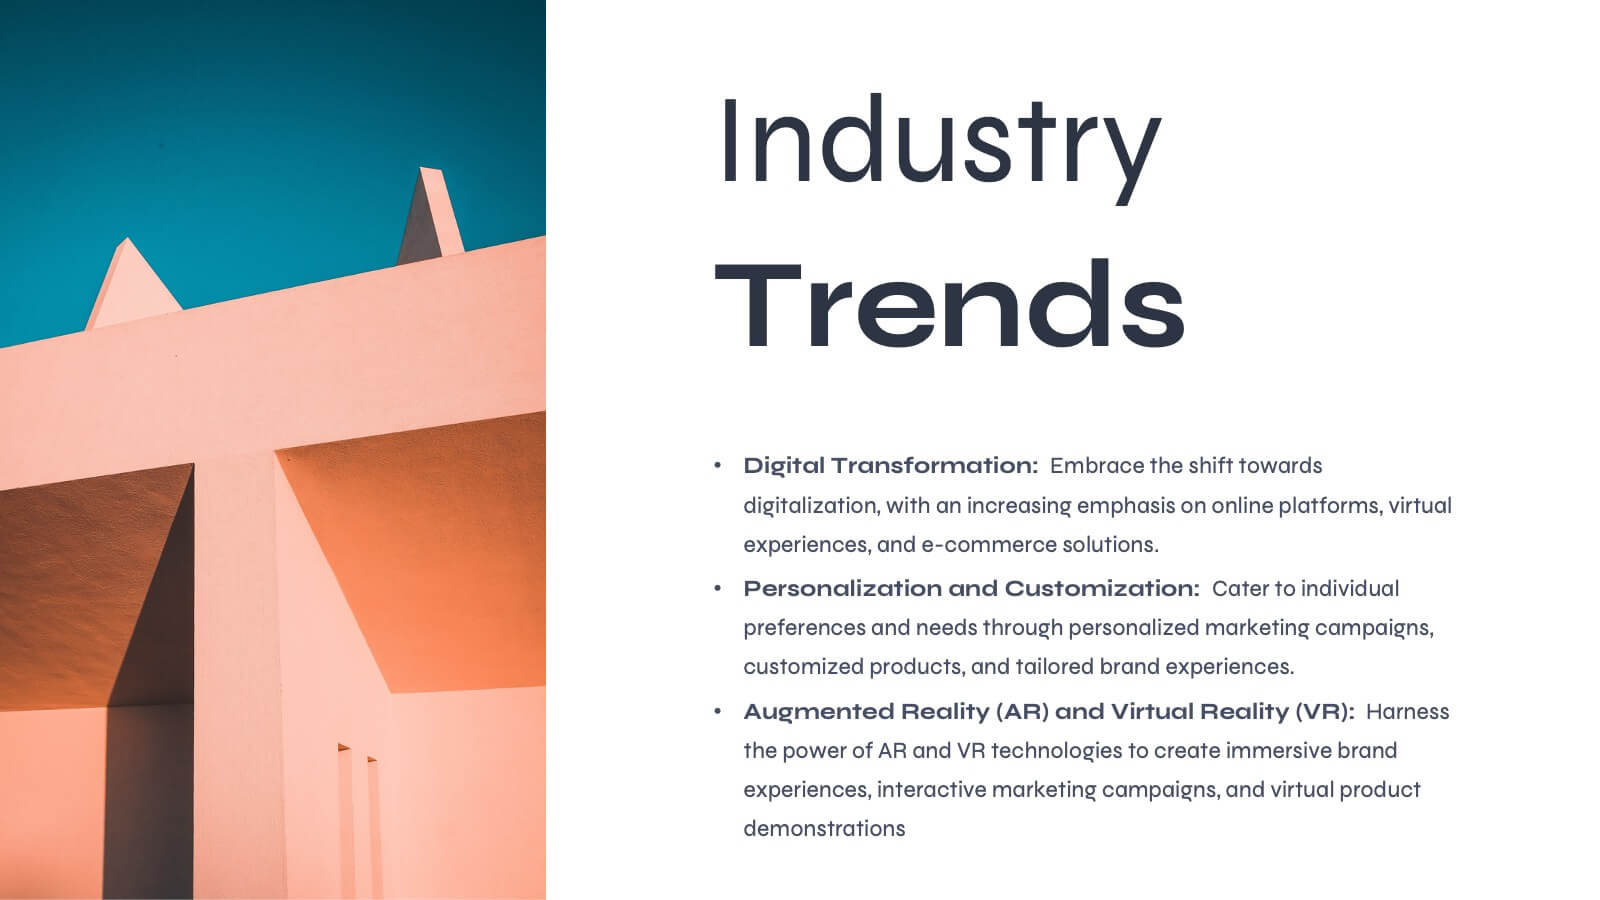
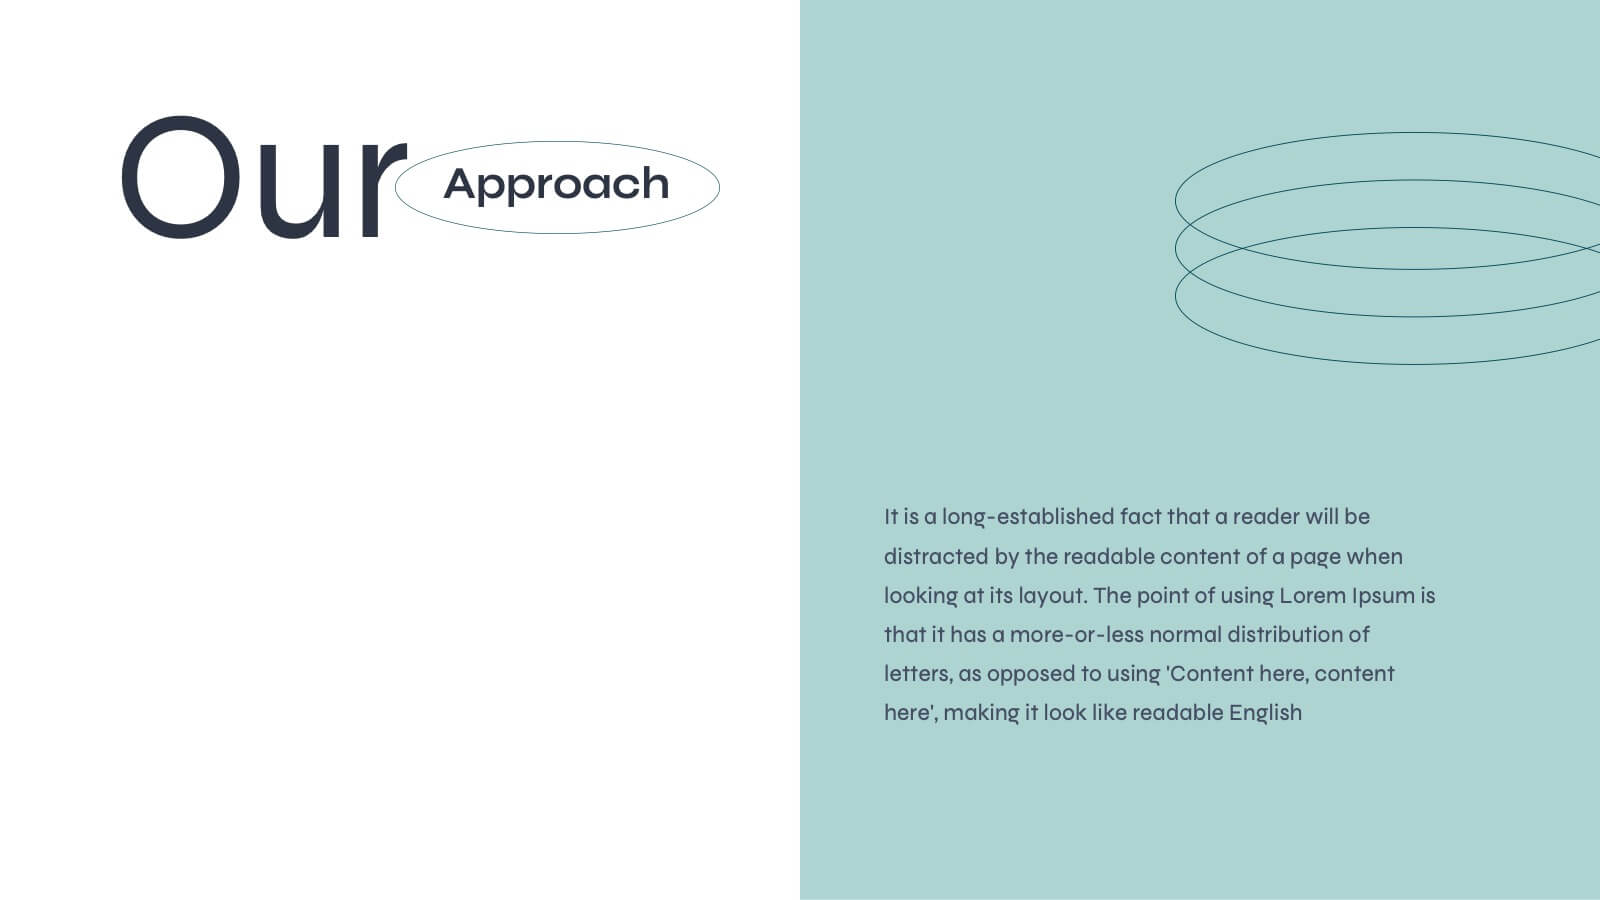
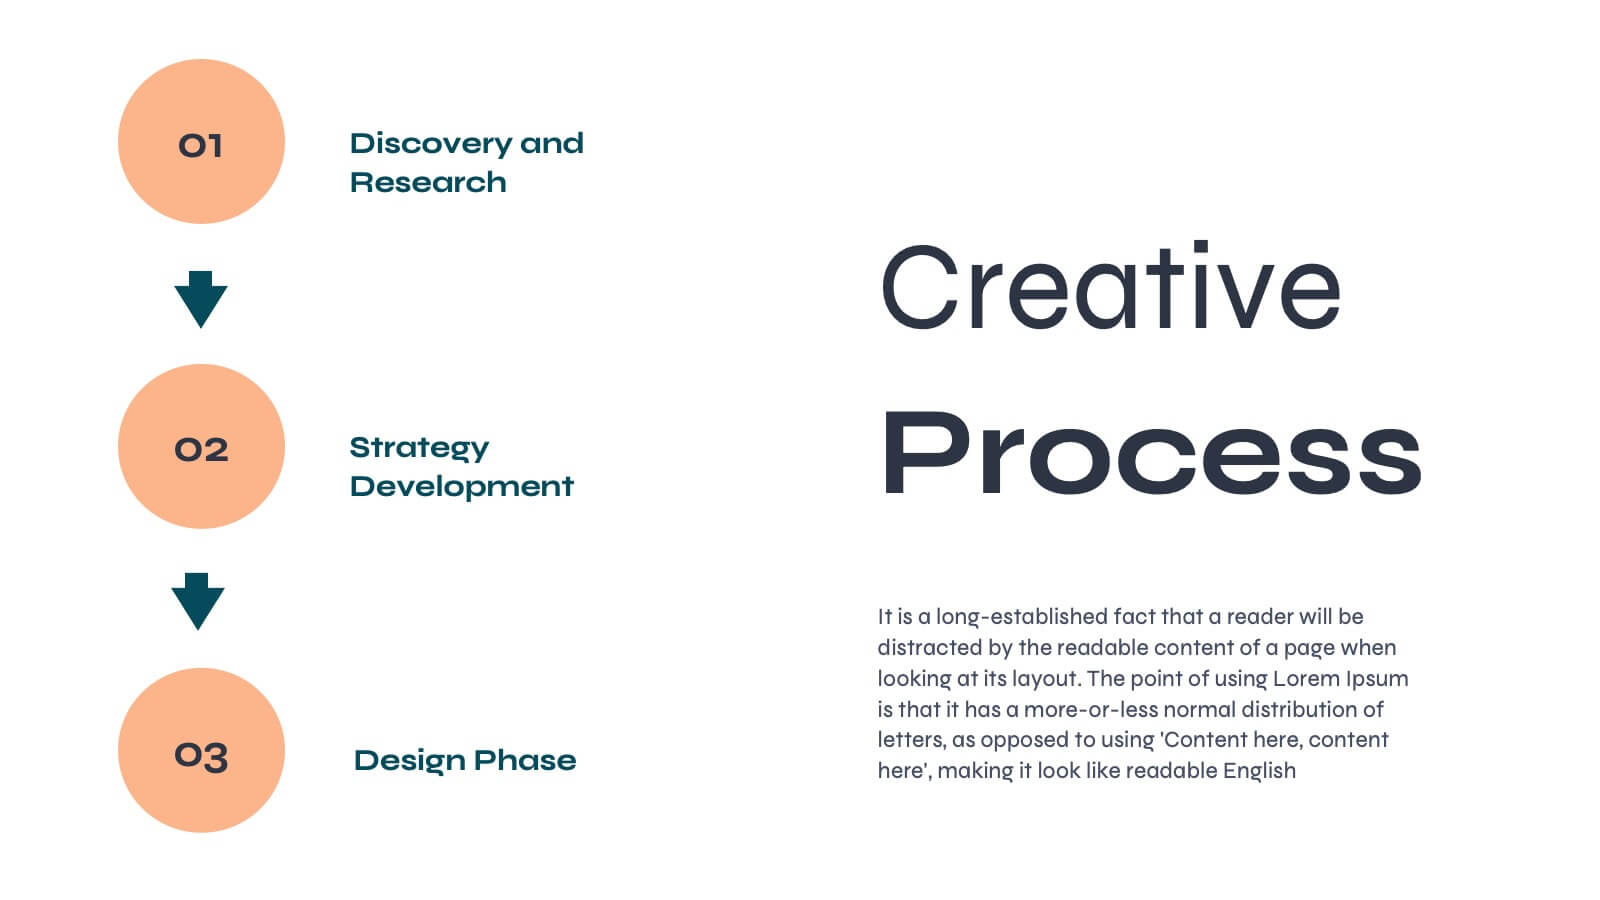
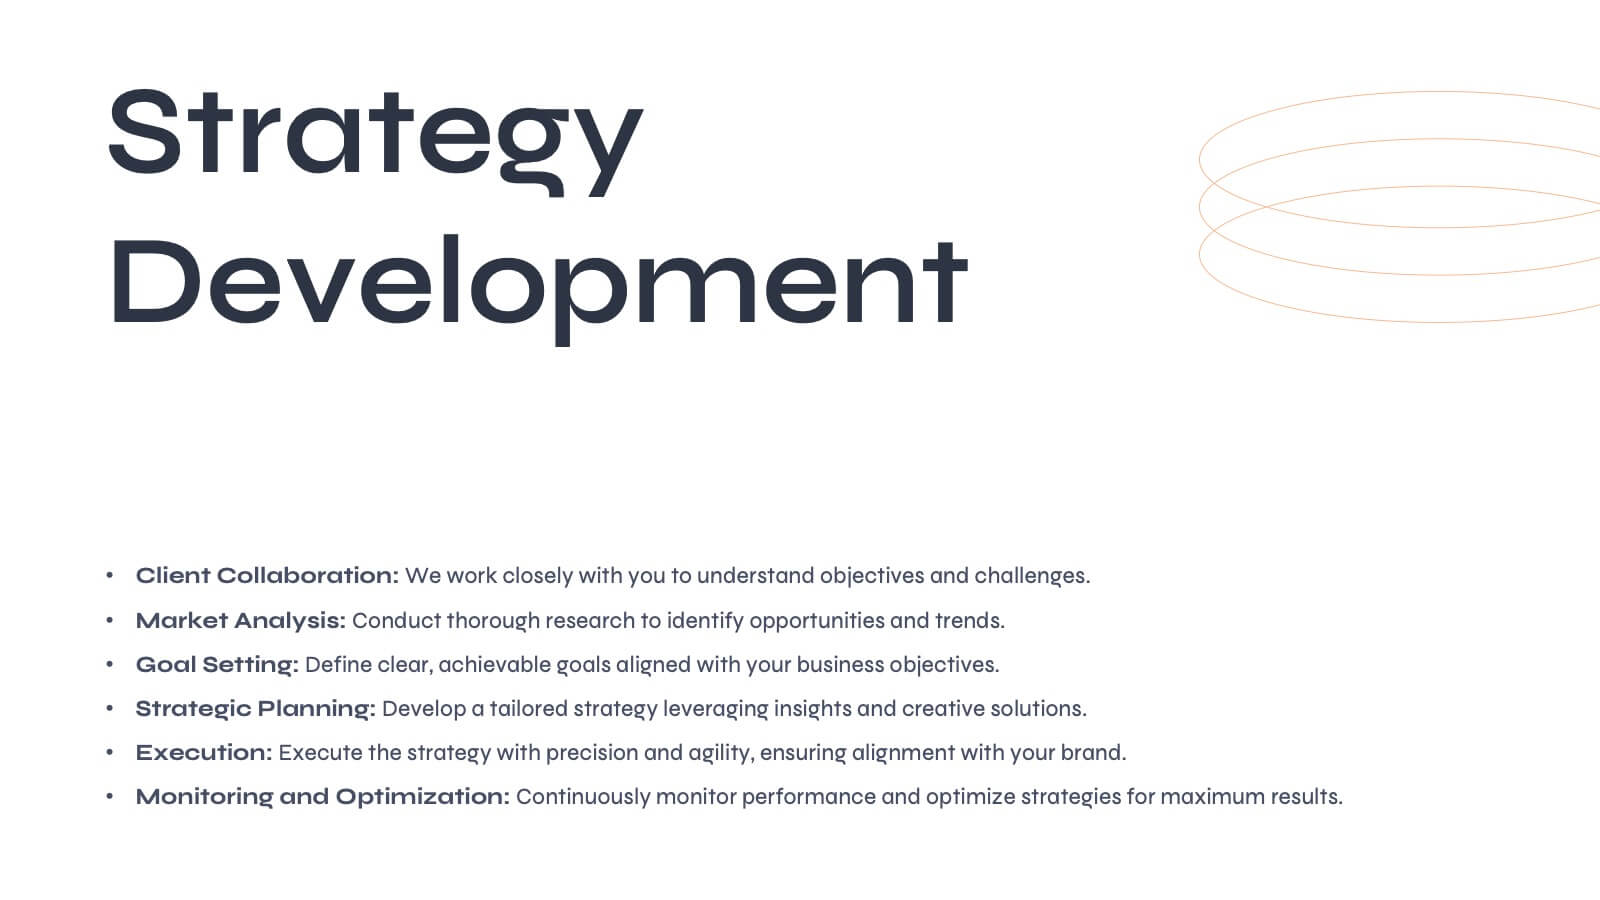
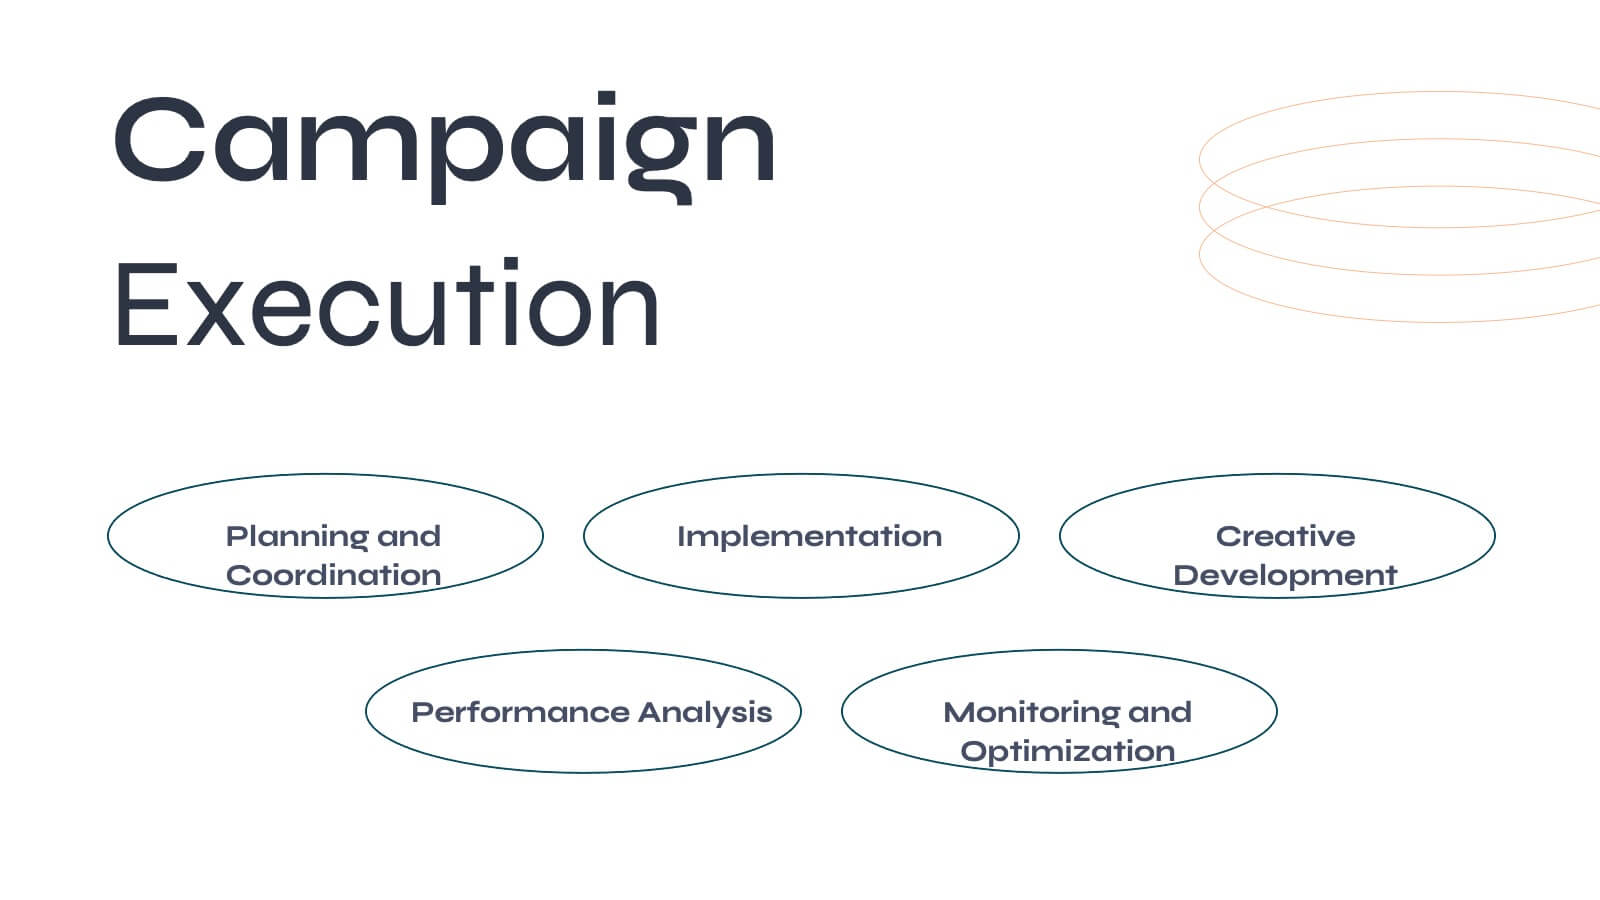
Dreameon Agency Portfolio Presentation
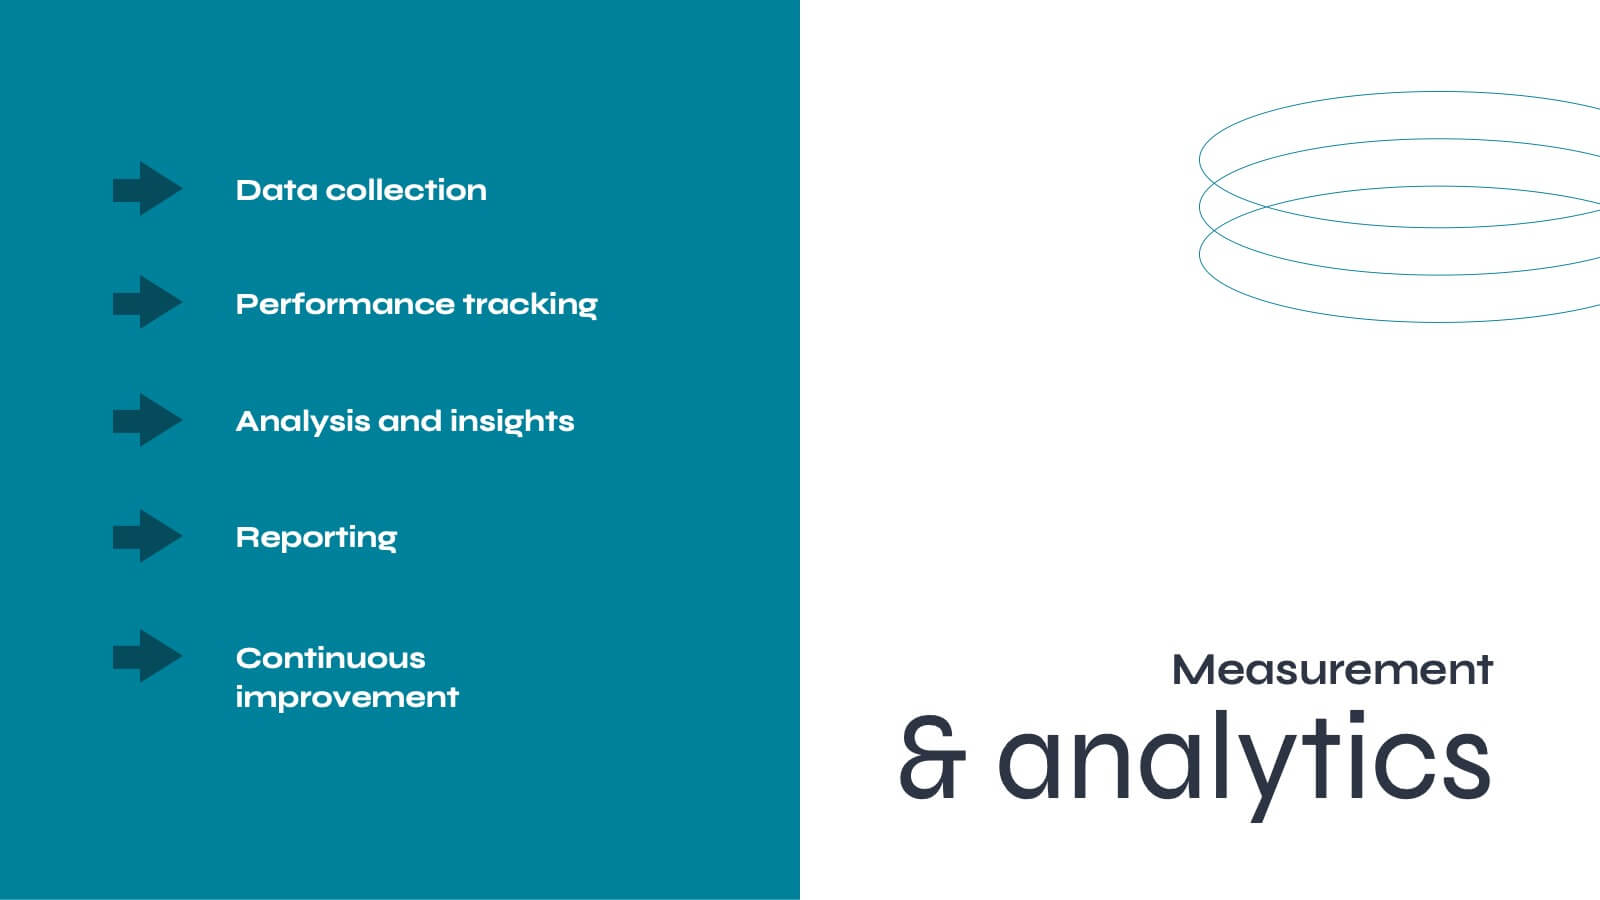
Showcase your agency's expertise with this sleek and modern portfolio presentation template. Designed to highlight your achievements, creative processes, and client success stories, this template offers a comprehensive layout that communicates professionalism and innovation. From introducing your team and services to detailing case studies and market analysis, each slide is meticulously crafted to leave a lasting impression. Display your strategy development, social media impact, and measurement analytics effectively, ensuring a cohesive narrative that resonates with your audience. Easily customizable and compatible with PowerPoint, Google Slides, and Keynote, this template is perfect for agencies looking to pitch their capabilities, attract new clients, or present project achievements with confidence.


23 slides
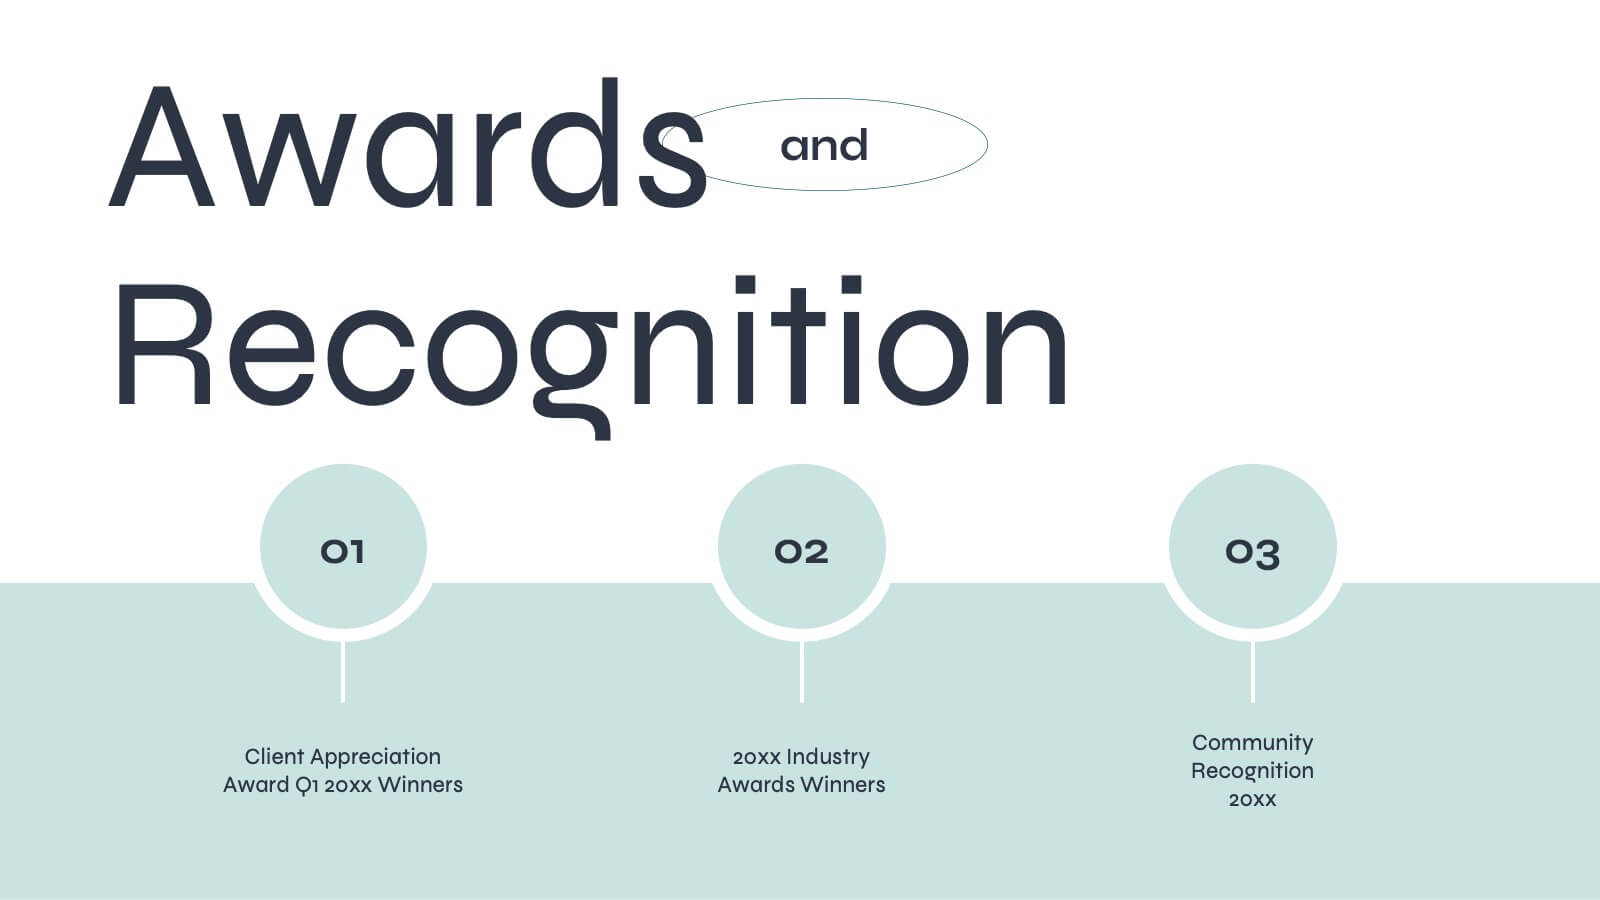
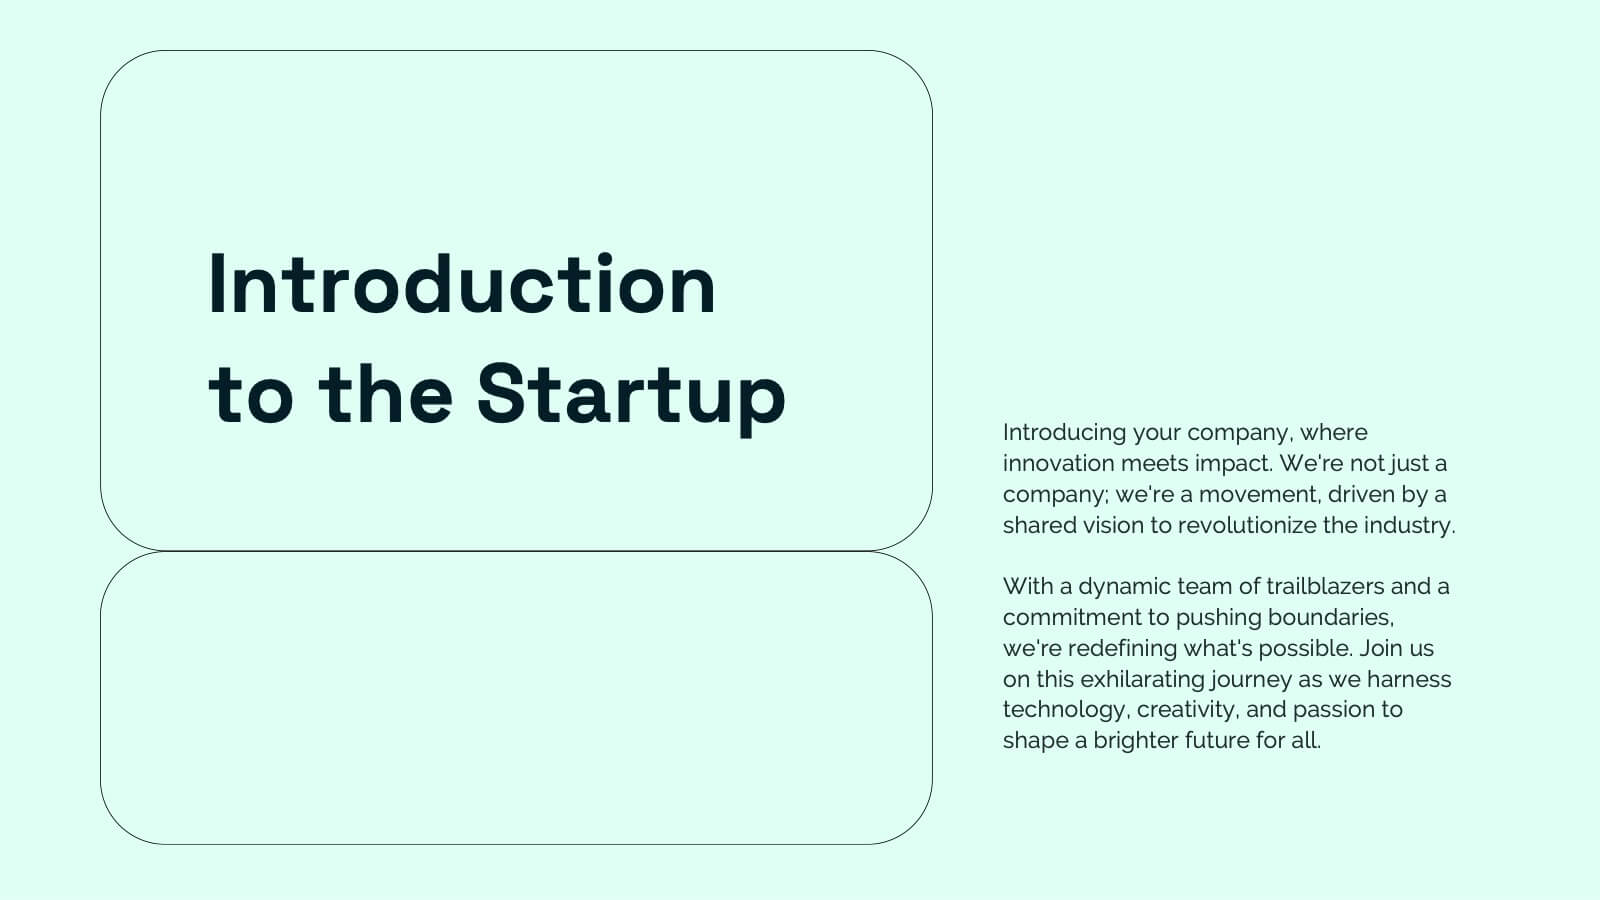
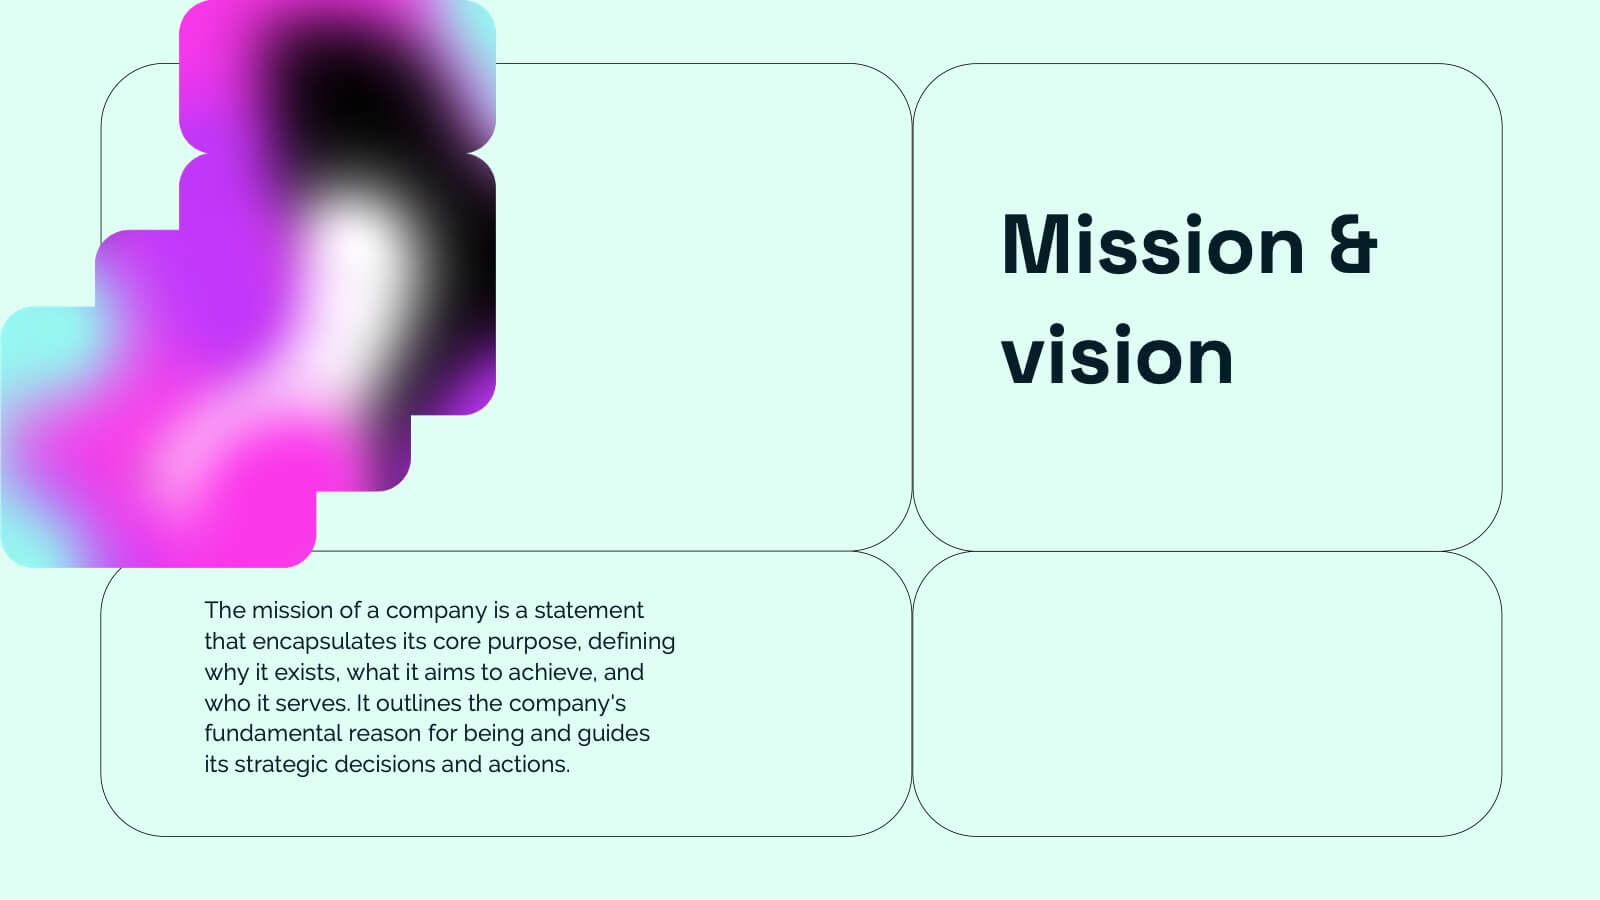
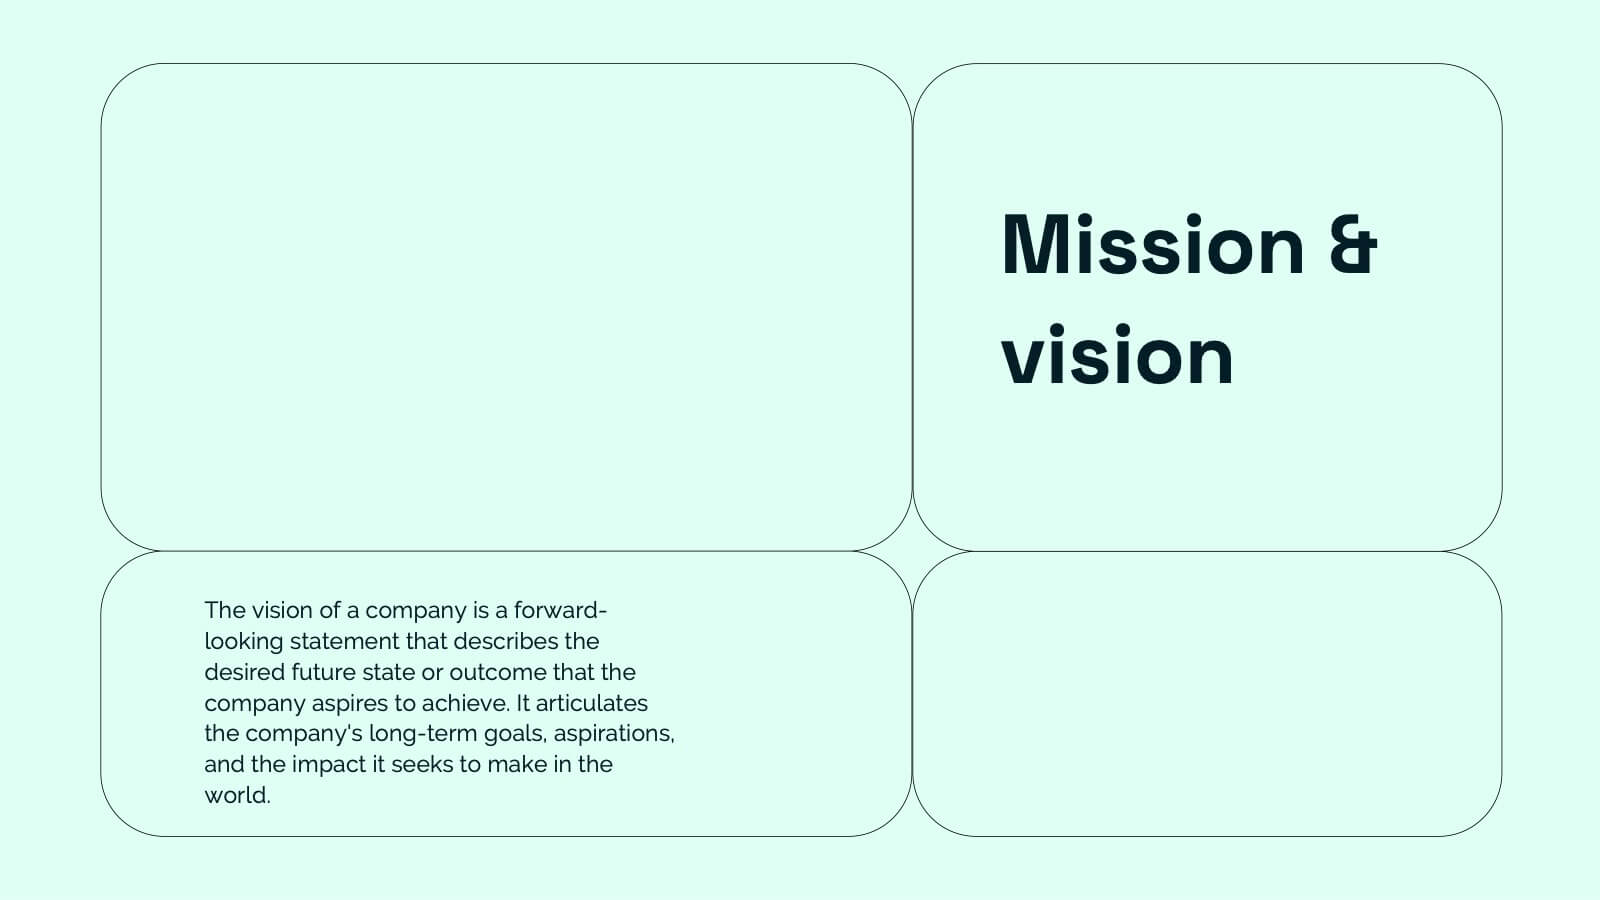
Nymph Startup Pitch Deck Presentation
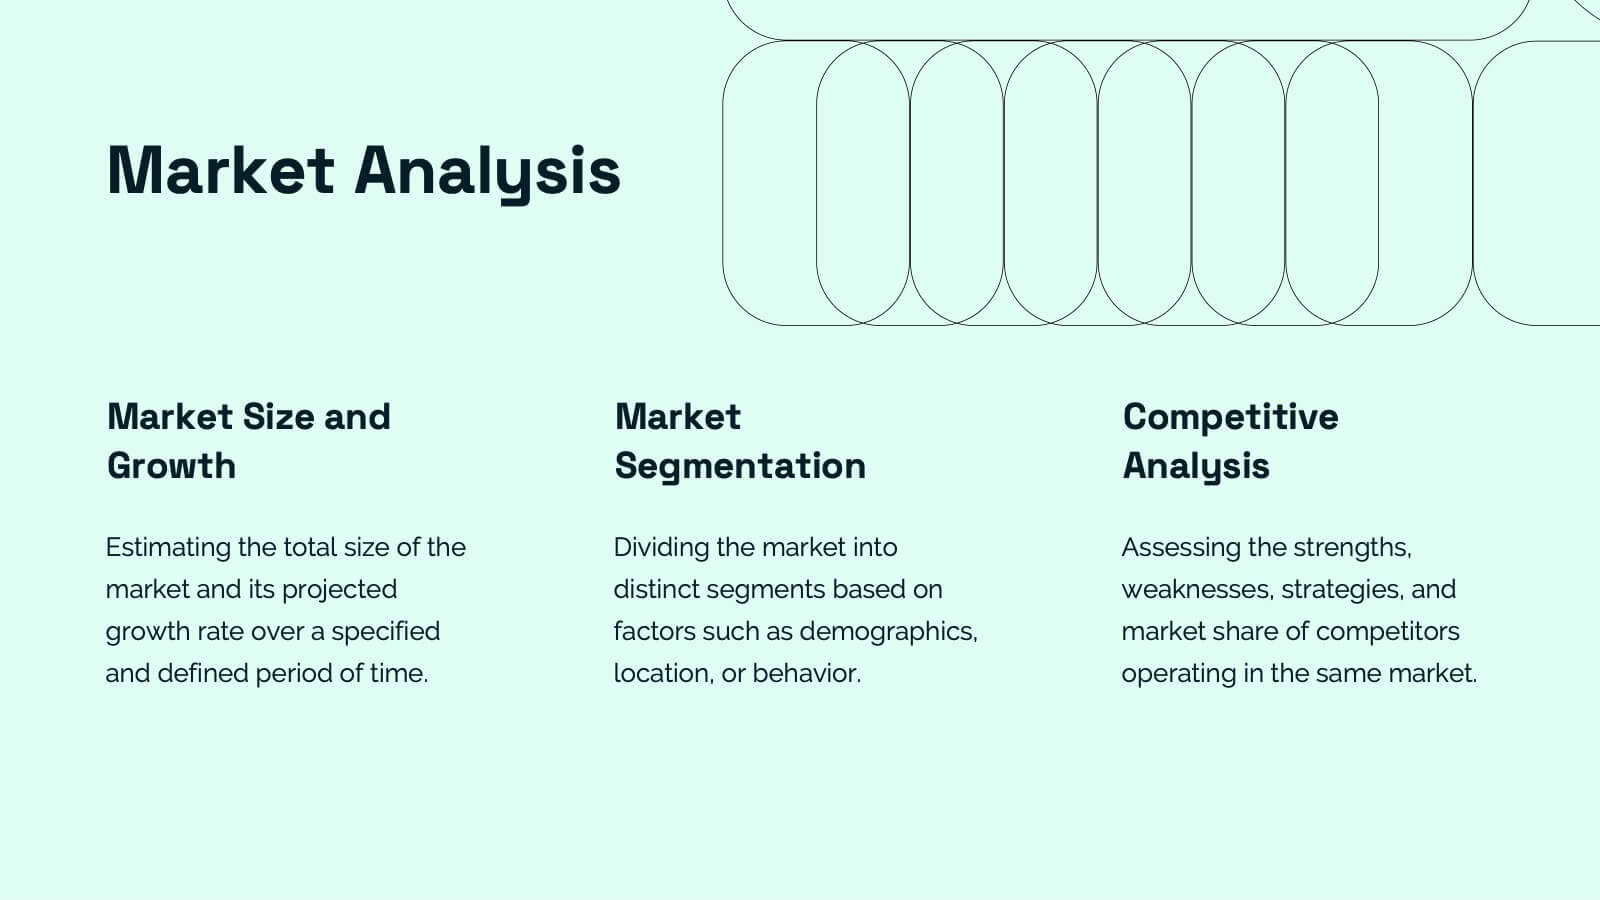
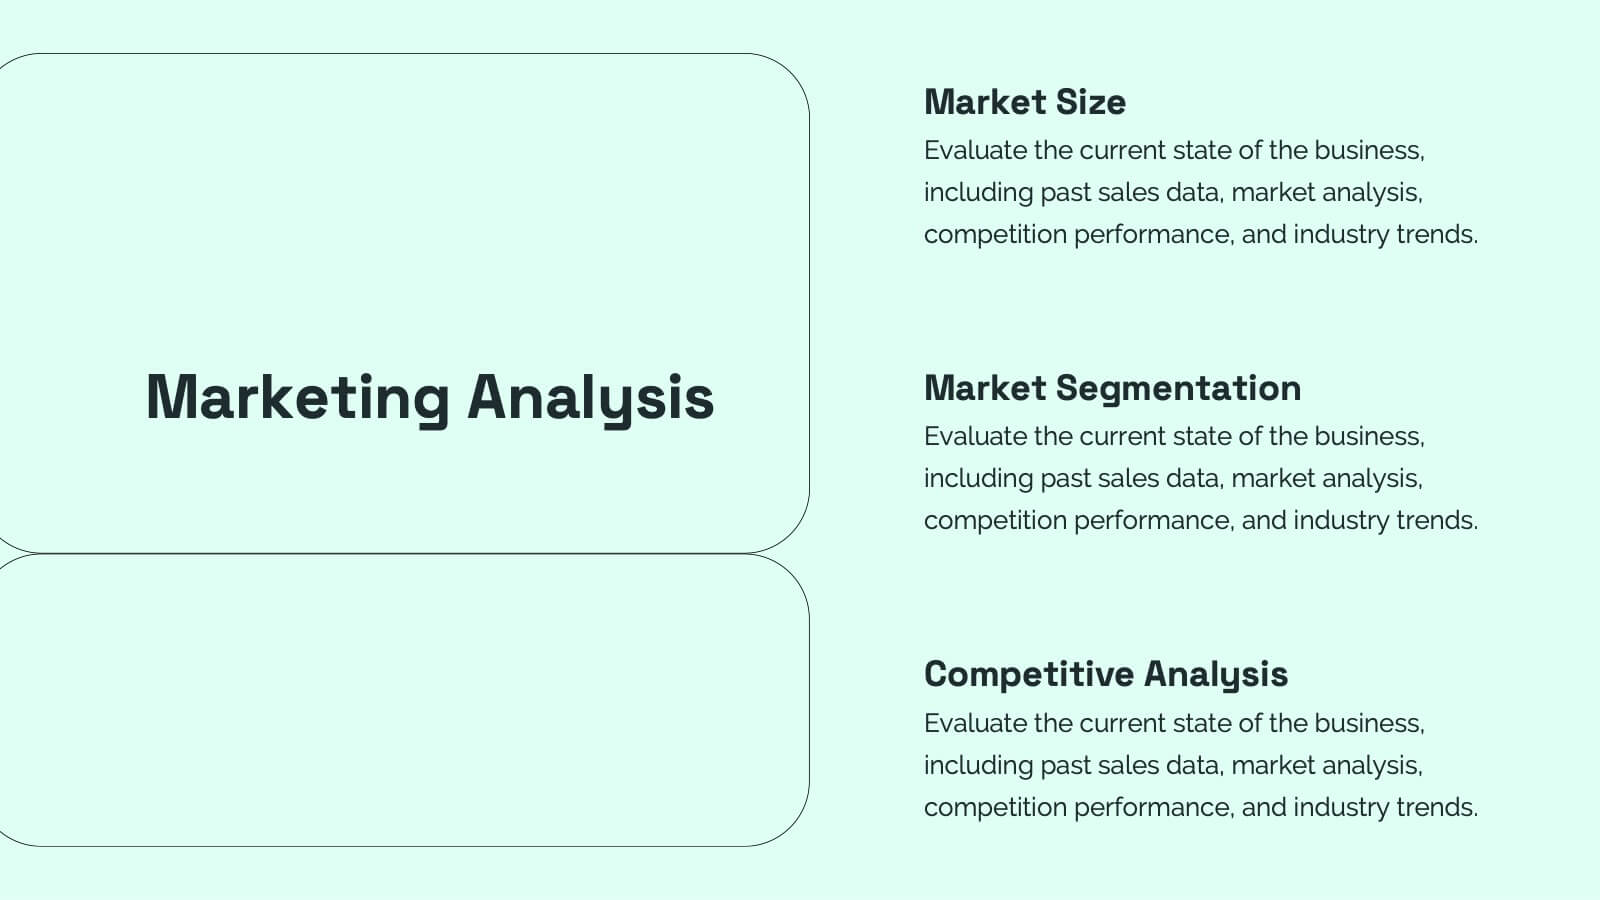
This startup pitch deck template covers all the essentials for presenting a business. It includes slides for mission and vision, business model, market analysis, value proposition, and financial overview. Easily customizable for any startup industry, this modern design makes presenting your ideas a breeze. Compatible with PowerPoint, Keynote, and Google Slides.


6 slides
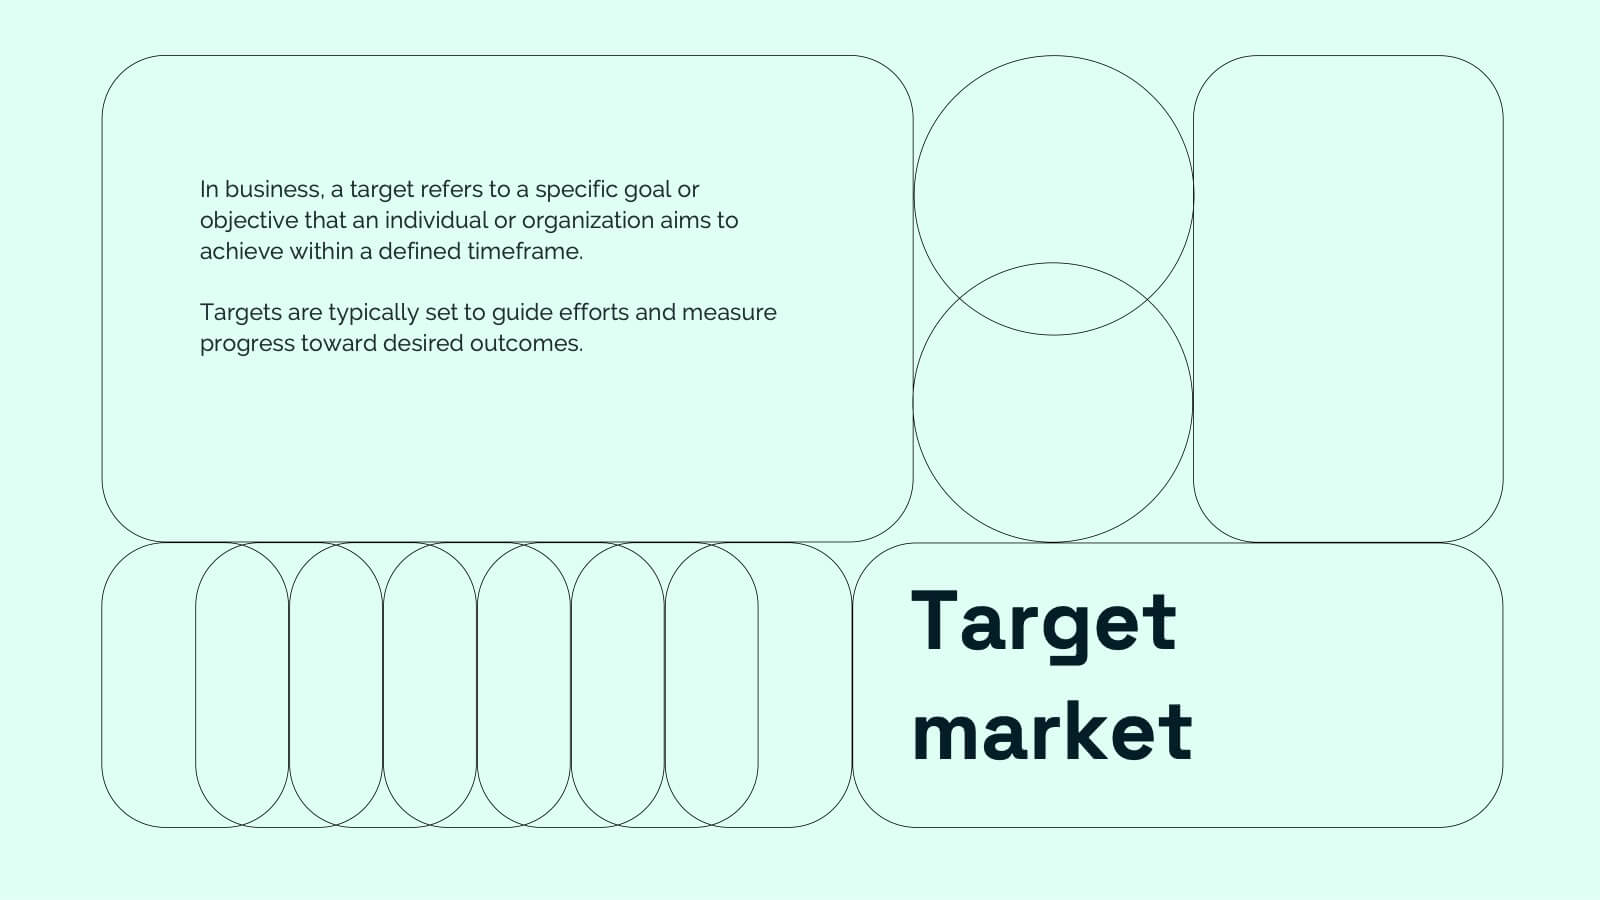
Target Audience Segmentation Strategy
Break down your audience with clarity using the Target Audience Segmentation Strategy Presentation. This slide features a vibrant vertical funnel layout, ideal for displaying five customer segments or persona categories. Each layer is numbered and color-coded, with connected callout areas for detailed insights. Perfect for marketers, campaign strategists, or product teams presenting customer journey data, audience demographics, or behavioral insights. Fully customizable in PowerPoint, Keynote, and Google Slides—easily align the design with your brand colors and content structure.