


Features
- 5 Unique slides
- Fully editable and easy to edit in Microsoft Powerpoint, Keynote and Google Slides
- 16:9 widescreen layout
- Clean and professional designs
- Export to JPG, PDF or send by email


Do you have any questions?
Recommend


7 slides
Company Title Infographic
This collection of slides is designed to vividly present company profiles and services, utilizing a dynamic color palette of blue, yellow, and white to create an engaging viewer experience. Each slide is meticulously crafted to cater to specific content, enhancing the presentation's overall effectiveness and appeal. Starting with the "Empathy Map" slide, it offers a detailed insight into customer perceptions and experiences, essential for tailoring services to meet client needs. The "SEO Report" slide focuses on showcasing quantifiable data, critical for evaluating marketing success. A dedicated "Portfolio" slide highlights past achievements, pivotal for attracting potential clients and investors by demonstrating proven capability and success. Further slides like "What We Do" and "Objectives" provide clear, straightforward layouts that detail the company’s primary activities and strategic goals, respectively. The "Projects" slide offers a glimpse into current and prospective projects, illustrating ongoing development and future aspirations. Ideal for stakeholder briefings, marketing pitches, or internal reviews, these templates support companies in communicating a cohesive and comprehensive narrative of their operational scope and strategic direction.


6 slides
Project Proposal Goals Infographic
Maximize the impact of your project proposals with this professional collection of templates, designed to outline your project goals and strategies with precision. Each template facilitates clear communication of project objectives, timelines, and the desired outcomes, making them essential for project managers, consultants, and business analysts. These slides are crafted with a clean, corporate design that uses a harmonious blend of blue tones, engaging charts, and concise content layouts. This ensures that key points are easily digestible and effectively conveyed to stakeholders. The structured format of these templates is ideal for detailing the scope of work, expected milestones, and resource allocation, supporting a comprehensive overview of your project plan. Customize these templates to align with your organization's branding and project specifics, enhancing your presentation and strengthening the proposal's persuasive power. Whether for internal briefings or external pitches, these slides are tailored to help you present a coherent and compelling case for your projects.


5 slides
Workforce Structure and Unity Overview Presentation
Present your team's hierarchy and alignment clearly with the Workforce Structure and Unity Overview Presentation. This slide layout is ideal for illustrating reporting relationships, department groupings, or organizational tiers in a clean and visual format. Great for onboarding, team updates, or internal planning meetings. Fully editable in PowerPoint, Keynote, Canva, and Google Slides.


4 slides
Human Anatomy Visual Guide Presentation
Visualize body systems with clarity using the Human Anatomy Visual Guide Presentation. Featuring a simplified female silhouette with highlighted organs, this slide layout is perfect for medical education, wellness topics, or anatomy-focused data. Each labeled section (A–D) includes space for concise insights. Fully editable in Canva, PowerPoint, Keynote, and Google Slides.


7 slides
Common Problem Infographic
These slides offer a professional and clean design approach for presenting common challenges or issues within a project or organizational setting. Each slide is carefully structured to allow clear delineation and analysis of problems, providing a straightforward layout for presenting solutions and discussions. The design palette ranges from minimalistic to dynamic, catering to various presentation needs. Whether you are addressing an internal team, stakeholders, or a broader audience, these templates are adaptable to convey critical problems effectively. You can easily customize these slides to integrate specific details relevant to the issues at hand, making your presentation not only informative but also visually engaging.


7 slides
Progress Infographic Presentation Template
Our Progress template is designed with a simple layout for presenting your infographic with flow charts and progress bars. This layout is made to be used as a presentation layer so that you can easily change text and images from one slide to the next. It comes with useful icons and illustrations to help you create a more informative presentation. This is a well-organized template for PowerPoint presentations. It allows you to present important information with clear and concise structure. With its useful design and features, you can create an engaging presentation in just minutes.


7 slides
Stakeholder Impact Analysis Infographic Presentation
Stakeholder analysis is a tool used to identify and assess the interests, needs, and concerns of different stakeholders related to a particular project or initiative. This template can provide a comprehensive overview of the stakeholders involved in a project including their interests and level of influence. Use this template to include information on the relationships between stakeholders, as well as the potential risks and opportunities associated with their involvement. It is designed in PowerPoint, Keynote, and Google Slides so you can use the one that works best for your team and edit.


4 slides
RACI Responsibility Assignment Matrix
Streamline your project roles with this clear and customizable RACI Matrix template. Easily define who's Responsible, Accountable, Consulted, and Informed across tasks or phases. Perfect for project managers, team leads, and business strategists. Fully editable in PowerPoint, Keynote, and Google Slides.


6 slides
Business Task Checklist Presentation
Bring order and focus to your workflow with a clean, structured layout that tracks progress and priorities at a glance. Ideal for project updates, task planning, or performance reviews, this presentation makes organization effortless. Fully compatible with PowerPoint, Keynote, and Google Slides for easy customization and professional use.


5 slides
Behavioral Psychology in the Workplace Presentation
Boost employee engagement and team dynamics with the Behavioral Psychology in the Workplace Presentation. This slide deck is designed to help HR leaders, managers, and consultants visualize psychological insights that shape workplace behavior. Use it to present motivation theories, behavioral models, or communication styles. Fully editable in Canva, PowerPoint, Google Slides, and Keynote.


6 slides
Key Points Overview Presentation
Bring your message to life with a slide that makes every key point feel clear, organized, and easy to follow. This presentation helps you highlight essential ideas, compare insights, and simplify complex information for any audience. Perfect for meetings, reports, or strategy updates. Fully compatible with PowerPoint, Keynote, and Google Slides.


6 slides
Capability Gap Analysis Infographic
Gap analysis is a strategic management tool used to compare an organization's current performance or situation with its desired or target state. This infographic template is a visual representation of the process of conducting a capability gap analysis, which is a strategic assessment used to identify the gaps between their current capabilities and the capabilities required to achieve their goals or meet specific objectives. The infographic aims to provide a clear and concise overview of the capability gap analysis process and its key components. Compatible with Powerpoint, Keynote, and Google Slides.


5 slides
Mind and Brain Creativity Concept Diagram Presentation
Ignite fresh thinking with the Mind and Brain Creativity Concept Diagram Presentation—a smart and visually engaging template that maps out five core concepts around a central brain icon. Each idea is linked with intuitive visuals and labeled A through E, ideal for creative strategy, innovation pitches, or mental model breakdowns. Fully customizable in PowerPoint, Keynote, and Google Slides.


22 slides
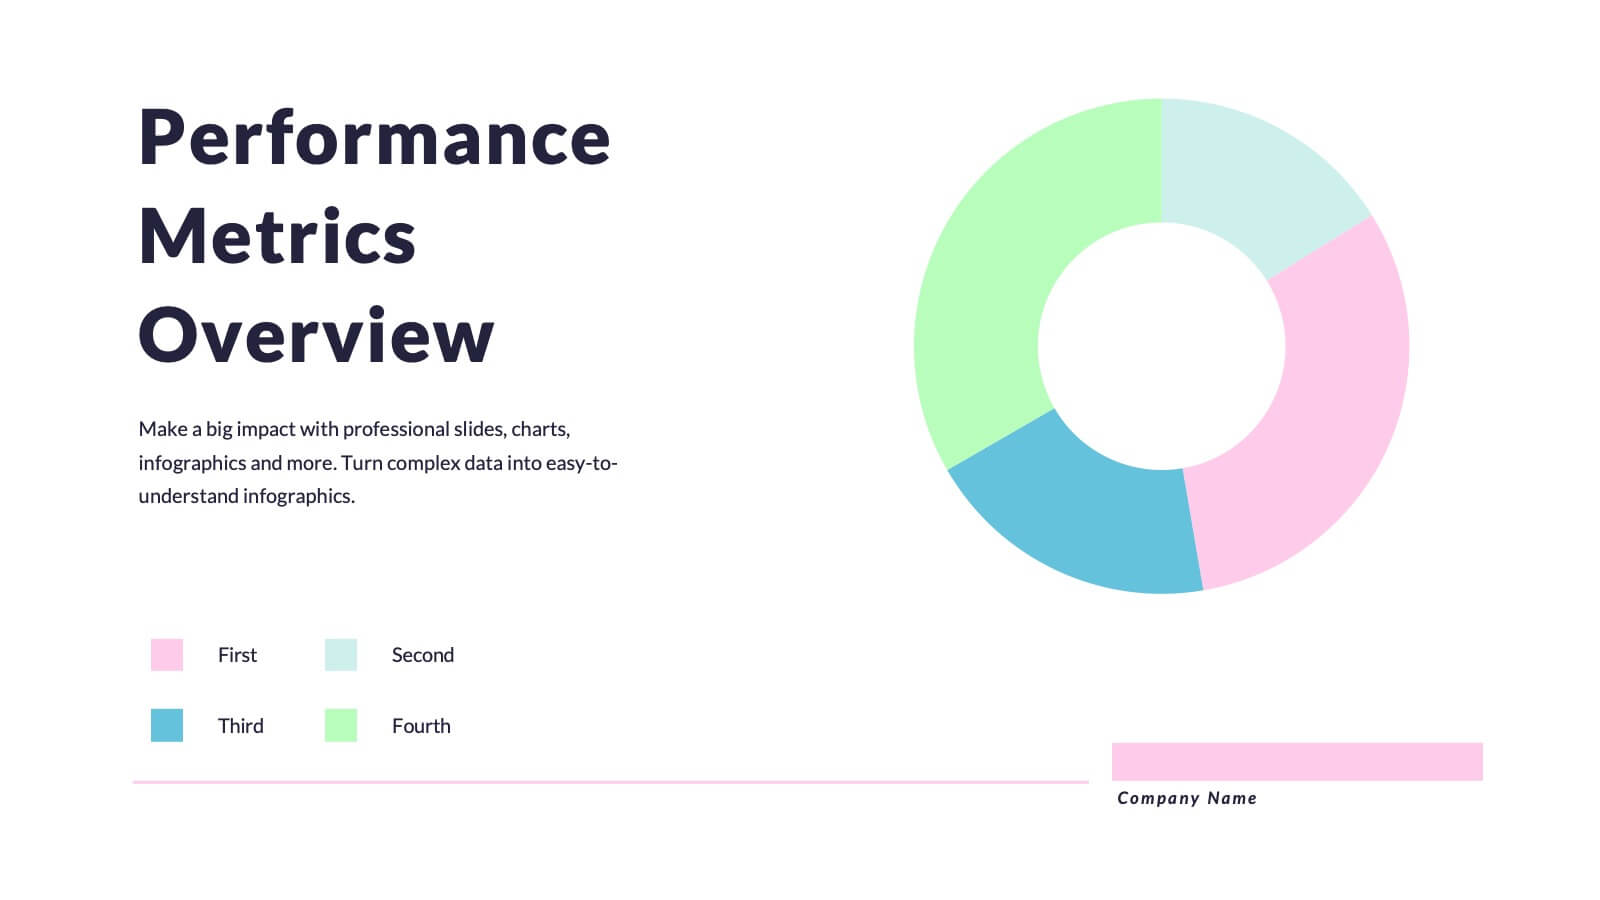
Quantum Research Findings Report Presentation
Discover insights like never before with this vibrant presentation template! Perfect for showcasing research findings, it includes slides for key findings, performance metrics, and market trends. Clearly present data and engage your audience with visually appealing graphics. Compatible with PowerPoint, Keynote, and Google Slides, making it easy to use on any platform.


6 slides
Business Advancement Metrics Presentation
Get ready to visualize your wins! This presentation template brings clarity to your metrics, helping you showcase business growth and performance benchmarks with sleek, stacked visuals. Perfect for tracking KPIs, performance analysis, or advancement trends. Fully compatible with PowerPoint, Keynote, and Google Slides for easy editing and seamless presentation delivery.


20 slides
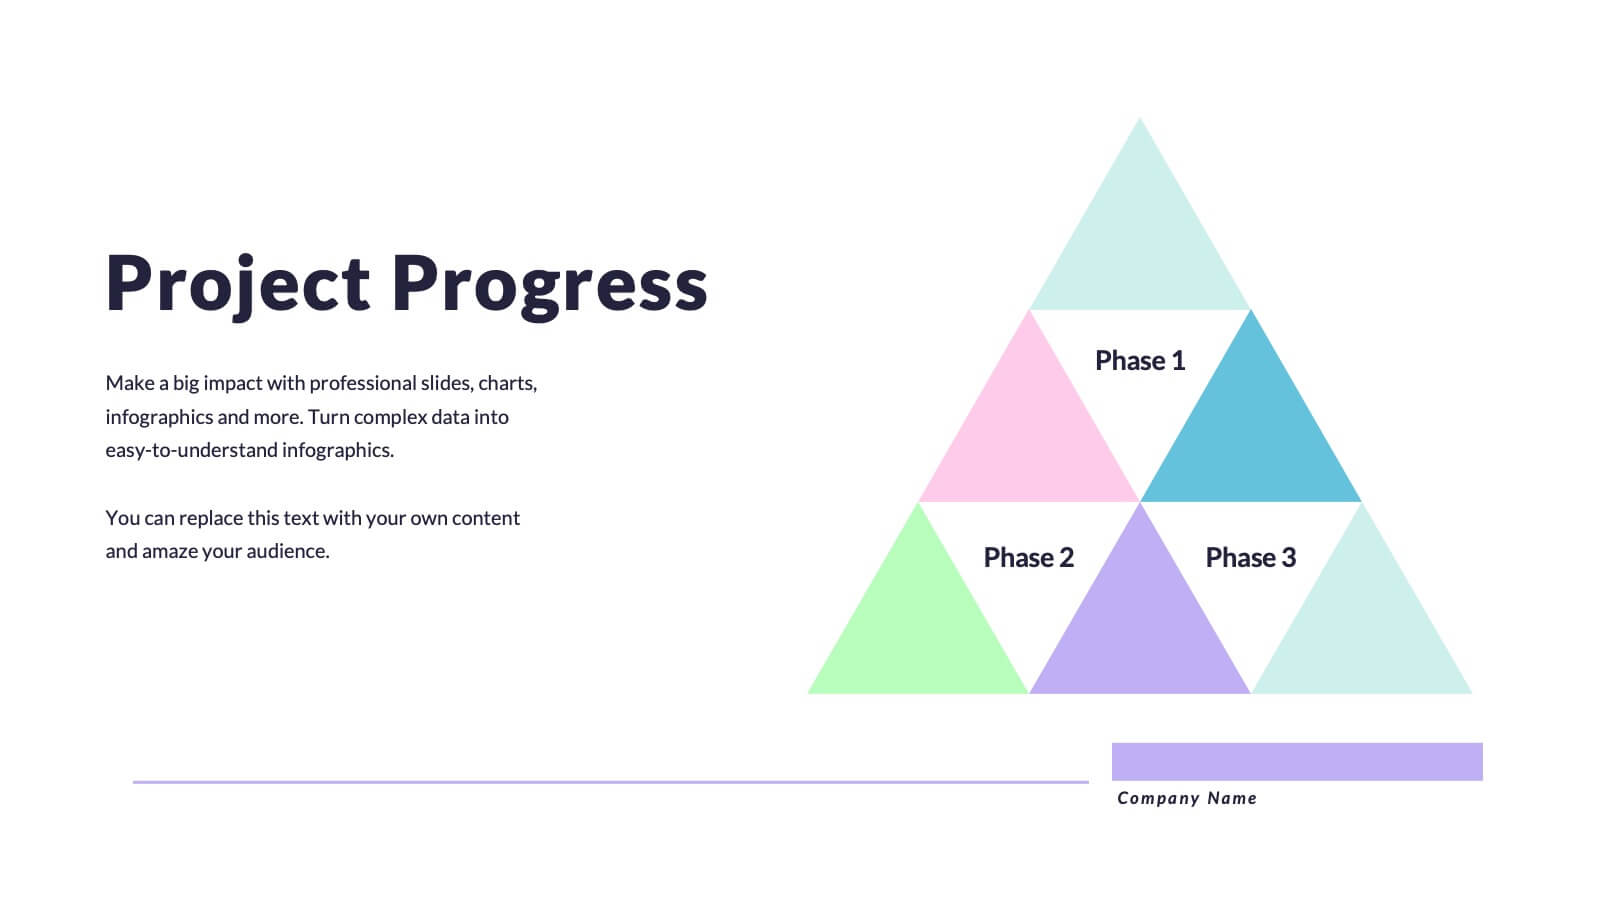
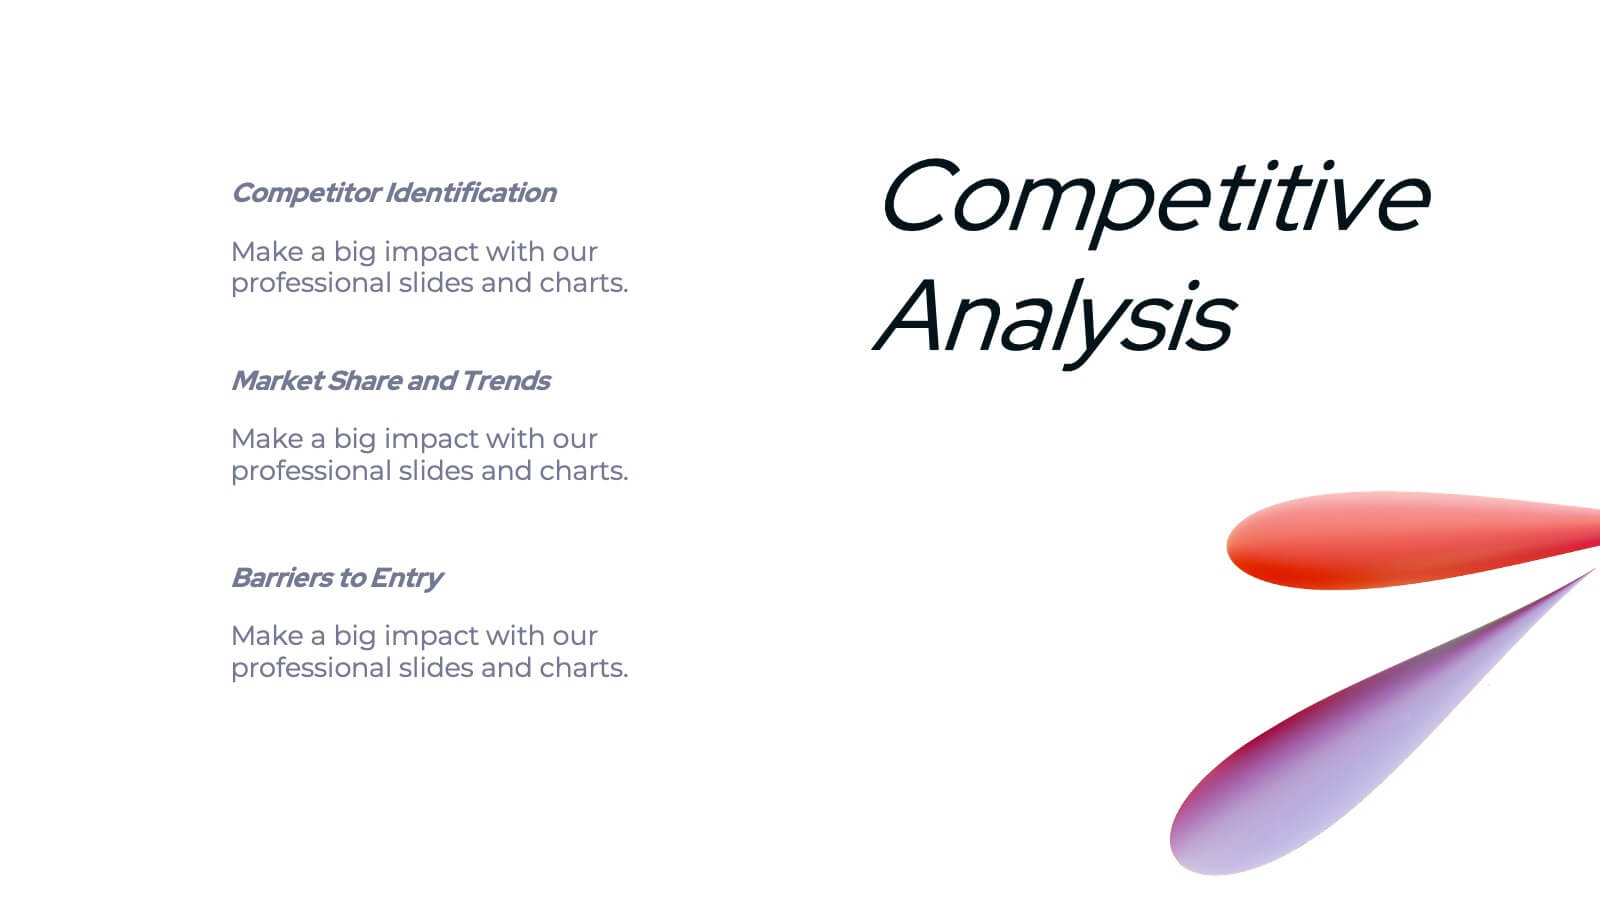
Spark Sales Performance Report Presentation
Deliver insights and strategies with this dynamic sales performance report presentation template. Featuring an elegant and modern design, it provides dedicated sections for agenda setting, company overview, service highlights, and customer value propositions. Present competitive analysis, sales objectives, and performance metrics with ease using clean, structured layouts. Visualize sales processes, team introductions, and pricing strategies through engaging, editable infographics and data slides. The template also includes areas for showcasing promotions, customer testimonials, future opportunities, and actionable next steps. Tailored for sales teams and managers, it offers a professional framework to review and strategize effectively. Fully customizable and compatible with PowerPoint, Google Slides, and Keynote, this template ensures seamless adaptation to your branding and needs. Impress your audience while highlighting achievements and paving the way for future growth!


6 slides
Global Sourcing and Distribution Presentation
Present your supply strategy with clarity using the Global Sourcing and Distribution Presentation. This slide features a central sourcing hub with segmented groups to illustrate regional or functional distribution channels. Ideal for global logistics, procurement planning, or stakeholder reporting. Fully editable in PowerPoint, Keynote, and Google Slides.