


Features
- 5 Unique slides
- Fully editable and easy to edit in Microsoft Powerpoint, Keynote and Google Slides
- 16:9 widescreen layout
- Clean and professional designs
- Export to JPG, PDF or send by email


Do you have any questions?
Recommend


5 slides
Business Strategy Infographic
A Business Strategy Infographic is a visual representation of a company's plan for achieving its long-term objectives. This infographic template includes charts, graphs, icons, illustrations, and texts that can help people understand and grasp the key points of a business strategy presentation. The colors, fonts, and layout are fully customizable making it easy to stay consistent with your company branding and style guidelines. Use this to provide an overview of your organization's mission, goals, competitive advantage, target market, products or services, and the tactics used to achieve success.


6 slides
Stages of the Product Life Cycle Presentation
Illustrate the evolution of a product from launch to decline with the Stages of the Product Life Cycle presentation. This vibrant, segmented chart template visualizes key phases—Introduction, Growth, Maturity, and Decline—making it perfect for marketers, product managers, and strategists. Each stage is color-coded and icon-marked to enhance clarity and engagement. Fully customizable in PowerPoint, Keynote, and Google Slides.


8 slides
Data Analytics Dashboard Slide Presentation
Turn raw data into visual insights with this clean and modern layout designed to simplify analytics reporting. Perfect for tracking performance metrics, KPIs, and progress updates, it helps make numbers easy to understand at a glance. Fully customizable and compatible with PowerPoint, Keynote, and Google Slides for effortless editing.


10 slides
Financial Money Management Strategies Presentation
Break down your key financial strategies with this clear, wheel-style diagram. Perfect for outlining budgeting principles, savings goals, or investment methods, each segment includes space for titles and concise text. Ideal for financial advisors, consultants, or internal team planning. Fully customizable in PowerPoint, Keynote, and Google Slides.


12 slides
Project Completion Checklist
Streamline project tracking with this clean and functional project completion checklist slide. Ideal for task management and progress reporting, it includes editable sections for task descriptions, process stages, current status, and additional notes. With toggles like “In Process,” “On Hold,” “Complete,” and “Overdue,” this layout is perfect for keeping teams aligned. Fully editable in PowerPoint, Keynote, and Google Slides.

22 slides
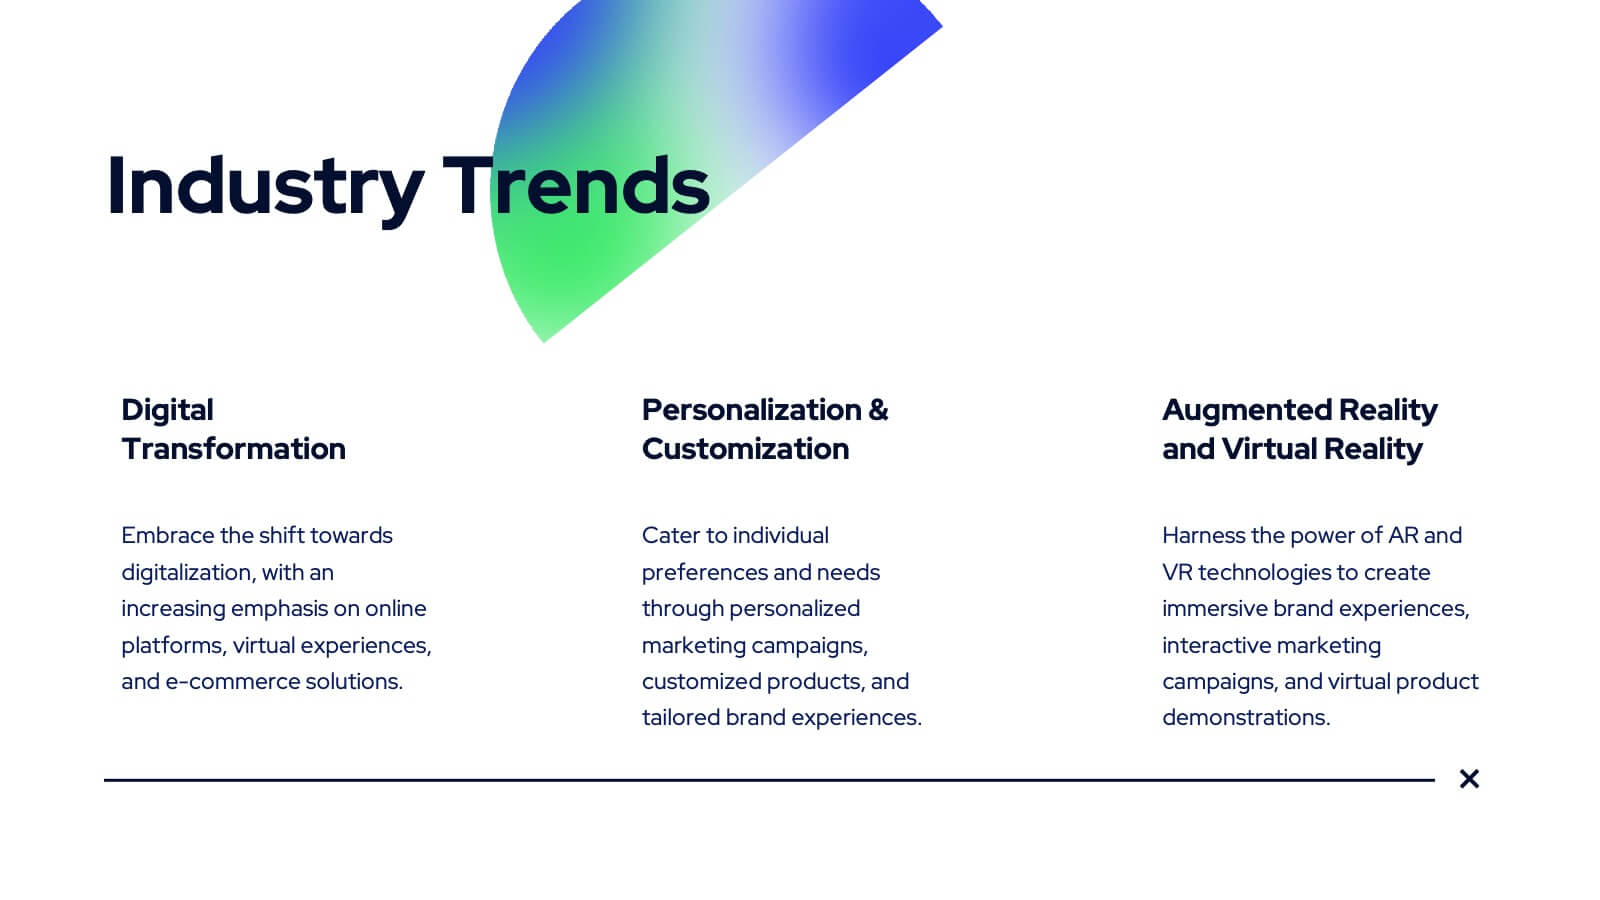
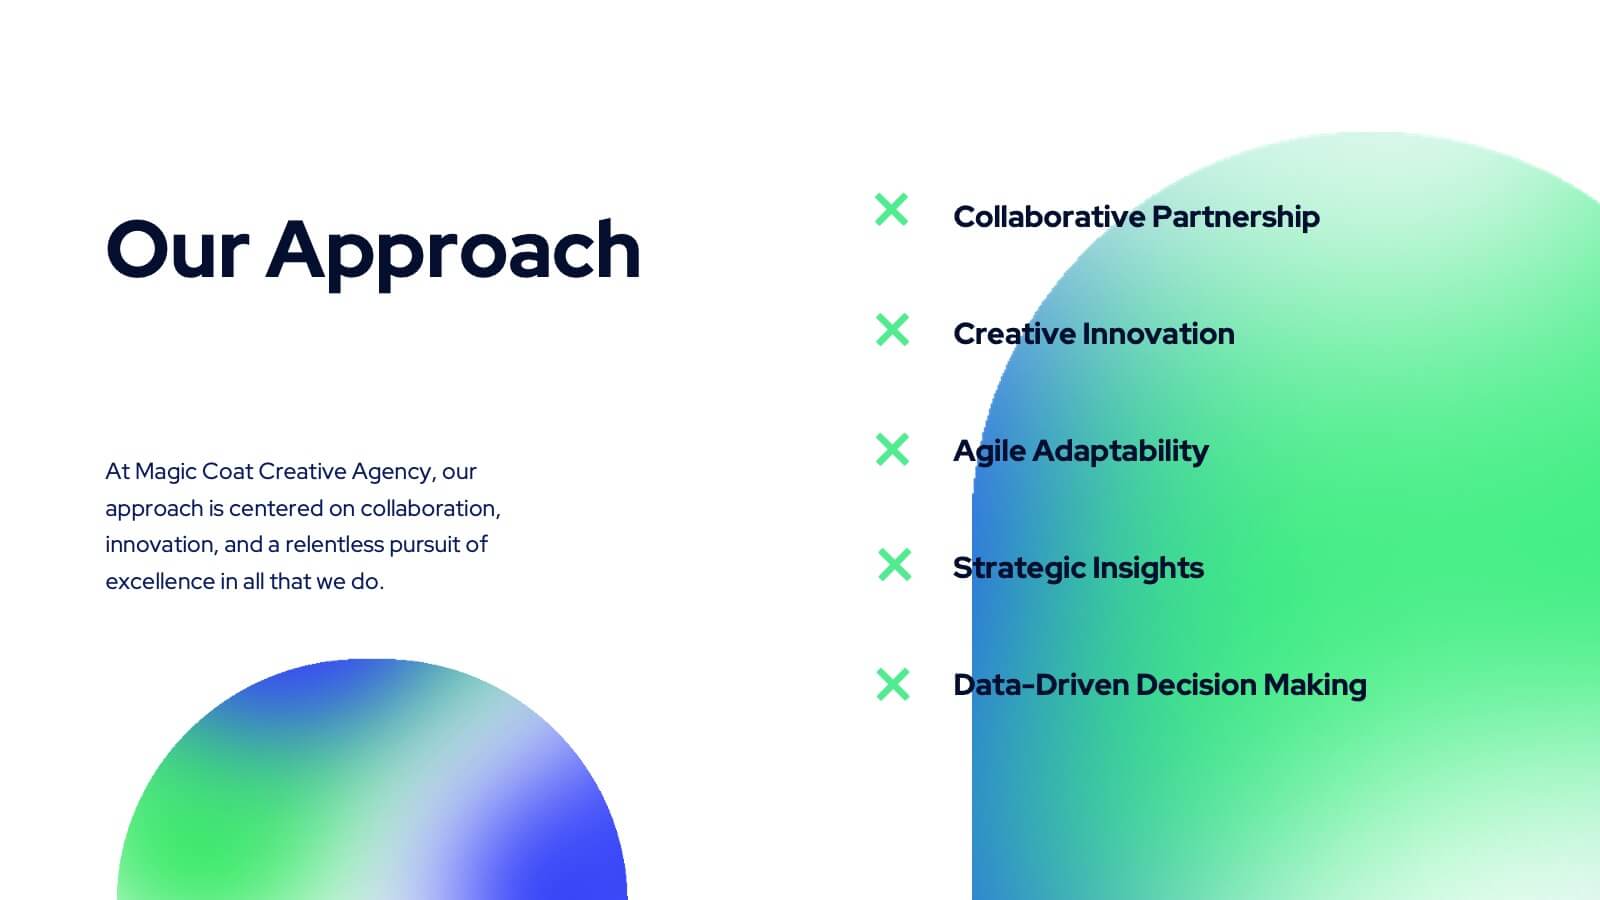
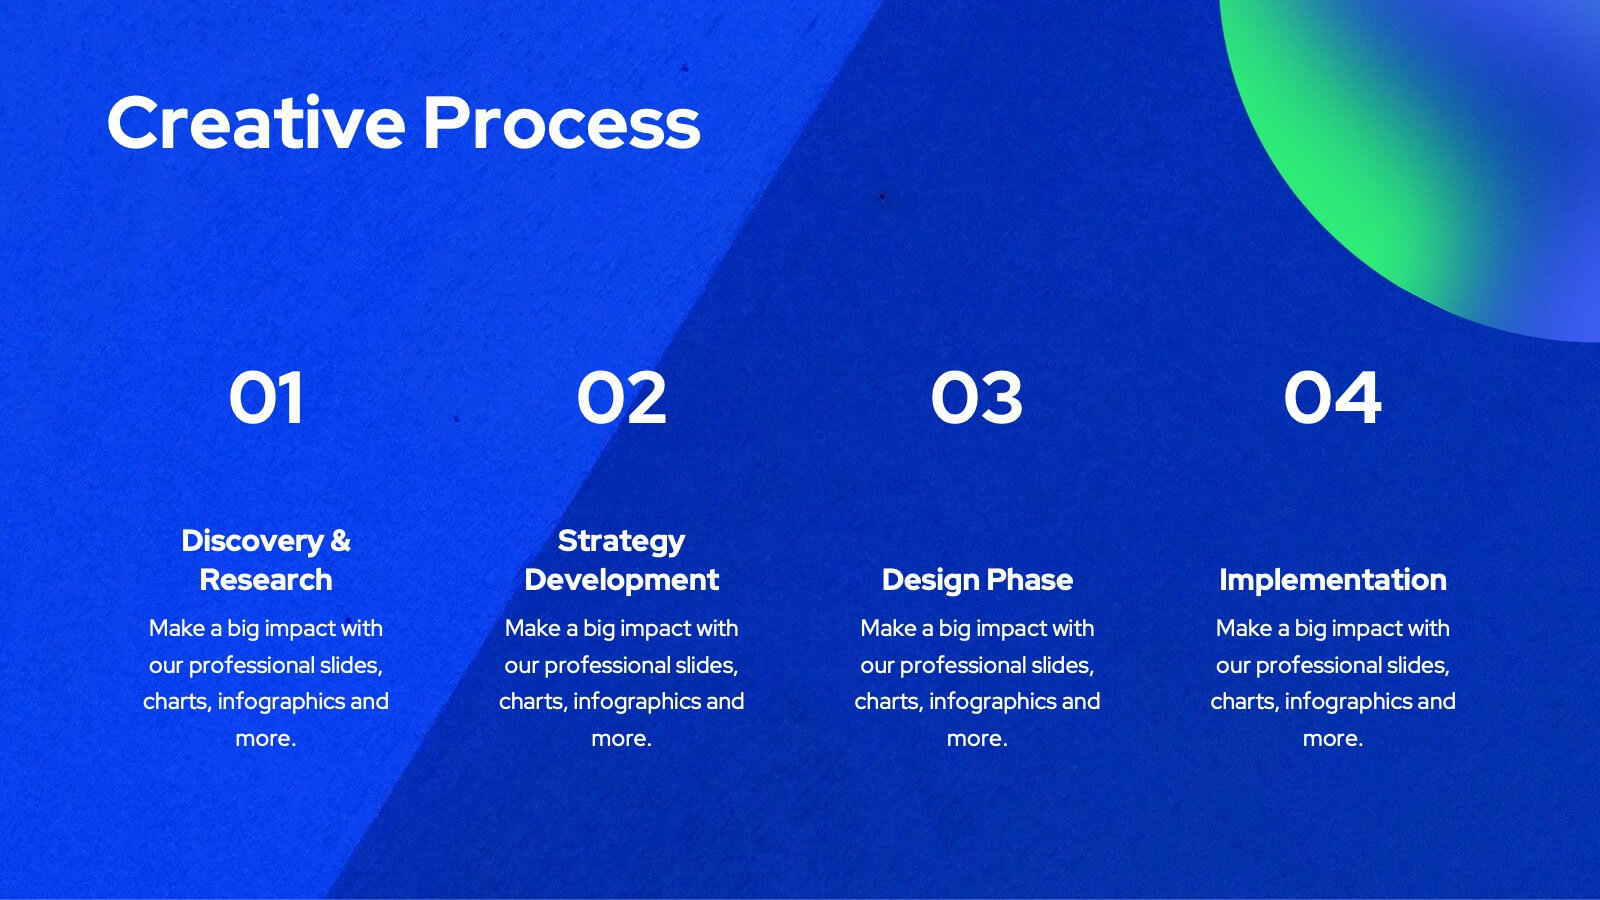
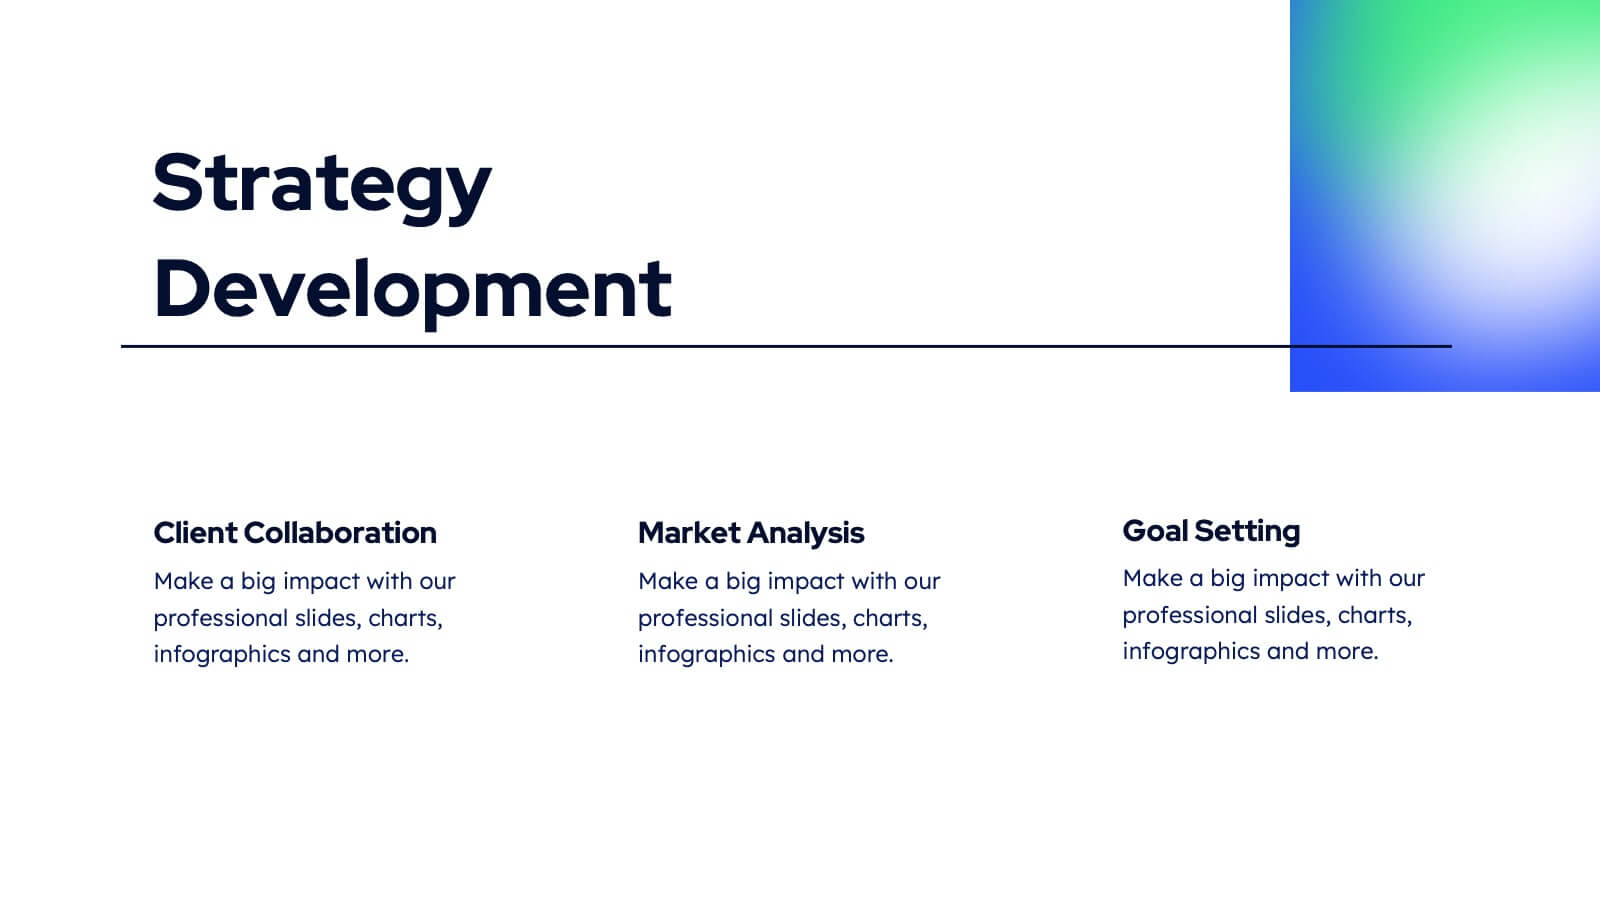
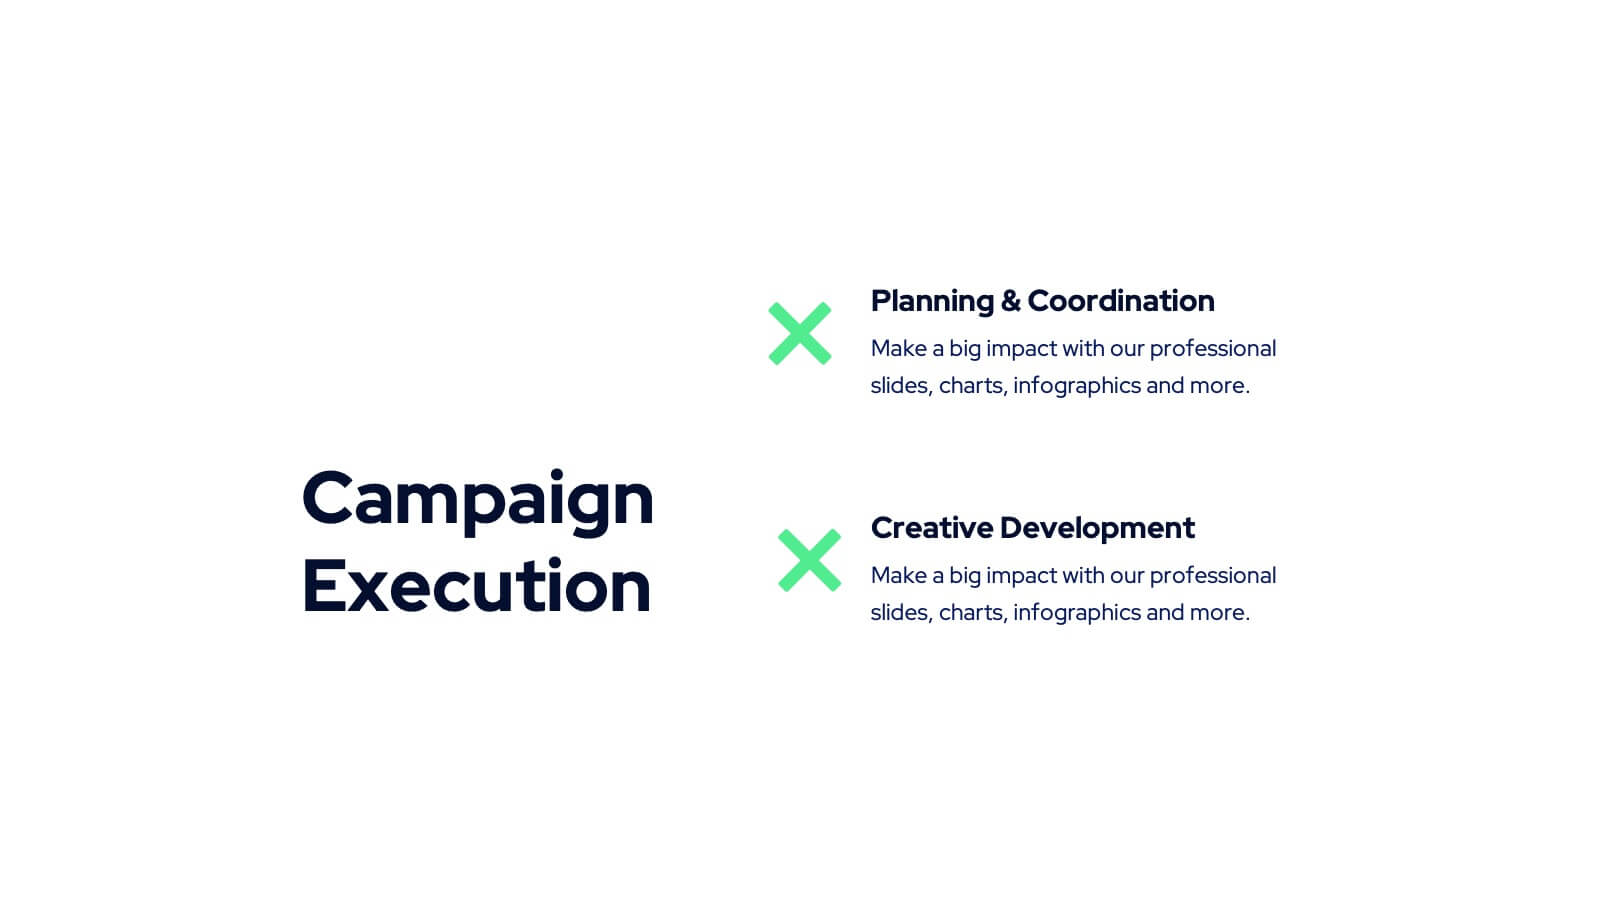
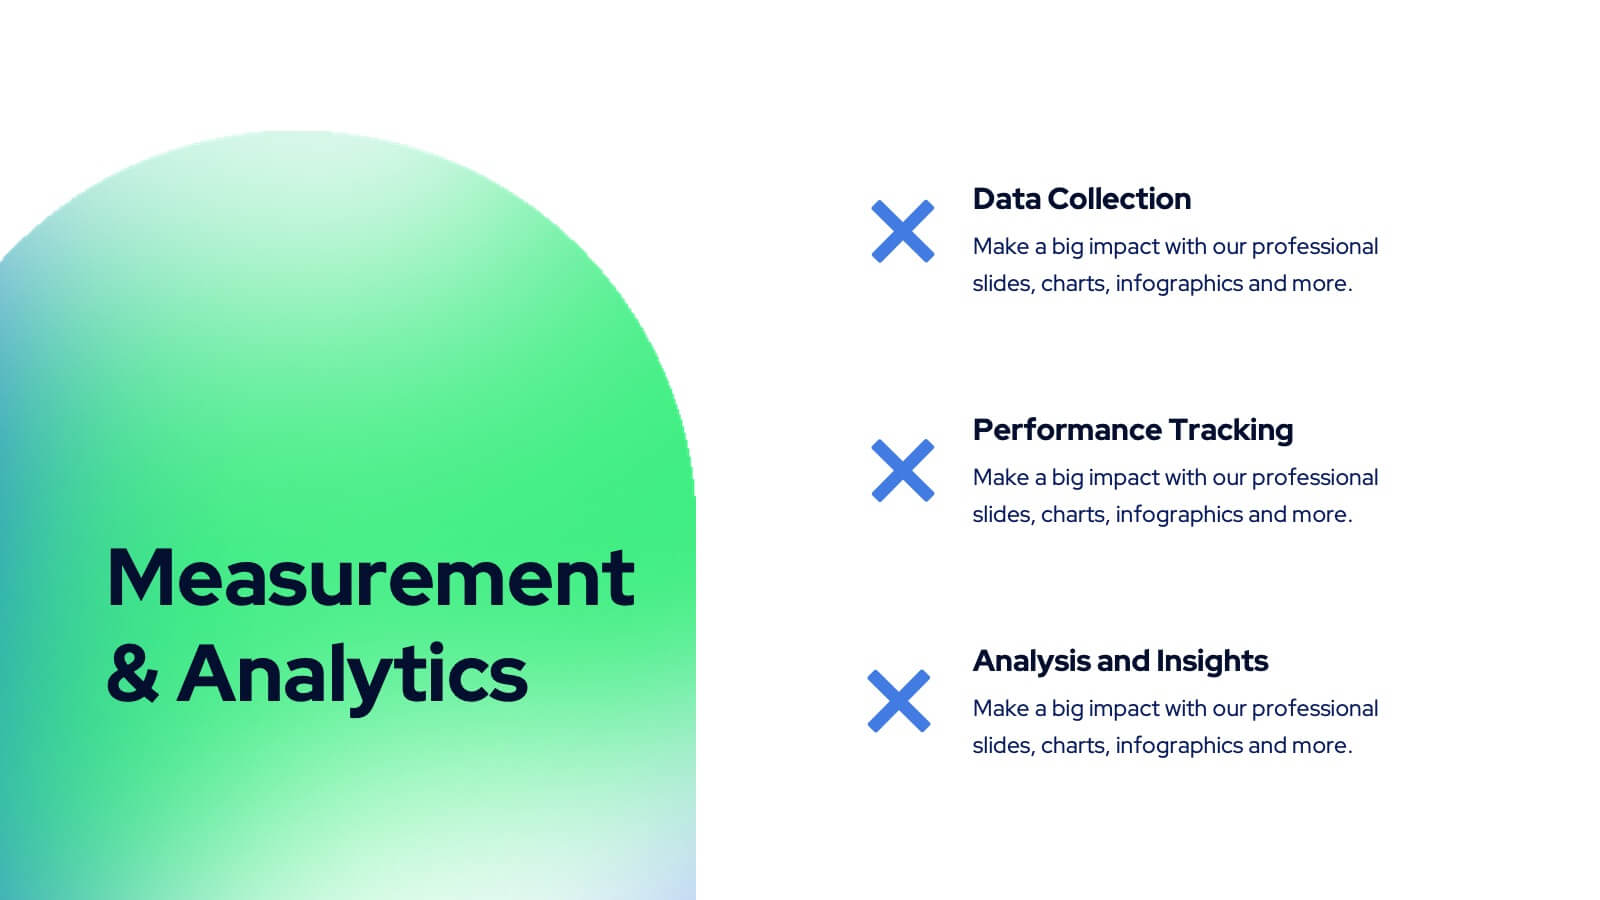
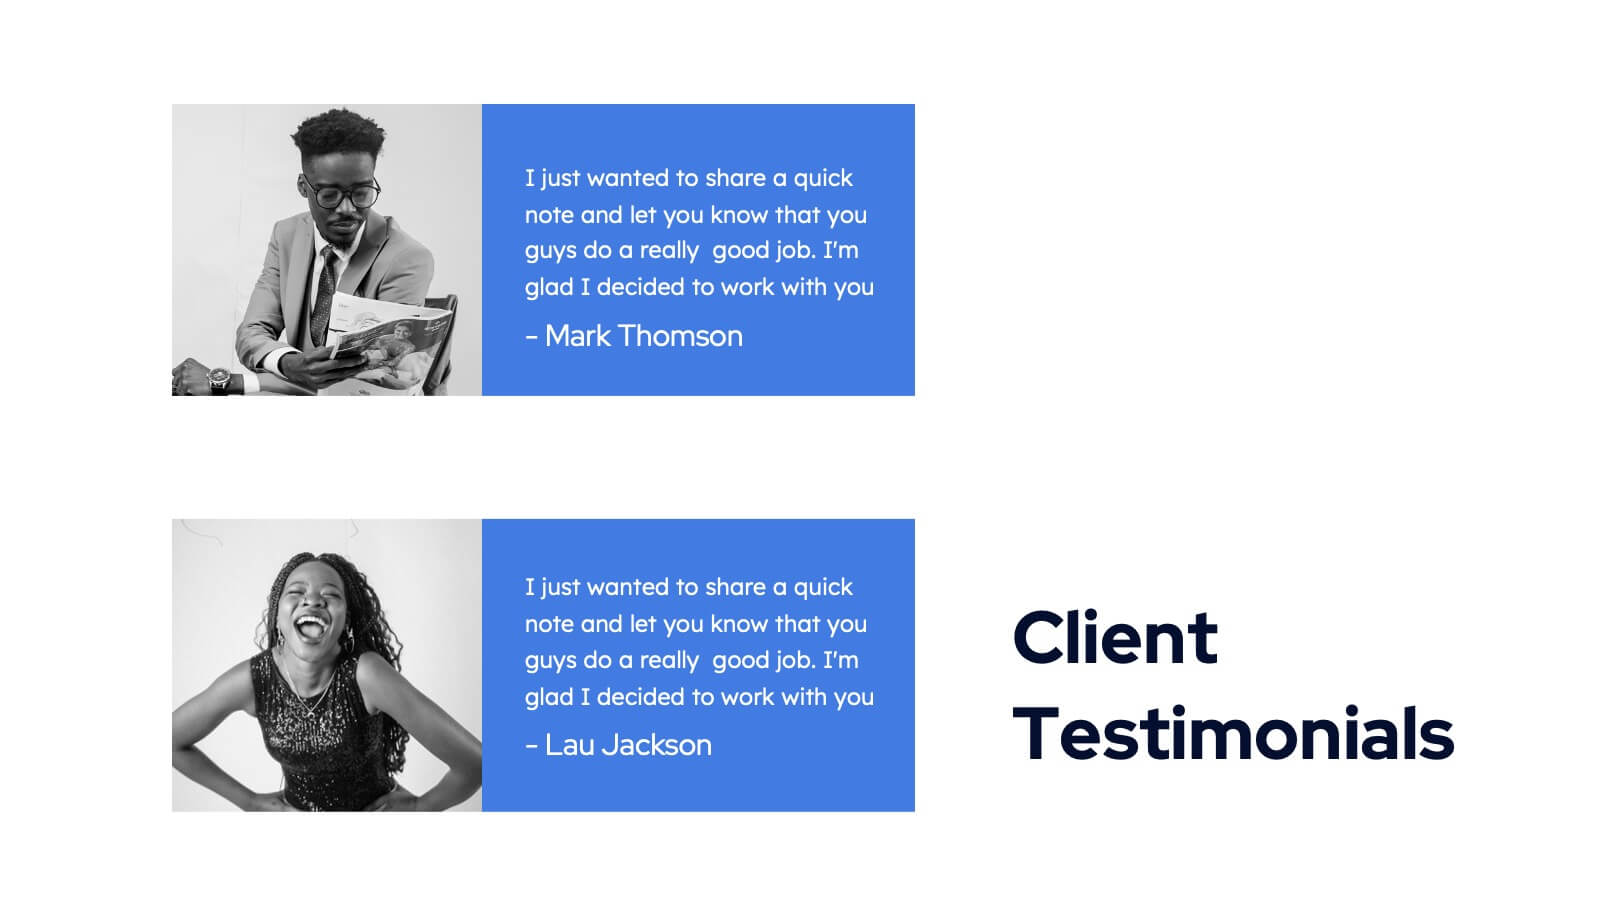
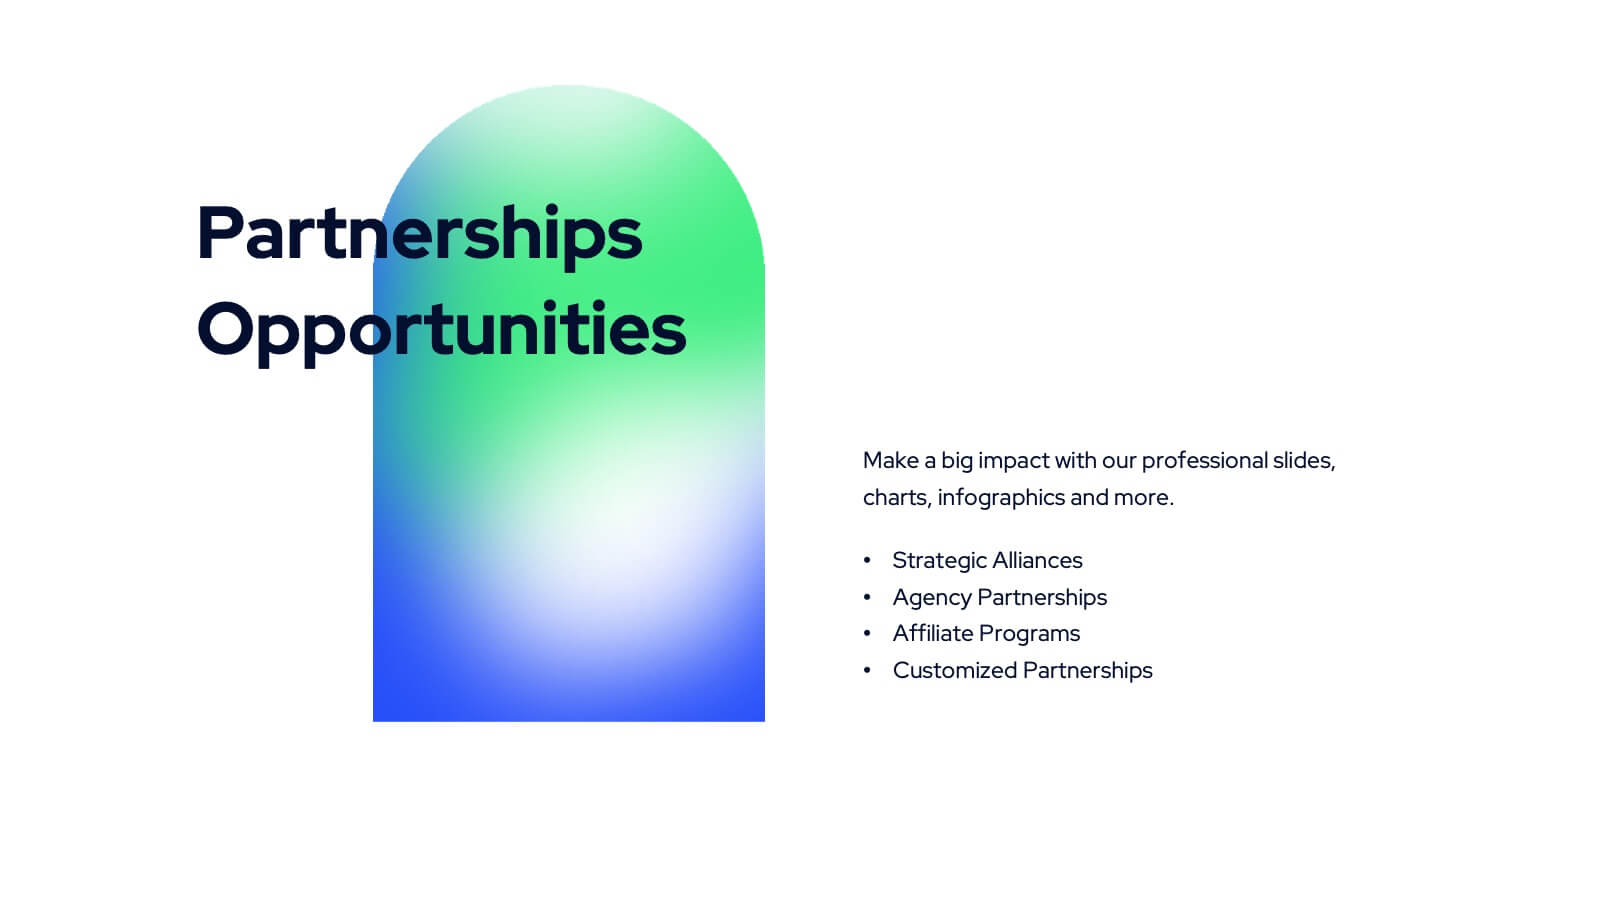
Tanzanite Full-Service Agency Project Plan Presentation
Showcase your agency's strengths with this bold and modern portfolio presentation template! From client success stories and case studies to market analysis and strategy development, this template highlights your expertise and approach. Perfect for agencies looking to present their services, creative processes, and partnerships. Compatible with PowerPoint, Keynote, and Google Slides, making it easy to impress any audience.


20 slides
Sphene Sales Proposal Presentation
Take your sales pitch to the next level with this elegant and structured presentation template! Featuring sections on sales objectives, process, pricing strategies, and performance metrics, this template is ideal for impressing potential clients and closing deals. It’s easy to customize and works seamlessly with PowerPoint, Keynote, and Google Slides for hassle-free presentation creation.


6 slides
Stock Market Investment and Analysis Presentation
Showcase your market insights with this dynamic zigzag arrow diagram—perfect for highlighting bullish vs. bearish trends, financial analysis, and investment milestones. The slide features a split-path layout with icons and editable text areas to clearly compare strategies or illustrate turning points. Fully customizable in PowerPoint, Keynote, and Google Slides.


15 slides
Business Roadmap Infographic
A business roadmap is a strategic plan that outlines the goals, milestones, and key initiatives a company intends to achieve over a specific period. This infographic template is designed to showcase the strategic journey and future goals of a business or organization. This infographic presents a clear and concise overview of the business's roadmap, highlighting key milestones, objectives, and action plans for achieving success. The infographic features a horizontal timeline that represents the business's journey from its inception to the envisioned future milestones. Each milestone is accompanied by a brief description or icon to provide context.


8 slides
Team Statistics and Rankings Presentation
Showcase match performance, rankings, and team metrics with this Team Statistics and Rankings Presentation. Visualize key game stats using editable diagrams, heatmaps, and comparison scores. Perfect for sports analysts, coaches, or recap slides. Compatible with PowerPoint, Keynote, and Google Slides—fully customizable for your team’s specific data and branding needs.


7 slides
Problem Infographic
These slides focus on presenting problem statements and their contexts in a professional and accessible format. The use of a soft, consistent color palette helps to keep the presentation visually appealing while ensuring that the content remains the focal point. Each slide is designed with ample space for text and icons, which aids in breaking down complex issues into understandable segments. The variety of layouts ensures that you can tailor the presentation to the nature of the problem being addressed, whether it requires more textual explanations or benefits from the use of infographics and icons. These templates are well-suited for business meetings, academic presentations, or any scenario where clear communication of challenges is necessary. They can be effectively used to initiate discussions, brainstorm solutions, or simply to highlight issues that need attention in a structured and organized manner.


4 slides
Team Performance Improvement Plan Presentation
Bring strategy to life with a clean, focused layout that makes team growth easy to follow. This template helps visualize performance gaps, goals, and action steps in a simple format, perfect for outlining improvement plans and productivity initiatives. Fully editable in PowerPoint, Keynote, and Google Slides for seamless team collaboration.
5 slides
Key Milestone Tracker for Projects Presentation
Track project progress and celebrate wins with the Key Milestone Tracker for Projects Presentation. This template features a vertical flow of trophy icons embedded in hexagons, each representing a major milestone. Ideal for showcasing achievements, timelines, or key phases in a project lifecycle. Fully customizable and compatible with PowerPoint, Keynote, and Google Slides.


7 slides
SEO Infographic Presentation Template
SEO stands for “search engine optimization.” In simple terms, it's the process of improving your site to increase its visibility when people search for products or services related to your business in Google and other search engines. Learn more about SEO with this clean template, including how to optimize your pages and how search engines work. This template will inform you how keywords and phrases drive search engine results, how they affect rankings, and what steps to take to achieve higher rankings. This template comes packed with fun illustrations, and can be used as a great presentation.


7 slides
Business Office Scenes Infographic Presentation
Office Scene Infographics can be a valuable tool for businesses or organizations that want to showcase their workplace culture or attract potential employees by providing a visual representation of what it's like to work at their company. This template is designed to provide a visual representation of different office scenarios and activities. The template is fully customizable and can be used for a variety of purposes, such as internal communication, training, marketing, and educational. It has a unique design, easy customization, and compatibility with Powerpoint, Keynote and Google Slides.


6 slides
Process Direction Flow Mapping
Showcase linear progress with clarity using the Process Direction Flow Mapping Presentation. This layout features a clean, step-by-step directional flow with five stages, ideal for outlining project phases, business workflows, or timeline milestones. Each stage is color-coded with editable text areas, making it easy to customize and adapt for PowerPoint, Keynote, or Google Slides.


5 slides
SEO Optimization Infographics
The goal of SEO optimization is to attract more organic traffic to a website by improving its search engine ranking for relevant keywords and phrases. These Infographics are visual representations that show the steps, techniques, and best practices for improving a website's ranking in search engine results pages. These allow you to provide a quick and easy-to-understand overview of SEO concepts and strategies, including keyword research, on-page optimization, link building, and technical SEO. These are valuable resources for anyone looking to improve their website's search engine ranking and increase organic traffic.