


Features
- 8 Unique slides
- Fully editable and easy to edit in Microsoft Powerpoint, Keynote and Google Slides
- 16:9 widescreen layout
- Clean and professional designs
- Export to JPG, PDF or send by email


Do you have any questions?
Recommend


8 slides
Credit Card Comparison Presentation
The "Credit Card Comparison" presentation template visualizes the differences between credit and debit card options in a straightforward and engaging way. Featuring side-by-side comparisons, the template allows for easy insertion of key points such as fees, benefits, and suitability for different user profiles, making it an excellent tool for financial educators, advisors, and banking professionals. The template’s design ensures that the content is accessible and relatable, making complex financial concepts easier to grasp for the audience. This makes it ideal for presentations aimed at educating consumers about financial choices or for internal training within financial institutions.


6 slides
Progress Monitoring Infographic
Progress monitoring provides insights into whether a project is on track, identifies any areas of concern or challenges, and informs decision-making. This infographic template is a visual representation of how to effectively monitor and track progress in various projects, tasks, or initiatives. This infographic aims to provide a clear overview of the steps and strategies involved in monitoring progress to ensure that goals are being met. This infographic is designed to provided insights into whether a project is on track, identifies any areas of concern or challenges, and informs decision-making to ensure successful project management.


5 slides
5 Whys Analysis Slide Presentation
Unlock problem-solving clarity with a vibrant, puzzle-style layout that helps teams dig deeper and uncover the true reason behind any challenge. This presentation guides viewers through each “why” step in a simple, structured flow, making root-cause insights easy to communicate. Fully compatible with PowerPoint, Keynote, and Google Slides.


5 slides
SMART Objectives Slide Presentation
Kick your planning into gear with a bold, structured layout that makes goal-setting feel energetic and achievable. This presentation helps you outline clear objectives, track progress, and communicate strategy with a clean, organized flow designed for teams and leaders. Fully compatible with PowerPoint, Keynote, and Google Slides.


7 slides
Drawing Anatomy Infographic
Dive into the captivating world of human anatomy with our drawing anatomy infographic. Crafted with vibrant hues of green, orange, red, and blue, this template brings to life the intricacies and artistry of the human form. Whether you're an aspiring artist, a seasoned illustrator, or an educator, this infographic is tailored to enhance your understanding or teaching of anatomical details. The fun, colorful design ensures engagement, making learning a visually pleasing experience. Seamlessly incorporate it into PowerPoint, Keynote, or Google Slides for versatile and effective presentations.


22 slides
Wave Startup Strategy Presentation
Pitch your startup strategy with this modern, vibrant template! It covers essentials like mission, vision, product overview, market analysis, and growth plans. Perfect for highlighting your team, financials, and milestones. Seamlessly compatible with PowerPoint, Keynote, and Google Slides for a smooth, professional presentation every time.


6 slides
Project Summary Report Presentation
Enhance your project reviews with our "Project Summary Report Presentation" template. This slide is expertly designed to summarize key project aspects such as objectives, milestones, and outcomes, structured into sections labeled A, B, and C. Featuring an image of a collaborative team setting, the template underscores the essence of teamwork and productivity in project management. Each section is organized to clearly communicate your project’s progress and results to stakeholders. Ideal for project managers and teams, this template supports effective storytelling in project updates. Compatible with PowerPoint, Keynote, and Google Slides, it’s an essential tool for delivering impactful and organized project presentations.


5 slides
Multi-Step Procedure and Execution Flow Presentation
Visualize complex processes with clarity using the Multi-Step Procedure and Execution Flow Presentation. Ideal for SOPs, task breakdowns, or team workflows, this layout helps you present sequential actions, decision points, and outcomes with a clean, structured flow. Fully editable in PowerPoint, Canva, and Google Slides.


7 slides
Harvey Ball Charts Infographic
A Harvey Ball is a simple, round graphic used for visual representation and communication of qualitative information. This infographic template harnesses the power of Harvey Balls, those simple yet potent icons, to convey information and insights in a visually striking manner. Highlight strategies to engage the audience effectively using Harvey Balls. Fully customizable and compatible with Powerpoint, Keynote, and Google Slides. This infographic allows you to explore the ability to customize Harvey Balls, varying in size, color, and style to suit your unique data representation needs.


7 slides
Harvey Ball Competitive Analysis Infographic
Enhance your competitive analysis presentations with our Harvey Ball Infographic, an excellent resource for business analysts, product managers, and market researchers. This infographic uses Harvey Balls to visually convey the comparison of product features or company services against competitors in the market. Our Harvey Ball Infographic offers a clear, comparative perspective of how different offerings stack up in key areas. It’s particularly useful for demonstrating product strengths, areas for improvement, and market positioning. With customizable Harvey Ball charts, you can reflect levels of completeness, satisfaction, or performance, allowing for an at-a-glance assessment that is both intuitive and impactful. This SEO-optimized infographic is tailored to make your competitive analysis resonate with stakeholders and decision-makers. Use this infographic to provide a snapshot of where your products or services stand in the competitive landscape, informing strategy and guiding development priorities.


5 slides
Cyber Security Risk Management Presentation
Effectively visualize your digital defense strategy with this cyber security-themed presentation layout. Featuring a sleek laptop illustration and circular infographic design, this template helps you outline five critical areas of risk management with matching icons and editable text sections. Ideal for IT teams, consultants, or training sessions. Fully customizable and compatible with PowerPoint, Keynote, and Google Slides.


5 slides
Creative Brainstorming Presentation
Enhance your brainstorming sessions with this Creative Brainstorming template. Designed with a modern head outline and idea mapping structure, it visually organizes key insights for innovative discussions. Fully customizable with editable text, colors, and icons to fit your needs. Compatible with PowerPoint, Keynote, and Google Slides for seamless integration.


26 slides
AIl for Social Good Presentation
Harness the power of technology for positive change with this inspiring presentation on AI for social good. Covering topics like ethical AI, humanitarian applications, sustainability, and global impact, this template helps showcase how artificial intelligence can drive meaningful progress. Fully customizable and compatible with PowerPoint, Keynote, and Google Slides for a seamless experience.


5 slides
Employee Onboarding HR Presentation
Start your presentation with energy and clarity using this clean, engaging slide designed to simplify every step of the onboarding journey. It helps explain employee integration, training stages, and team alignment in a way that feels intuitive and visually organized. Fully compatible with PowerPoint, Keynote, and Google Slides.


6 slides
Sustainability Management Analysis Infographics
Explore the world of Sustainability Management with our customizable infographic template. This template is fully compatible with popular presentation software like PowerPoint, Keynote, and Google Slides, allowing you to easily customize it to illustrate and communicate various aspects of sustainability management. The Sustainability Management infographic template offers a visually engaging platform to explore and explain the principles, strategies, and initiatives related to sustainability within organizations. Whether you're a sustainability professional, business leader, or simply interested in environmental responsibility, this template provides a user-friendly canvas to create informative presentations and educational materials. Deepen your understanding of Sustainability Management with this SEO-optimized infographic template, thoughtfully designed for clarity and ease of use. Customize it to highlight key sustainability goals, best practices, metrics, and the importance of sustainable business practices, ensuring that your audience gains a comprehensive understanding of this critical field. Start crafting your personalized infographic today to delve into the world of Sustainability Management.


4 slides
Break-Even Point Financial Analysis Presentation
Clearly define profitability with this break-even point financial analysis template. It visually maps costs, revenue, and profitability, helping businesses assess when they'll cover expenses and start making a profit. Perfect for financial forecasting and business planning. Fully customizable and compatible with PowerPoint, Keynote, and Google Slides for seamless editing and presentation.


22 slides
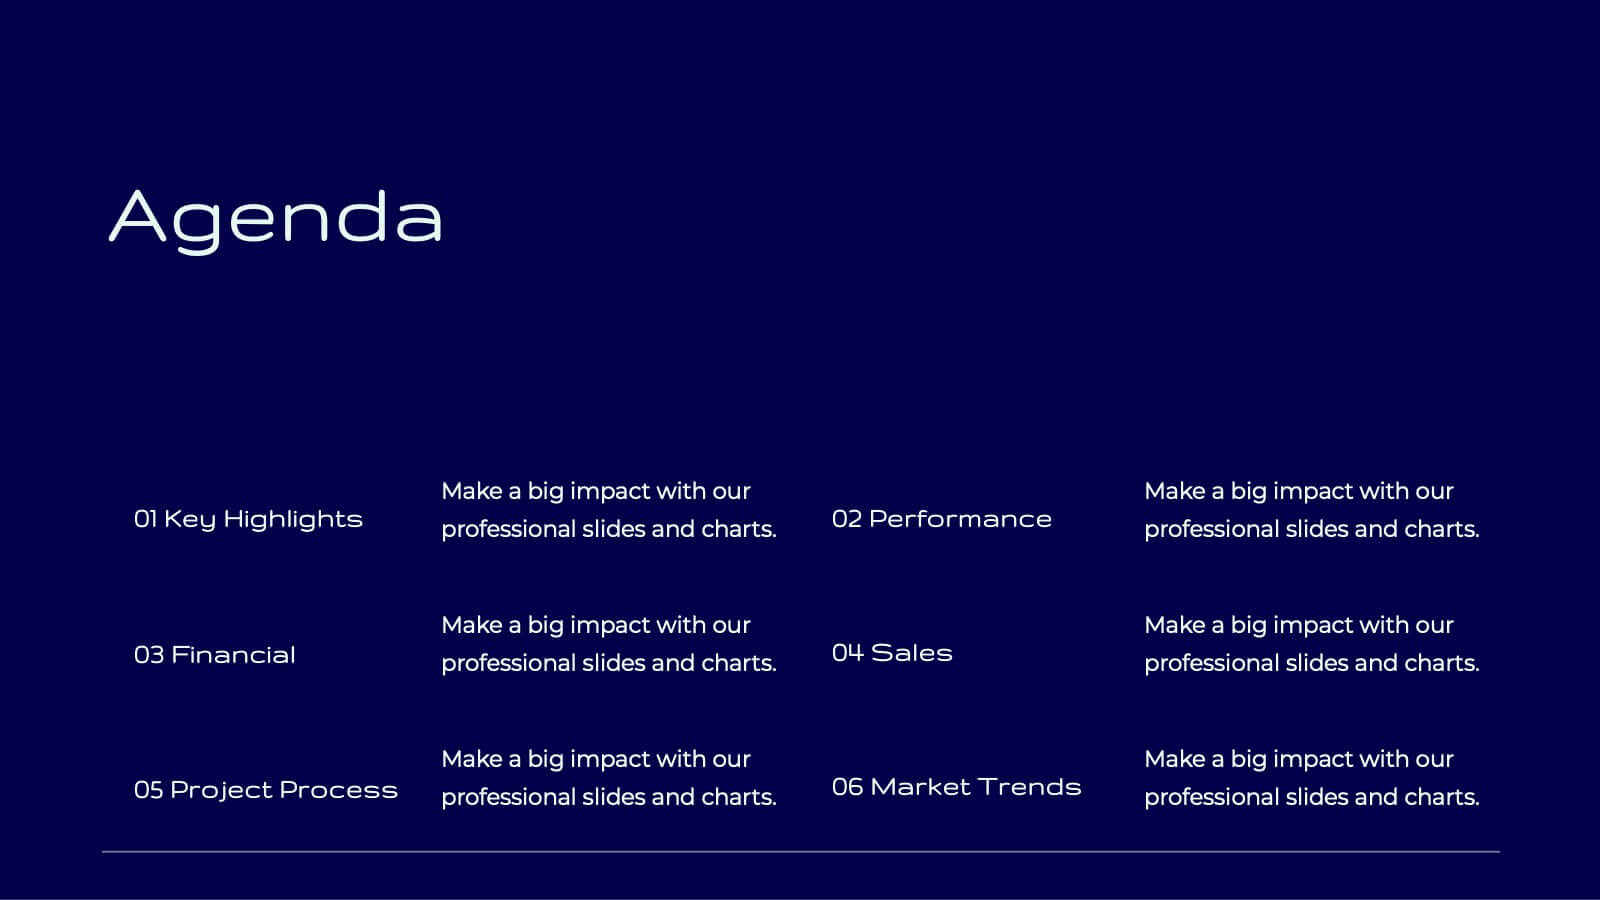
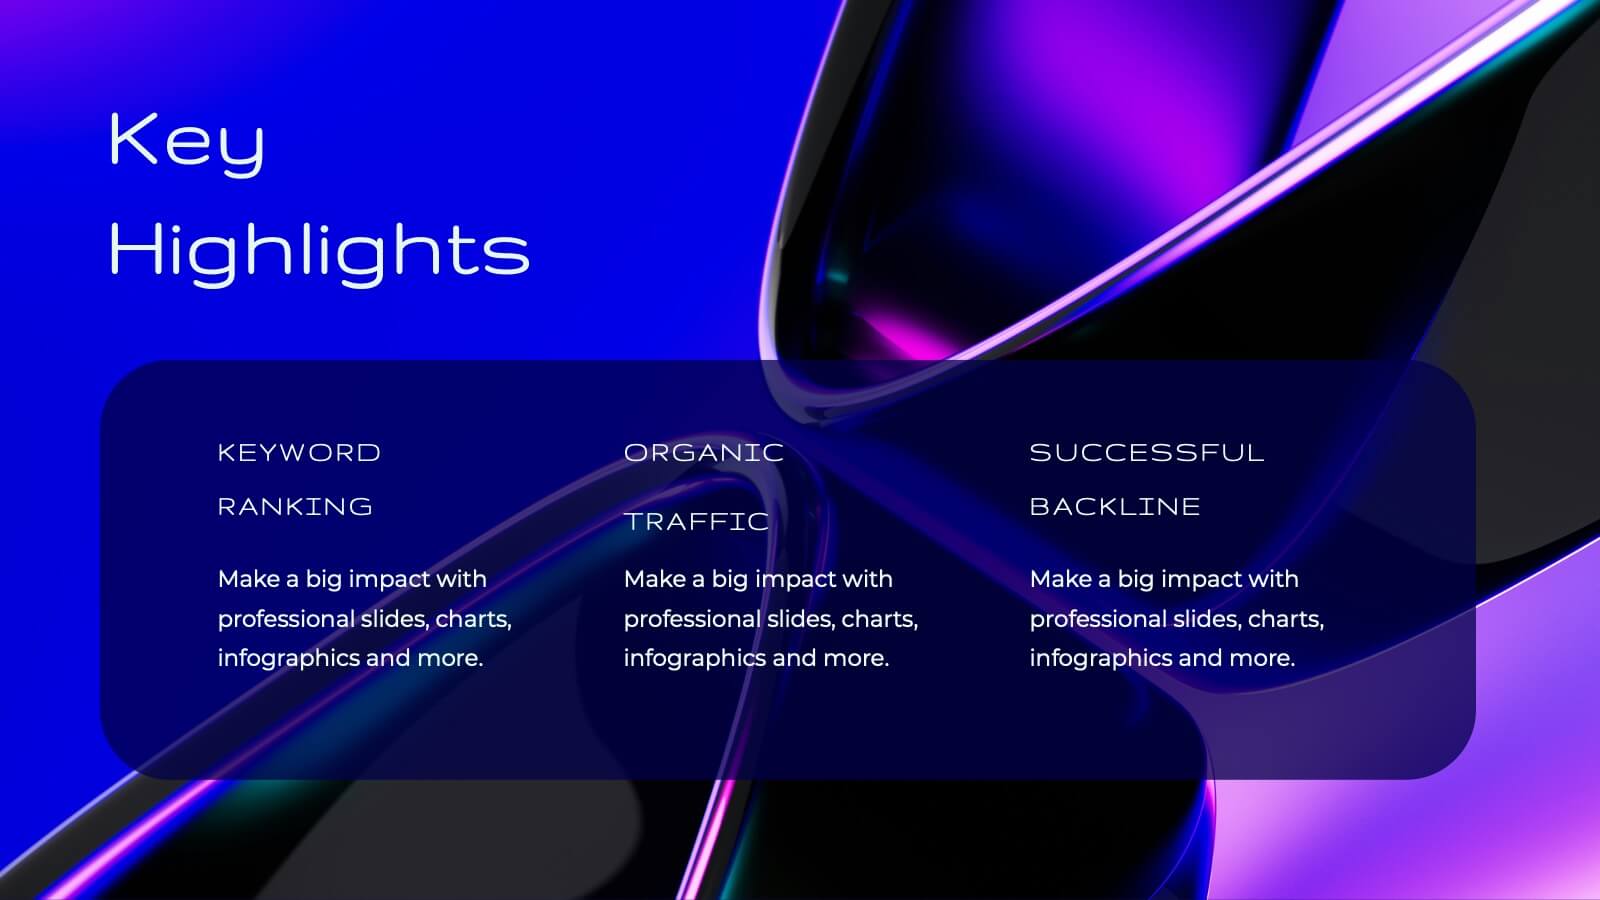
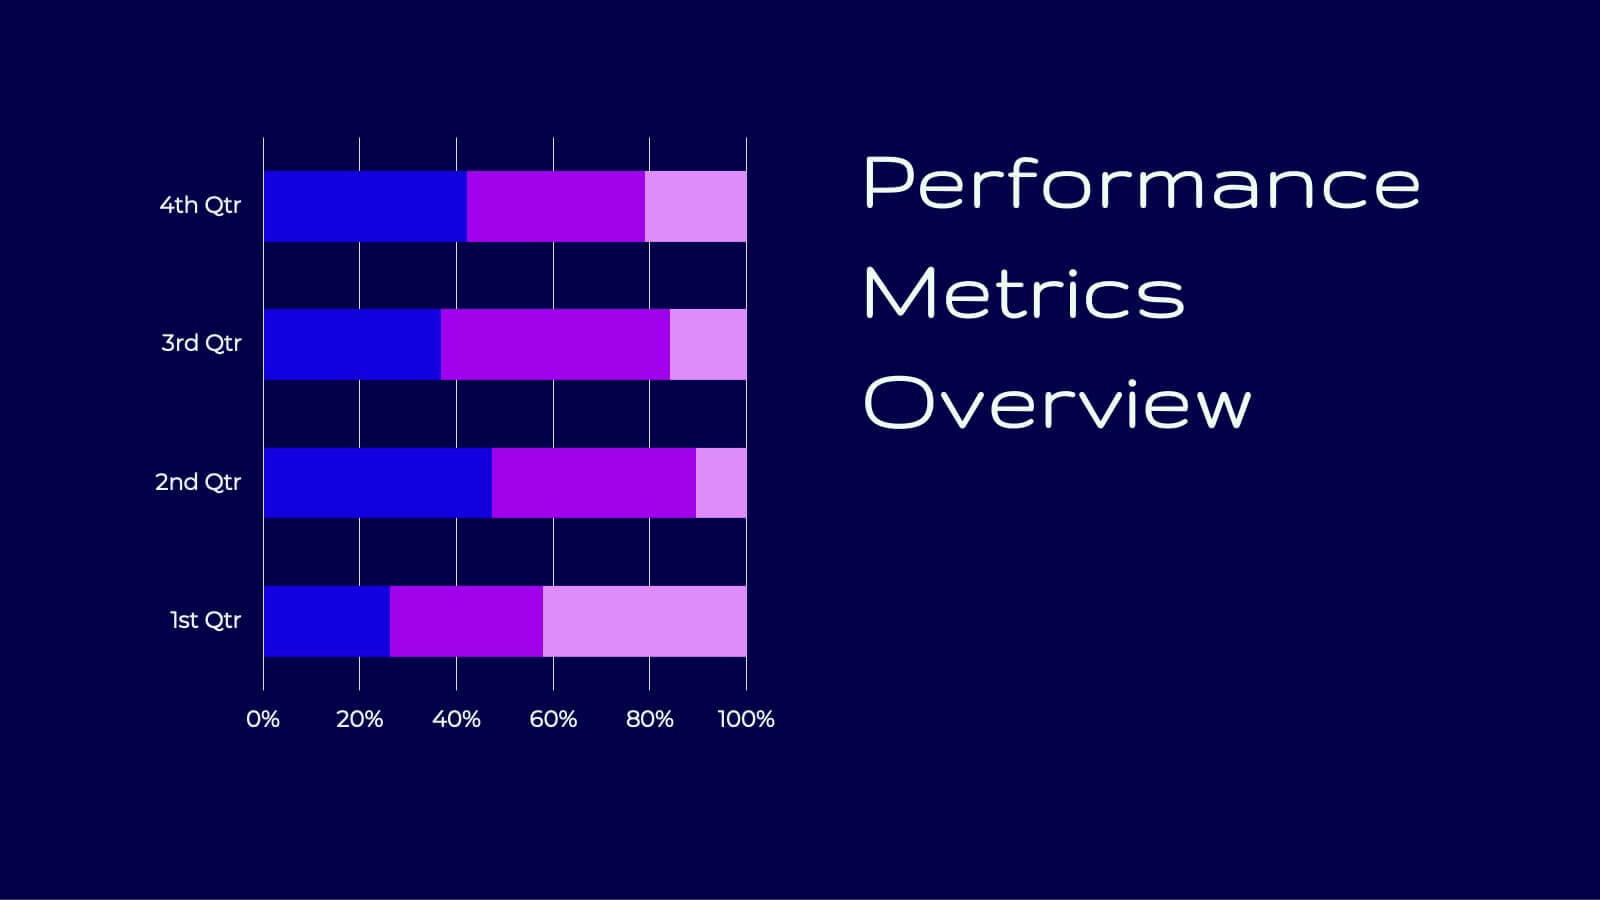
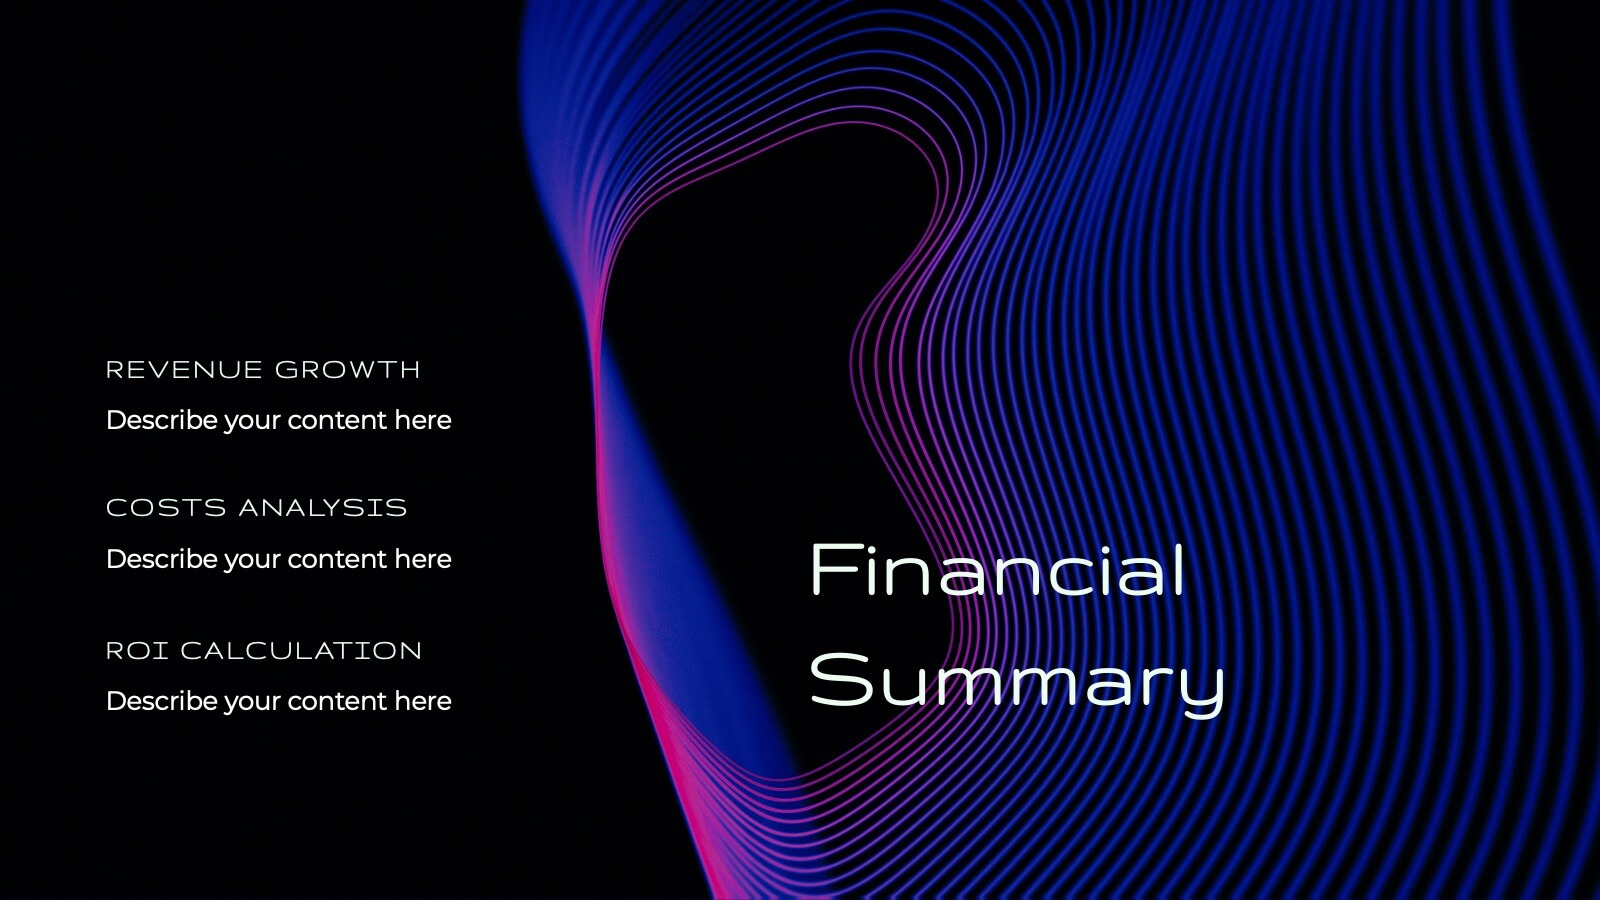
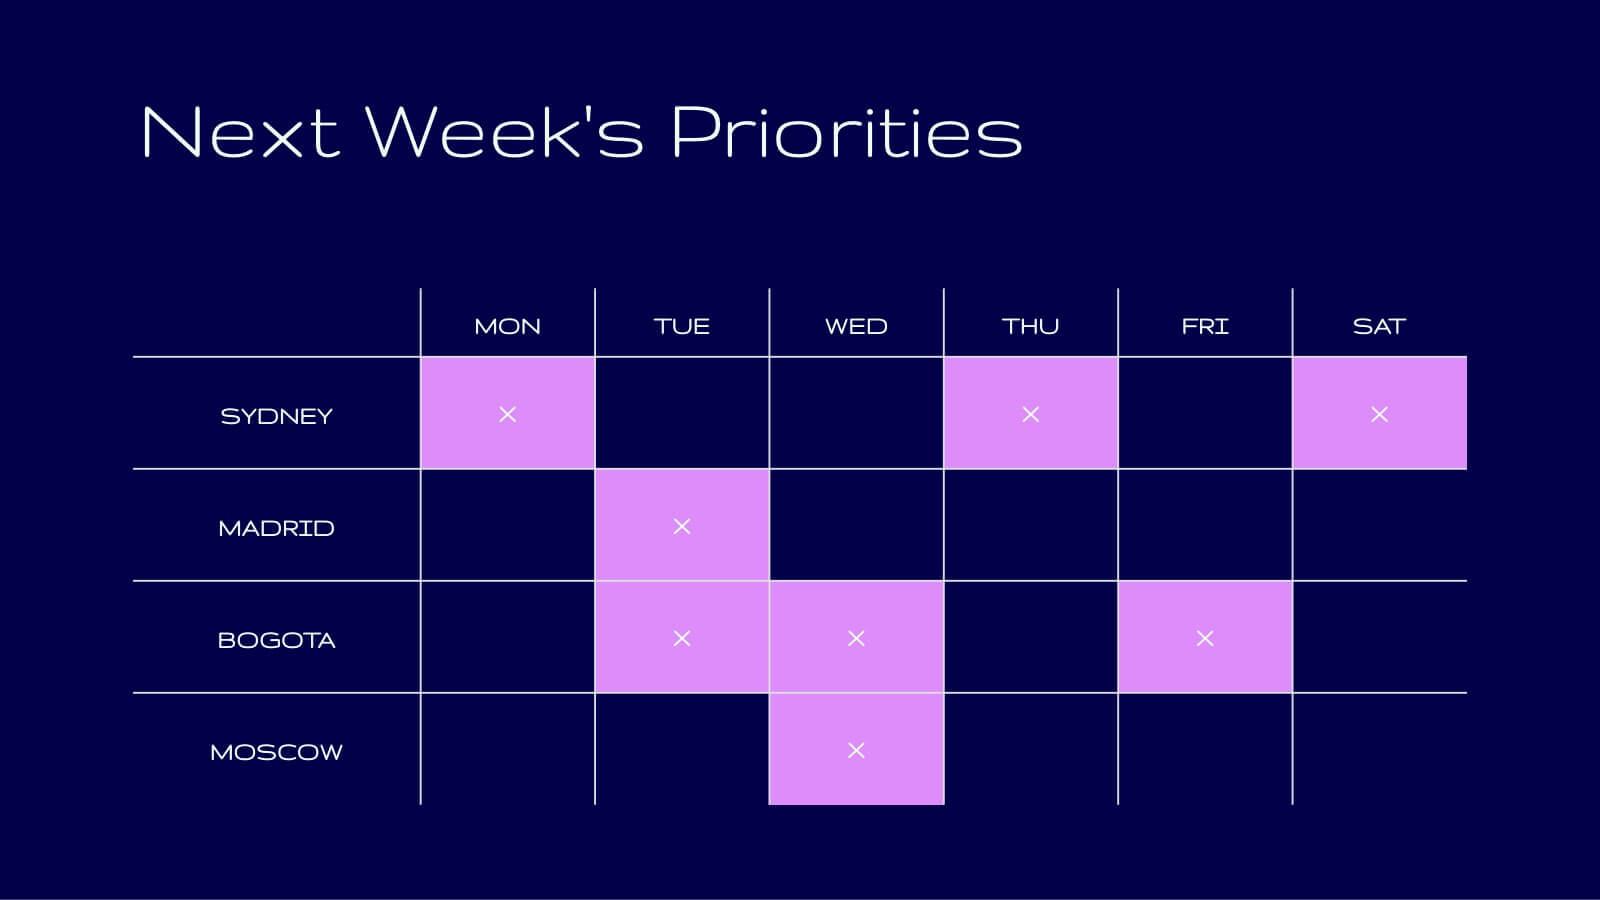
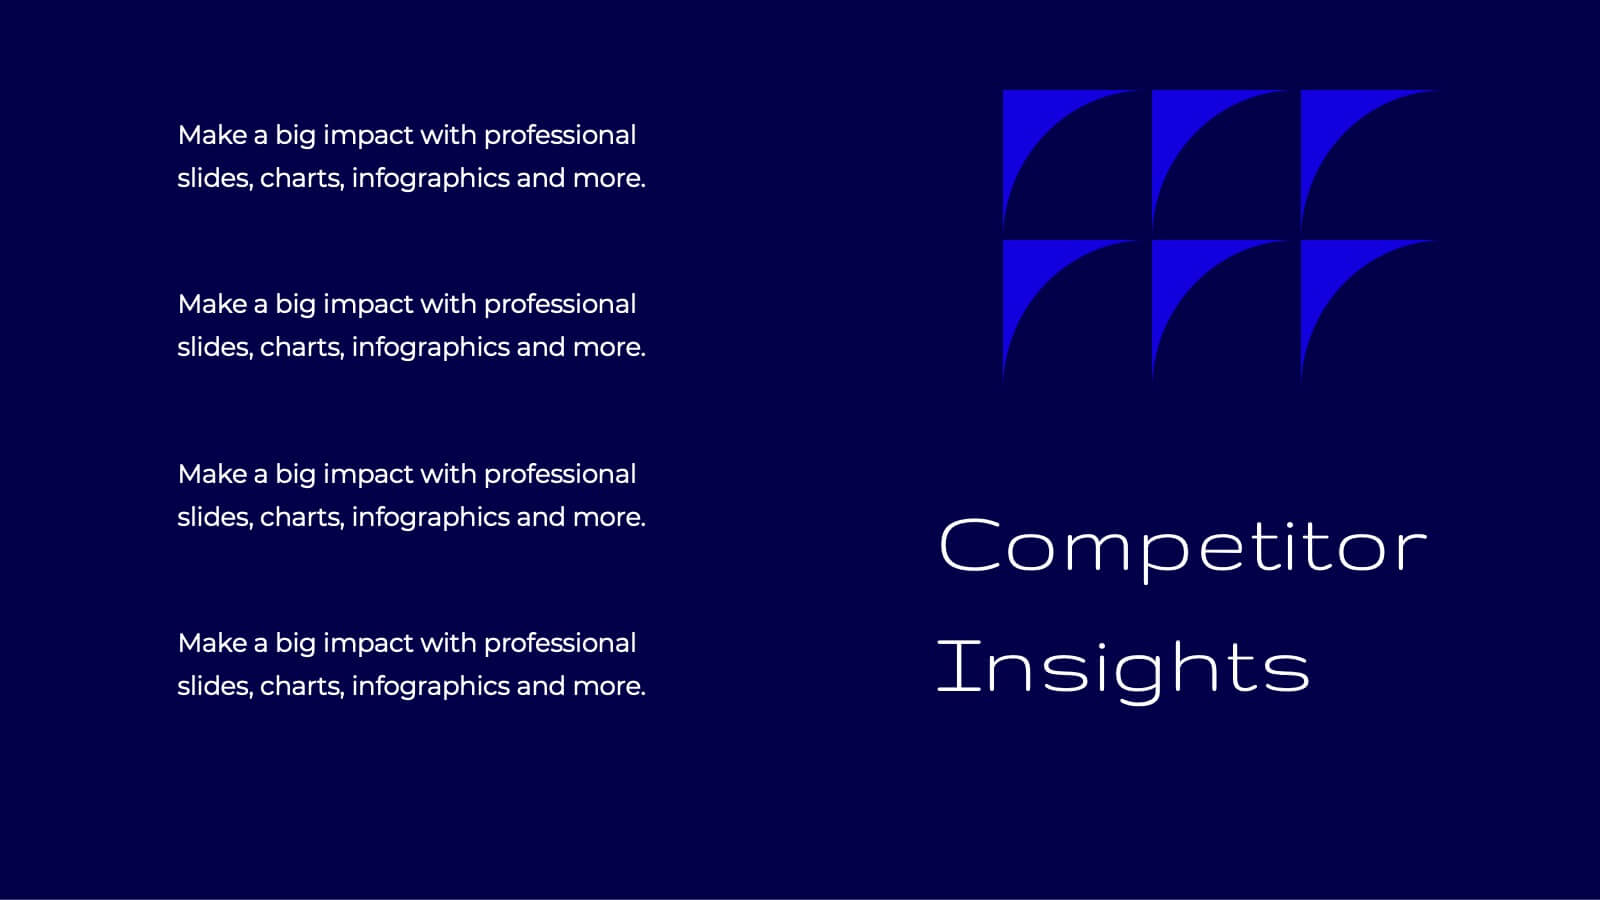
Tidal Research Findings Report Presentation
Deliver your research findings with impact using this sleek and modern report template! It covers key highlights, performance metrics, project progress, and competitor insights, making it ideal for clear, professional presentations. Perfect for summarizing challenges, solutions, and strategic initiatives. Compatible with PowerPoint, Keynote, and Google Slides for seamless reporting.