


Features
- 15 Unique slides
- Fully editable and easy to edit in Microsoft Powerpoint, Keynote and Google Slides
- 16:9 widescreen layout
- Clean and professional designs
- Export to JPG, PDF or send by email


Do you have any questions?
Recommend


20 slides
Astral UX UI Design Pitch Deck Presentation
Present your UX/UI design with flair! This template covers everything from design briefs and process steps to mood boards and final presentations. Perfect for showcasing design elements, wireframes, and project timelines. Ideal for impressing stakeholders and clients. Compatible with PowerPoint, Keynote, and Google Slides. Make your design pitch unforgettable!


6 slides
Business Challenges and Solutions Presentation
Address challenges with strategic solutions using this Business Challenges and Solutions template. Featuring a clear side-by-side layout, this design helps visualize business obstacles and their corresponding solutions for effective decision-making. Perfect for problem-solving discussions, strategy meetings, and brainstorming sessions, this template ensures your content remains structured and impactful. Fully customizable for PowerPoint, Keynote, and Google Slides.


7 slides
7 Elements of McKinsey Framework Presentation
Turn complex organizational elements into a simple, story-driven visual with a clean layout that highlights how each component connects back to core values. This presentation helps you explain relationships, improve alignment, and support strategic decision-making with clarity and ease. Fully editable and compatible with PowerPoint, Keynote, and Google Slides.


5 slides
Education Department Infographics
The Education Department, also known as the department of education or ministry of education, is a government or administrative body responsible for overseeing and regulating education within a particular jurisdiction. This infographic template is designed to showcase the key aspects and functions of an education department within an organization or institution. It provides an informative overview of the department's goals, initiatives, programs, and achievements. This is the perfect template for educational institutions, government departments, or organizations with an education-focused division. Compatible with Powerpoint, Keynote, and Google Slides.


5 slides
Long-Term Strategy Slide Presentation
Ignite big ideas with a bold, forward-moving layout that makes long-range goals feel inspiring and achievable. This presentation helps you outline future plans, key milestones, and strategic priorities with clarity and visual impact. Easy to edit and fully compatible with PowerPoint, Keynote, and Google Slides.


26 slides
Cutting-Edge AI Breakthroughs Presentation
Step into the future with this exciting presentation on cutting-edge AI breakthroughs. Covering advancements in machine learning, automation, ethical AI, and real-world applications, this template helps you present complex innovations with clarity and impact. Fully customizable and compatible with PowerPoint, Keynote, and Google Slides for a seamless and engaging presentation experience.


7 slides
Creative Thinking and Disruption Model
Visualize your strategy for breakthrough ideas with the Creative Thinking and Disruption Model Presentation. Featuring a bold head silhouette layout, this slide highlights six key elements of innovative thinking—perfect for workshops, leadership discussions, or startup pitches. Fully customizable in PowerPoint, Keynote, and Google Slides.


5 slides
Medical Systems and Drug Research Overview Presentation
Present critical insights with this heart-themed infographic, ideal for showcasing medical systems, drug development stages, or treatment data. The visual layout supports four key points with a clear, engaging style. Fully customizable in PowerPoint, Keynote, and Google Slides—perfect for researchers, healthcare analysts, and pharmaceutical presentations.


6 slides
Session-by-Session Agenda Breakdown Presentation
Easily outline and compare multiple sessions with this Session-by-Session Agenda Breakdown presentation. Designed to group agenda topics and supplementary content side by side, this layout is perfect for workshops, summits, or recurring meetings. Fully editable in Canva, PowerPoint, and Google Slides for seamless branding and customization.


6 slides
Social Relationship Infographics
Revitalize your presentations on social dynamics with our Social Relationship infographic, seamlessly compatible with Powerpoint, Keynote, and Google Slides. This infographic is a perfect addition for sociologists, relationship coaches, and educators who aim to discuss the complexities and interconnectedness of social relationships. The infographic offers a visual breakdown of different social relationship types, the dynamics within those relationships, and the factors influencing social interactions. It's designed to help audiences understand the different layers and nuances that make up social connections, whether in personal networks, communities, or professional environments. Incorporating this infographic into your presentations will assist in illustrating how relationships are formed, maintained, and evolved. It serves as an educational tool that can lead to deeper discussions about social bonds, communication patterns, and relationship management. Utilize this infographic to provide a clear and impactful visual representation of the fundamental concepts in social relationship studies.


4 slides
E-Learning Course Design Overview Presentation
Spark curiosity from the very first slide with a clean, modern layout that explains how effective online learning experiences are planned and delivered. This presentation walks through key elements of course structure, content flow, and learner engagement in a simple, visual way. Fully compatible with PowerPoint, Keynote, and Google Slides.


6 slides
Business Task Checklist Presentation
Bring order and focus to your workflow with a clean, structured layout that tracks progress and priorities at a glance. Ideal for project updates, task planning, or performance reviews, this presentation makes organization effortless. Fully compatible with PowerPoint, Keynote, and Google Slides for easy customization and professional use.


26 slides
Cassanra Presentation Template
Cassanra is a bold, professional template with a retro look. Its ravishing, modern aesthetic will stand out and grab your attention, while detailed design elements keep it readable. Packed with features like charts, timelines, and easy to edit text blocks, Cassanra is perfect for businesses as well as personal use. A mixture of bold colors are used to help keep the look appealing and easy to read. This template comes with a large amount of features from charts, timelines and an easy to edit text this template is perfect for businesses seeking to make an impression on their audience.


7 slides
Marketing Funnel Infographic
Chart your customers' journey with our marketing funnel infographic. Set on a pristine white canvas, enriched with the zest of orange, the insight of purple, the trust of blue, and the growth of green, this template vividly illustrates the stages of a customer's progression towards a purchase. Adorned with clear infographics, emblematic icons, and tailored image placeholders, it offers a panoramic view of conversion pathways. Expertly devised for Powerpoint, Keynote, or Google Slides. A prized possession for marketing professionals, digital strategists, business consultants, or any brand striving for conversion optimization.


6 slides
Market Sizing with TAM SAM SOM Strategy Presentation
Clearly define your market opportunity using the Market Sizing with TAM SAM SOM Strategy Presentation. This template breaks down Total Addressable Market, Serviceable Available Market, and Serviceable Obtainable Market with a visual bullseye format that’s intuitive and persuasive. Easily editable in PowerPoint, Keynote, and Google Slides.


20 slides
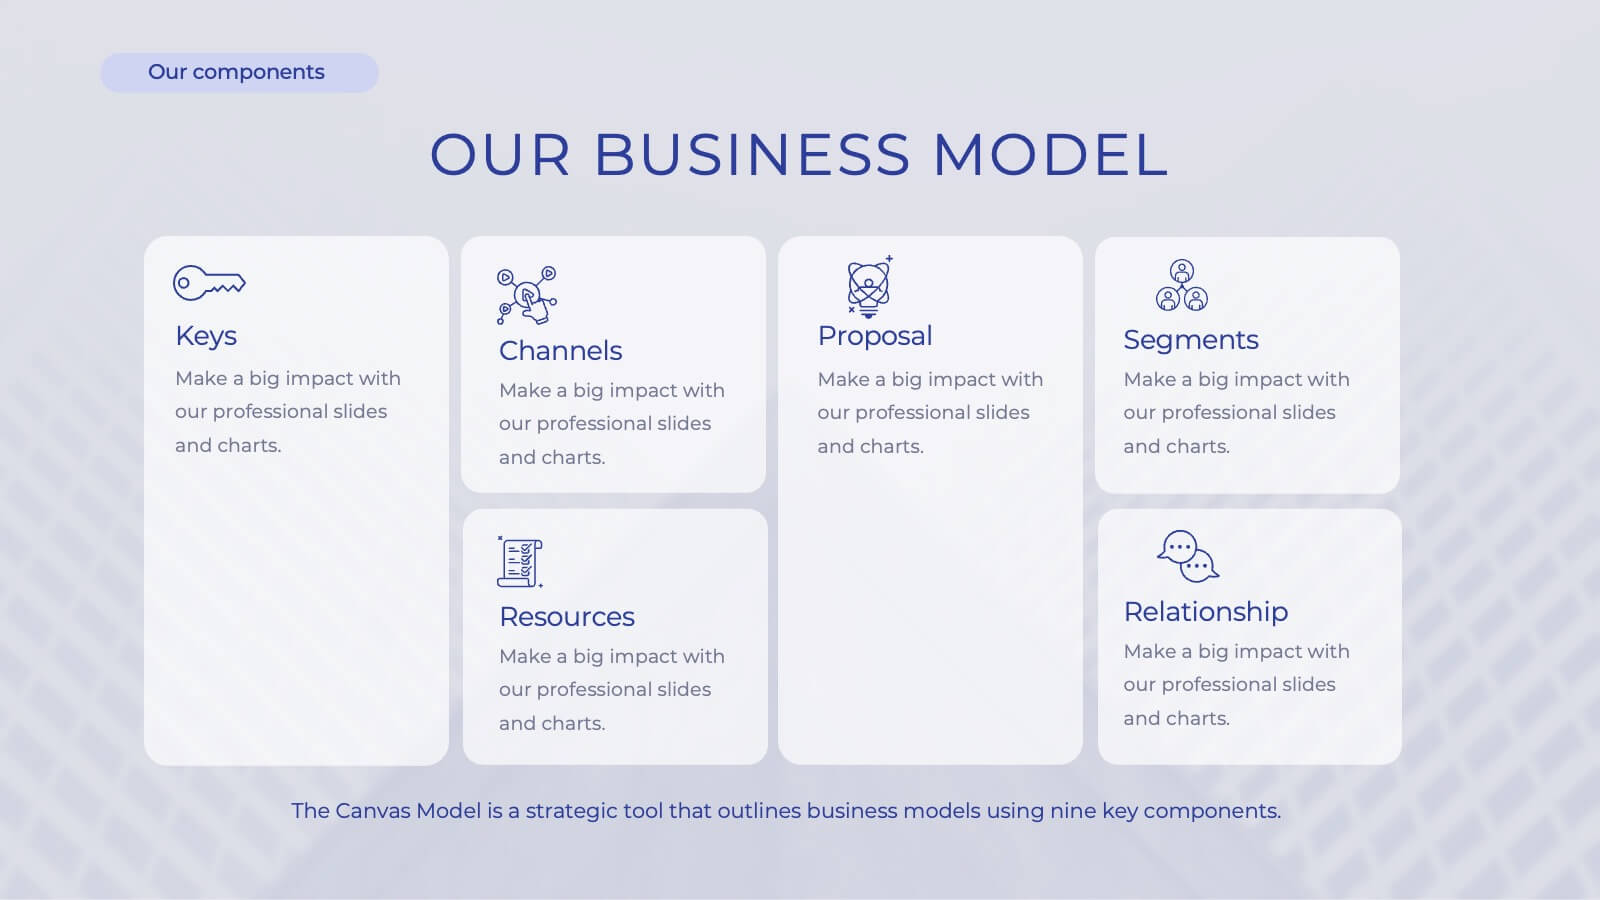
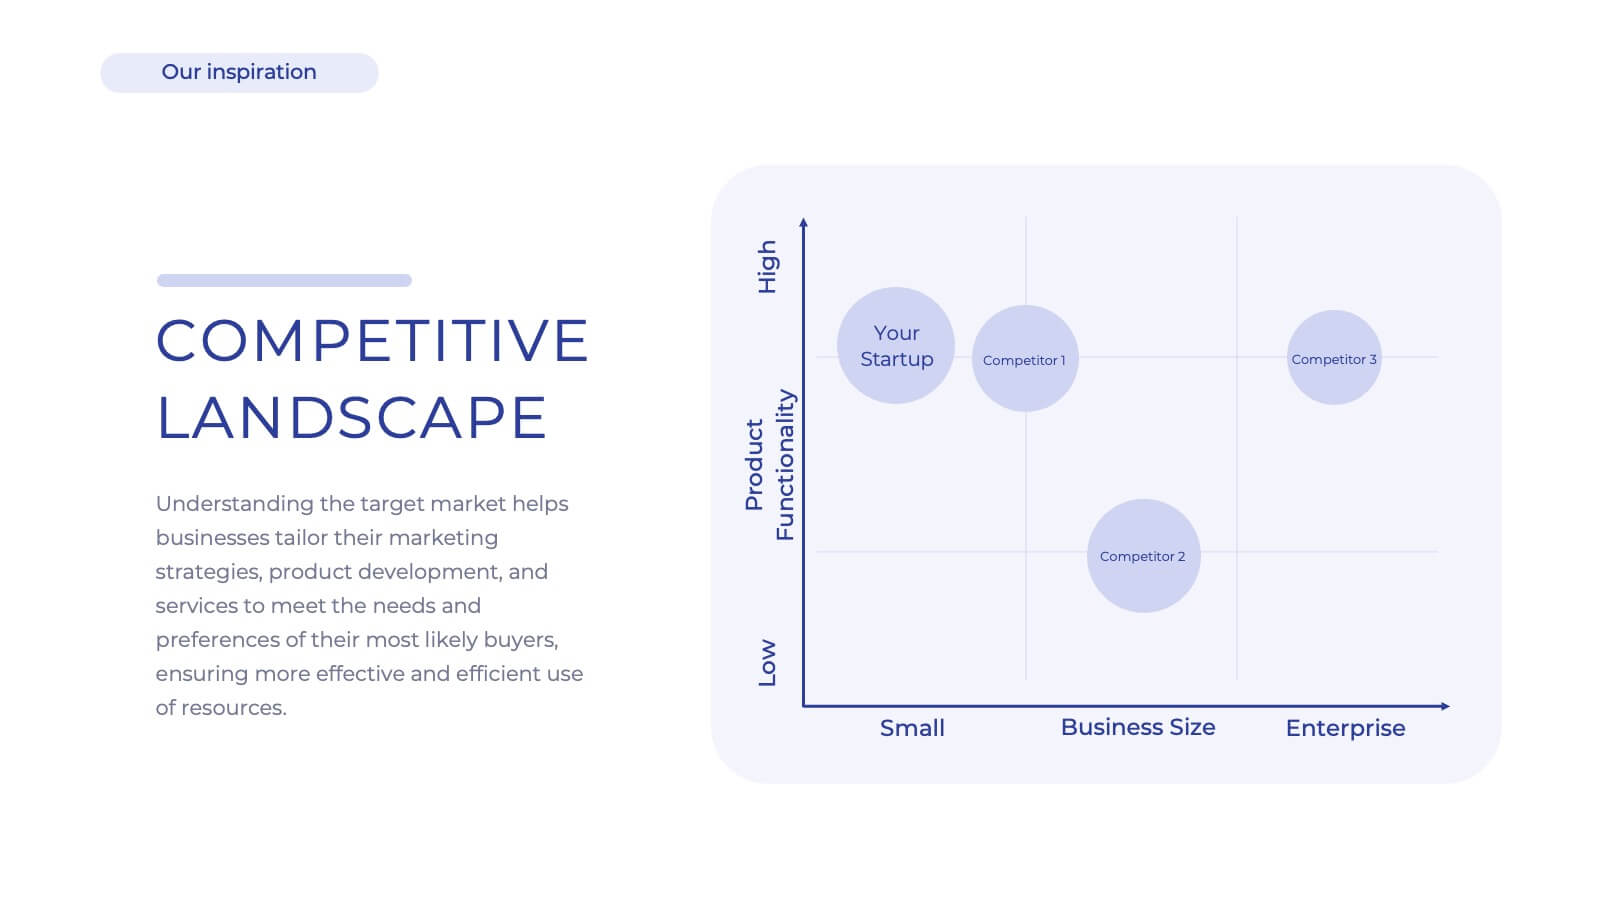
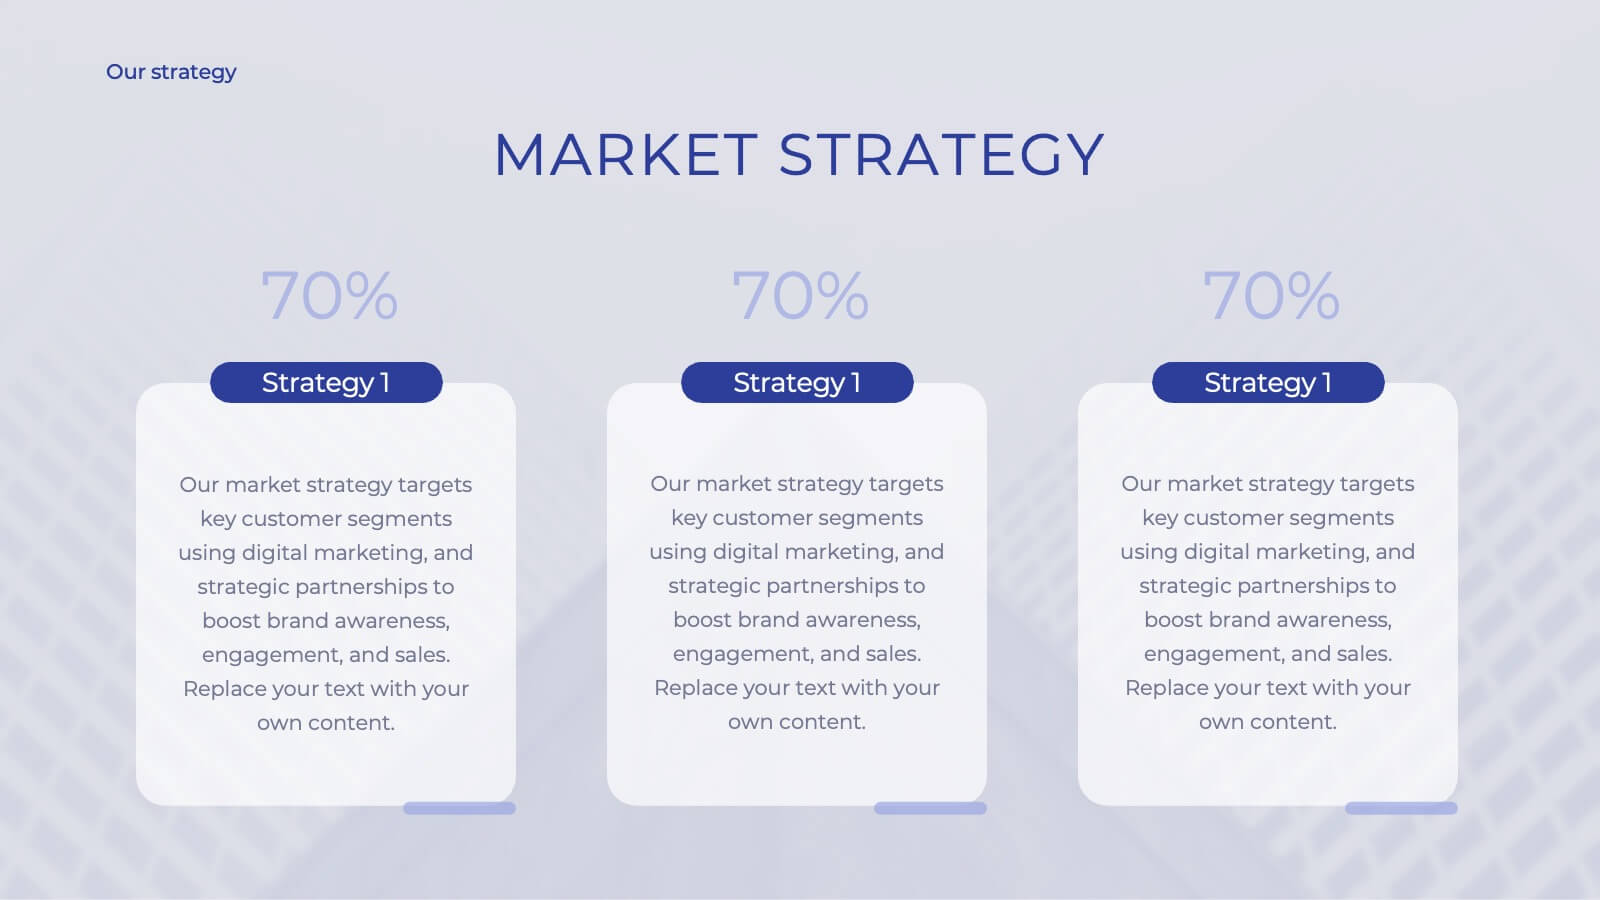
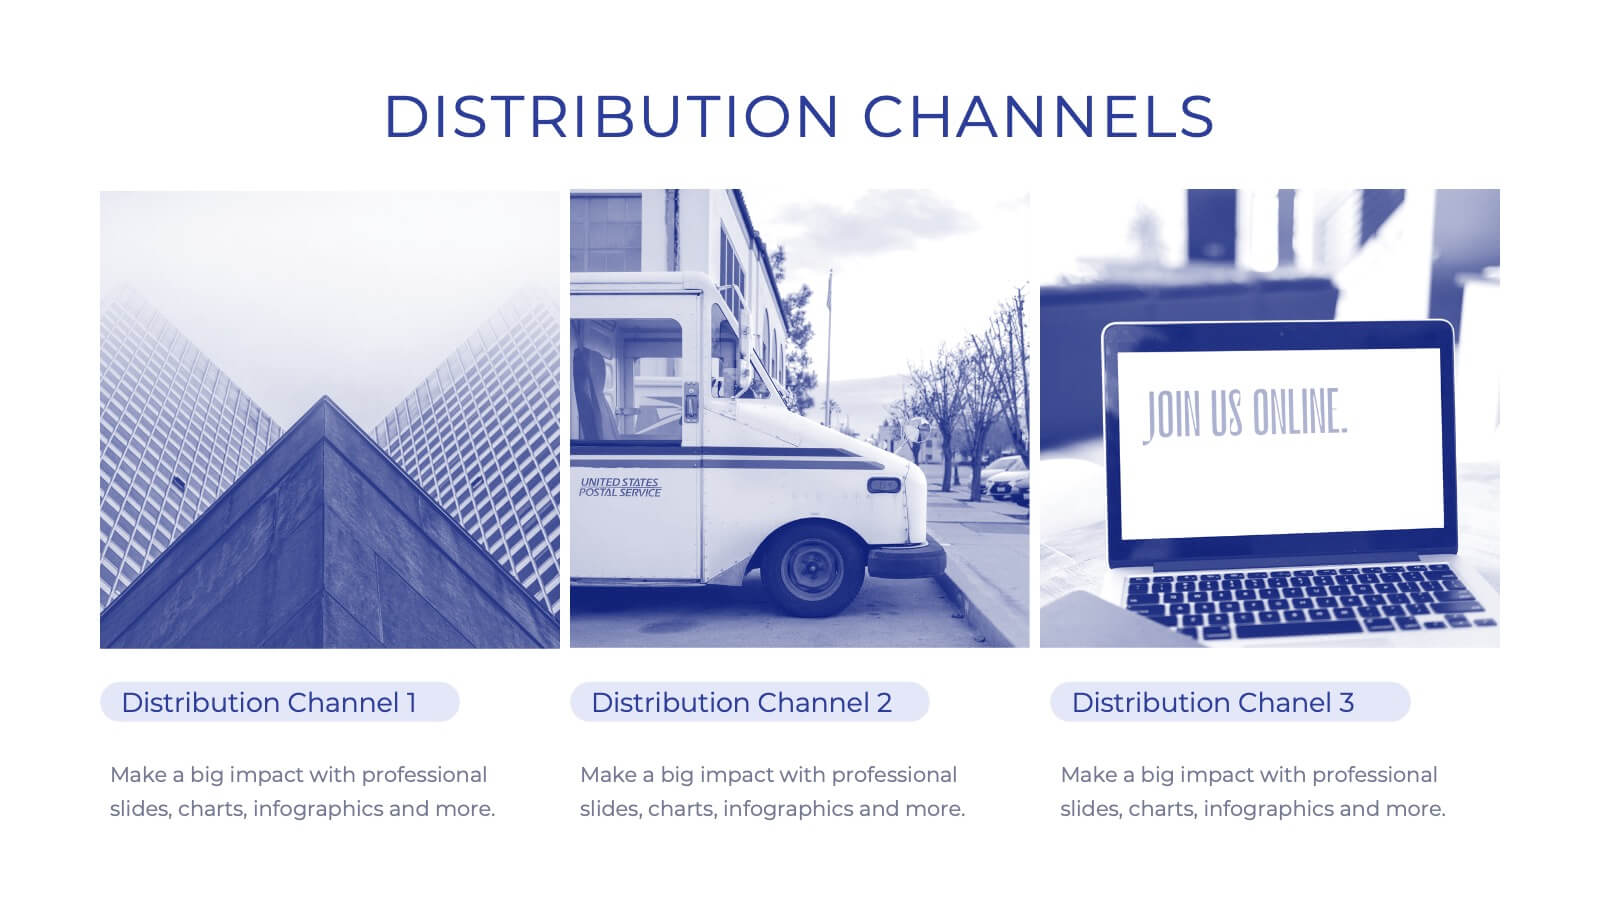
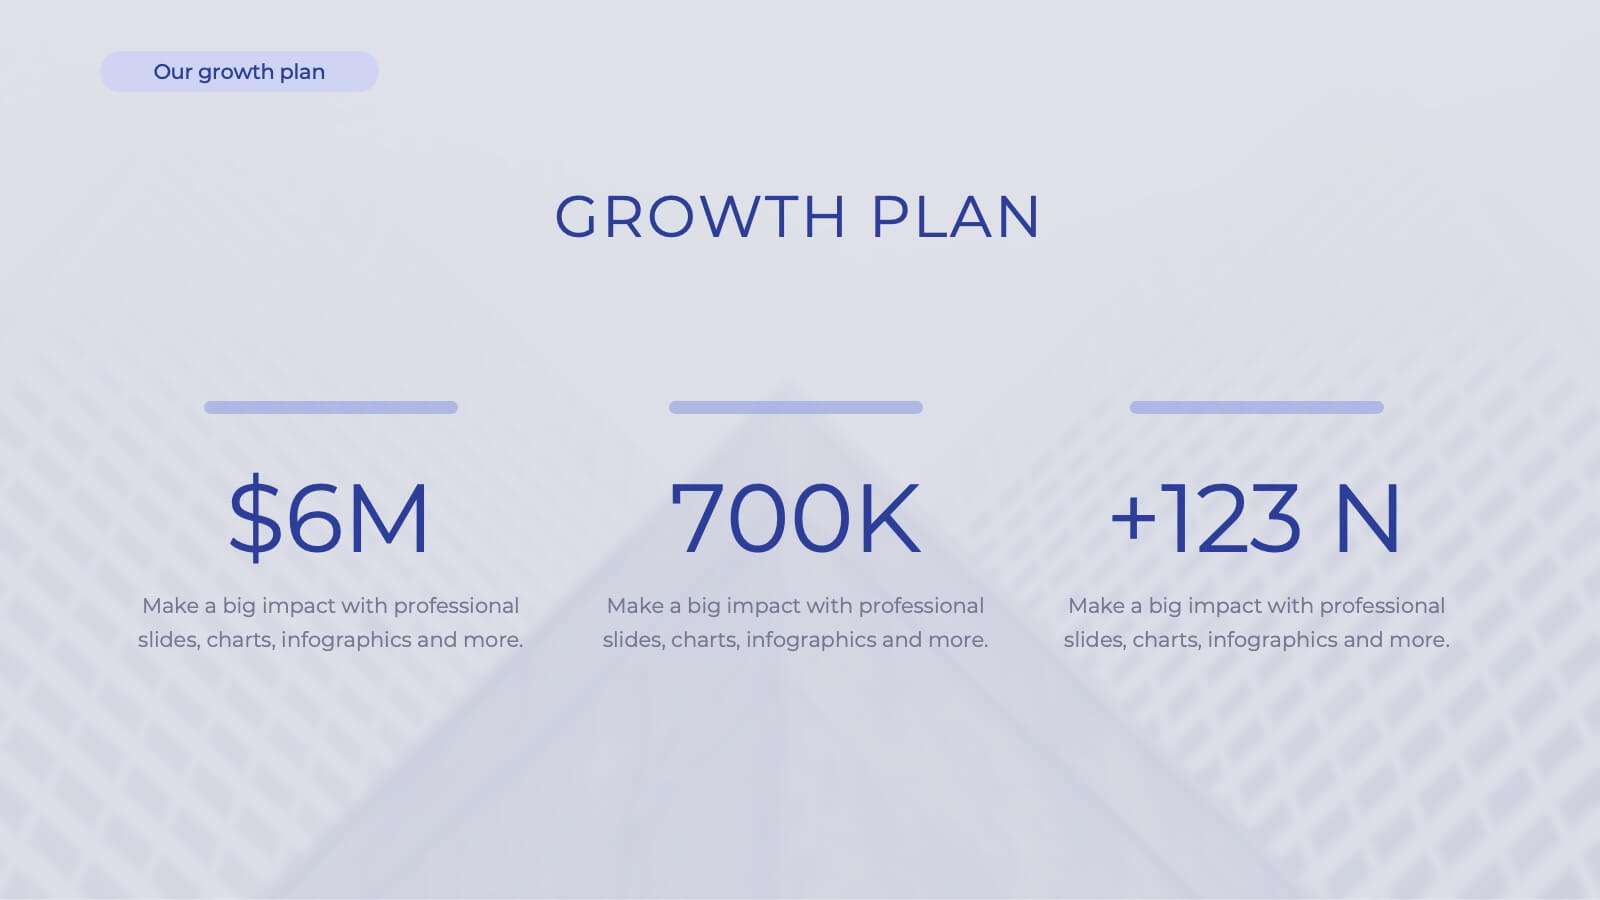
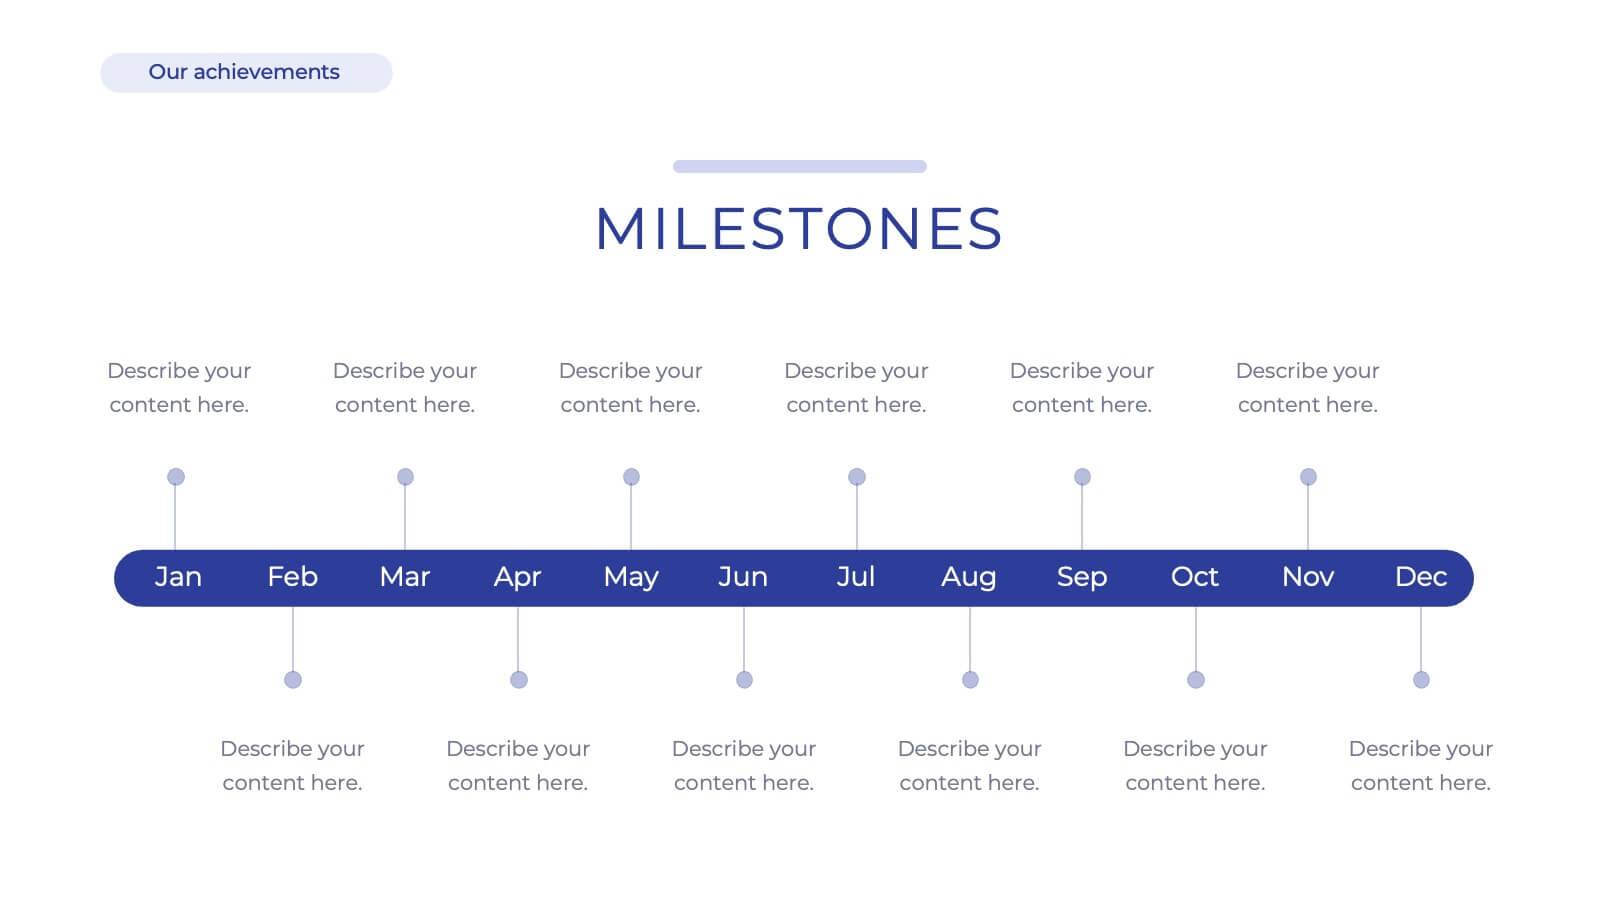
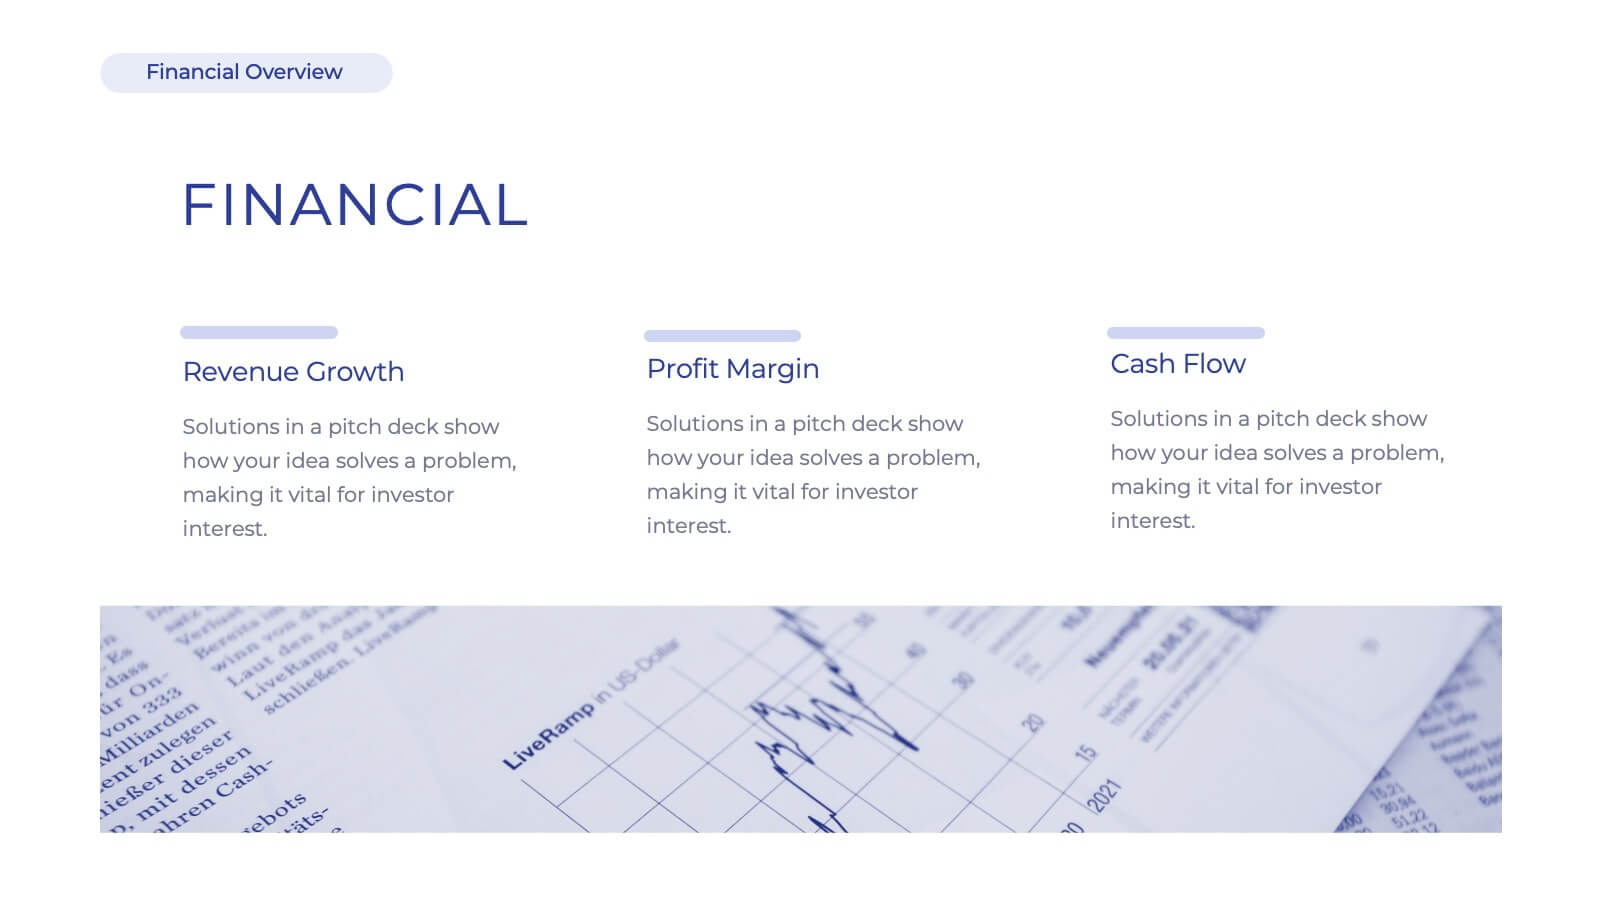
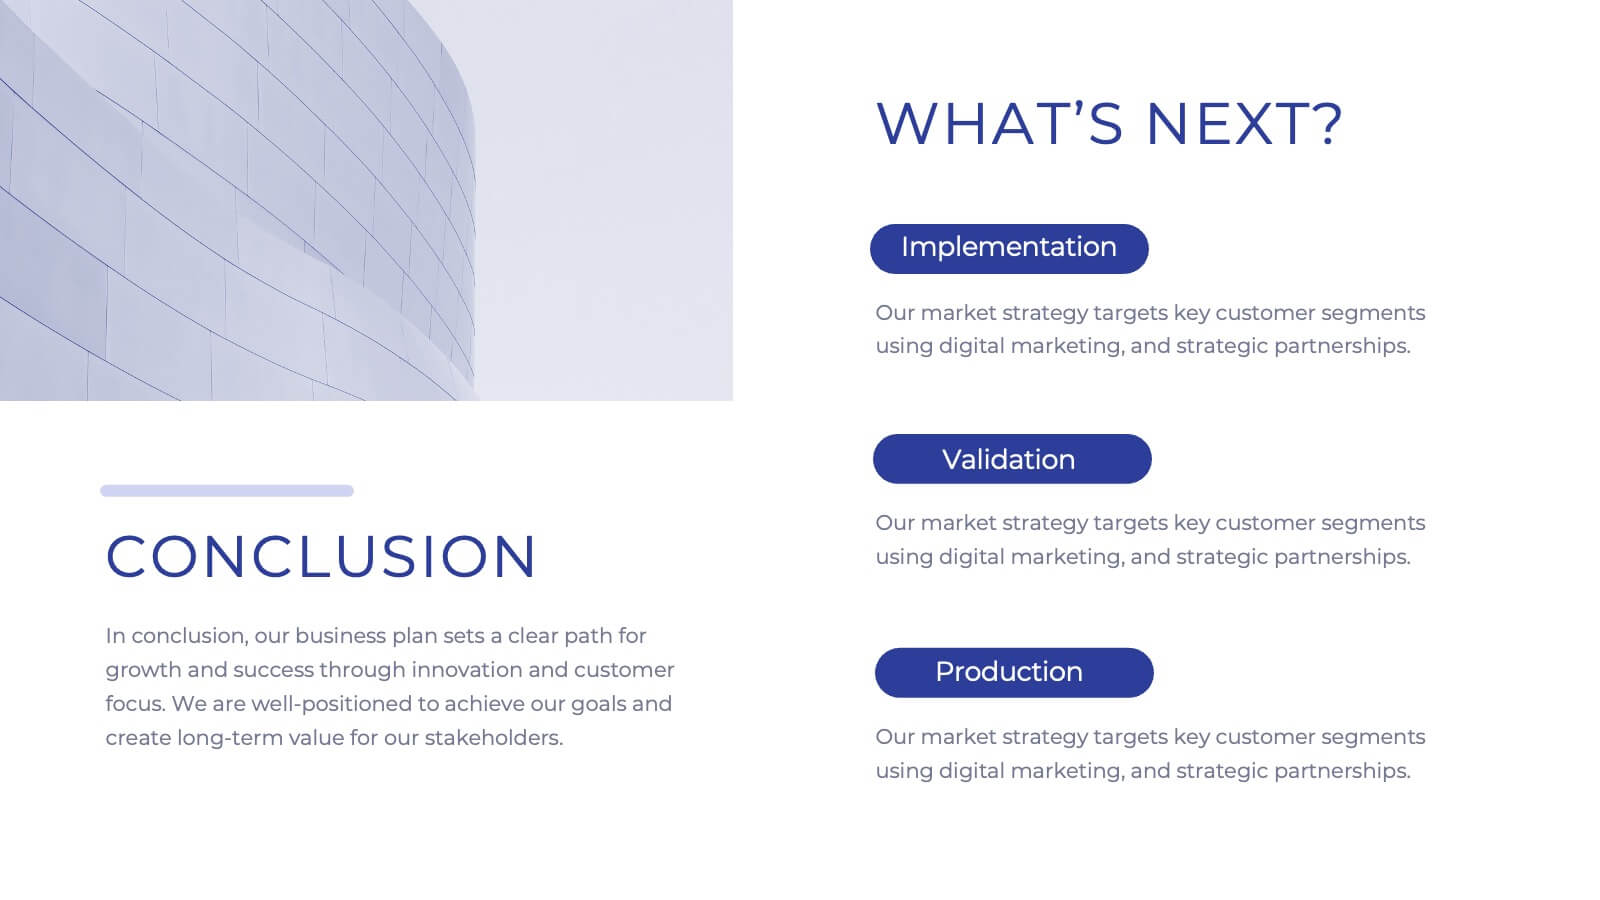
Iconic Startup Business Plan Presentation
Introducing our comprehensive corporate business plan template! Perfect for showcasing your company’s mission, vision, and services. Highlight your market strategy, competitive landscape, and growth plan in a professional design. Ideal for executives and entrepreneurs. Compatible with PowerPoint, Keynote, and Google Slides.


23 slides
Artarix Business Development Proposal Presentation
Streamline your growth strategy with this modern and professional presentation template. Covering key elements such as collaboration opportunities, performance metrics, process improvement, and resource allocation, it provides a structured approach to business expansion. Fully customizable and compatible with PowerPoint, Keynote, and Google Slides for seamless editing.