


Features
- 4 Unique slides
- Fully editable and easy to edit in Microsoft Powerpoint, Keynote and Google Slides
- 16:9 widescreen layout
- Clean and professional designs
- Export to JPG, PDF or send by email


Do you have any questions?
Recommend


5 slides
Strategic Planning Canvas for Growth
Build a clear roadmap to success with the Strategic Planning Canvas for Growth Presentation. This slide uses a curved timeline layout to showcase five progressive steps, ideal for outlining growth phases, initiatives, or planning milestones. Each stage is paired with a modern icon and text area for key insights. Fully editable in PowerPoint, Keynote, and Google Slides.


26 slides
Creative Cryptocurrency Investment Presentation
The growth of Cryptocurrency has been significant over the past few years. It is very important to do your own research, understand the risks involved, and only invest what you can afford to lose. This template is designed with a focus on cryptocurrencies and includes customizable photo layouts, charts, a gold coin pattern and unique cryptocurrency-themed icons and illustrations. You can use this template for any topic related to Cryptocurrency or Blockchain. Create your own presentation within minutes using Powerpoint, Keynote, or Google slides, it is fully editable to suit your needs.


12 slides
Real Estate House Market Trends Presentation
Analyze Real Estate House Market Trends with this insightful presentation template. Featuring a house-shaped hexagonal layout, this design helps illustrate key factors such as market demand, property values, investment opportunities, and housing policies. Ideal for real estate professionals, investors, and analysts looking to present market insights with clarity and impact. Fully customizable and compatible with PowerPoint, Keynote, and Google Slides.


5 slides
Comparative Assessment Using Harvey Ball Chart
Showcase multiple data points with clarity using this Comparative Assessment Using Harvey Ball Chart presentation template. Designed for visualizing progress, performance, or preference across 5 categories, each slide features Harvey Balls with percentage indicators, icons, and explanatory text sections. Ideal for business reviews, audits, or strategy discussions, this template helps communicate variances in an intuitive, side-by-side format. Fully editable in PowerPoint, Google Slides, and Keynote.


8 slides
Data Analytics Dashboard Slide Presentation
Turn raw data into visual insights with this clean and modern layout designed to simplify analytics reporting. Perfect for tracking performance metrics, KPIs, and progress updates, it helps make numbers easy to understand at a glance. Fully customizable and compatible with PowerPoint, Keynote, and Google Slides for effortless editing.


8 slides
Customer Targeting and Persona Creation Presentation
Hook your audience with a clean, modern layout that zooms in on what really matters—your ideal customer. This customer persona template helps visualize traits, behaviors, and key targets for effective marketing. Perfect for campaign planning, branding, or audience research. Fully compatible with PowerPoint, Keynote, and Google Slides.


21 slides
Chrysolis Small Business Pitch Deck Presentation
Make your business stand out with a pitch deck that tells your story with clarity and confidence. Covering key elements like company policies, performance metrics, collaboration opportunities, and future projects, this presentation helps you impress stakeholders. Fully customizable and compatible with PowerPoint, Keynote, and Google Slides for a seamless pitch experience.


5 slides
Topic Web Mind Mapping
Visualize your ideas with clarity and structure using the Topic Web Mind Mapping Presentation. Perfect for brainstorming, educational planning, or strategic thinking, this layout helps you centralize a core concept and expand with five supporting branches. Customize easily in PowerPoint, Keynote, or Google Slides to fit any topic or audience.


8 slides
Alphabet List Infographics
Discover the power of alphabet lists, a versatile tool for structured information presentation. This infographic is your guide to understanding alphabet lists, from the basics to the benefits of alphabetical order. Master the art of creating organized and readable content. Learn why arranging information alphabetically is advantageous. Explore its logical sequence that simplifies referencing and comprehension. Unlock the potential of alphabetical order in various contexts, improving content organization for easy access and digestion. Master the use of alphabet lists to boost content readability. Discover techniques such as subheadings and concise descriptions. With this infographic, compatible with PowerPoint, Keynote, and Google Slides, sharing your knowledge of alphabet lists is effortless. Dive into the world of alphabet lists and improve your communication and content organization skills.


6 slides
Construction Project Timeline and Stages Presentation
Map out your project from groundbreaking to completion with the Construction Project Timeline and Stages Presentation. This visual timeline uses illustrated trucks to represent key construction phases—ideal for progress reports, planning reviews, or contractor briefings. Fully editable in PowerPoint, Keynote, and Google Slides.


26 slides
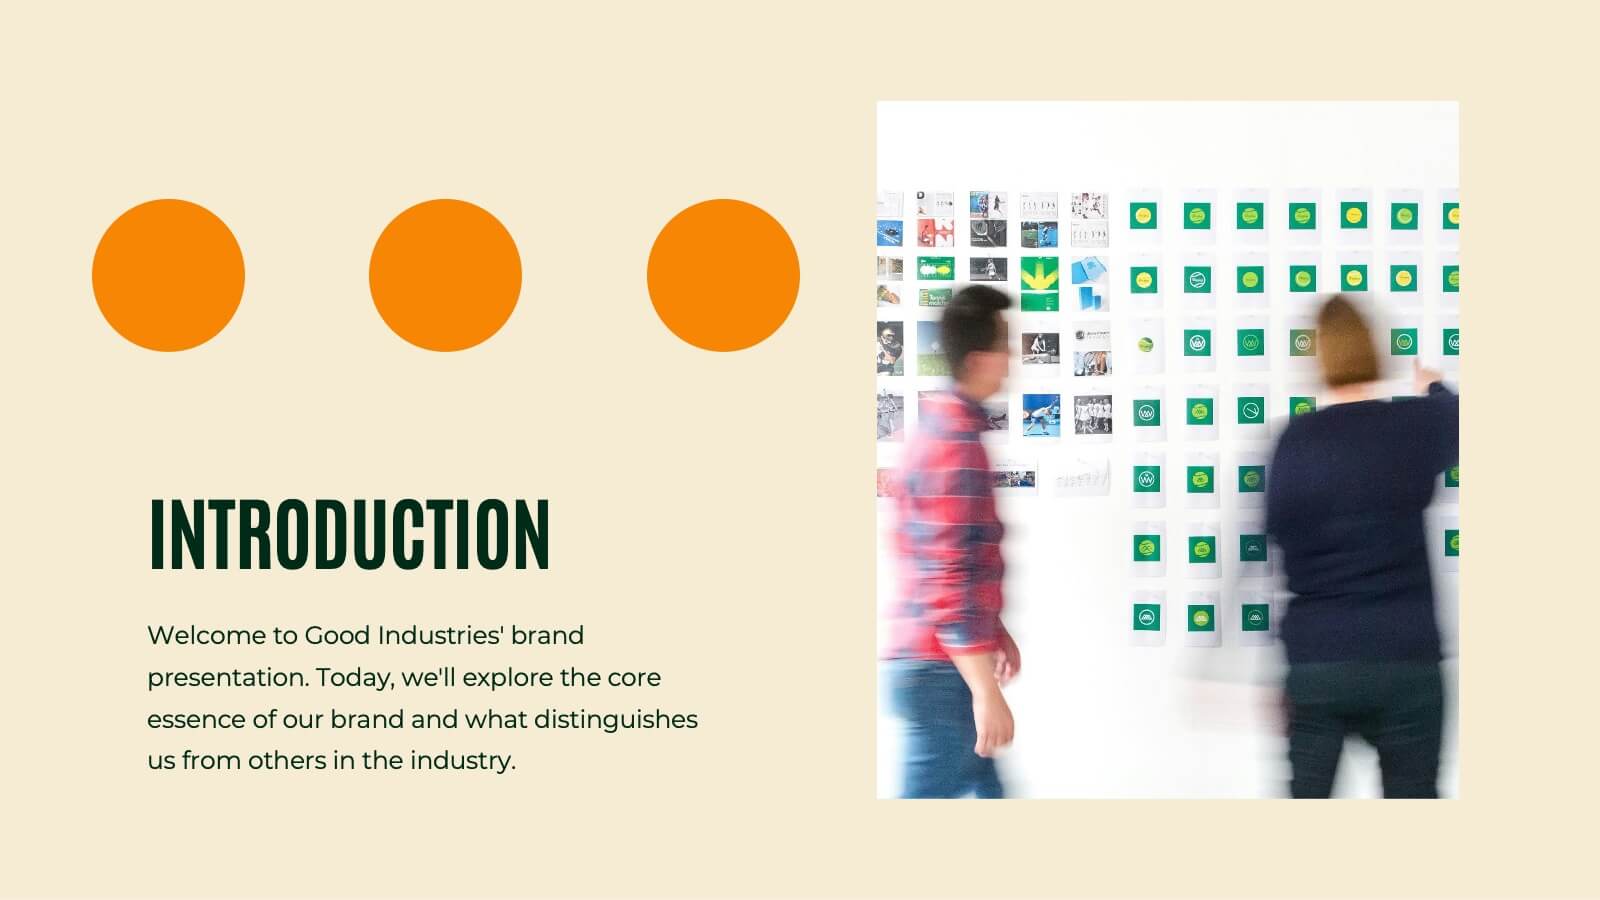
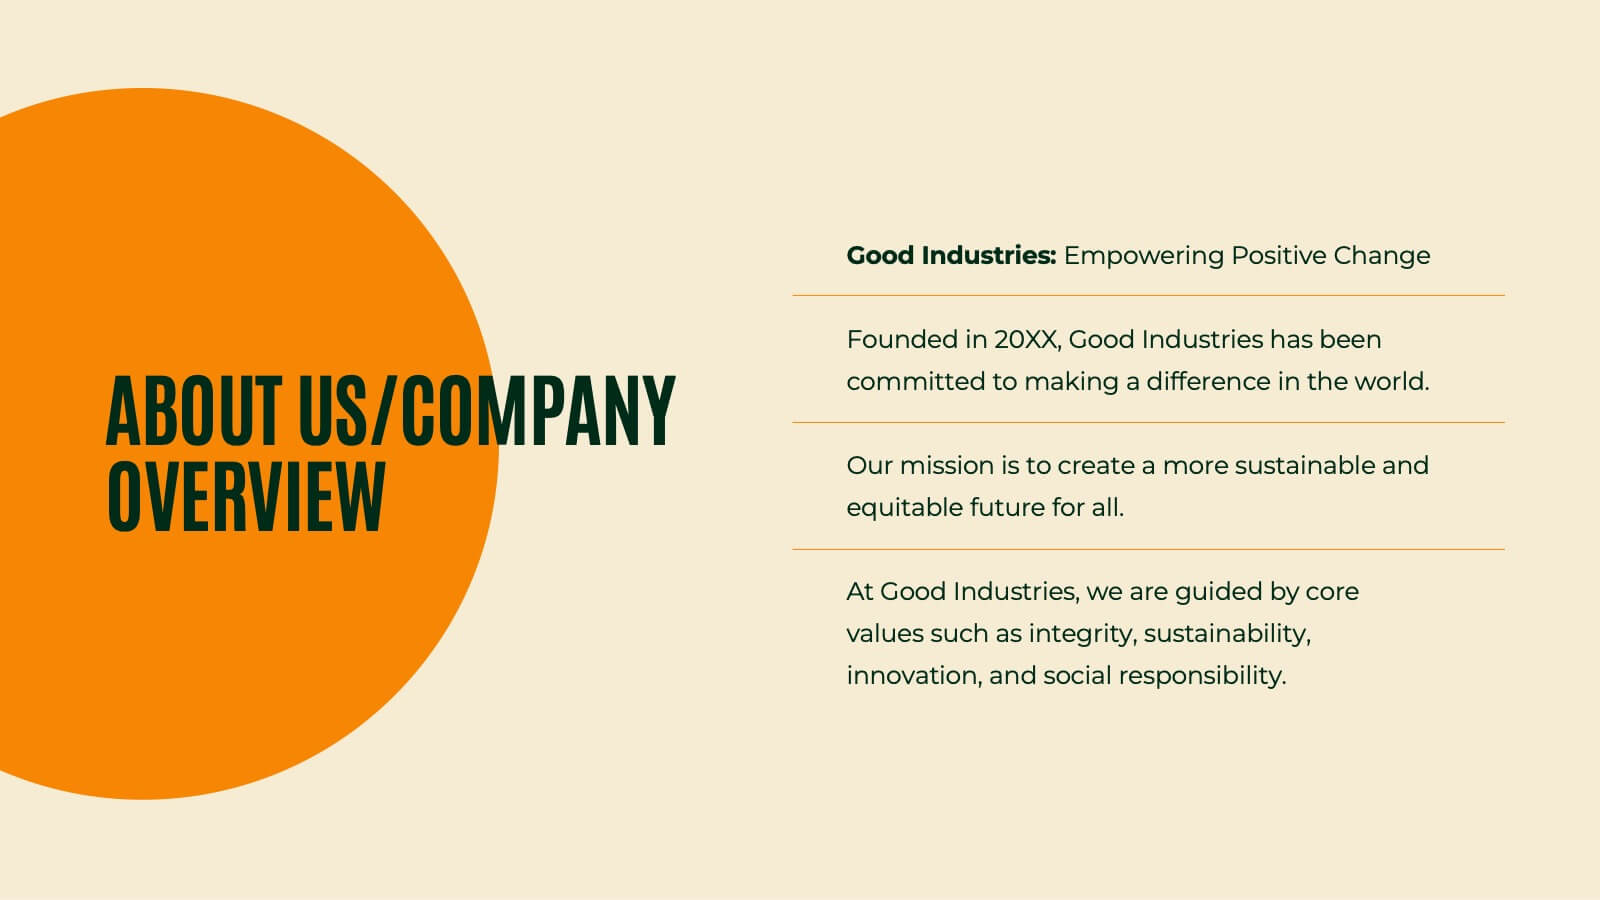
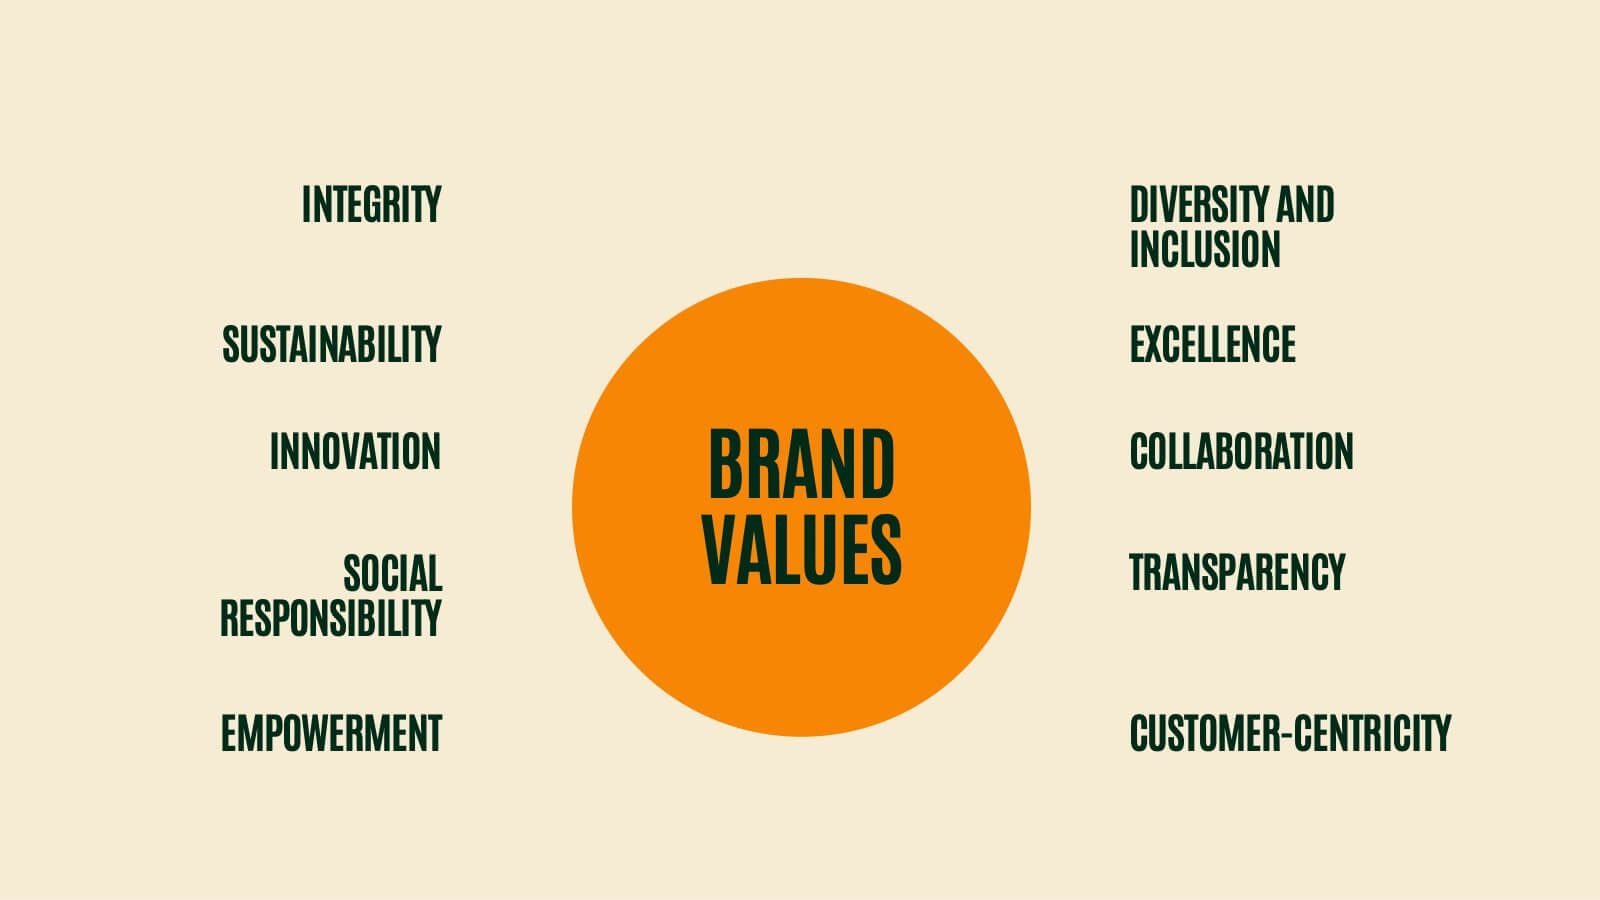
Griffin Rebranding Project Plan Presentation
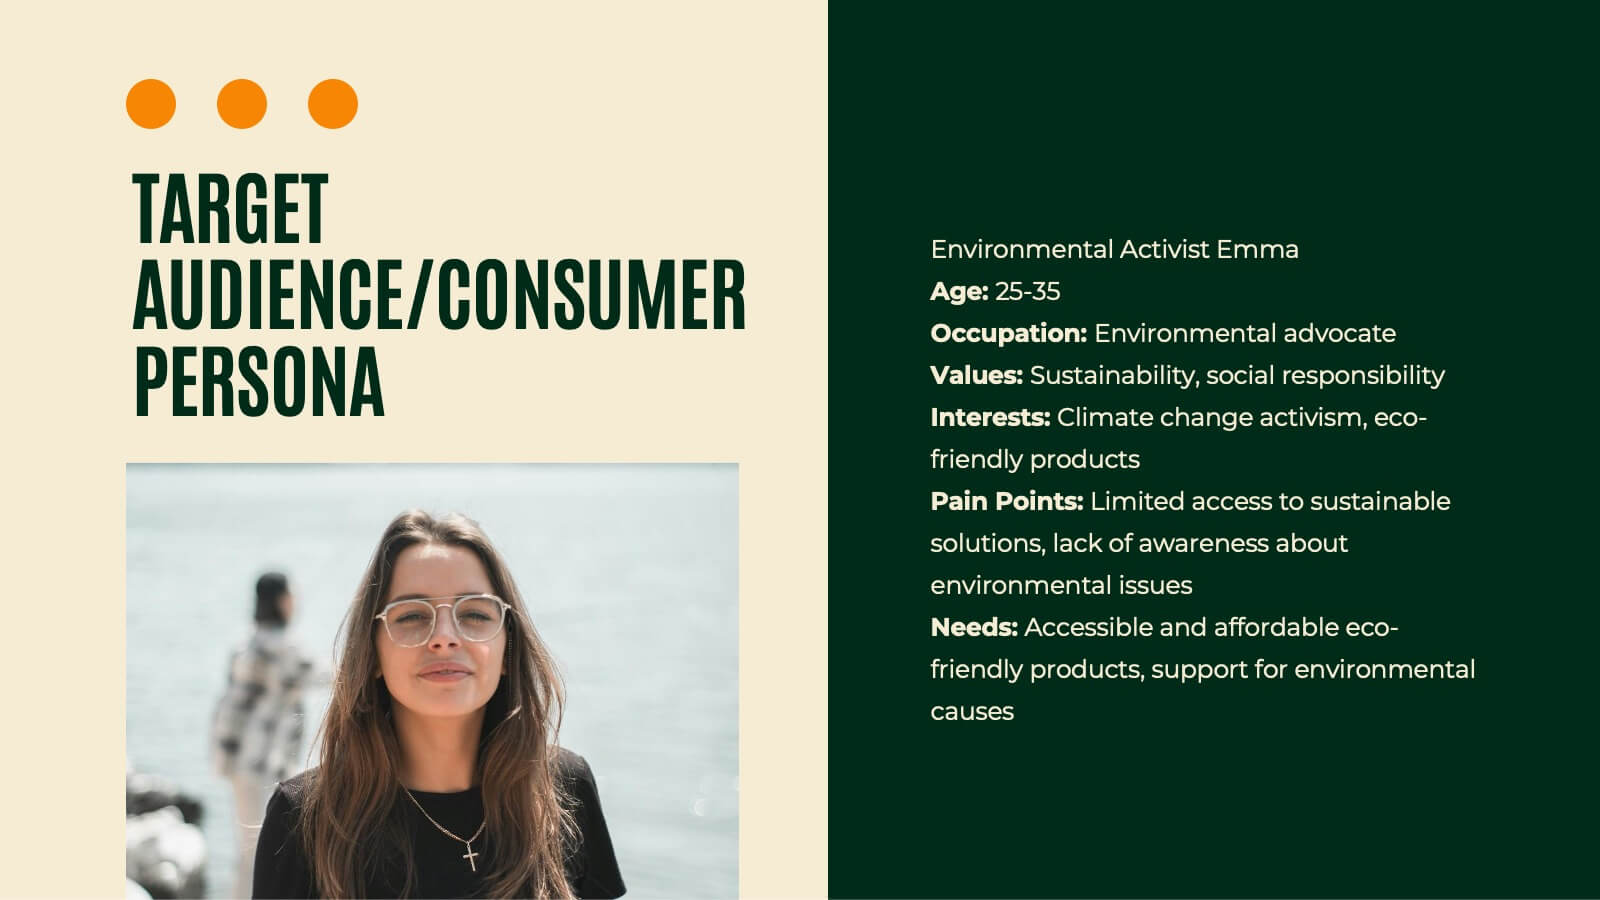
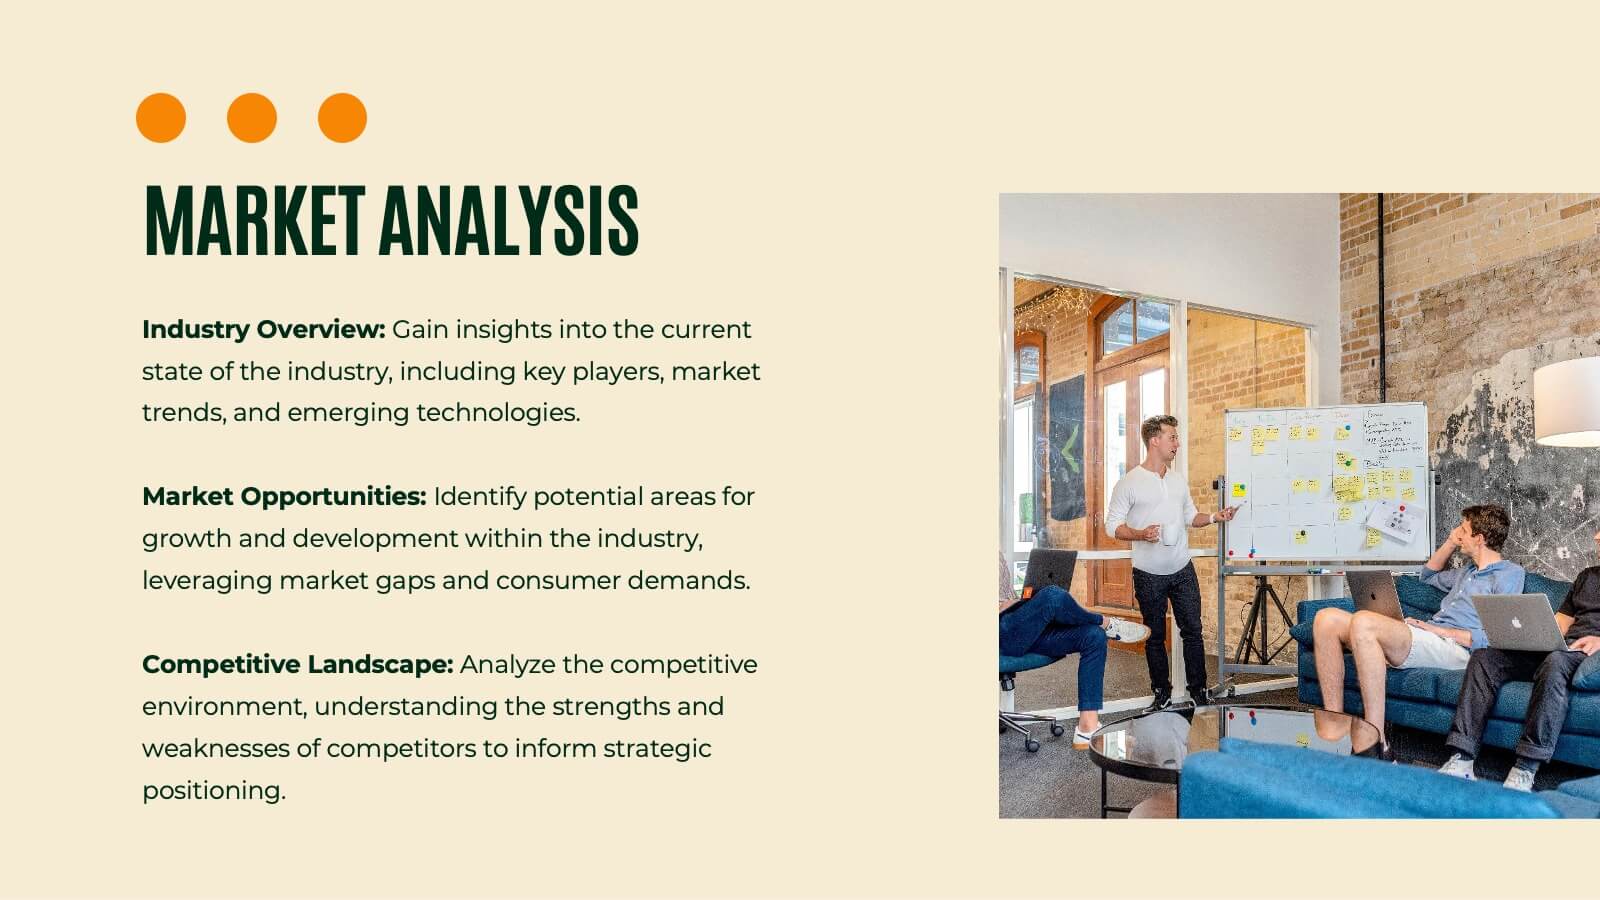
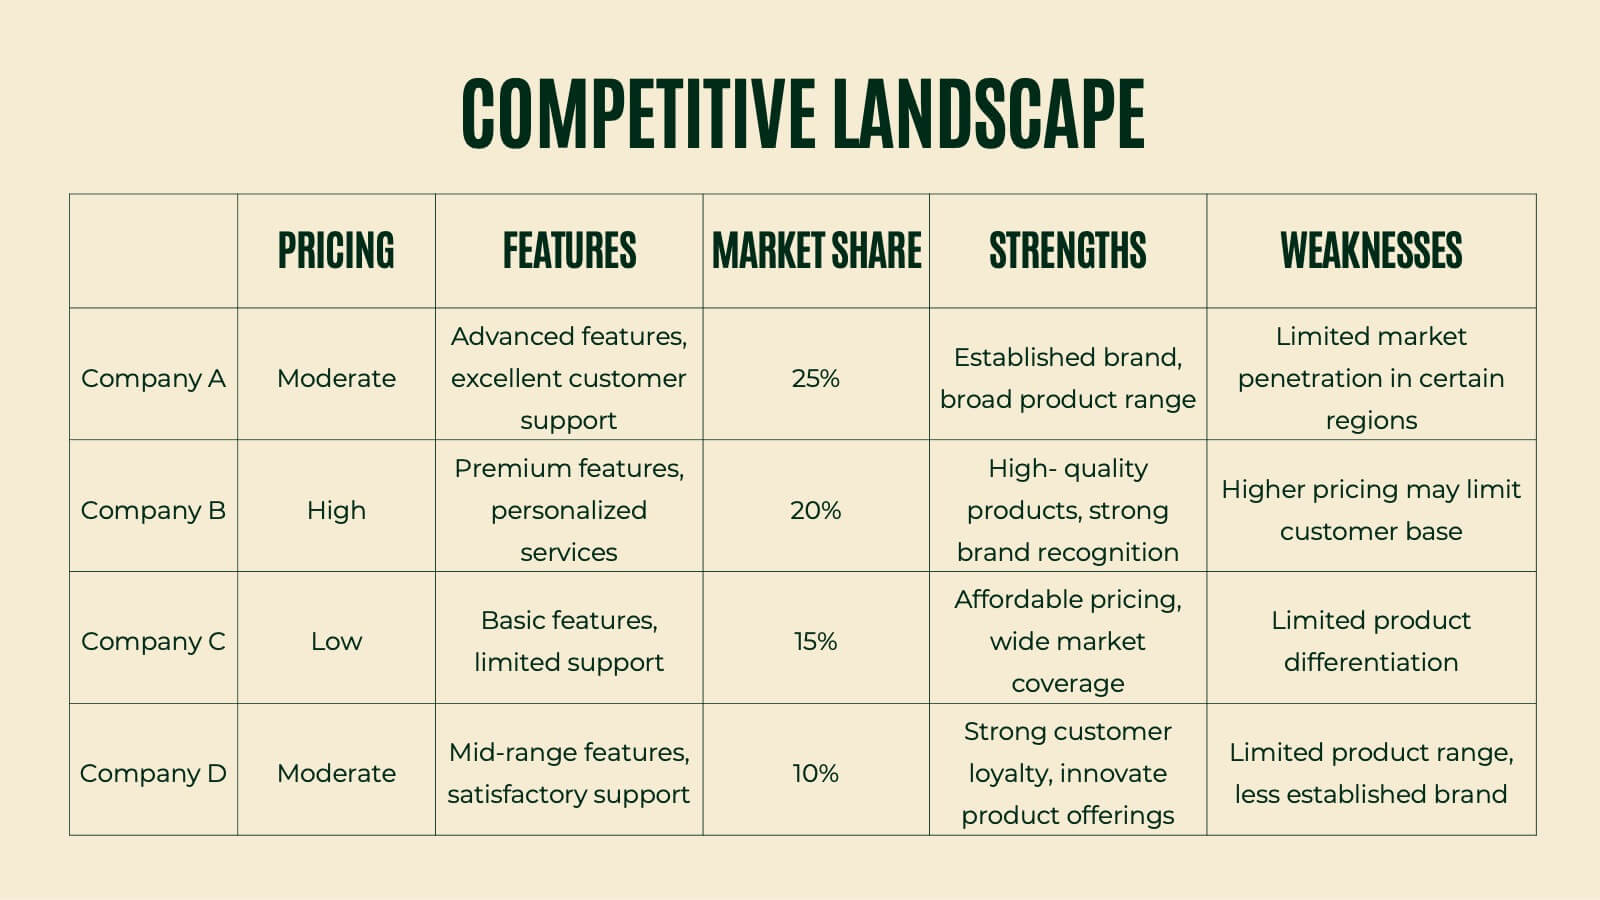
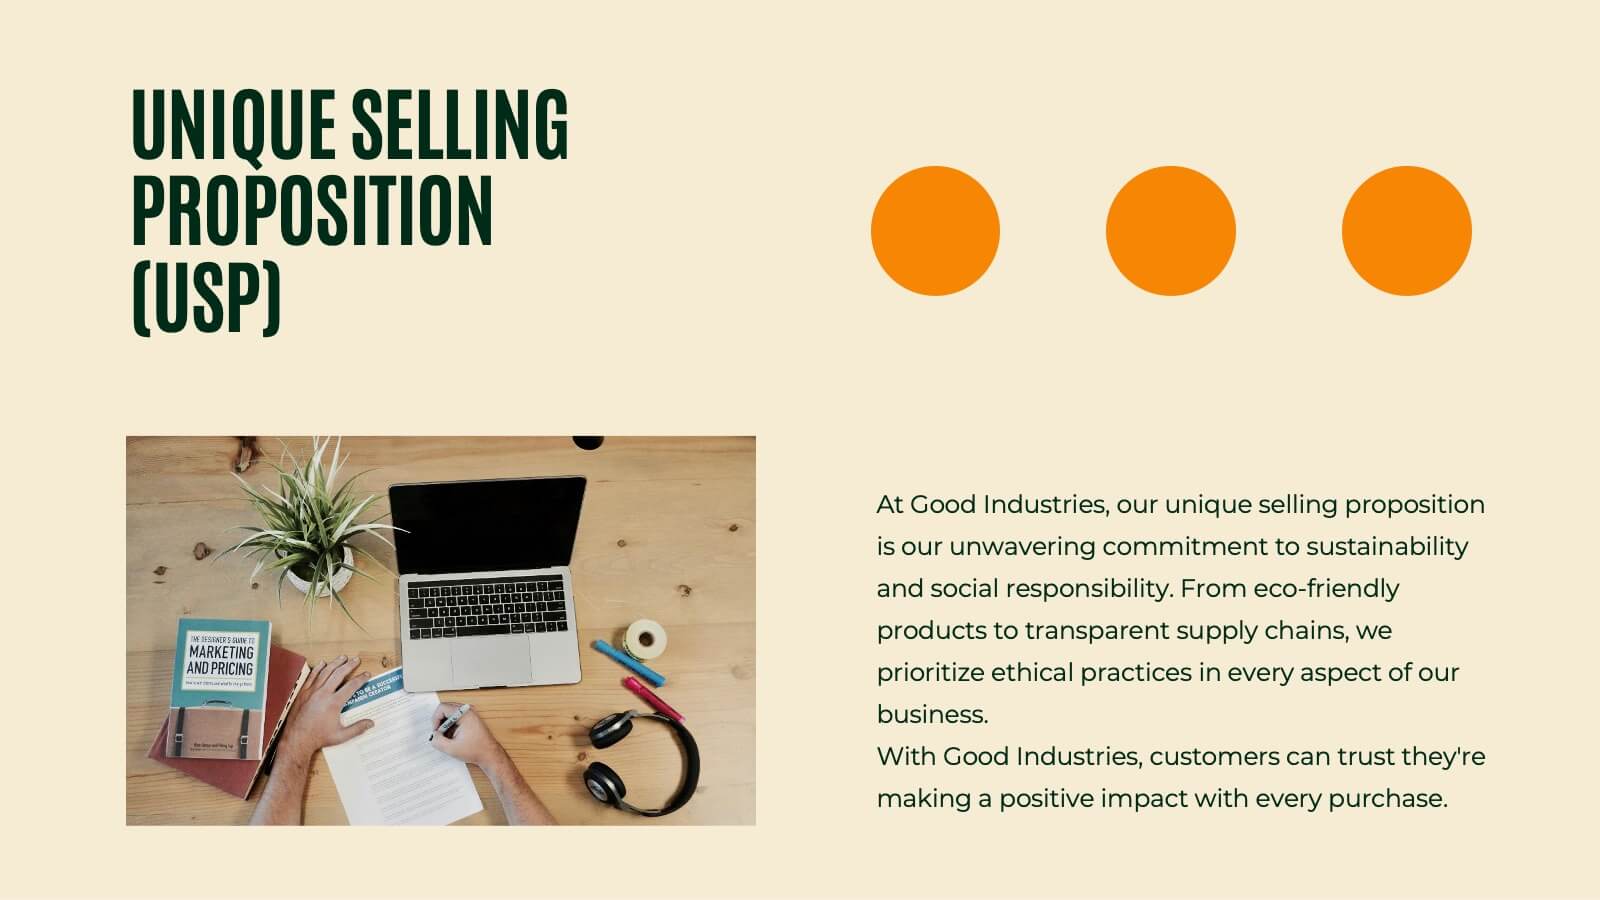
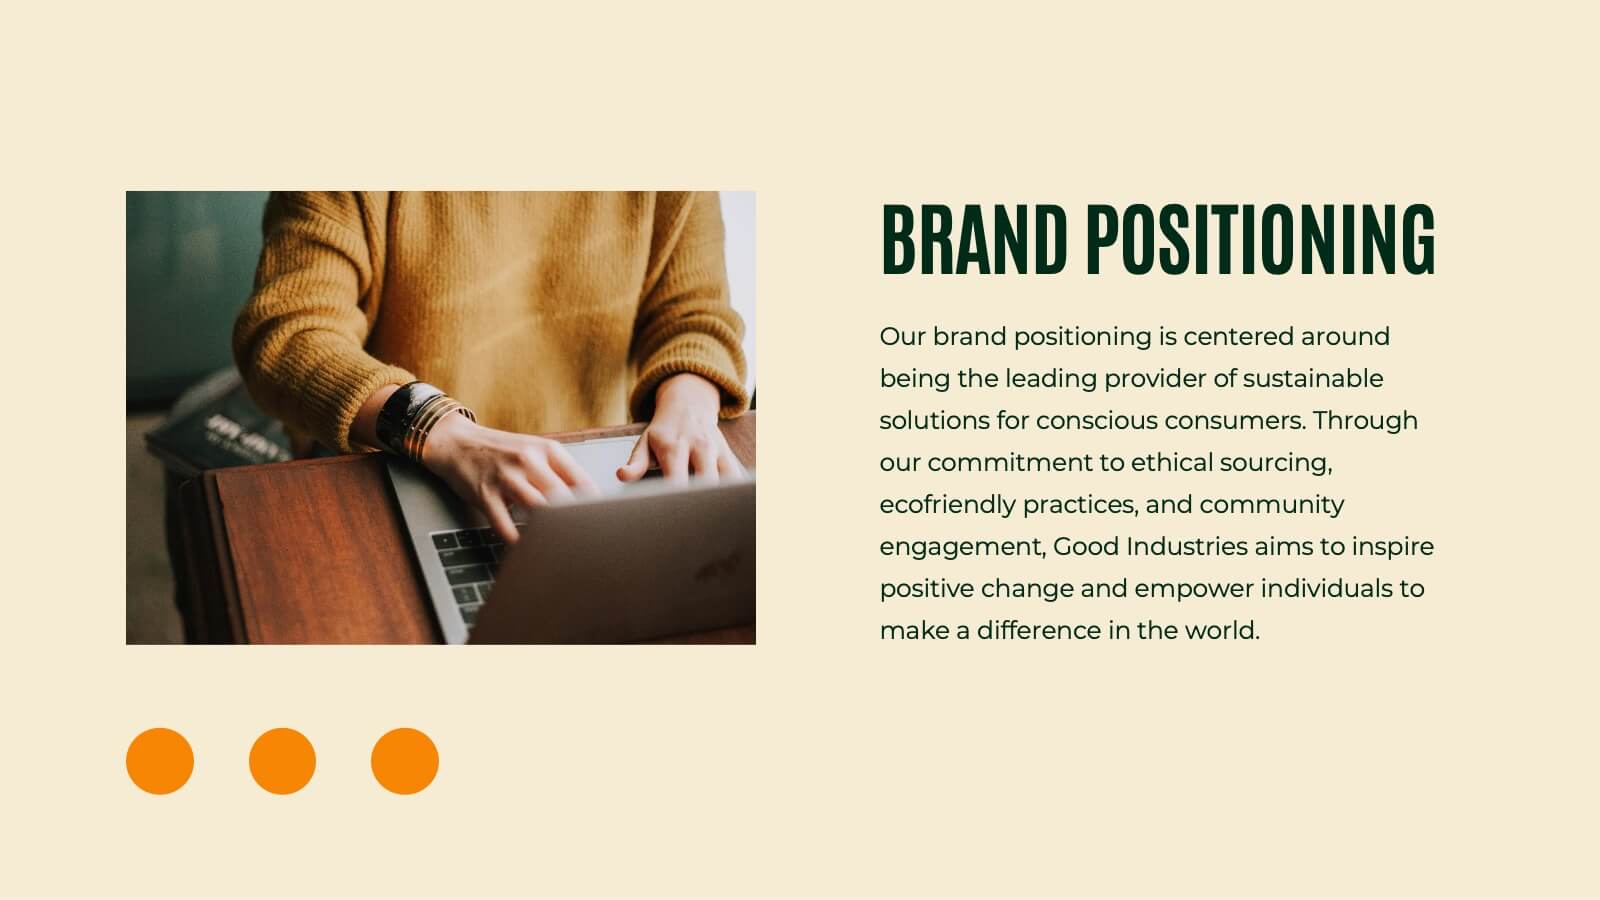
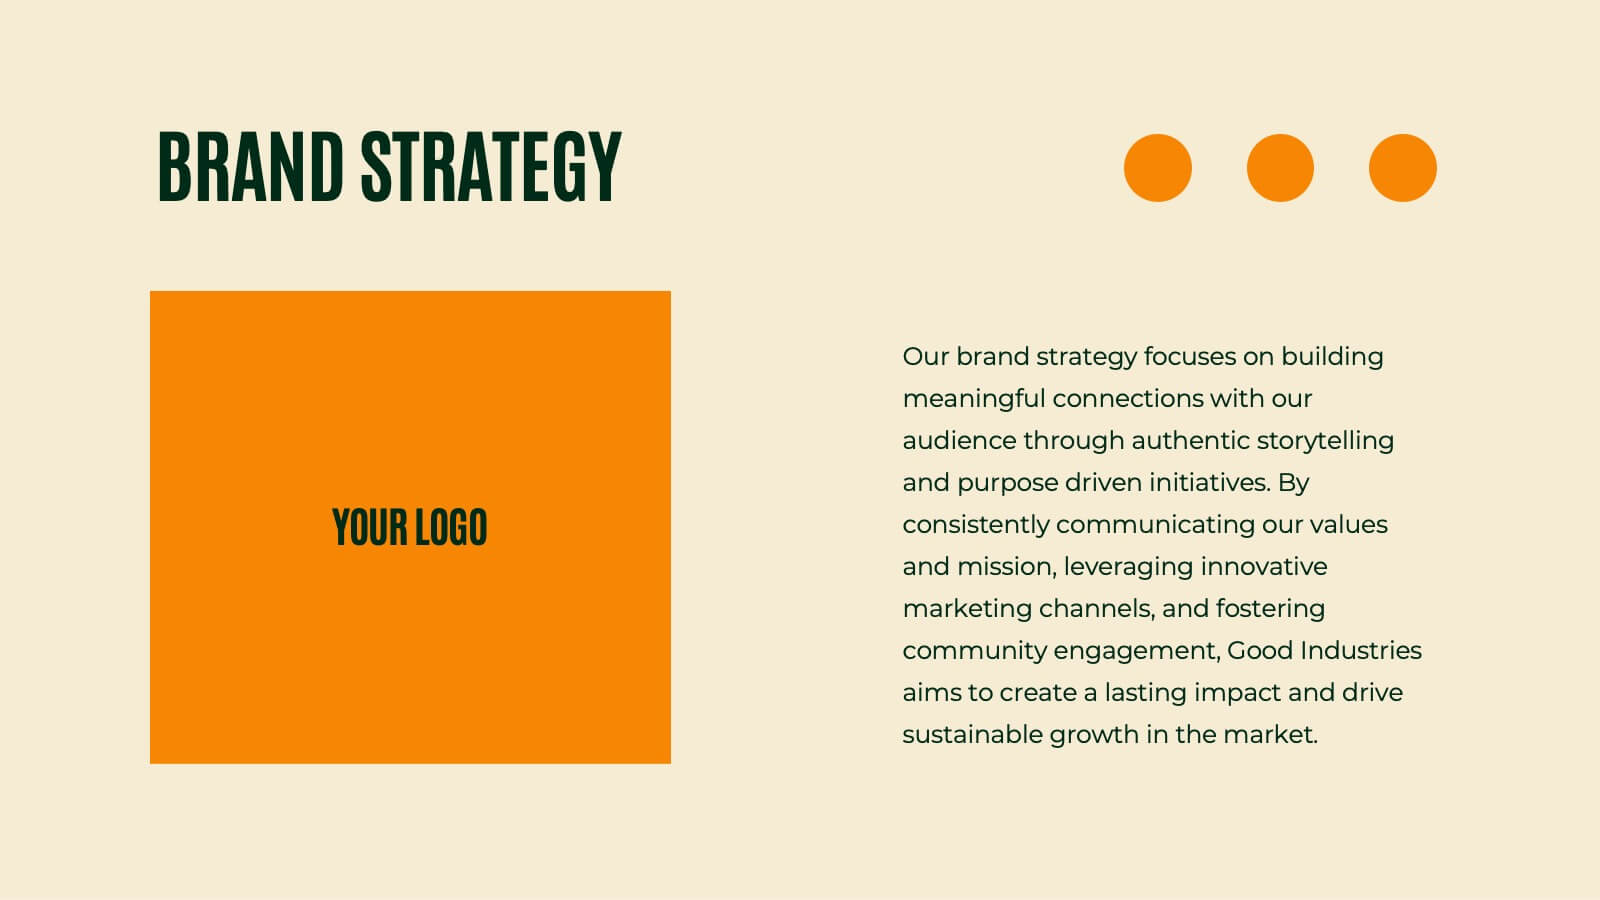
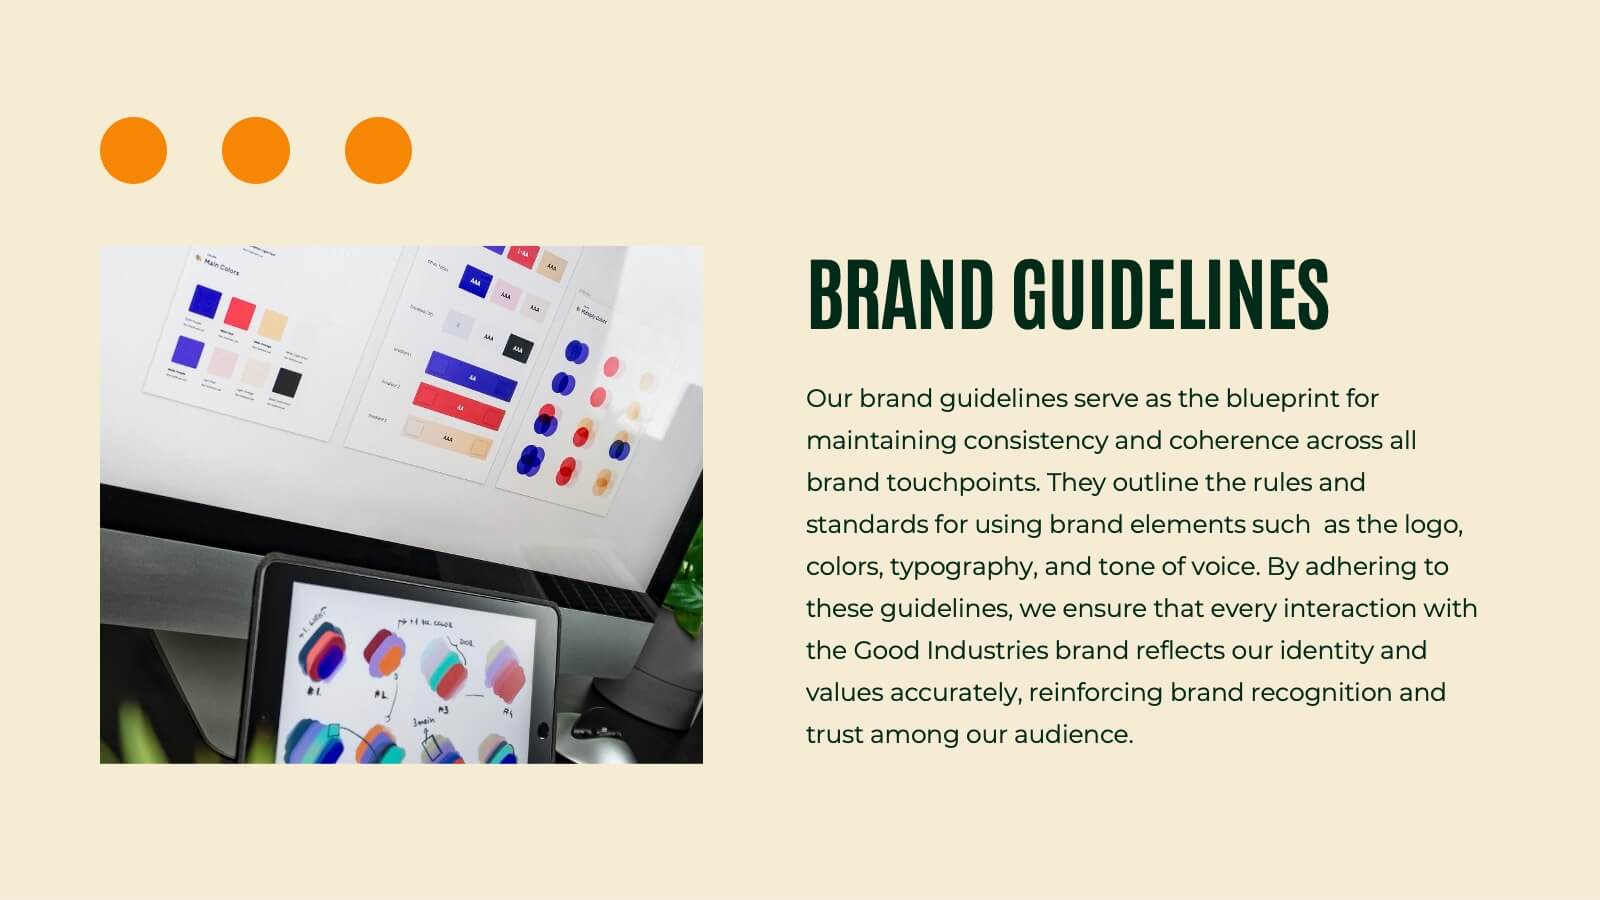
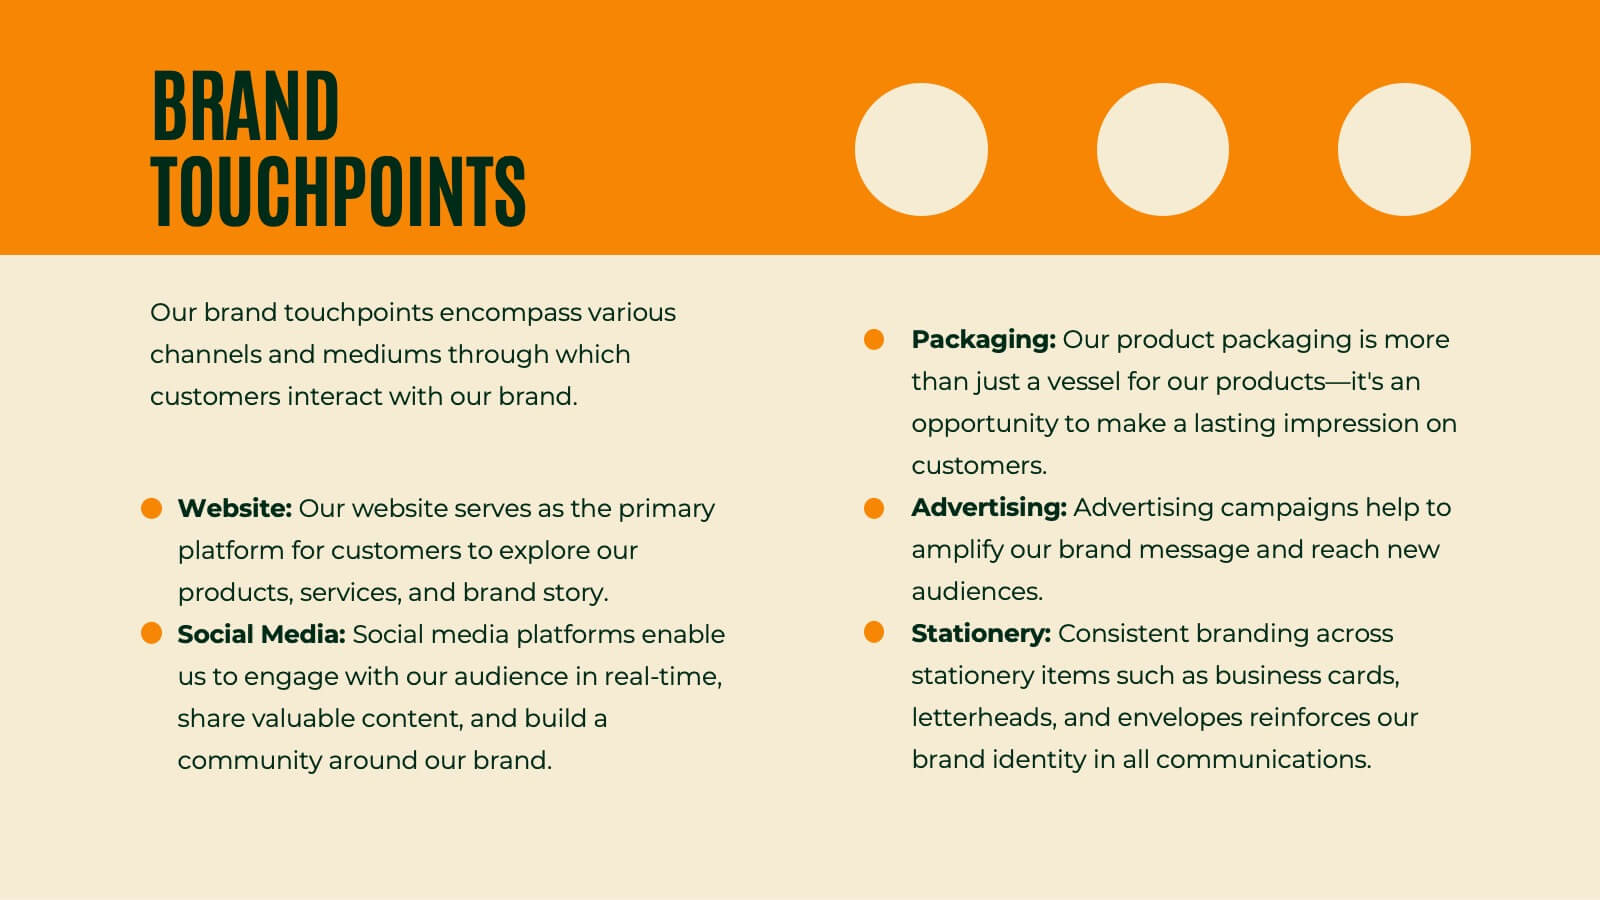
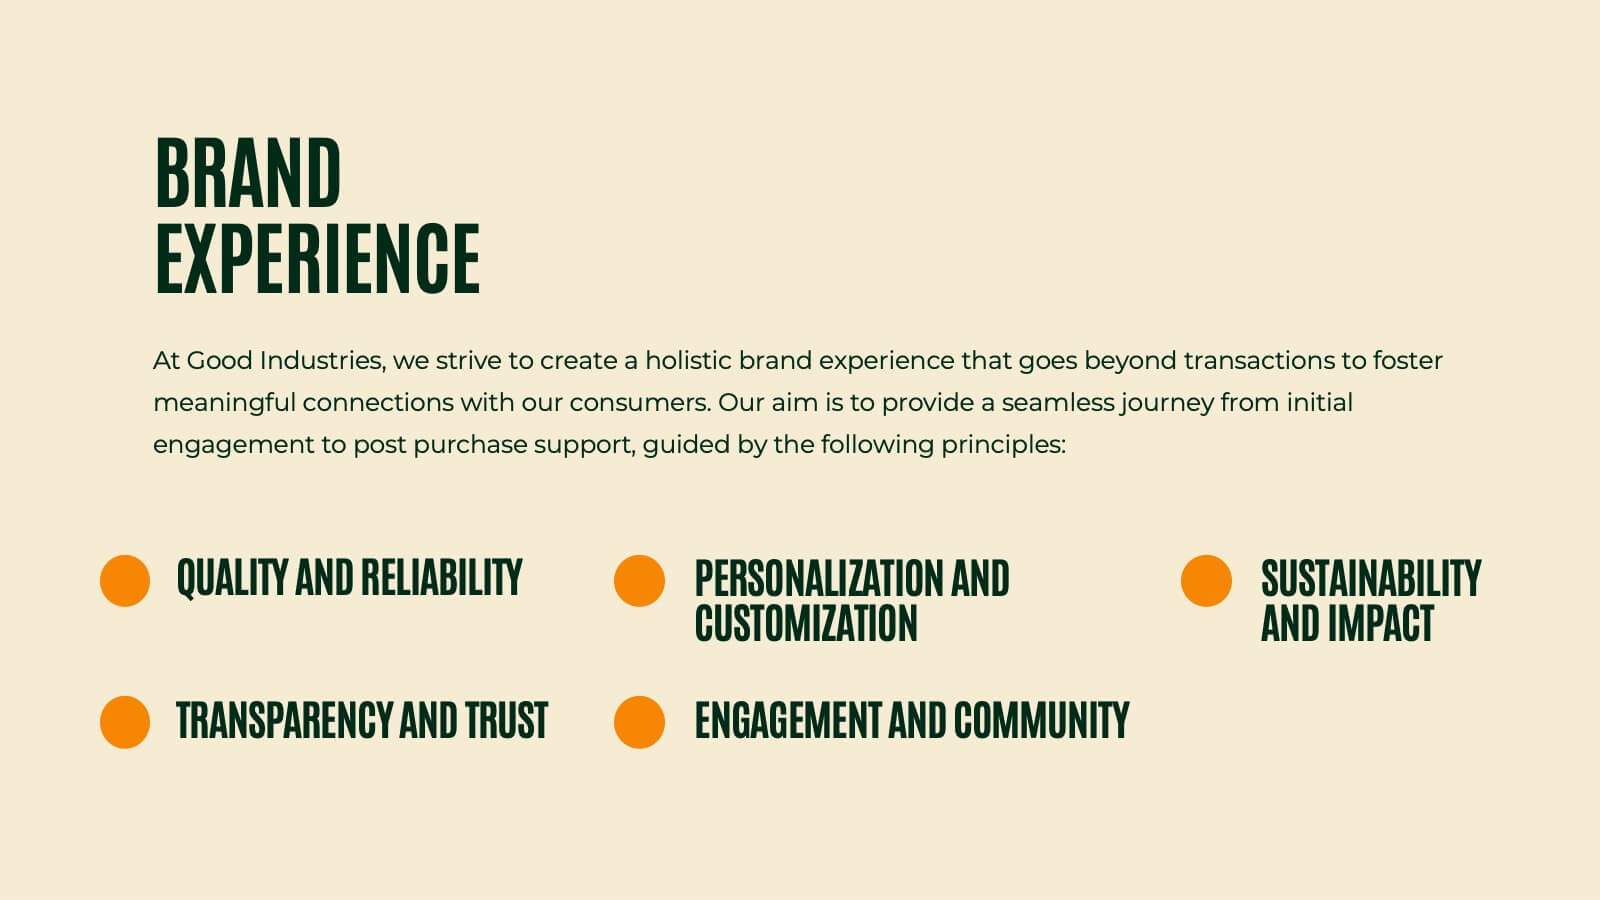
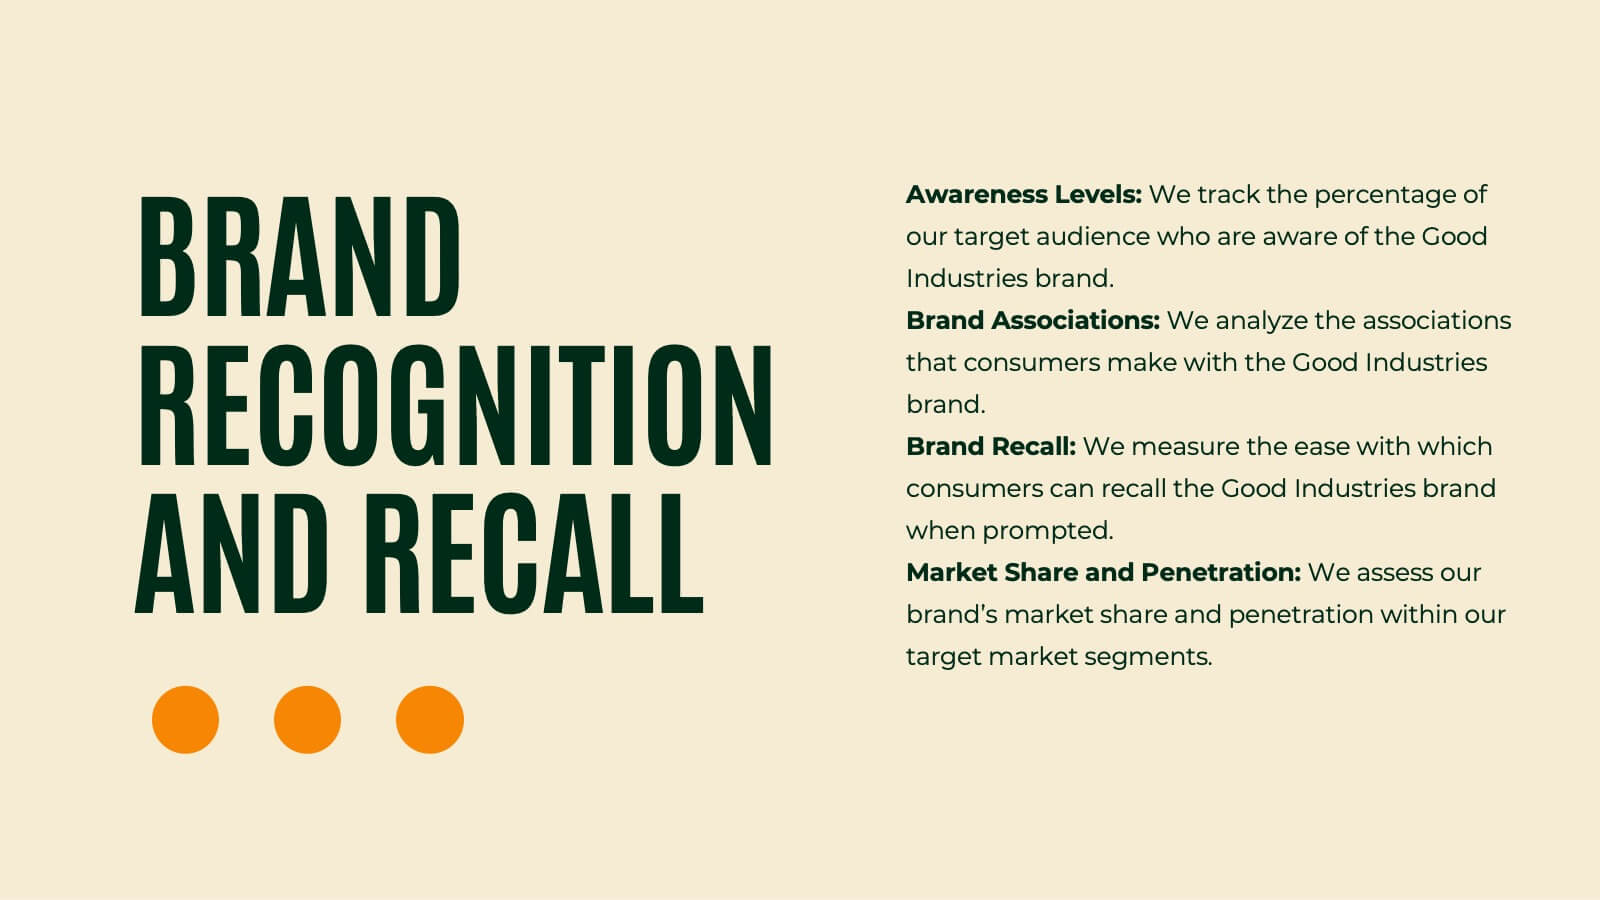
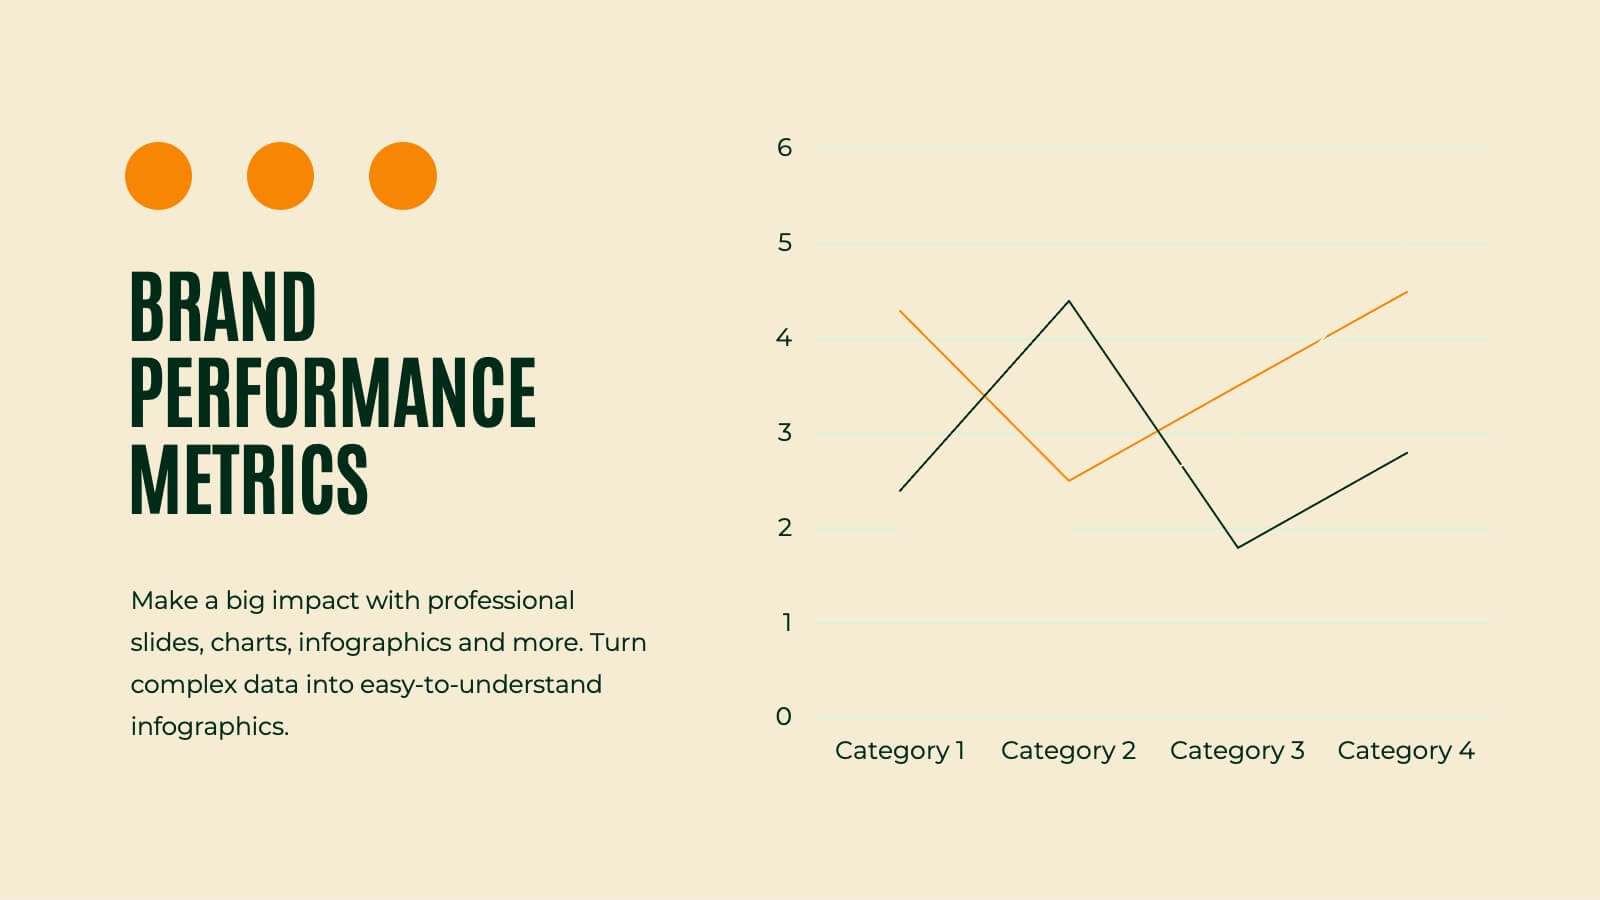
Unleash the power of branding with this vibrant presentation template! This tool guides you through essential brand elements like identity, voice, and strategy. Perfect for marketers and brand managers aiming to make a memorable impact. Compatible with PowerPoint, Keynote, and Google Slides, it's a must-have for any branding project.


6 slides
User-Centered Design Thinking Model Presentation
Highlight the key phases of your design process with the User-Centered Design Thinking Model Presentation. This slide features a profile silhouette with a segmented circular path inside the head, clearly representing five sequential stages. Perfect for illustrating empathy-driven innovation, product development, or user experience workflows. Fully editable in Canva, PowerPoint, Google Slides, and Keynote.


7 slides
Mission and Vision Infographic
Enhance your organizational presentations with this collection of professionally designed slide templates, perfect for detailing your foundational principles and strategic vision. Each template is crafted to effectively convey essential information, combining aesthetic appeal with functional design to ensure your message has a lasting impact. The slides feature a sophisticated and clean layout, emphasizing the importance of your organizational goals. They are ideally suited for use in corporate presentations, stakeholder meetings, or team workshops. With various styles available, each template can be selected and customized to align with your organization's branding and ethos. These slides are fully customizable, allowing adjustments in colors, fonts, and imagery to perfectly represent your core messages. They provide a valuable tool for inspiring your team, impressing stakeholders, and clearly communicating the driving purpose and values behind your initiatives.


7 slides
Roadmap Guide Infographic
A roadmap guide is a visual representation of the steps you need to take in order to reach your destination. A roadmap infographic is a great way to show your clients what the future will look like. Use this template to create an infographic that's high-energy, enthusiastic, and engaging. This infographic is designed to help guide you by showing where you are now, what direction you're going, and where you need to go next. This template is fully customizable and compatible with Powerpoint, Keynote, and Google Slides. Break down complex plans into easily digestible visual elements.


12 slides
Investment Strategy Presentation
The "Investment Strategy Presentation" template is designed for effectively mapping out and displaying various investment strategies. It uses a multi-colored light bulb graphic, which symbolizes ideas and innovation in investment planning, making it visually appealing and easy to understand. Each segment of the light bulb is labeled with letters A through F, representing different aspects or phases of an investment strategy that can be tailored to specific objectives or points of discussion. This format helps in presenting complex financial data or strategies in a straightforward manner that can be easily grasped by audiences, making it an ideal choice for financial analysts, investors, or corporate strategy meetings.


6 slides
Money Conversion Infographics
Convert currencies effectively with our Money Conversion infographic template. This template is fully compatible with popular presentation software like PowerPoint, Keynote, and Google Slides, allowing you to easily customize it to illustrate and communicate currency conversion rates and methods. The Money Conversion infographic template offers a visually engaging platform to explain the process of converting one currency to another, including exchange rates, conversion tools, and tips for international travelers or businesses. Whether you're a traveler, finance professional, or anyone dealing with currency exchange, this template provides a user-friendly canvas to create informative presentations and educational materials. Optimize your currency conversion knowledge with this SEO-optimized Money Conversion infographic template, thoughtfully designed for clarity and ease of use. Customize it to showcase currency conversion tools, real-time exchange rate sources, and practical examples, ensuring that your audience gains valuable insights into this important aspect of finance. Start crafting your personalized infographic today to become more proficient in money conversion.


7 slides
Personal SWOT Infographic
Evaluate your individual potential with our personal SWOT infographic. Set against a clean white backdrop, and punctuated with optimistic yellow, intuitive blue, and assertive red, this template meticulously breaks down strengths, weaknesses, opportunities, and threats on a personal level. Adorned with concise infographics, suggestive icons, and adaptable image placeholders, it offers a panoramic introspection into personal growth avenues. Flawlessly designed for Powerpoint, Keynote, or Google Slides. An invaluable asset for career counselors, personal coaches, individuals looking for self-improvement, or anyone aiming for personal development.