


Features
- 6 Unique slides
- Fully editable and easy to edit in Microsoft Powerpoint, Keynote and Google Slides
- 16:9 widescreen layout
- Clean and professional designs
- Export to JPG, PDF or send by email


Do you have any questions?
Recommend


7 slides
McKinsey 7S Weakness Infographic
The McKinsey 7S Model is a management framework developed by consulting firm McKinsey & Company. Embark on an analytical journey through organizational dynamics with our McKinsey 7S Weakness Infographic. This visually appealing and informative template is your map to navigating weaknesses and transforming them into growth opportunities. Compatible with Powerpoint, Keynote, and Google Slides. This infographic is designed to be your guide to dissecting your organization's weaknesses through the renowned McKinsey 7S framework. Leverage these insights to drive positive change and attain excellence!


21 slides
Eldritch Product Roadmap Presentation
The Product Roadmap Presentation Template features 21 modern slides, including product overviews, features, pain points, technical specs, and marketing strategies. Its sleek gray-yellow design ensures professionalism. Perfect for startups or businesses, it’s fully customizable and compatible with PowerPoint, Keynote, and Google Slides, ideal for impactful product-focused presentations.


5 slides
Dual Axis Butterfly Diagram Presentation
Give your data the spotlight it deserves with a modern layout designed for clarity and balance. This presentation is perfect for comparing two perspectives, processes, or variables side by side in a visually appealing way. Fully customizable and compatible with PowerPoint, Keynote, and Google Slides.


7 slides
Executive Summary Infographic Presentation Template
An Executive Summary is a document that provides an overview of the main points of a larger report. It is often written to share with individuals who may not have time to review the entire report. The executive summary provides a summary that sets out what's in the report, who it is written for, what it covers and why it's important. Use this template to create a powerful summary, which makes it easier to communicate your engagement results and outline your most important points. This template was designed to suggest a number of ways to enhance your executive summary and make it more persuasive.


12 slides
Strategic Planning with Strategy Wheel Presentation
Visualize your roadmap with this sleek strategy wheel template. Perfect for showcasing up to six strategic stages, this layout highlights progression while keeping your content organized and engaging. Ideal for business plans, project development, or performance cycles. Fully editable in PowerPoint, Keynote, and Google Slides.


10 slides
Key Strategies for Business Success Presentation
Achieve your goals with the Key Strategies for Business Success Presentation template. This structured and visually compelling slide deck is designed to outline essential business strategies, success factors, and growth plans. Featuring a clean and professional layout, this template is perfect for entrepreneurs, corporate teams, and business consultants. Fully customizable and available for PowerPoint, Keynote, and Google Slides, making it easy to tailor for your specific needs.


6 slides
Probability Venn Diagram Infographic
This infographic template displays a set of Probability Venn Diagrams. These are visual tools used to represent the logical relationships between different sets of items, commonly utilized in statistics. They are perfect for presentations to explain concepts like intersections, unions, and complements of sets. Each Venn diagram in the image varies in complexity and color scheme, providing a range of options to illustrate how individual sets overlap or differ, which is useful in showing probabilities, possible logical relations, and more. These diagrams can be especially helpful in business or academic settings where data relationships need to be clarified visually.


4 slides
Crypto Investment Strategies Presentation
Dive into the dynamic world of cryptocurrency with our "Crypto Investment Strategies" presentation templates. These templates provide a structured approach to exploring various investment strategies, perfect for financial advisors and crypto enthusiasts. Easily editable and visually engaging, they're designed to help you present complex information in a clear manner. Compatible with PowerPoint, Keynote, and Google Slides, they offer flexibility across different platforms, ensuring your presentation looks great no matter where you show it.


10 slides
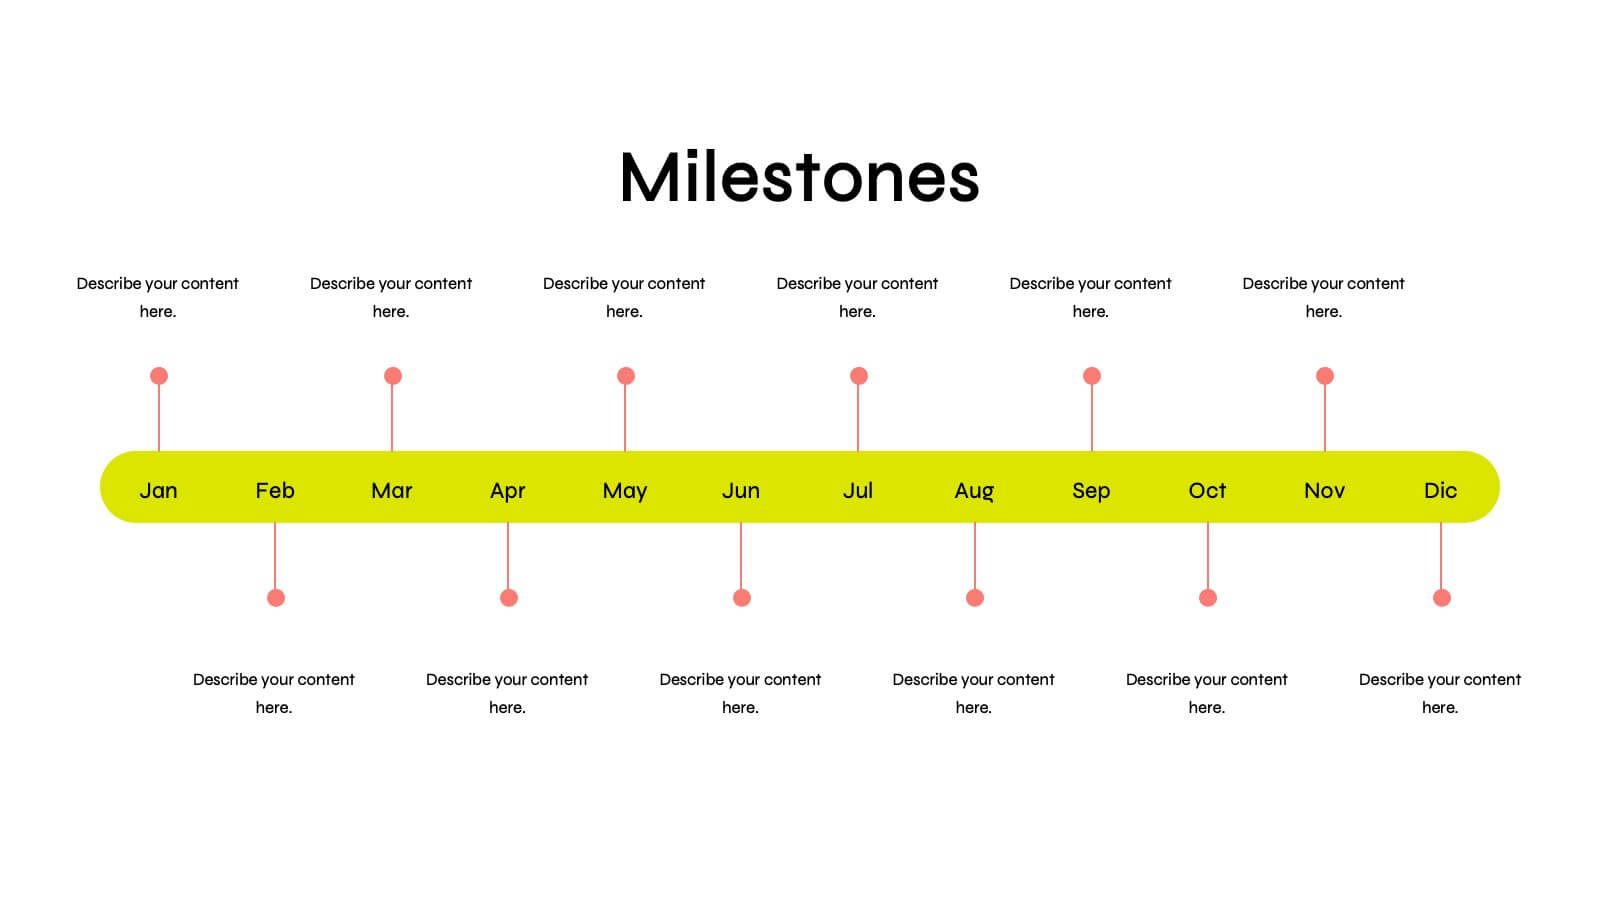
Milestone Roadmap Infographic Presentation
Track progress with clarity using this Milestone Roadmap Infographic template. Designed to highlight key achievements and project phases, it’s perfect for presentations, team updates, and strategic planning. Editable in PowerPoint, Keynote, and Google Slides, it's an efficient way to visualize goals, timelines, and accomplishments.


5 slides
Benefits of Good Nutrition Infographics
Good Nutrition is crucial for overall health, disease prevention, weight management, mental well-being, energy levels, and various other aspects of our physical and mental health. These vertical infographic templates can be used to present the importance and advantages of maintaining a healthy and balanced diet. These are designed to educate and inspire individuals to make informed choices about their nutrition and overall well-being. Perfect for educational presentations, nutrition workshops, wellness programs, or health-related websites, these templates provide valuable information and visual aids to promote better nutrition choices.


7 slides
Target Market Identification Strategy
Spot your ideal customers with precision using this lightbulb-centered layout designed to highlight key market segments and decision-making factors. Whether you're building buyer personas or refining your strategy, this slide presents your insights in a smart, structured way. Fully compatible with PowerPoint, Keynote, and Google Slides.


22 slides
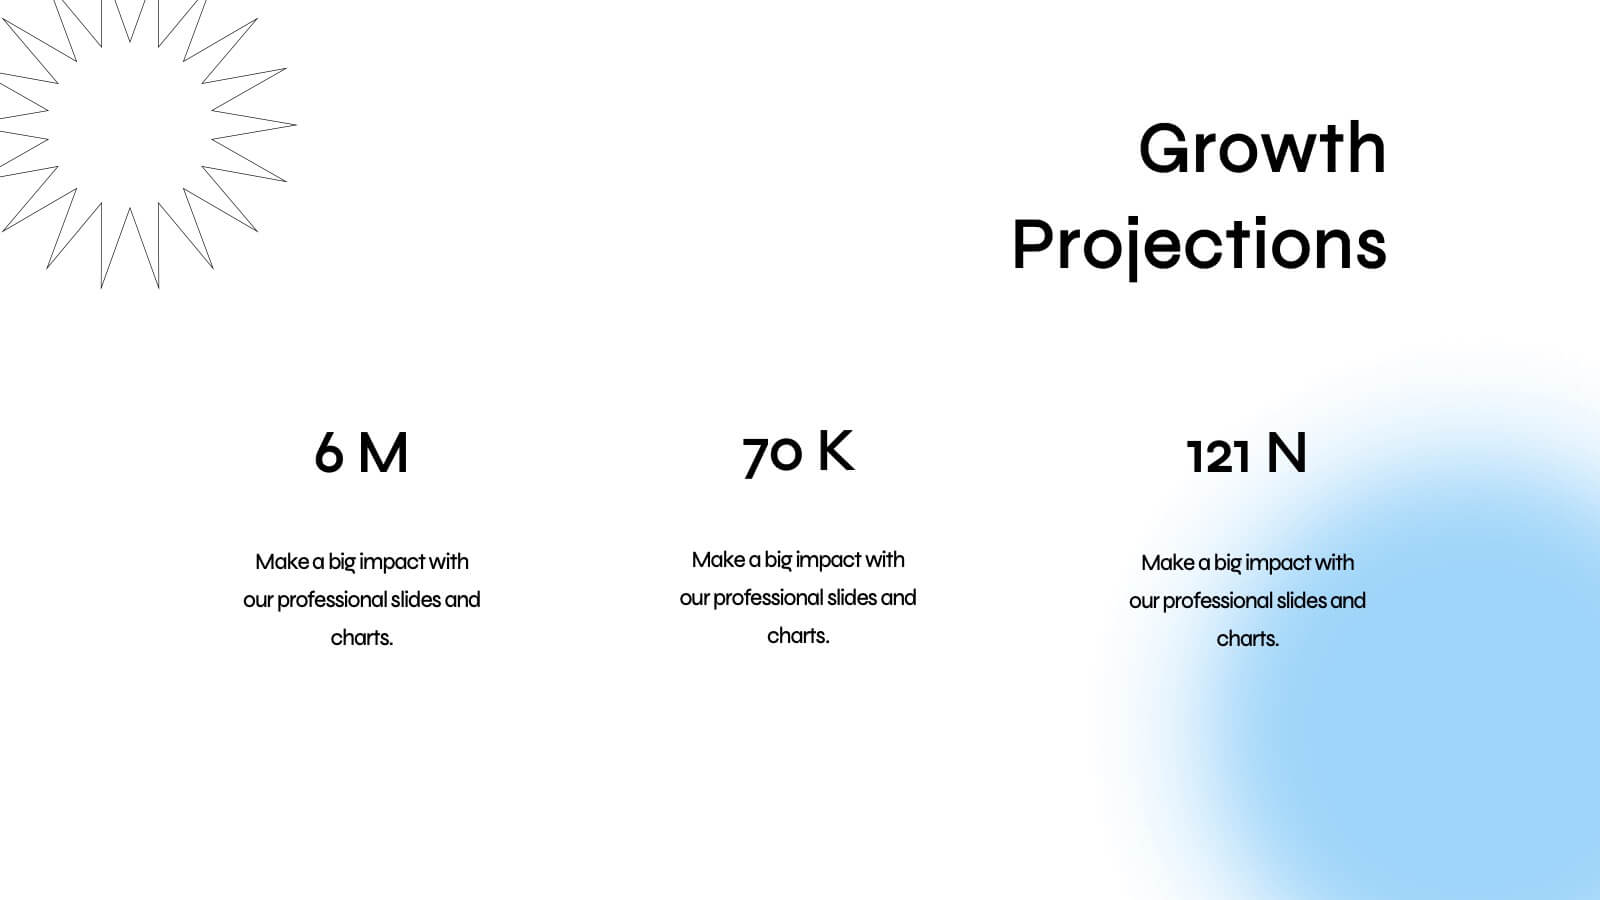
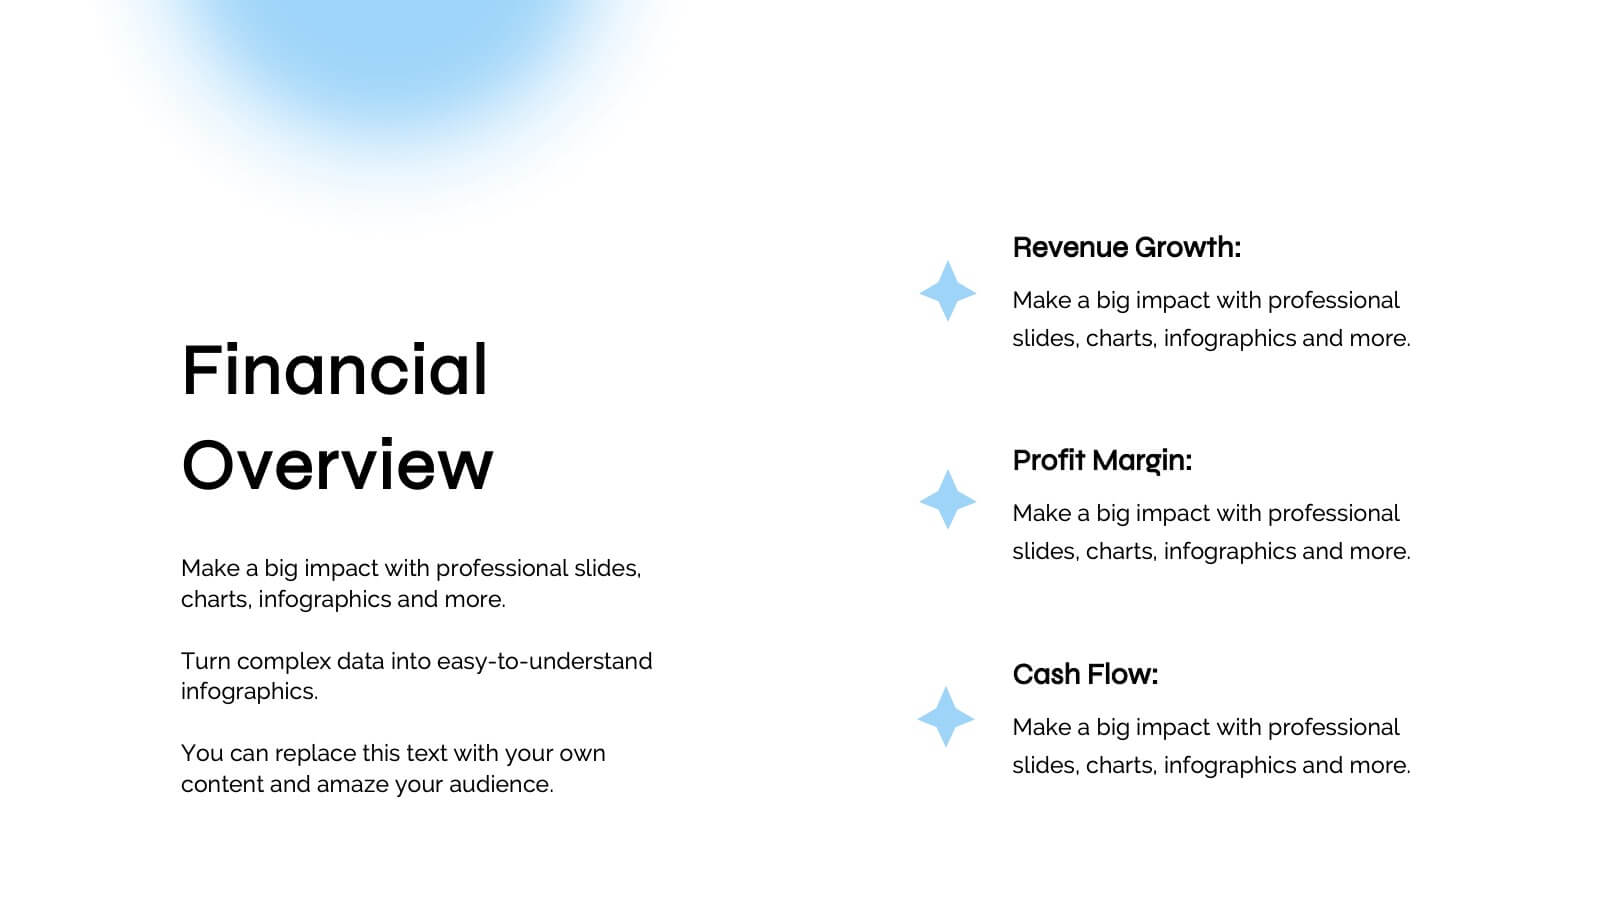
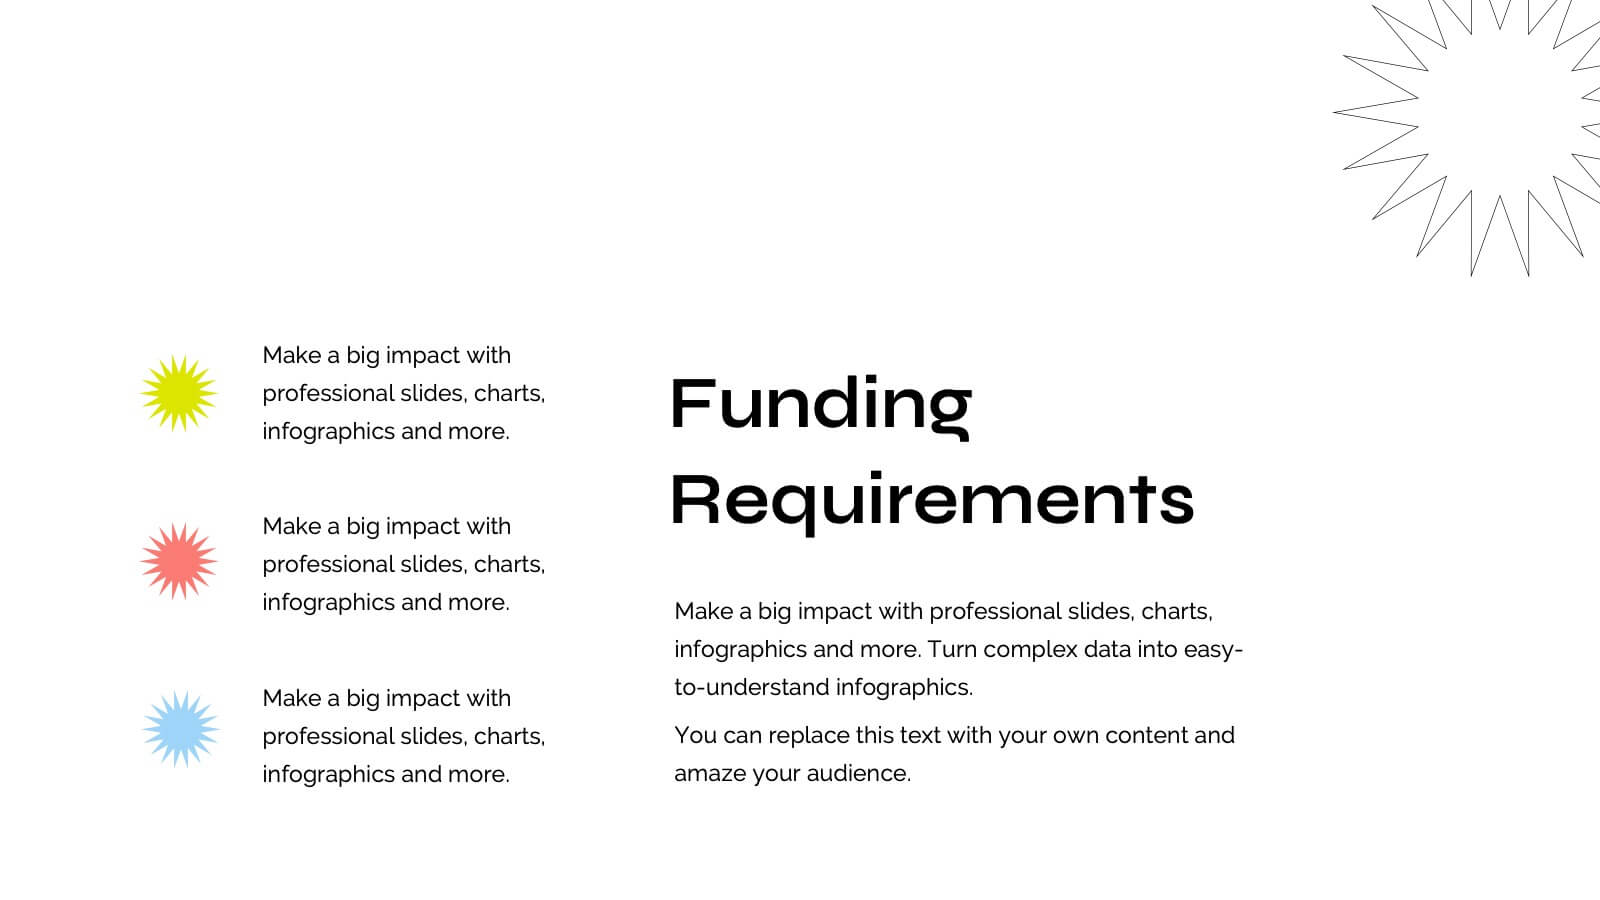
Quirinus Investor Pitch Presentation
Ready to impress investors and stakeholders? This sleek and modern pitch deck template covers all the essentials, from problem statements and market opportunities to revenue models and growth projections. Each slide is designed to convey clear and compelling information for maximum impact. Fully compatible with PowerPoint, Keynote, and Google Slides, making it the perfect tool for your next product launch!


6 slides
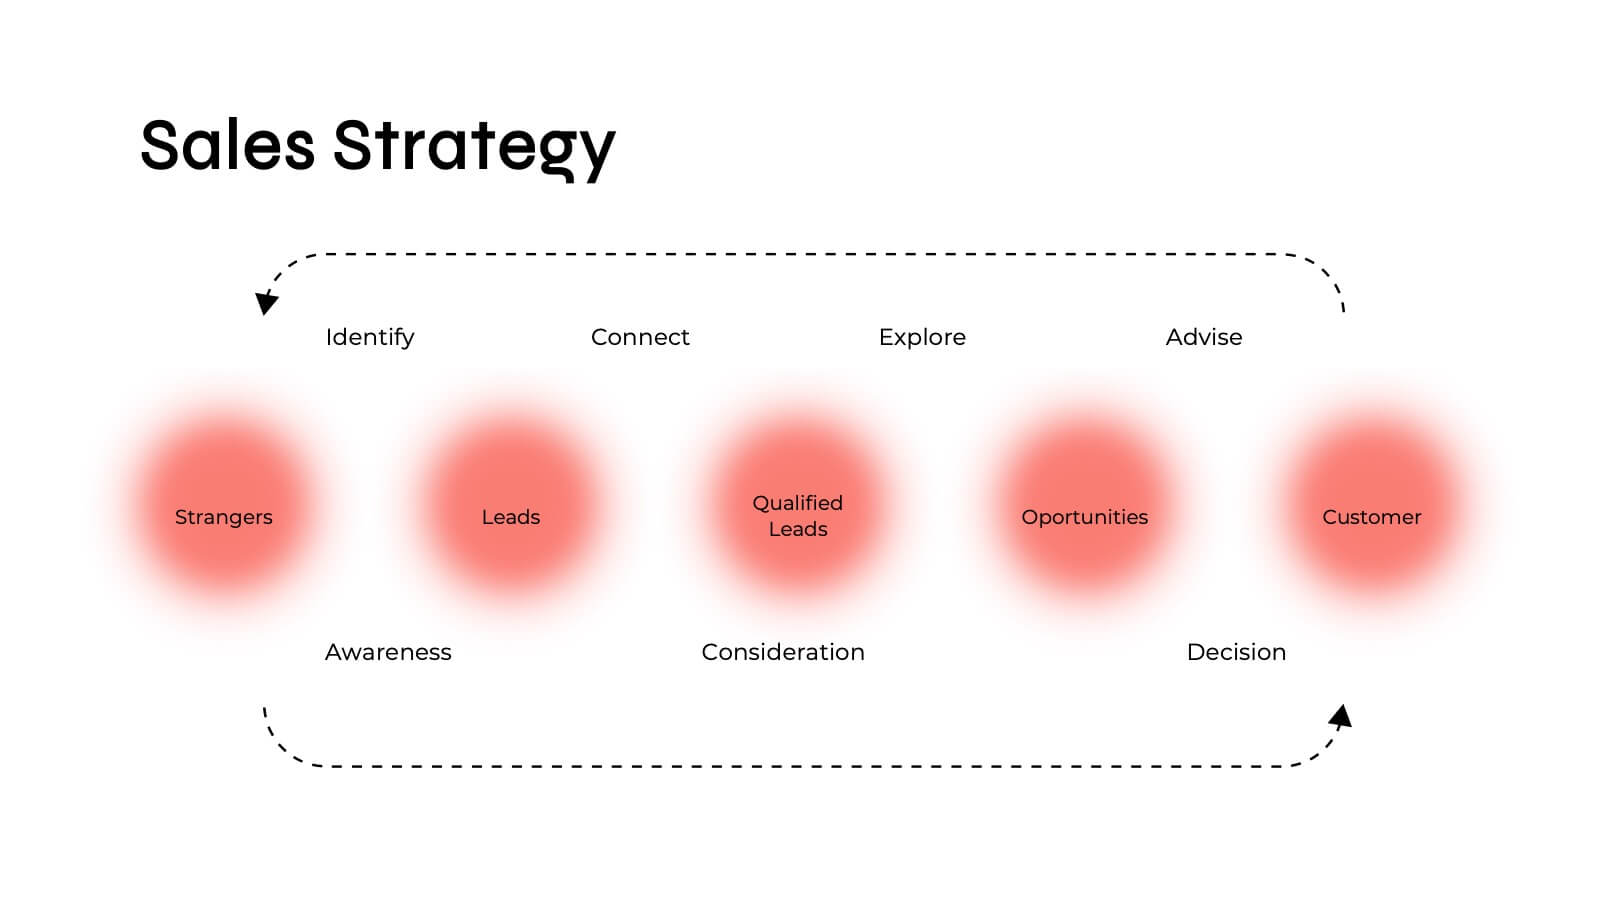
Customer Journey Management Infographic
Map out the customer's path to purchase with our intuitive Customer Journey Management Infographic, perfect for Powerpoint, Google Slides, and Keynote. This visual tool helps businesses understand and enhance the customer experience at every touchpoint. Highlight critical stages from awareness to advocacy with distinct, easy-to-follow layouts. Customize it to fit your brand’s journey, showcasing the interactions and emotions customers encounter. Ideal for marketing strategy sessions and client presentations, it simplifies complex consumer behavior into a clear, actionable pathway.


4 slides
3-Level Pyramid Diagram Presentation
Visualize priorities, strategies, or business structures with the 3-Level Pyramid Diagram Presentation. This slide design features a clear tiered layout—ideal for showcasing step-by-step processes, hierarchy levels, or goal-setting frameworks. Each level is color-coded for easy understanding, and the accompanying text areas keep messaging concise. Fully editable and compatible with PowerPoint, Keynote, and Google Slides.


10 slides
Brand Loyalty and Customer Retention Presentation
Strengthen your brand’s relationship with your audience using the "Brand Loyalty and Customer Retention" presentation template. This design effectively illustrates how strong branding strategies enhance customer loyalty and retention rates. Ideal for marketers and business strategists, this template is fully compatible with PowerPoint, Keynote, and Google Slides, making it perfect for presentations aimed at improving customer engagement and business growth.


21 slides
Mystic UX Research Report Presentation
Present your UX research with precision using this sleek and engaging report template! It covers key elements like user research, wireframes, prototyping, testing, and branding guidelines, providing a comprehensive overview of the design process. Ideal for client reviews or team discussions, this template is fully compatible with PowerPoint, Keynote, and Google Slides.


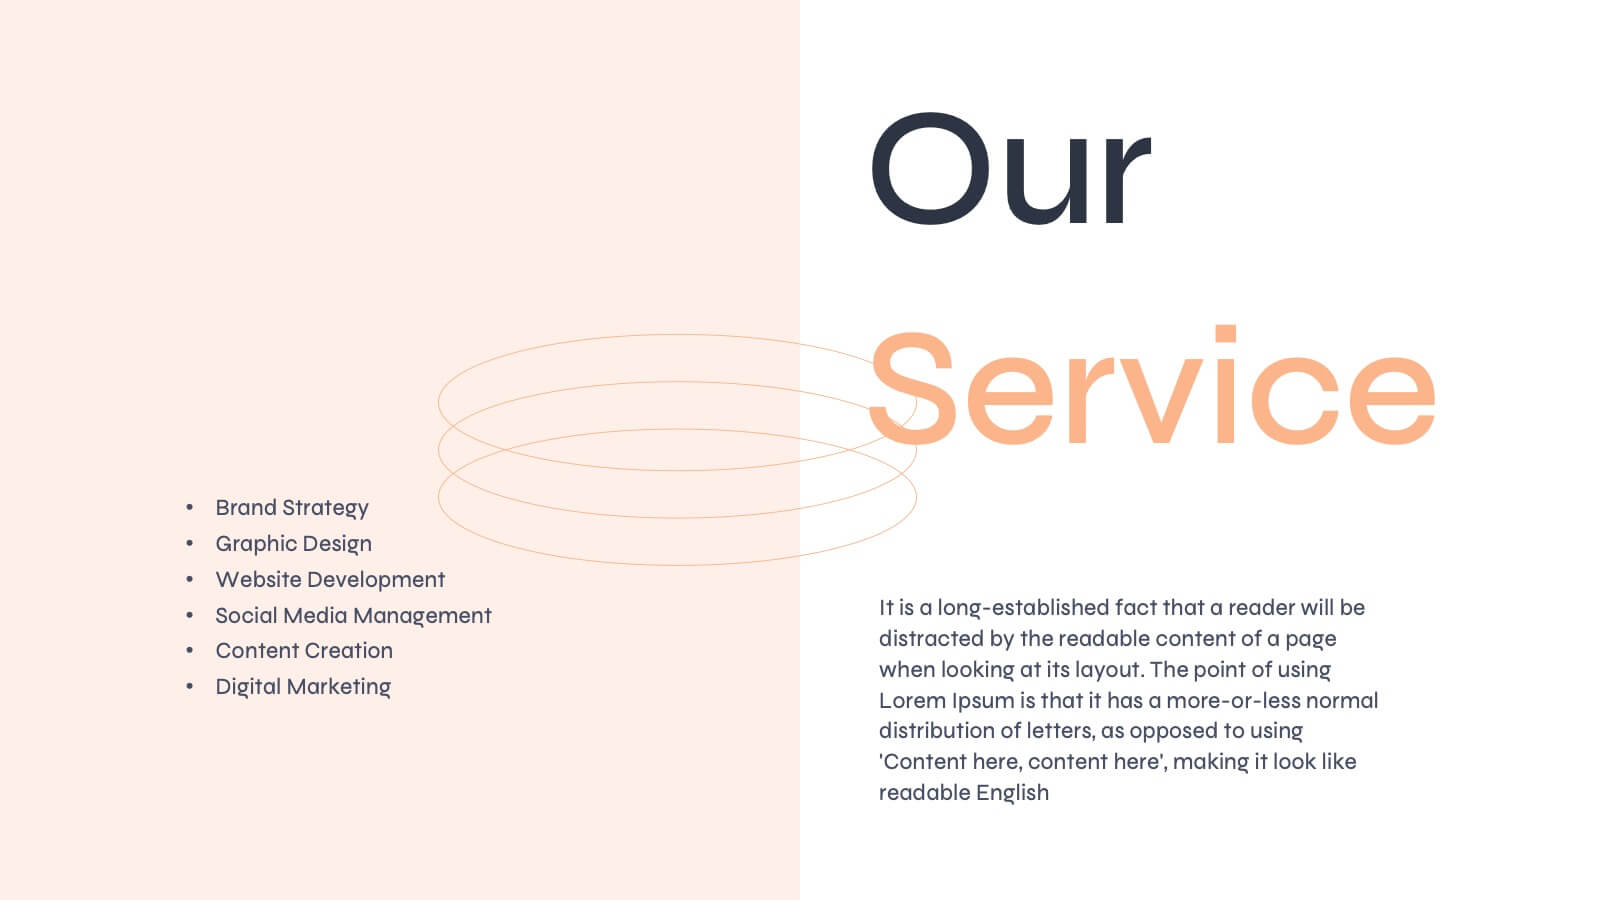
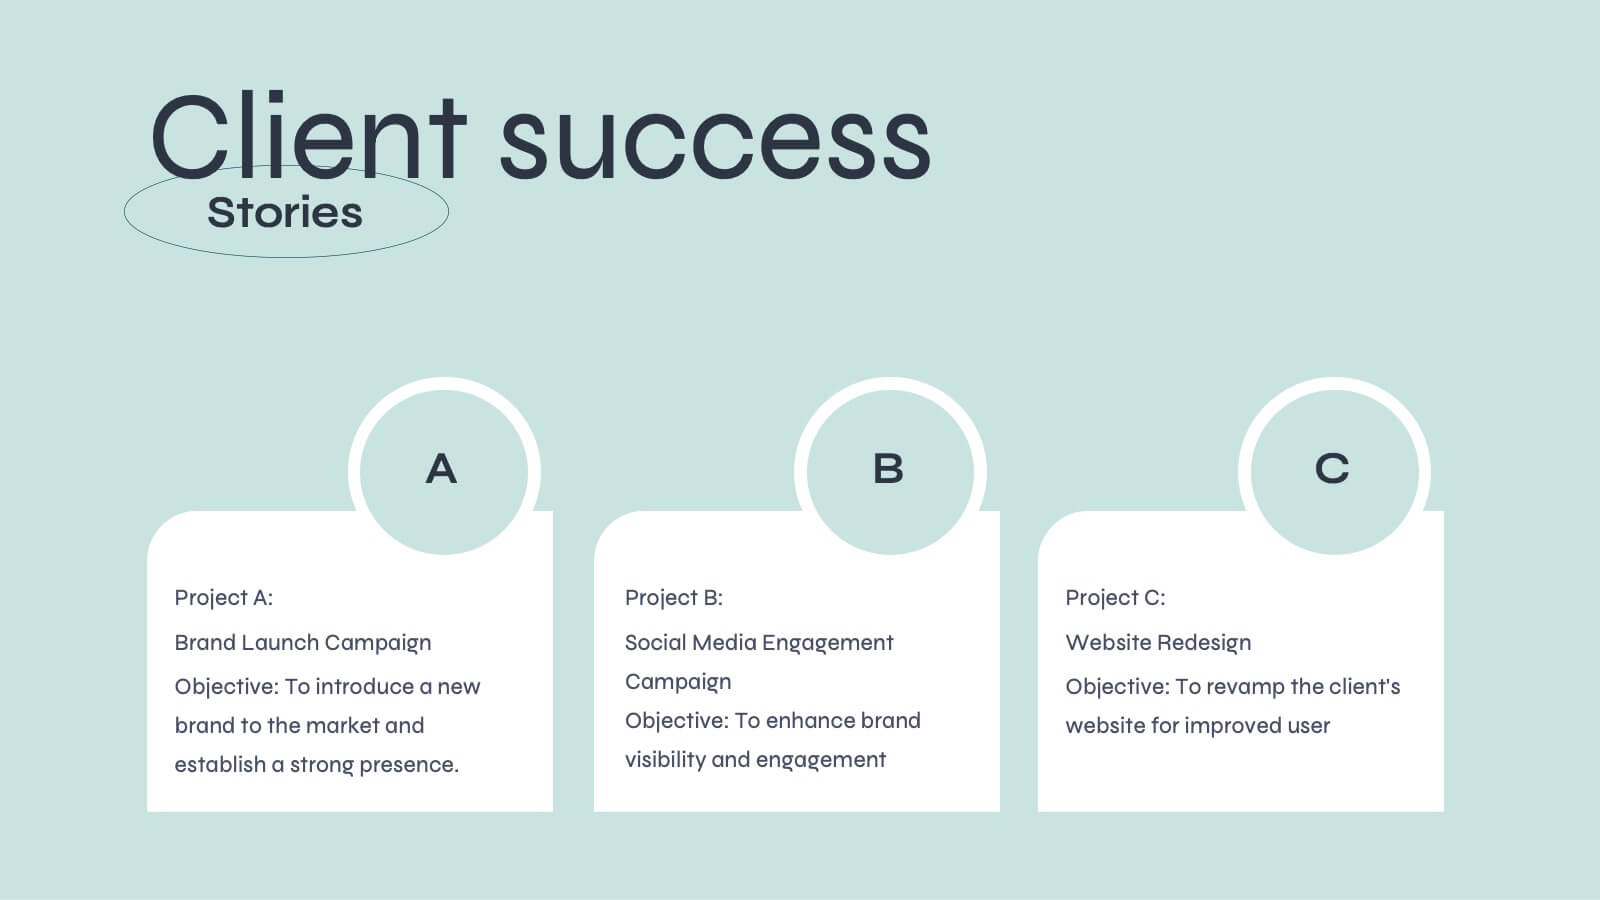
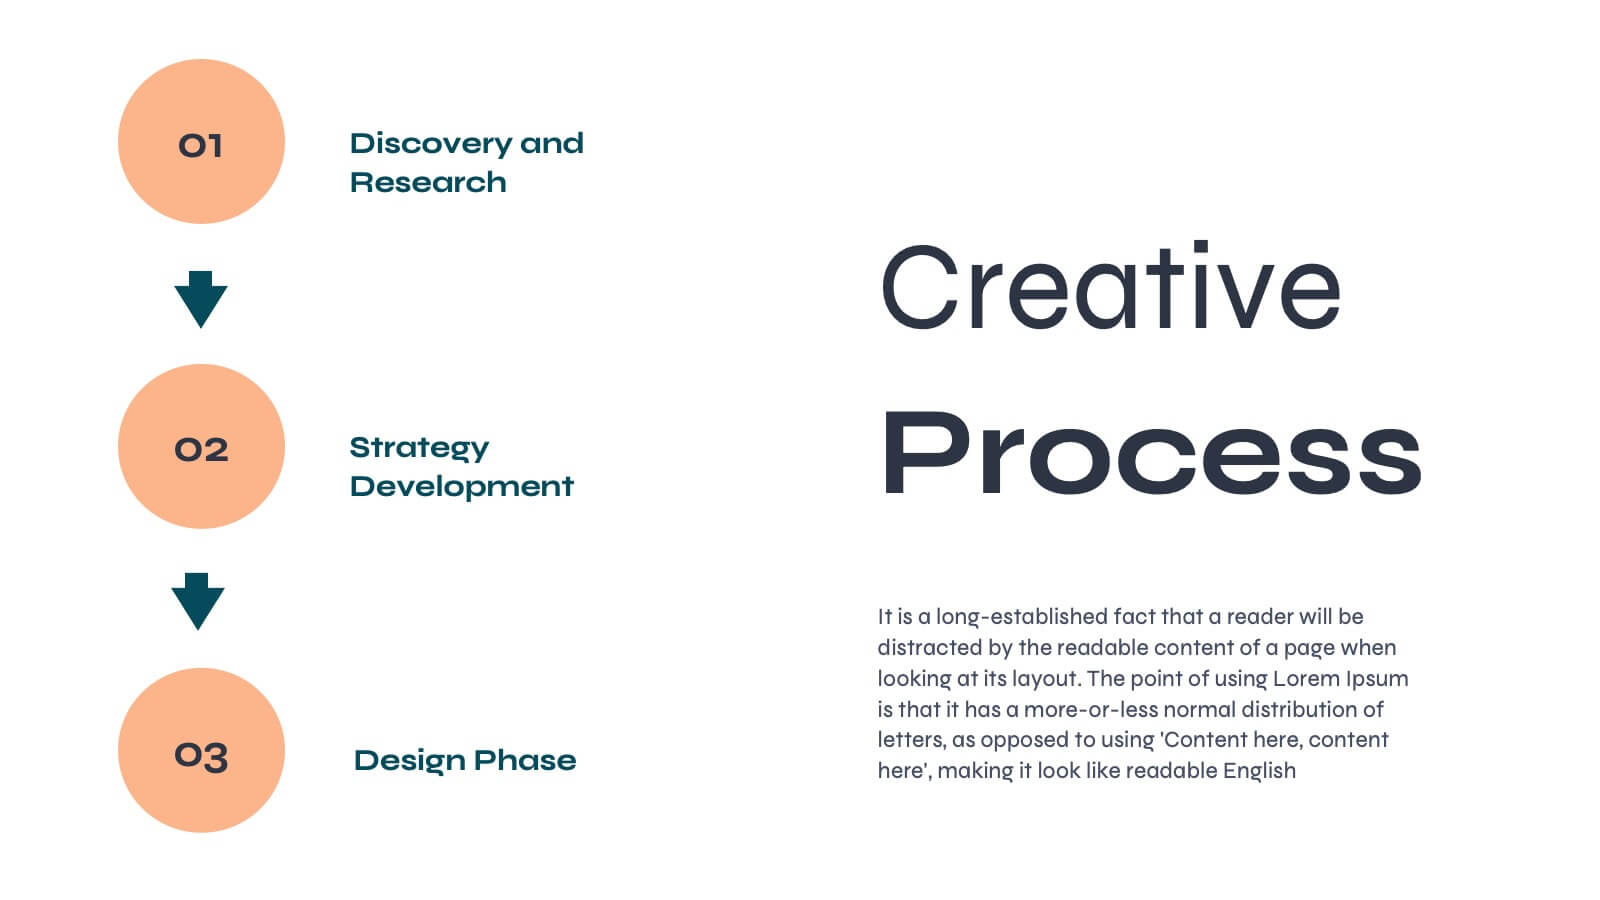
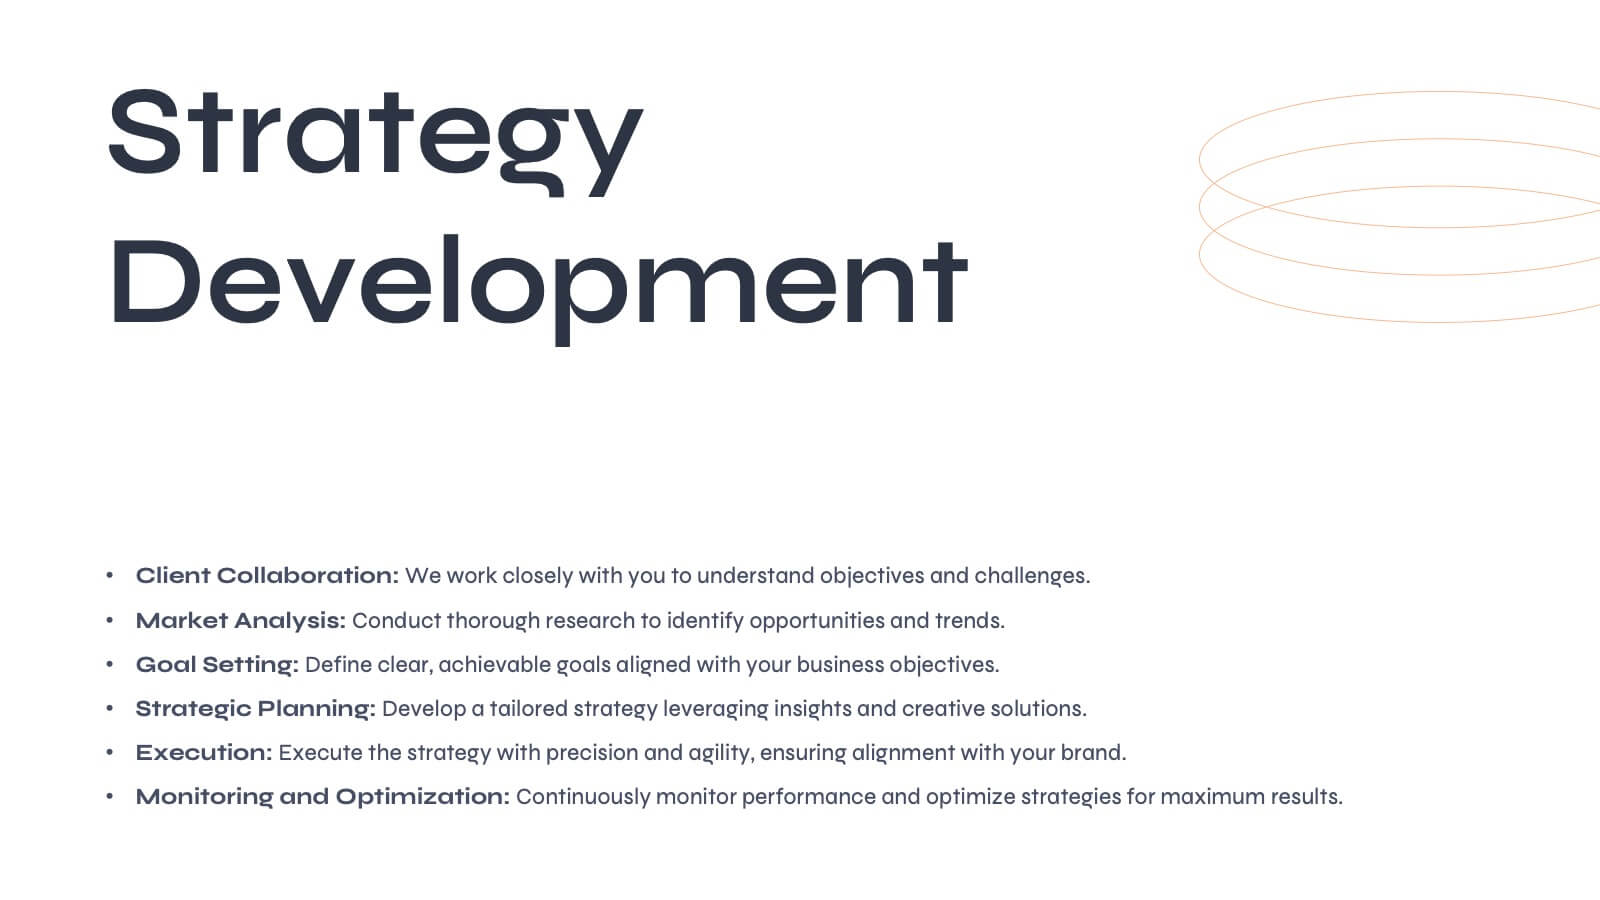
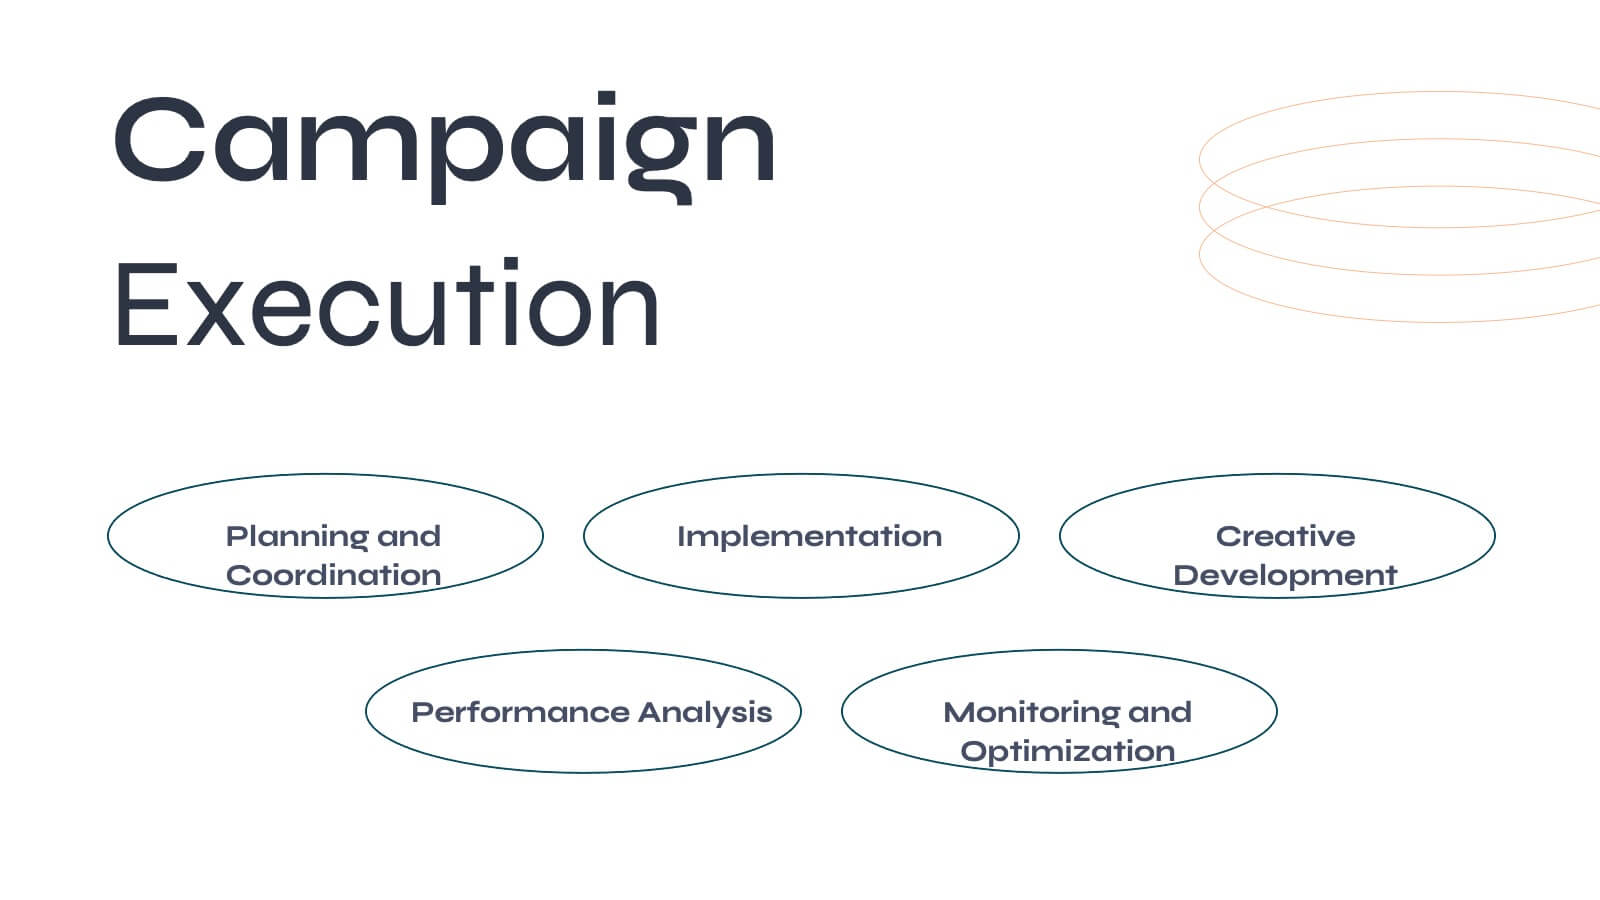
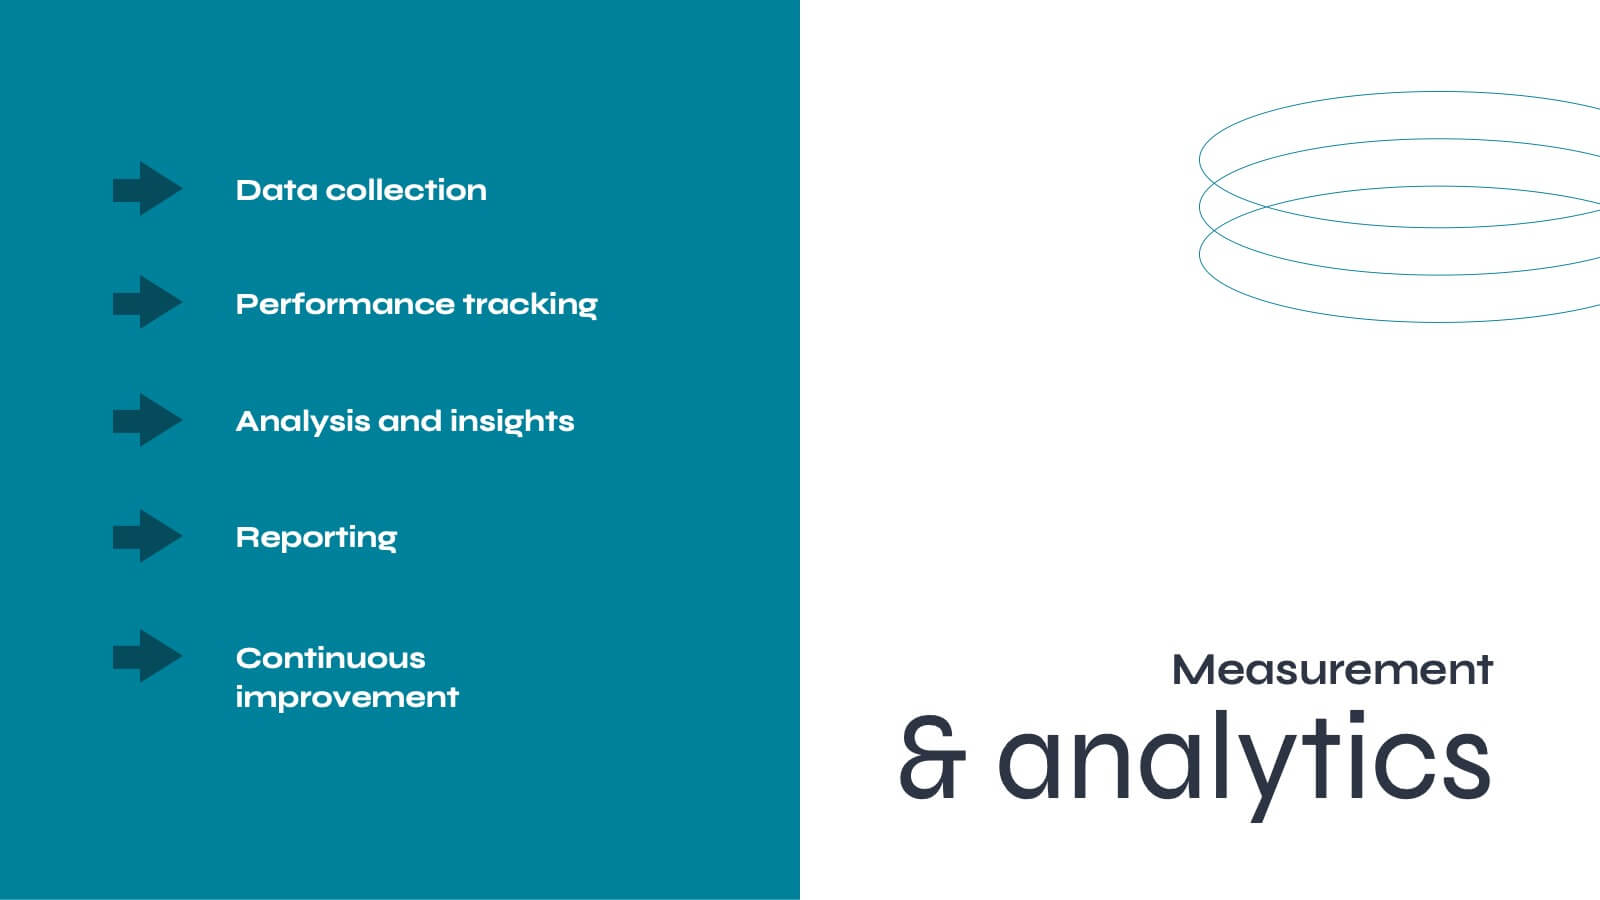


22 slides
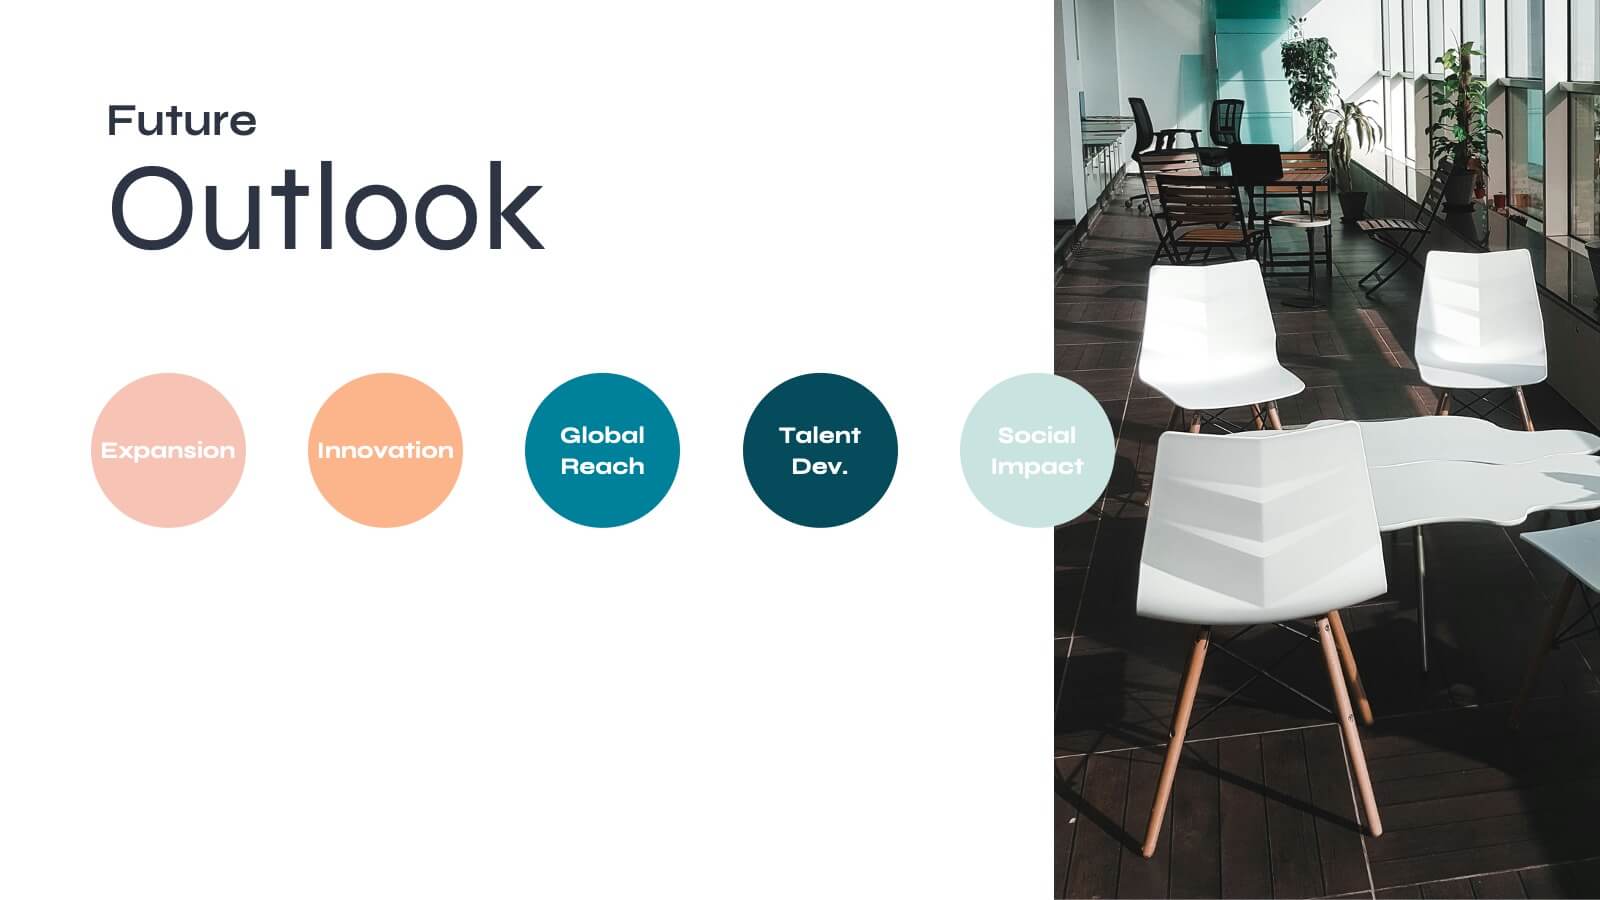
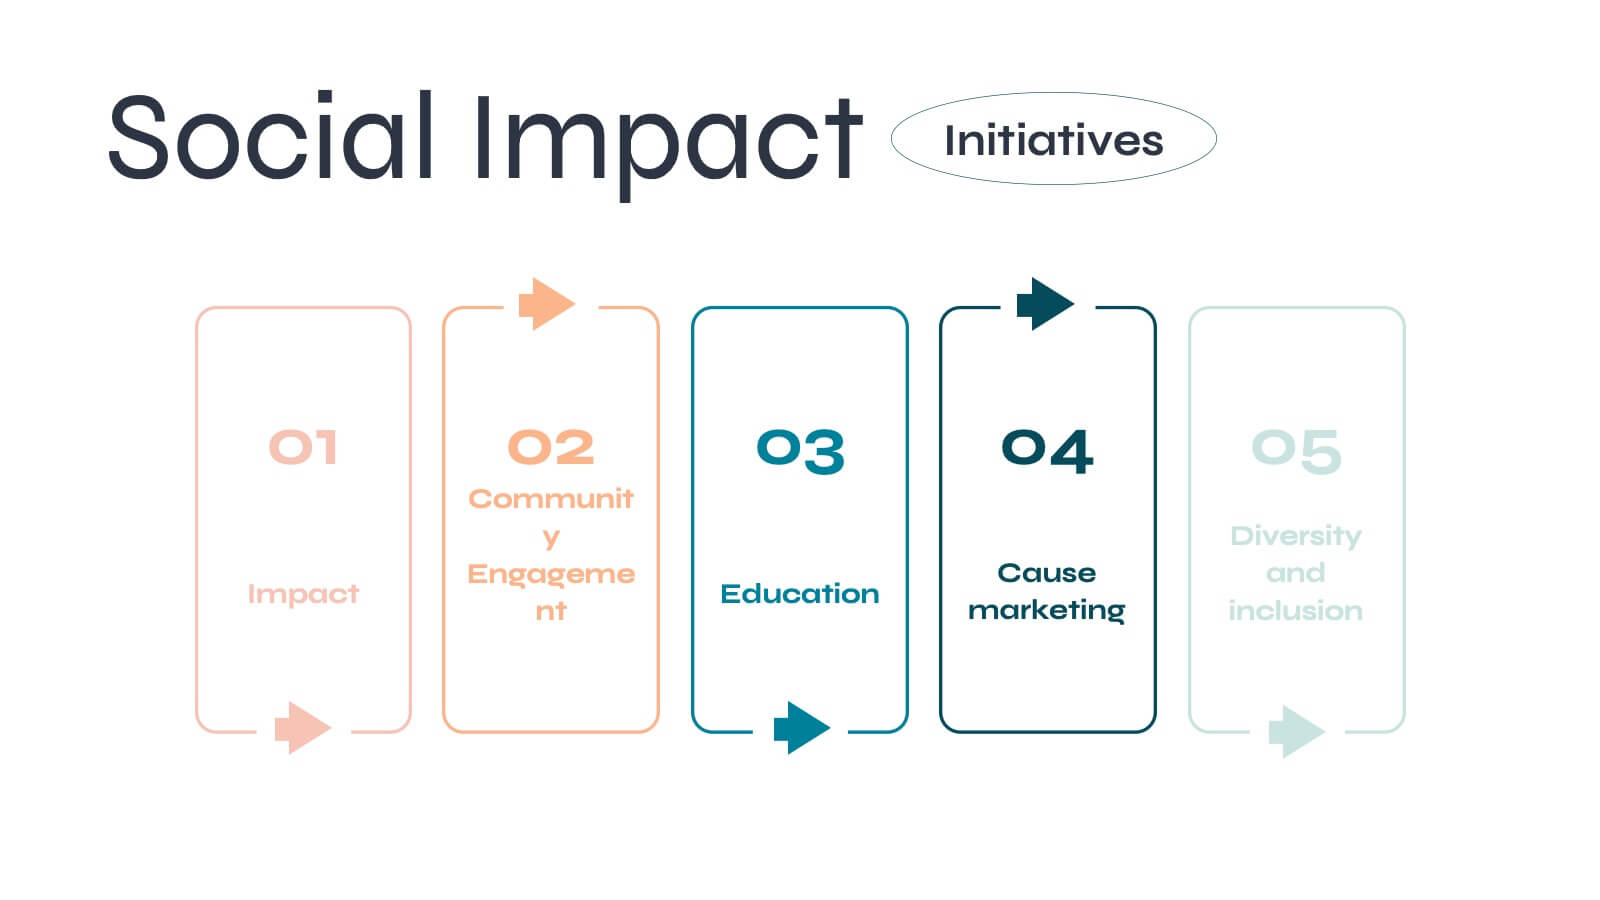
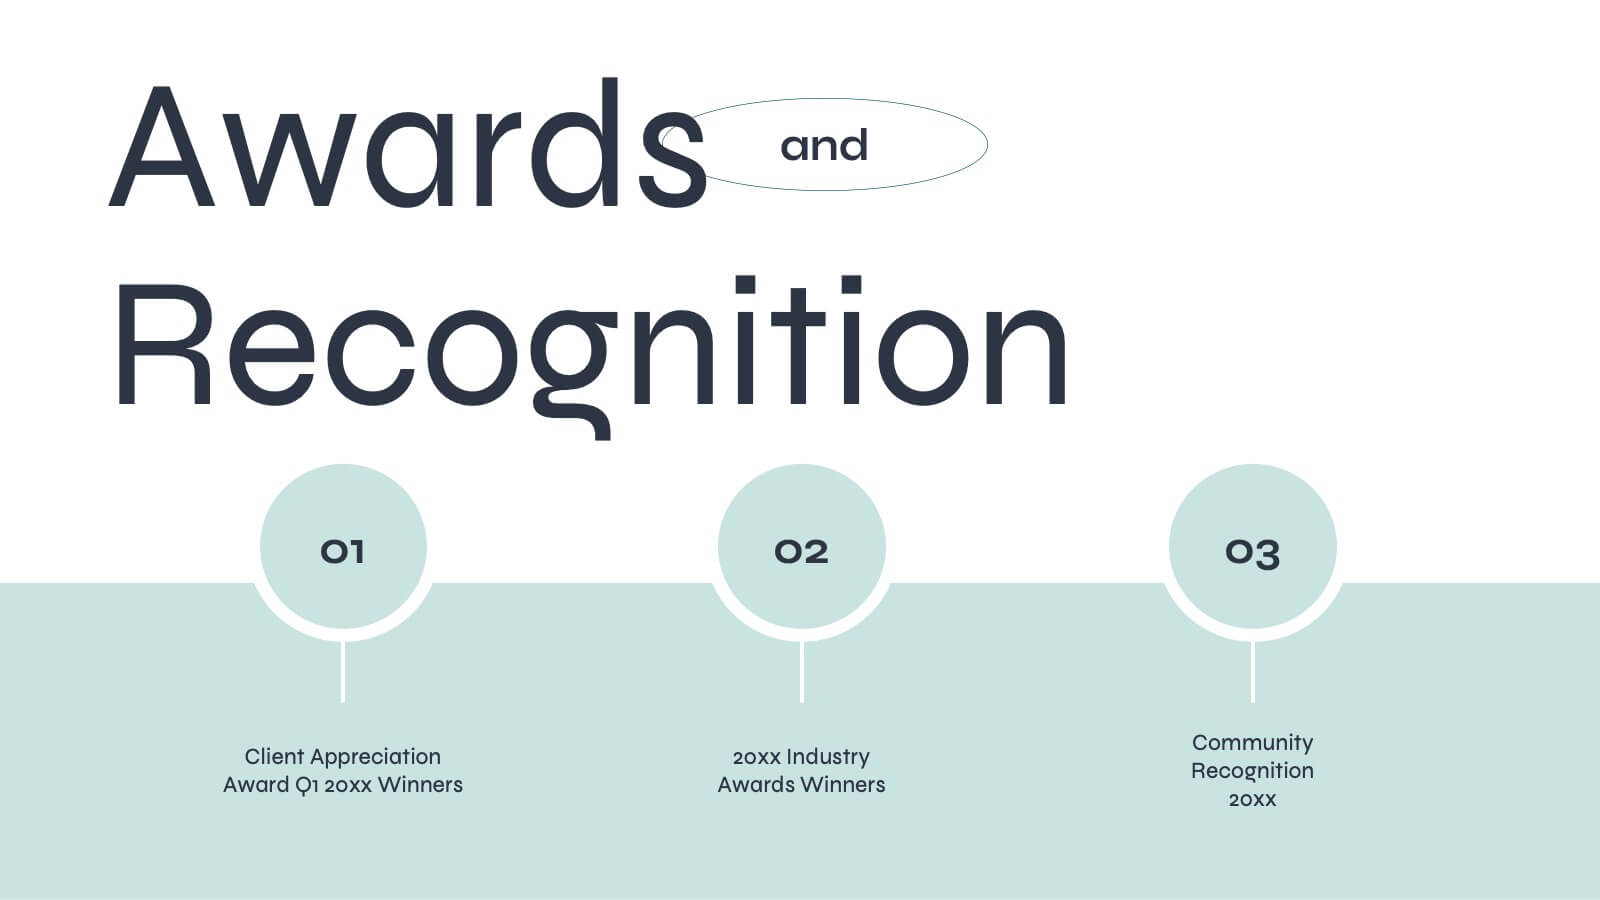
Aurora Agency Portfolio Presentation
Showcase your agency's strengths with this polished, modern presentation template. Perfect for presenting market analysis, client success stories, and creative processes, it features a clean and professional design. Highlight your team's expertise and strategic approach to impress potential clients. Compatible with PowerPoint, Keynote, and Google Slides, it ensures seamless presentations on any platform.