


Features
- 4 Unique Slides
- Fully editable and easy to edit in Microsoft Powerpoint, Keynote and Google Slides
- 16:9 widescreen layout
- Clean and professional designs
- Export to JPG, PDF or send by email


Do you have any questions?
Recommend


5 slides
Project Boundaries and Deliverables Presentation
Visualize key checkpoints with the Project Boundaries and Deliverables Presentation. This flag-style timeline infographic clearly marks each phase of your project journey—ideal for outlining scope, goals, and delivery milestones. Designed for clarity and progress tracking, this template works seamlessly in PowerPoint, Keynote, and Google Slides.


5 slides
Employee Onboarding Training Roadmap Presentation
Visualize your training journey with the Employee Onboarding Training Roadmap Presentation. This layout uses a road-style timeline with trucks to represent each step of the onboarding process—perfect for outlining key milestones, training modules, or departmental introductions. Fully editable in PowerPoint, Keynote, Google Slides, or Canva.


4 slides
Revenue and Expense Forecasting Overview Presentation
Easily illustrate financial trade-offs with the Revenue and Expense Forecasting Overview Presentation. This clean, visual slide design features a seesaw-style balance graphic to help communicate proportional budgeting between revenue, balance, and expenses. Ideal for finance updates, annual reports, and planning meetings. Fully editable in PowerPoint, Google Slides, Keynote, and Canva.


6 slides
Internal Communication Strategy Presentation
Bring your message to life with a dynamic slide that turns communication goals into a simple, engaging visual story. This presentation highlights key steps, channels, and team roles to help audiences understand how information flows across an organization. Clean icons and structured layouts make every point clear and memorable. Fully compatible with PowerPoint, Keynote, and Google Slides.


12 slides
Creative Mind Map Presentation
Unlock new perspectives with the Creative Mind Map Presentation. Designed to visualize brainstorming, strategic thinking, or concept development, this template offers an intuitive radial layout to highlight five key ideas. Fully customizable and ideal for professionals, educators, and creatives. Compatible with PowerPoint, Keynote, and Google Slides for seamless use.


6 slides
Iceberg Visualization Business Concept Presentation
Make your message stand out with a bold visual that reveals what lies above and below the surface. This presentation uses a clear iceberg structure to help explain business concepts, hidden insights, and layered ideas with ease. Perfect for strategy, planning, and analysis. Compatible with PowerPoint, Keynote, and Google Slides.


8 slides
Winning Strategies for Professional Success Presentation
Showcase your top performers, strategic milestones, or ranked insights with this podium-style template. Featuring vibrant visuals and structured layout, it’s ideal for performance reviews, leadership presentations, and competitive analysis. Fully editable in PowerPoint, Keynote, and Google Slides—perfect for professional success stories, rankings, and progress highlights.


4 slides
Risk Impact Matrix Grid Presentation
Visualize project risk with this customizable impact matrix grid. Designed for quick risk assessment, it helps you map likelihood versus impact using color-coded indicators and clean grid layouts. Ideal for strategic planning, audits, or compliance meetings. Compatible with PowerPoint, Google Slides, and Keynote for seamless editing and professional presentations.


5 slides
Root Cause Business Problem Slide
Uncover the foundation of complex challenges with this tree-inspired slide—perfect for visualizing root causes behind business problems. Showcase contributing factors at each root to guide effective solutions. Fully editable in PowerPoint, Keynote, and Google Slides.


4 slides
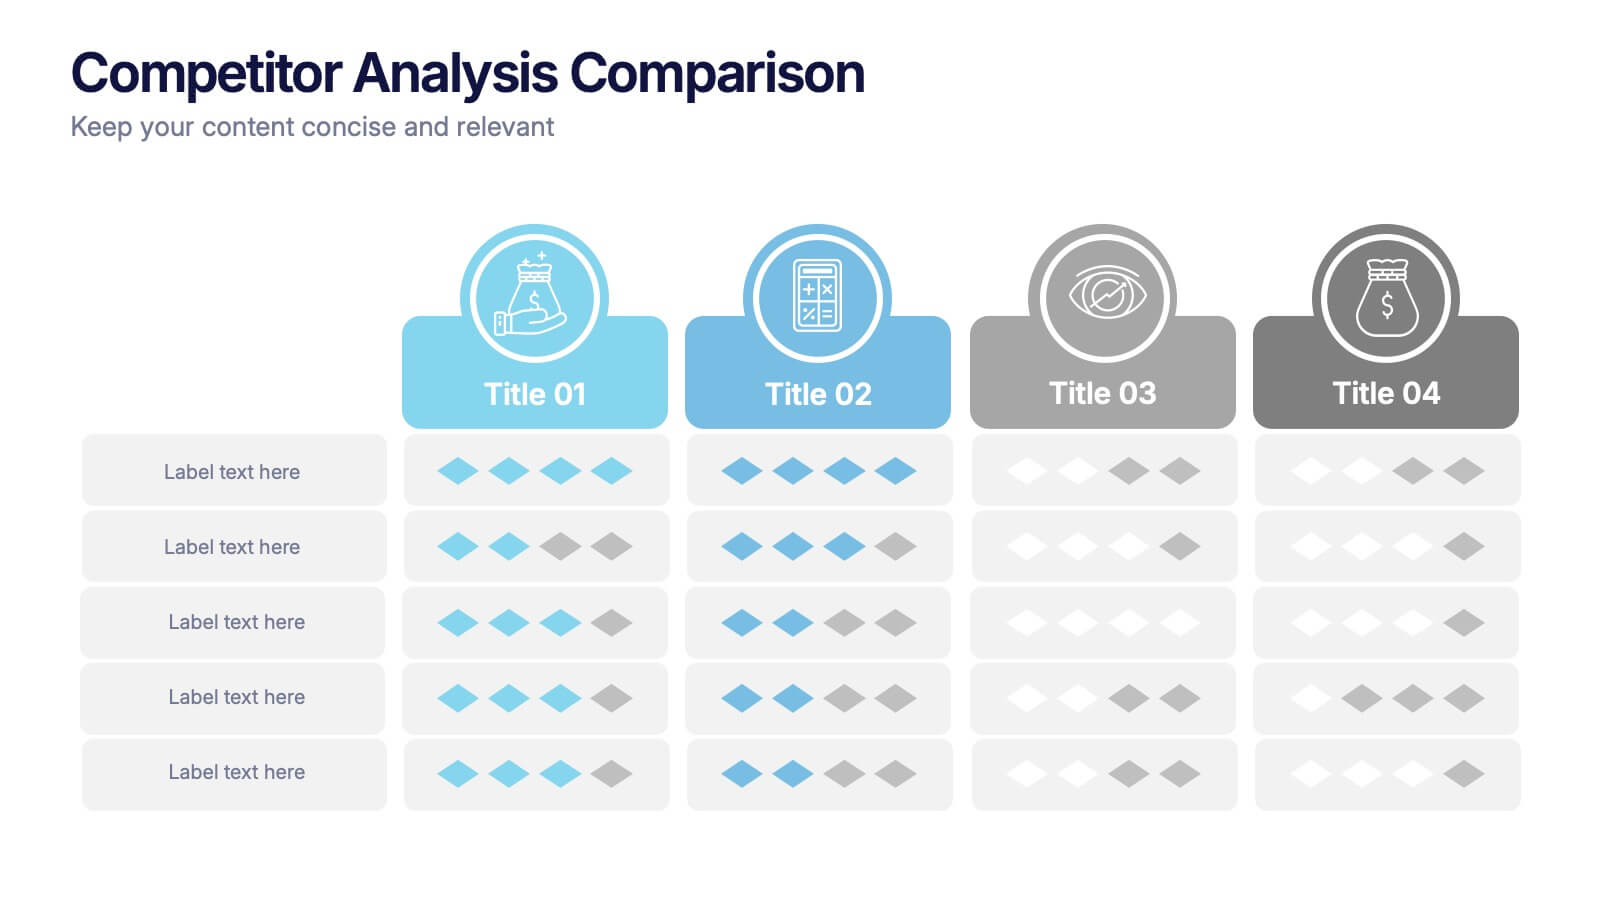
Comparative Assessment Using Harvey Ball Chart Presentation
Make your evaluations easier to understand with this Harvey Ball chart template. Designed for performance comparison, efficiency scoring, or feature benchmarking, this layout supports up to 4 items and 3 criteria. Each element is clearly visualized for quick decision-making. Fully editable in PowerPoint, Keynote, or Google Slides—ideal for business strategy, operations, or HR presentations.


5 slides
Risk Coverage and Claims Process Presentation
Visualize your risk levels and claims procedures with this Risk Coverage and Claims Process slide. The thermometer-style graphic clearly represents stages of coverage or escalation. Ideal for insurance, compliance, or legal teams. Fully editable and compatible with PowerPoint, Keynote, and Google Slides to match your branding and workflow needs.


6 slides
RAPID Framework for Business Strategy Presentation
Unveil a dynamic approach to strategic decision-making with the RAPID Framework for Business Strategy template. This structured layout covers the Recommend, Agree, Perform, Input, and Decide stages, offering a comprehensive toolkit for business planning and execution. This versatile template is essential for teams aiming to enhance strategic planning and is compatible with PowerPoint, Keynote, and Google Slides, making it accessible for a wide range of business professionals.


10 slides
Financial Growth Planning
Visualize your path to financial success with this puzzle-themed Financial Growth Planning template. Each step connects seamlessly to outline investment goals, budgeting strategies, or revenue milestones. Designed for clarity and impact, it's fully editable in PowerPoint, Keynote, and Google Slides for effortless customization.


7 slides
Healthy Food Infographic
Healthy food is of paramount importance for overall well-being and a good quality of life. This infographic template aims to promote understanding and adoption of a healthy diet through a visually appealing and informative layout. This template is designed to showcase a balanced and nutritious diet by educating individuals on healthy food choices, portion control, and incorporating superfoods into their meals. This infographic is fully customizable and compatible with Powerpoint, Keynote, and Google Slides. This allows you to easily customize, add visuals, and design as per your needs and preferences.


5 slides
Agile Project Roadmap Presentation
Visualize your quarterly project plans with clarity using this Agile roadmap slide. Designed with a horizontal layout for Q1 to Q4, this infographic includes three workstreams and color-coded bars to represent initiatives or sprints. Icons provide quick visual cues for different teams or objectives. Ideal for agile teams, product managers, or project leads who need a clean, editable layout. Compatible with PowerPoint, Keynote, and Google Slides.


5 slides
4-Stage Gap Identification Presentation
A clear, engaging way to map progression, this presentation helps you illustrate each stage of identifying business gaps with structure and clarity. It guides audiences through challenges, priorities, and opportunities in a simple step-by-step flow that’s easy to follow and present. Fully compatible with PowerPoint, Keynote, and Google Slides.


7 slides
SCRUM Master Infographic Presentation
A Scrum infographic provides an overview of all the key components of the Scrum framework and helps teams and individuals understand this powerful agile methodology. This Infographic template is fully editable and can be easily customized to reflect your business, company or organization. It’s a great way to present your ideas in a clear and efficient manner. Full of charts and diagrams, this template creates an impactful visual effect. The blue color scheme will help create a fresh look in your presentations. This template is designed for use in Powerpoint, Google Sheets or Keynote.