


Features
- 4 Unique slides
- Fully editable and easy to edit in Microsoft Powerpoint, Keynote and Google Slides
- 16:9 widescreen layout
- Clean and professional designs
- Export to JPG, PDF or send by email


Do you have any questions?
Recommend


5 slides
Natural Disaster Effects Infographics
Natural Disasters are sudden and extreme events caused by natural forces that result in significant damage, and loss of life. This template is designed to effectively educate your audience about the effects of natural disasters and promote awareness and preparedness for such events. With this template you can present the effects and consequences of various natural disasters. Compatible with Powerpoint, Keynote, and Google Slides. It features a nature design with customizable photo layouts, charts, and infographics that help illustrate the effects. Use these visuals to depict different types of natural disasters, such as earthquakes, floods, and wildfires.


4 slides
Sustainability in Water Conservation Presentation
Highlight your eco-initiatives with this visually engaging Sustainability in Water Conservation presentation. Featuring a puzzle-style water drop diagram, this slide helps communicate four core strategies or ideas clearly and effectively. The clean layout and modern icons ensure your message is both professional and impactful, making it ideal for presentations on sustainability goals, environmental education, or water-saving initiatives. Fully editable and compatible with PowerPoint, Keynote, and Google Slides.


4 slides
Daily Time Planning and Scheduling Presentation
Stay organized and maximize productivity with this Daily Time Planning and Scheduling template. Featuring a structured hourly schedule, task folders for tomorrow’s plans and to-do lists, and a dedicated notes section, this slide is designed for professionals, students, and busy individuals. Customize effortlessly to track daily tasks, set priorities, and manage time effectively. Fully compatible with PowerPoint, Keynote, and Google Slides for seamless integration.


7 slides
Smile Rating Importance Infographic Presentation
Smile Rating is a metric used in customer service to measure the level of customer satisfaction or happiness with a particular experience, interaction or service. This template will help you make a vibrant, friendly and original presentation. This smile rating infographic is easy to use and customize. It is fully editable and the layout allows you to personalize it. This template can be edited in PowerPoint, Keynote, and Google Slides. This is perfect for business presentations, strategic planning, idea-sharing sessions or just a fun way to share your thoughts on this design topic.


26 slides
Warm Tones Real Estate Presentation
Create an engaging and inviting Warm Tone Real Estate presentation with this easy to use template. The color scheme of this welcoming template features warm tones to set the mood for a peaceful, natural environment. The cover slide features emerald green and brown, while the next two slides use warmer brown, tan shades, keeping the same theme going. Fully customizable, this template is ready to help you sell and promote properties quickly and easily. This layout is perfect for showcasing properties with a premium feel that’ll inspire confidence in both buyers and sellers alike.


21 slides
Rakshasa Project Status Report Presentation
This detailed status report template helps track progress with clarity and precision. Featuring sections on financial summaries, operational updates, key achievements, and market trend analysis, it ensures seamless reporting and decision-making. Perfect for reviewing team productivity, challenges, and upcoming priorities, this template offers easy customization in PowerPoint, Keynote, or Google Slides.


3 slides
Corporate Sustainabilitiy Management Strategy Presentation
Drive your company’s future with a presentation that blends strategy, innovation, and sustainability. Designed to communicate eco-friendly initiatives and long-term business goals, it helps visualize performance, impact, and growth clearly. Fully customizable and compatible with PowerPoint, Keynote, and Google Slides for seamless, professional, and engaging sustainability presentations.


10 slides
Lean Business Model Planning Presentation
Streamline your startup strategy with this Lean Canvas presentation template. Designed for entrepreneurs and agile teams, it breaks down your business plan into 9 essential blocks—from Problem and Solution to Revenue Streams and Cost Structure. Easy to edit in PowerPoint, Keynote, or Google Slides for fast, effective planning and pitch presentations.


21 slides
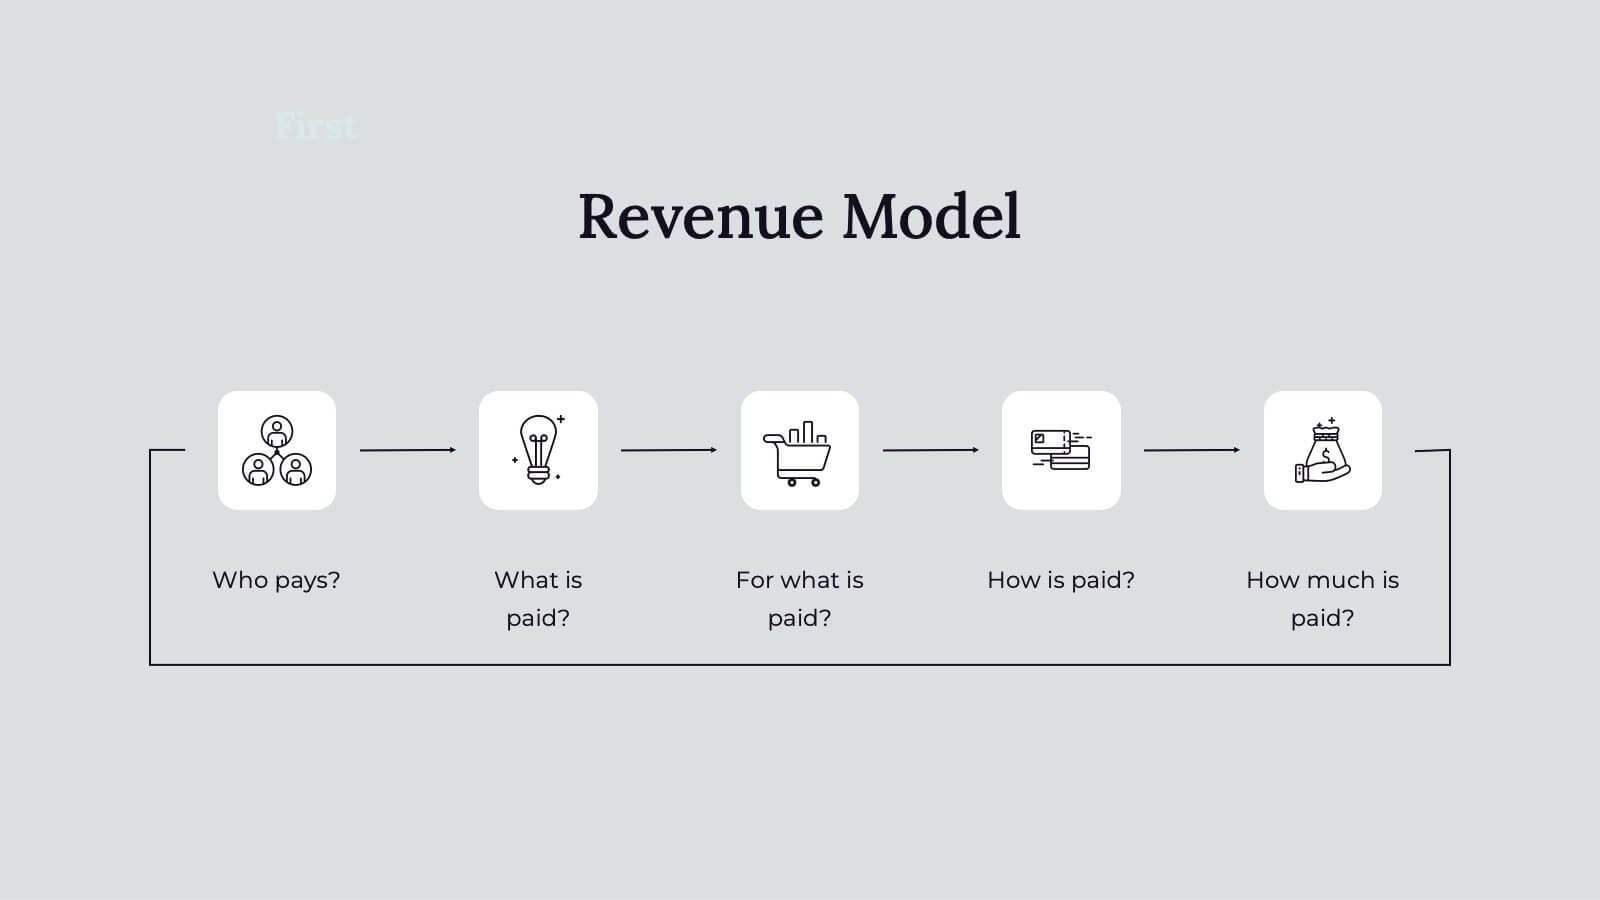
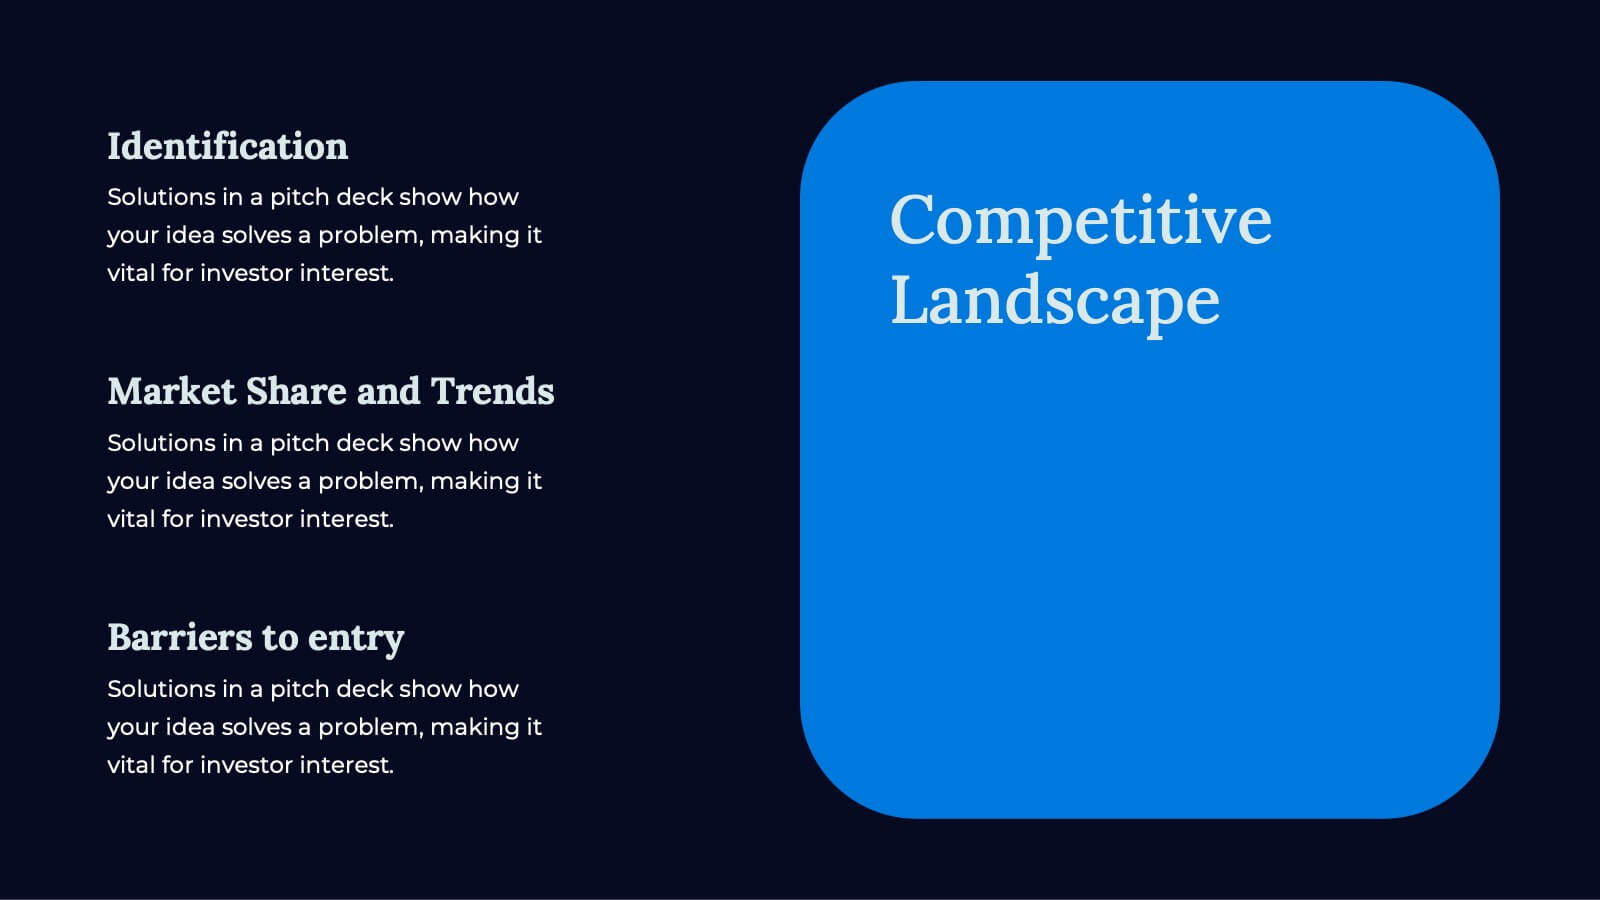
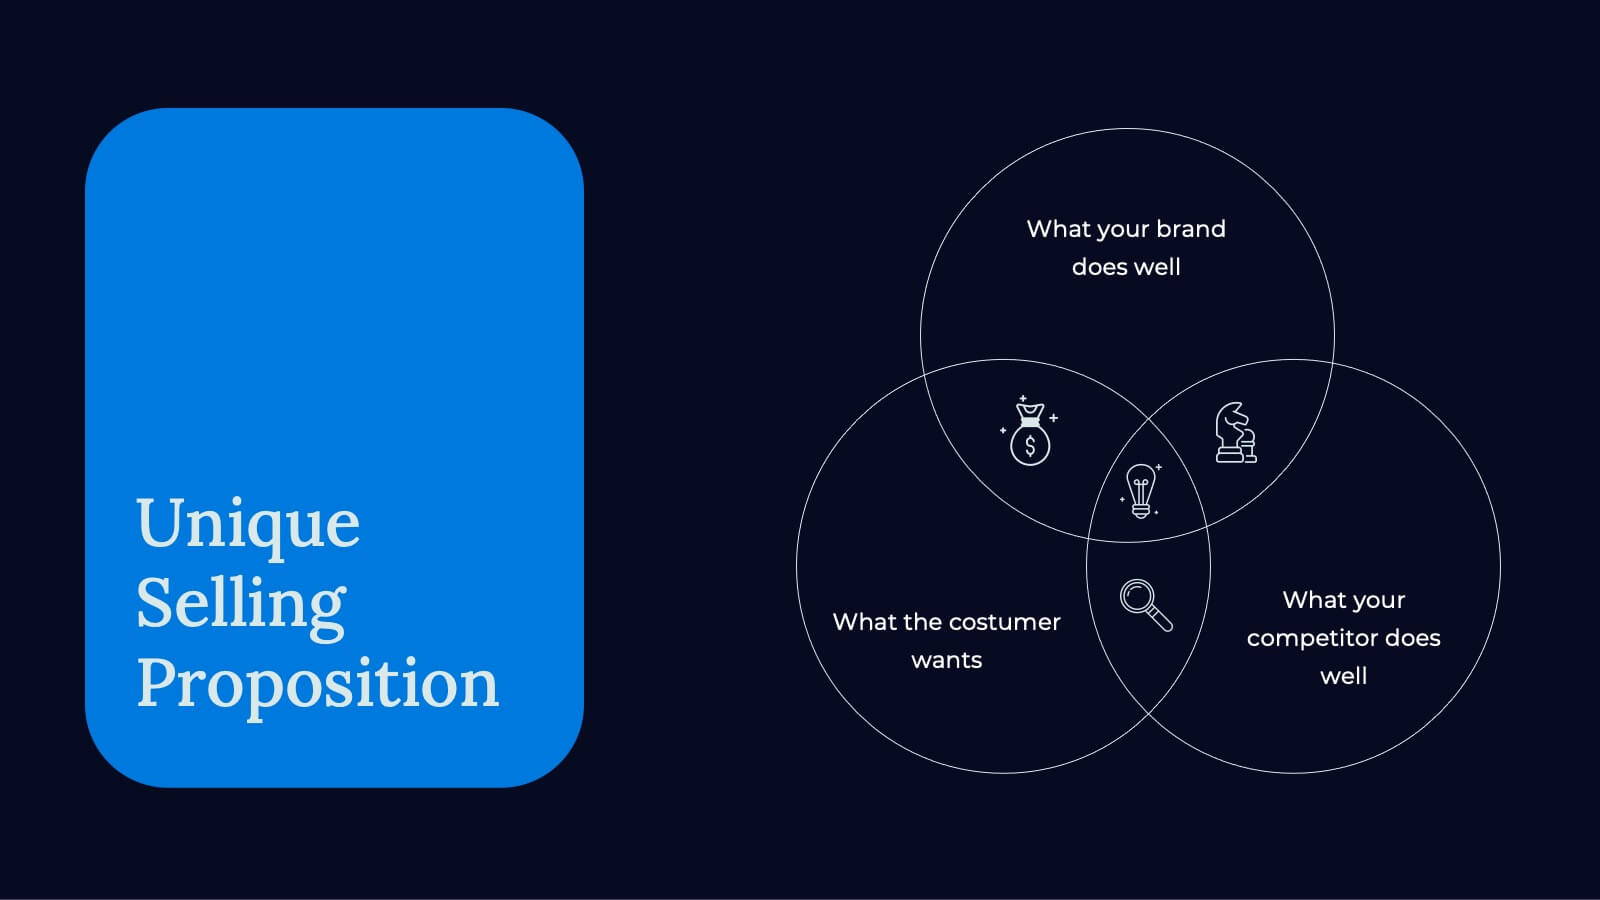
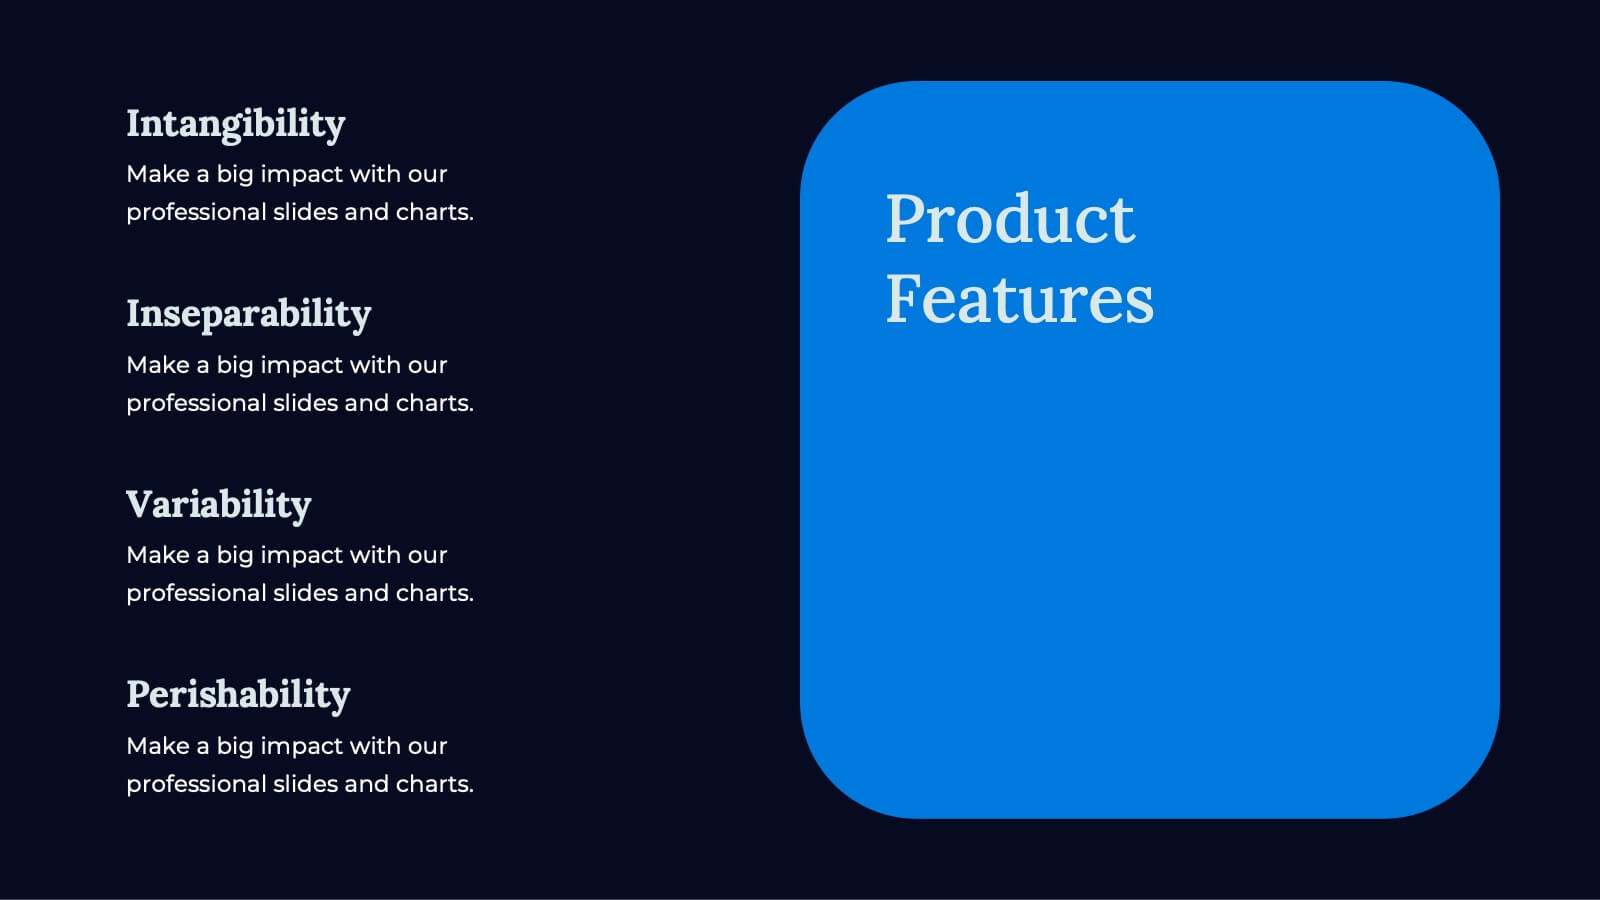
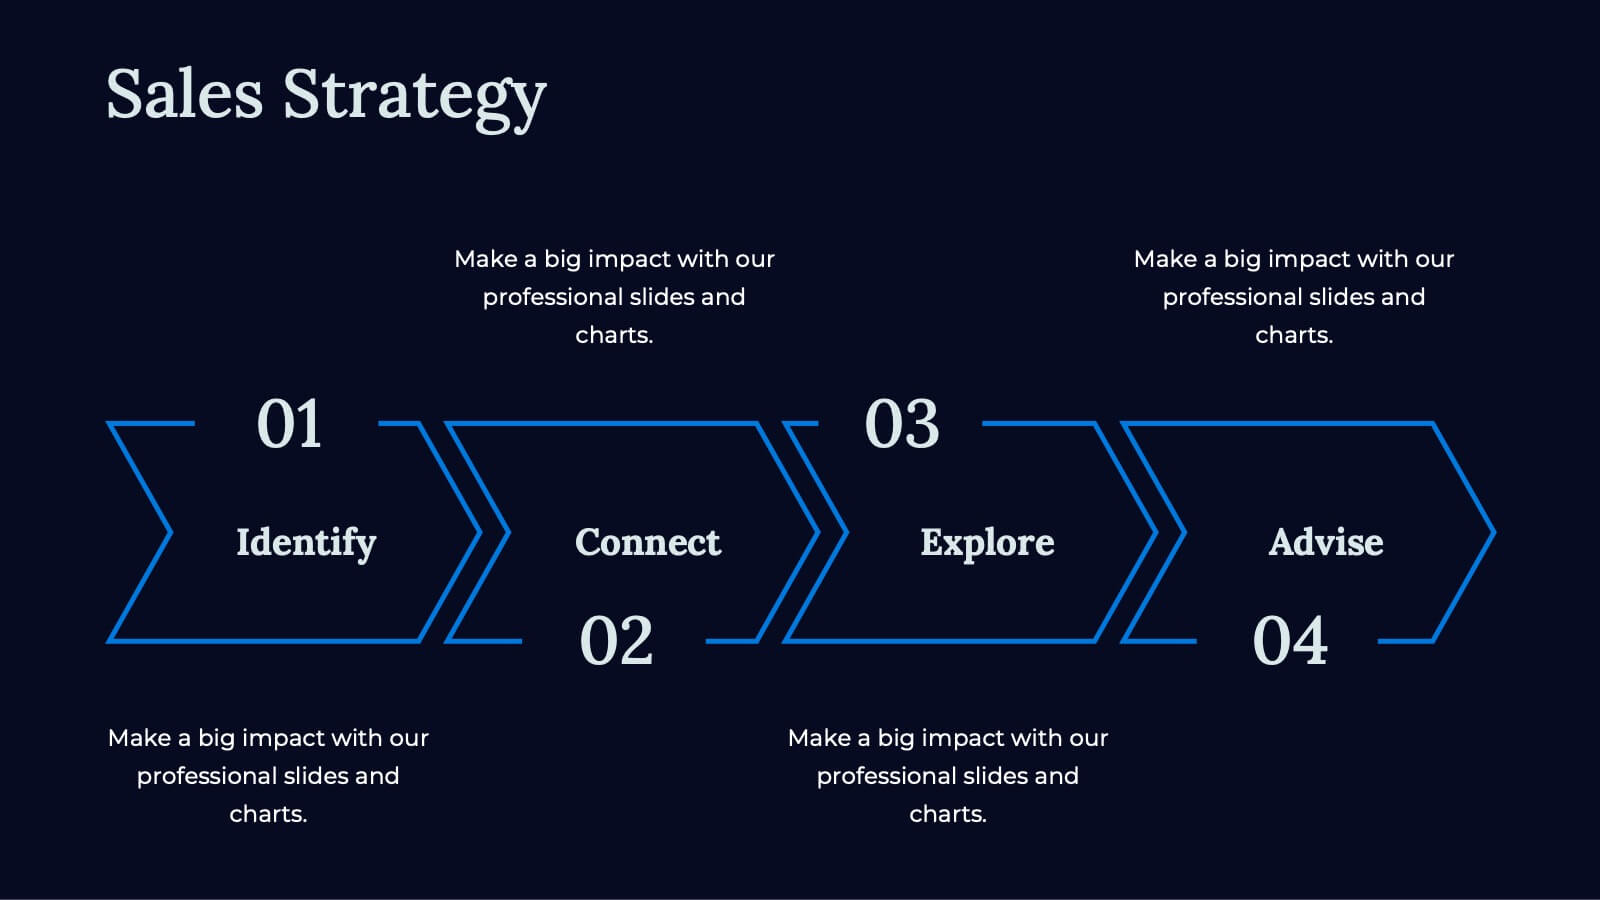
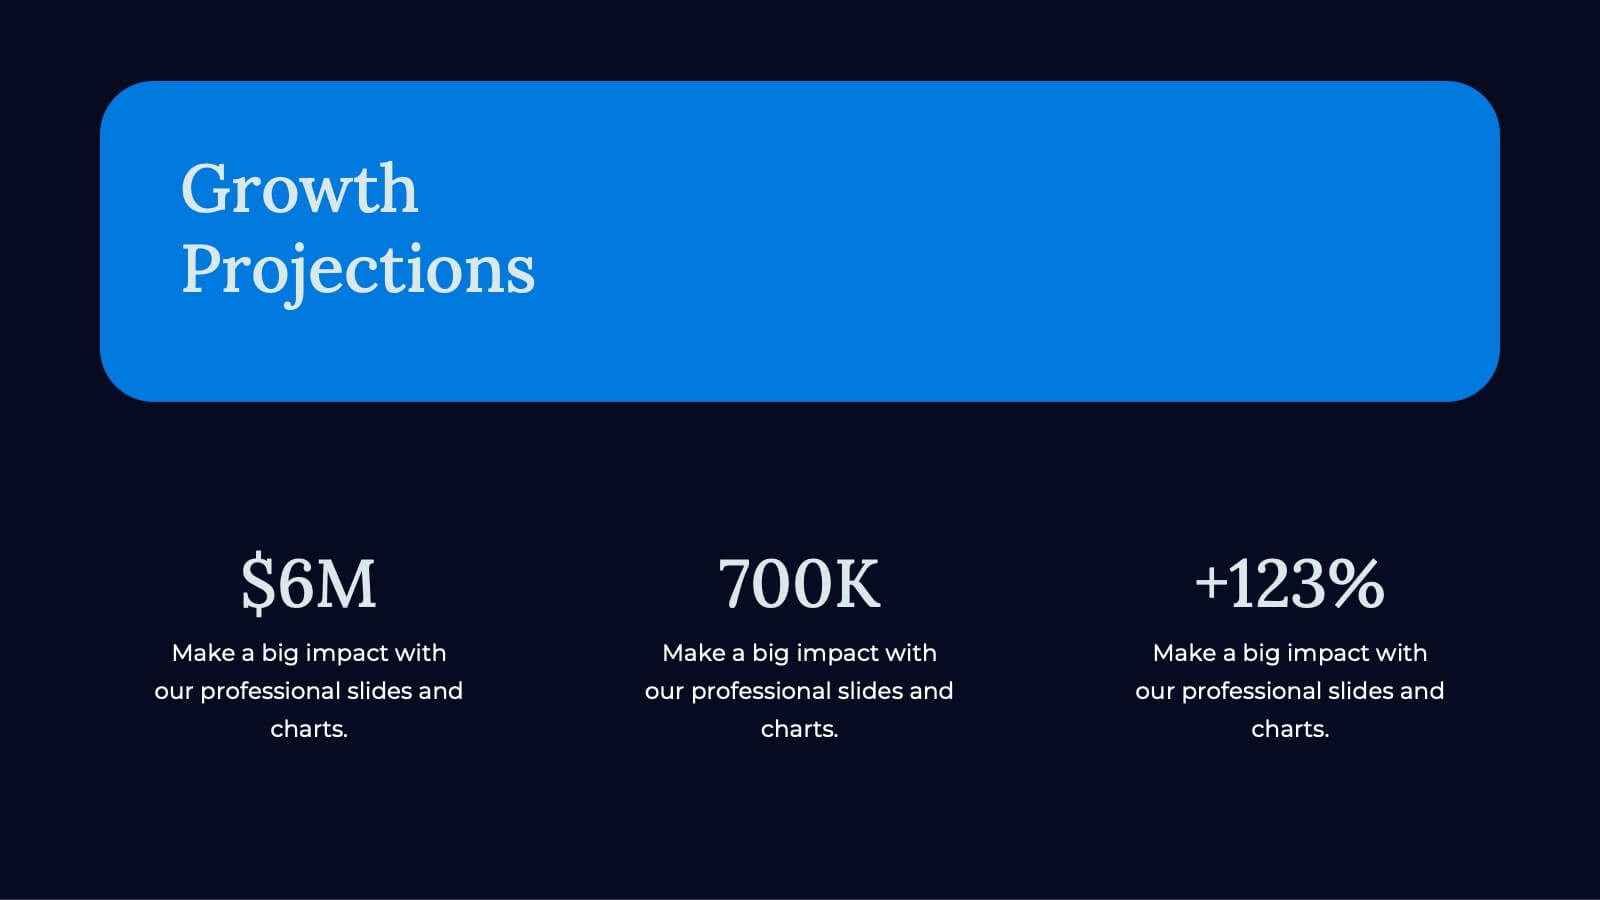
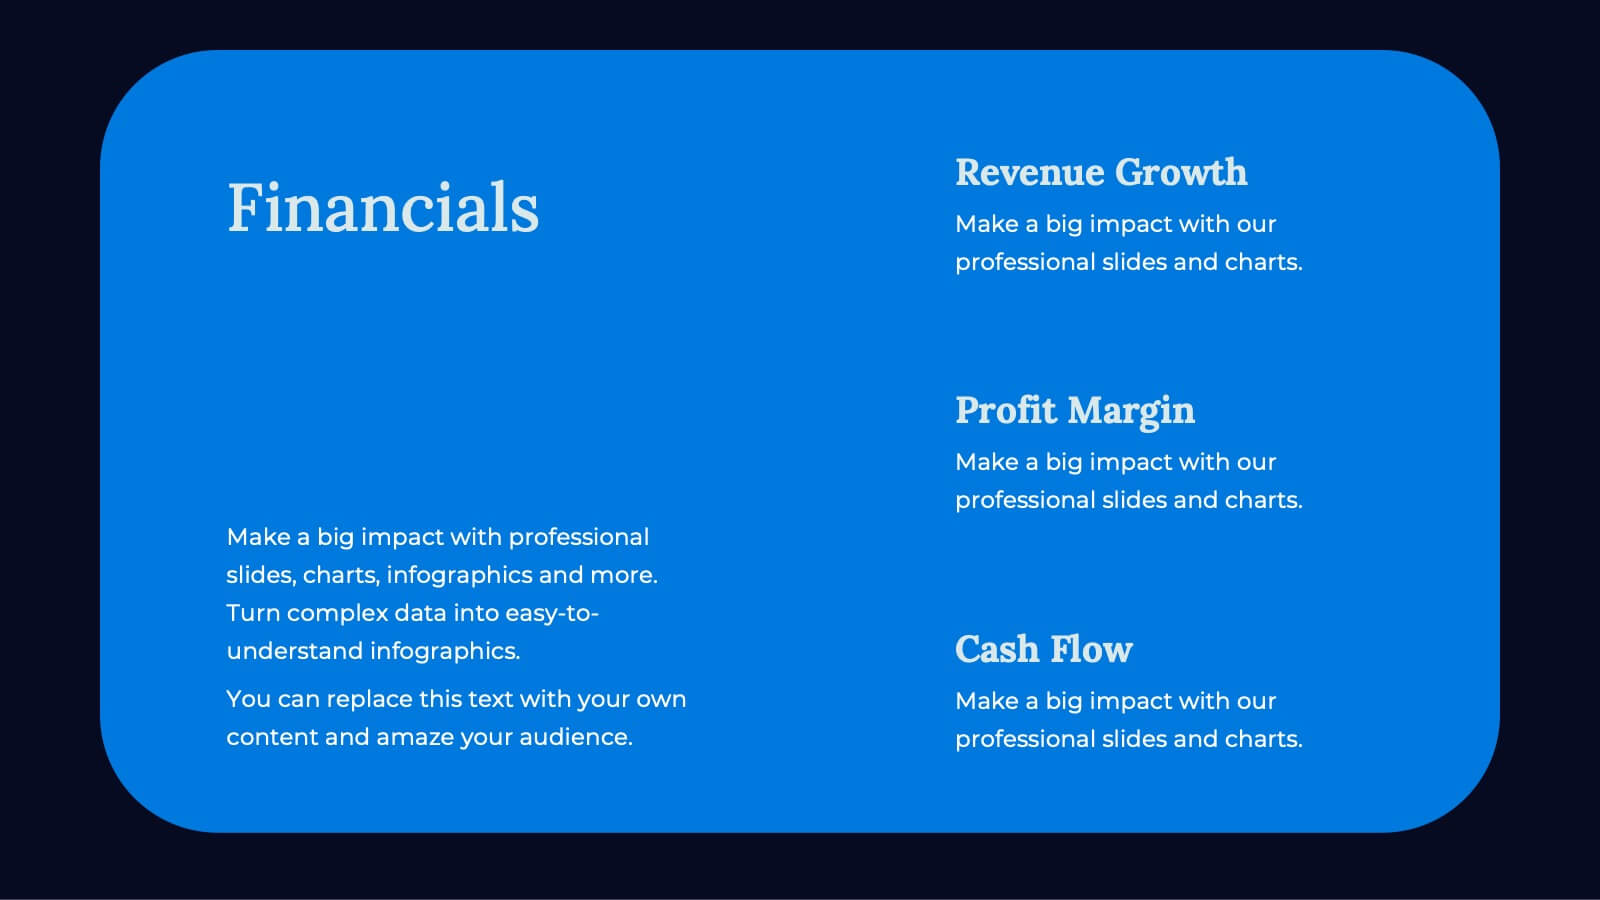
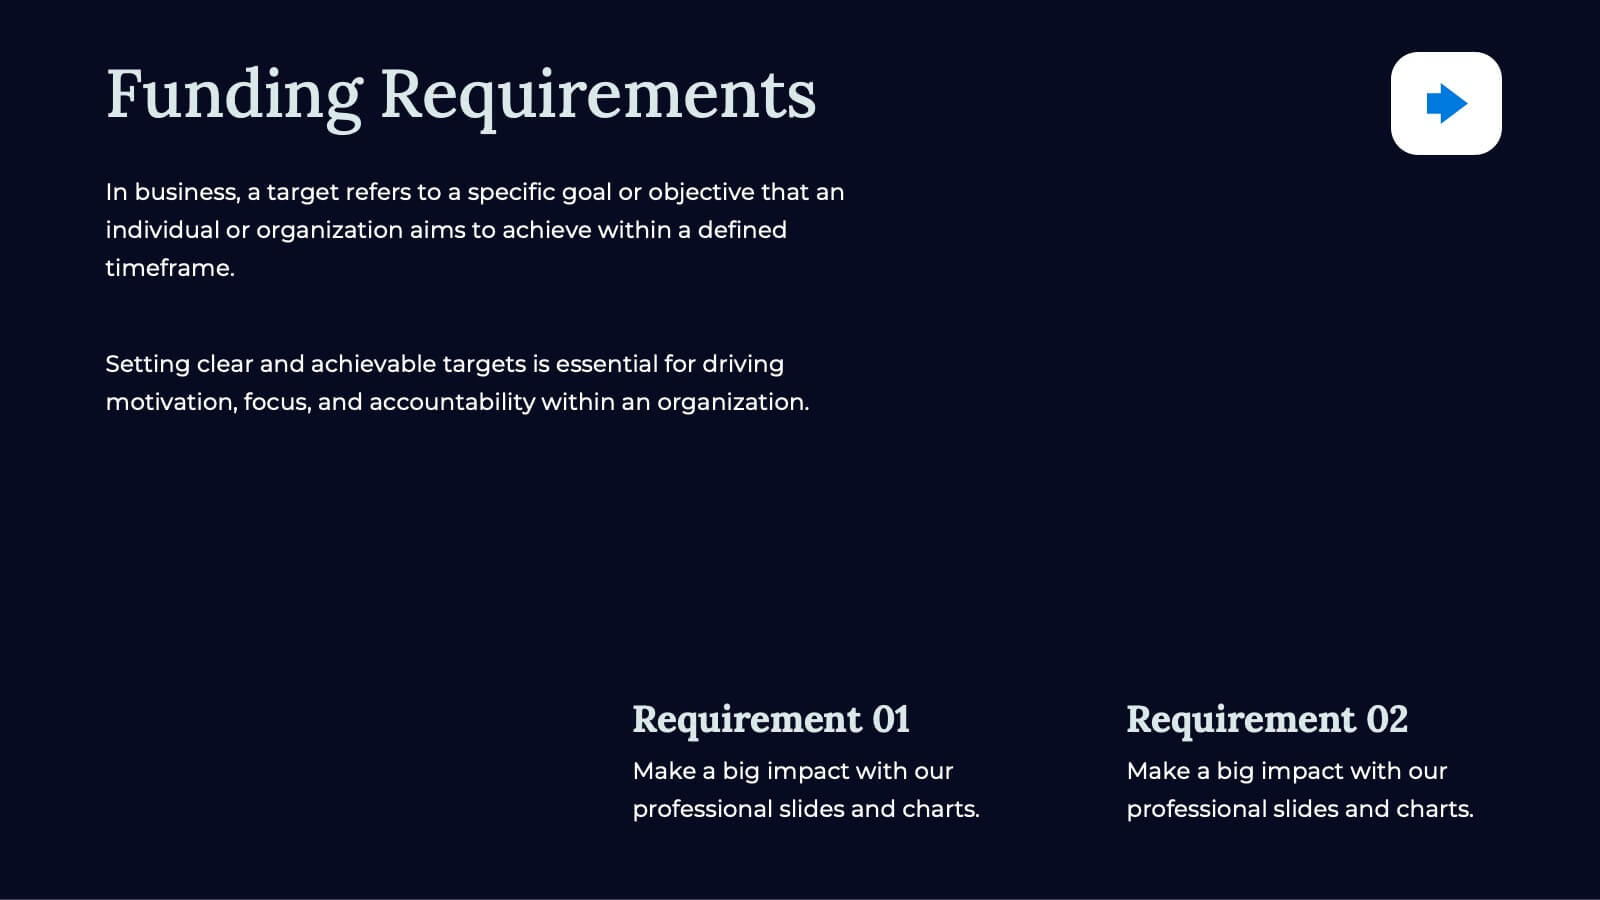
Apex Business Idea Pitch Deck Presentation
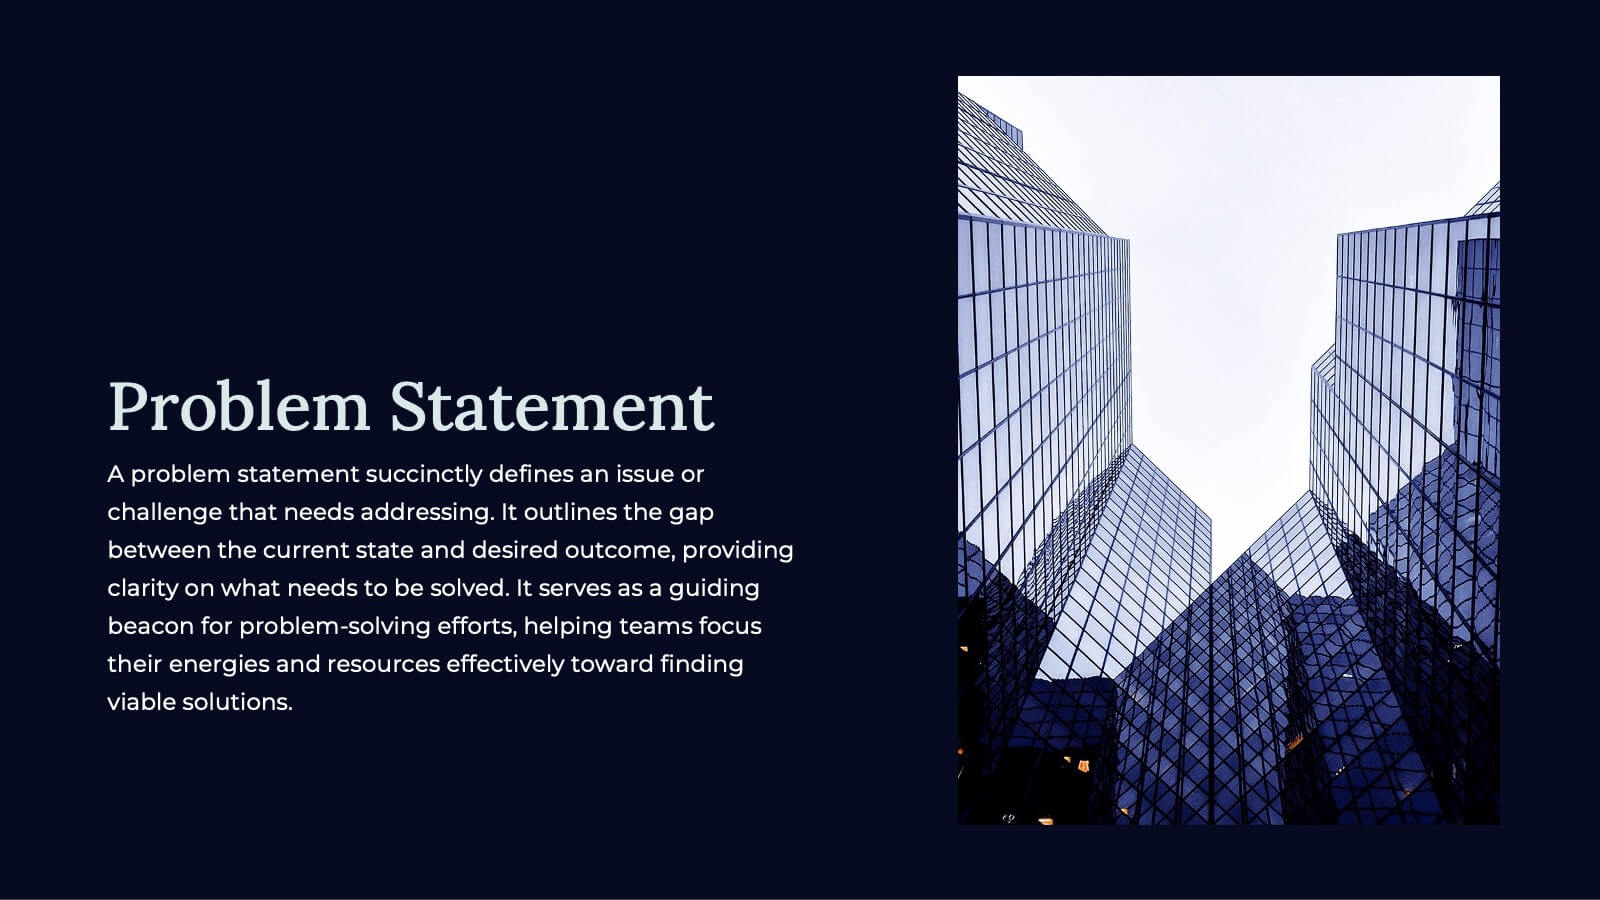
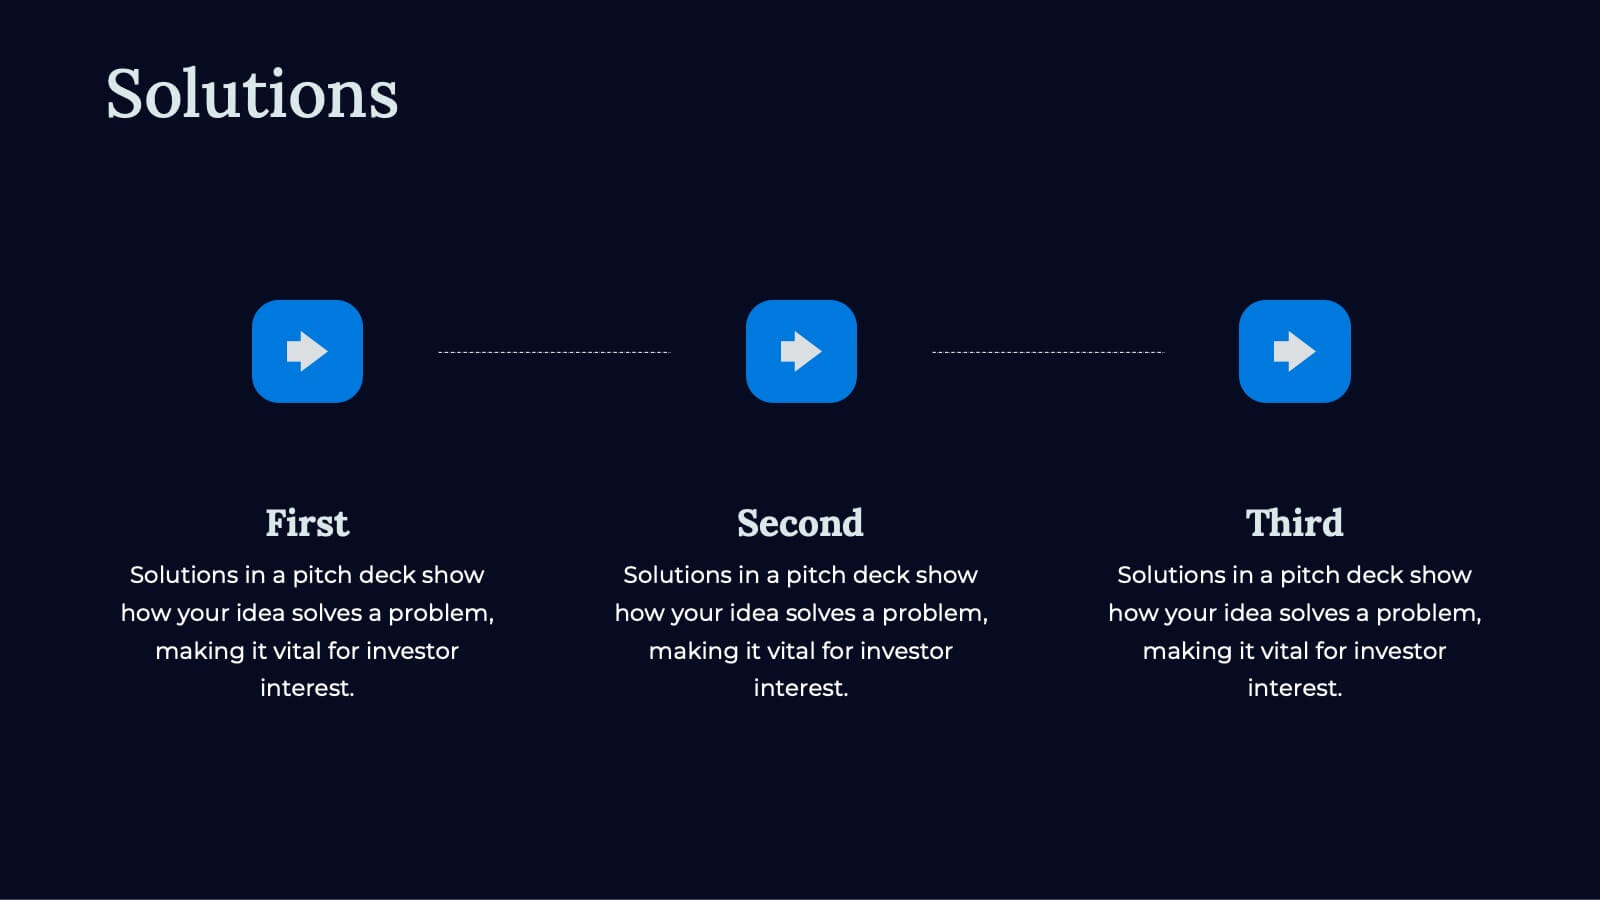
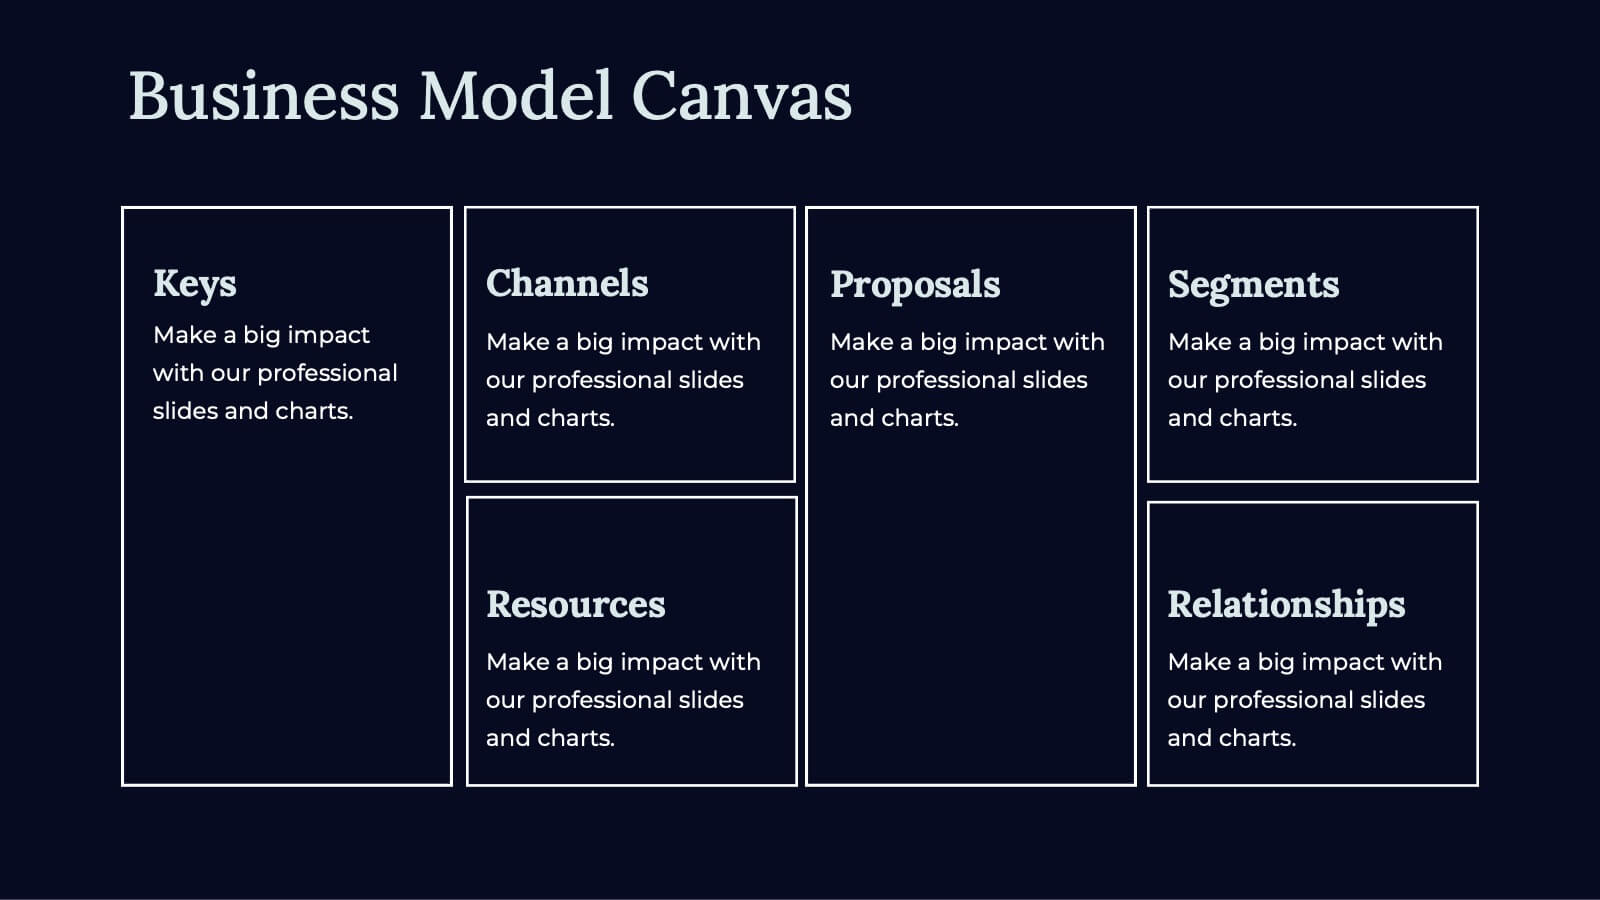
Craft powerful business pitch decks with this sleek template. Present your company overview, problem statement, solutions, and market opportunity. Showcase your business model, revenue model, competitive landscape, and unique selling proposition. Perfect for highlighting financials, growth projections, and funding requirements. Compatible with PowerPoint, Keynote, and Google Slides. Impress investors and stakeholders with clear, concise, and visually appealing presentations.


20 slides
Quasar Design Strategy Proposal Presentation
Elevate your design strategy presentations with this modern, engaging template. Perfect for showcasing design briefs, concept development, and project timelines, it features a sleek layout with a cohesive color scheme. Highlight key elements like typography, textures, and feedback processes to captivate your audience. Compatible with PowerPoint, Keynote, and Google Slides, it ensures seamless presentations on any platform.


4 slides
Regional Economic Analysis of Europe Map Presentation
Explore Europe's economy with the Regional Economic Analysis of Europe Map template, a streamlined presentation designed to showcase economic data and trends across the continent. Designed for clarity, it includes a customizable map and data bars for financial statistics. Ideal for PowerPoint presentations, it helps professionals highlight economic trends and investment opportunities in different European regions effectively.


8 slides
Risk Analysis Bowtie Diagram
Clarify your risk management strategy with the Risk Analysis Bowtie Diagram Presentation. This visual framework helps you analyze causes and consequences of a hazardous event using the bowtie model. The left side details potential causes and preventive controls, while the right outlines possible consequences and mitigating defenses. With bold "Before" and "After" labels, this slide makes complex risk pathways easy to understand. Fully editable in PowerPoint, Keynote, and Google Slides, with multiple highlighting variations to focus on either threats or outcomes.


4 slides
Sales Strategy 30-60-90 Day Plan
Accelerate your sales team’s performance with this 30-60-90 Day Strategy template. Designed with clean circular progress visuals and clear milestone stages, it helps you outline sales goals, track onboarding, and align strategic efforts. Ideal for new hires, quarterly planning, or sales enablement. Fully editable in PowerPoint, Keynote, and Google Slides.

1 slide
Professional Presentation Cover Slide Presentation
Make a bold first impression with this sleek and modern cover slide designed to introduce your presentation with confidence. Its clean layout and striking geometric shapes create a polished look while giving viewers a clear sense of professionalism. Perfect for business, marketing, or project presentations, and fully compatible with PowerPoint, Keynote, and Google Slides.


25 slides
Siren Rebranding Project Plan Presentation
This sleek brand presentation template covers essential elements like market analysis, brand guidelines, positioning, and audience insights. It's designed to showcase your brand identity and development strategies with a modern layout. Compatible with PowerPoint, Keynote, and Google Slides, it’s perfect for delivering professional and engaging brand presentations.


6 slides
Innovation Pipeline and Idea Execution
Streamline your innovation process with the Innovation Pipeline and Idea Execution Presentation. This clean, layered funnel layout is ideal for visualizing each stage from idea generation to implementation. Perfect for R&D teams, product managers, or corporate strategists, this slide is fully editable in PowerPoint, Keynote, and Google Slides.


7 slides
Creative Tree Diagram Infographic
Unveil hierarchical structures or processes with our evocative tree diagram infographic. Set against a pristine white canvas and enriched with shades of trusty blue and organic green, this creative template epitomizes growth, interconnections, and systematic understanding. Embellished with crisp infographics, intuitive icons, and illustrative image placeholders, it effortlessly visualizes layered information. Perfectly tailored for Powerpoint, Keynote, or Google Slides. An indispensable resource for project managers, educators, business analysts, or any organization aiming to display branching information or decisions. Grow with clarity; let each slide branch out into a wealth of understanding.