


Features
- 5 Unique slides
- Fully editable and easy to edit in Microsoft Powerpoint, Keynote and Google Slides
- 16:9 widescreen layout
- Clean and professional designs
- Export to JPG, PDF or send by email


Do you have any questions?
Recommend


22 slides
Gale Gust Financial Report Presentation
Unleash the power of your financial presentations with the Gale Gust Financial Report template! This sleek, modern design features a captivating black theme that radiates professionalism and confidence. The layout is meticulously structured to guide your audience through key highlights, performance metrics, sales performance, and financial summaries with ease. Each slide is designed to keep the focus on your data, with clean lines and a minimalist aesthetic that enhances readability and impact. Whether you're showcasing operational updates, market trends, or strategic initiatives, this template ensures that your content shines. Ideal for corporate meetings, investor updates, and financial reviews, this template is fully compatible with PowerPoint, Keynote, and Google Slides. The Gale Gust template is your perfect companion for delivering financial reports that command attention and leave a lasting impression. Get ready to make your numbers speak volumes!


5 slides
Patient Care and Hospital Management Presentation
Communicate critical aspects of Patient Care and Hospital Management with this structured presentation template. Featuring a unique IV-drip-inspired design, this layout visually represents the flow of healthcare processes, making it ideal for hospitals, medical institutions, and healthcare professionals. Use it to outline treatment protocols, patient management strategies, and operational workflows. Fully editable and compatible with PowerPoint, Keynote, and Google Slides for seamless customization.


8 slides
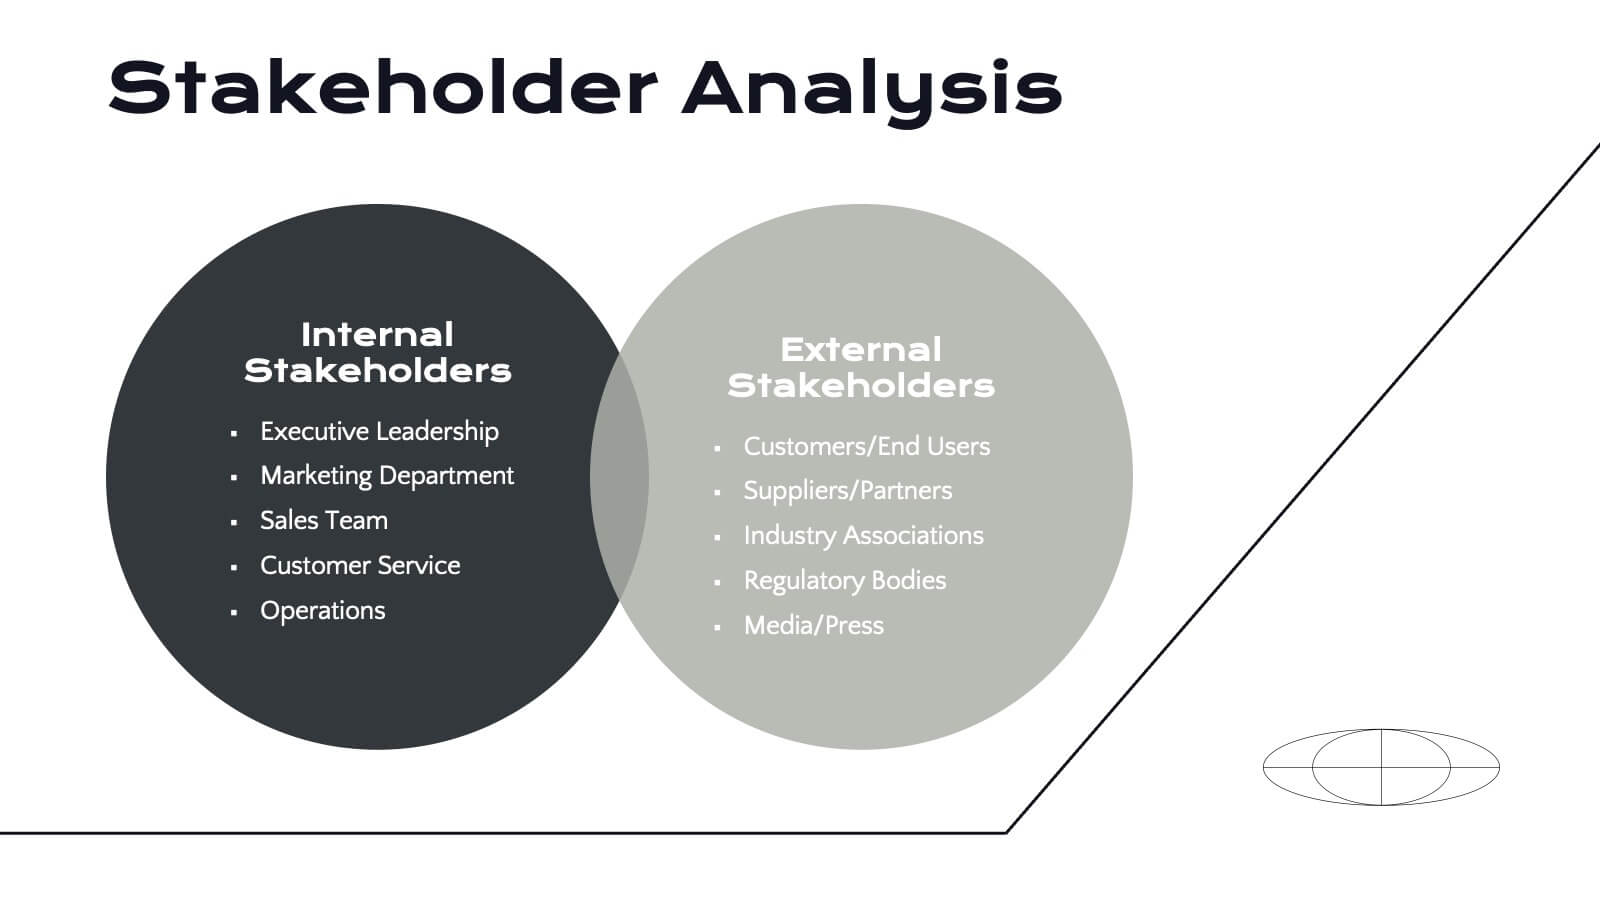
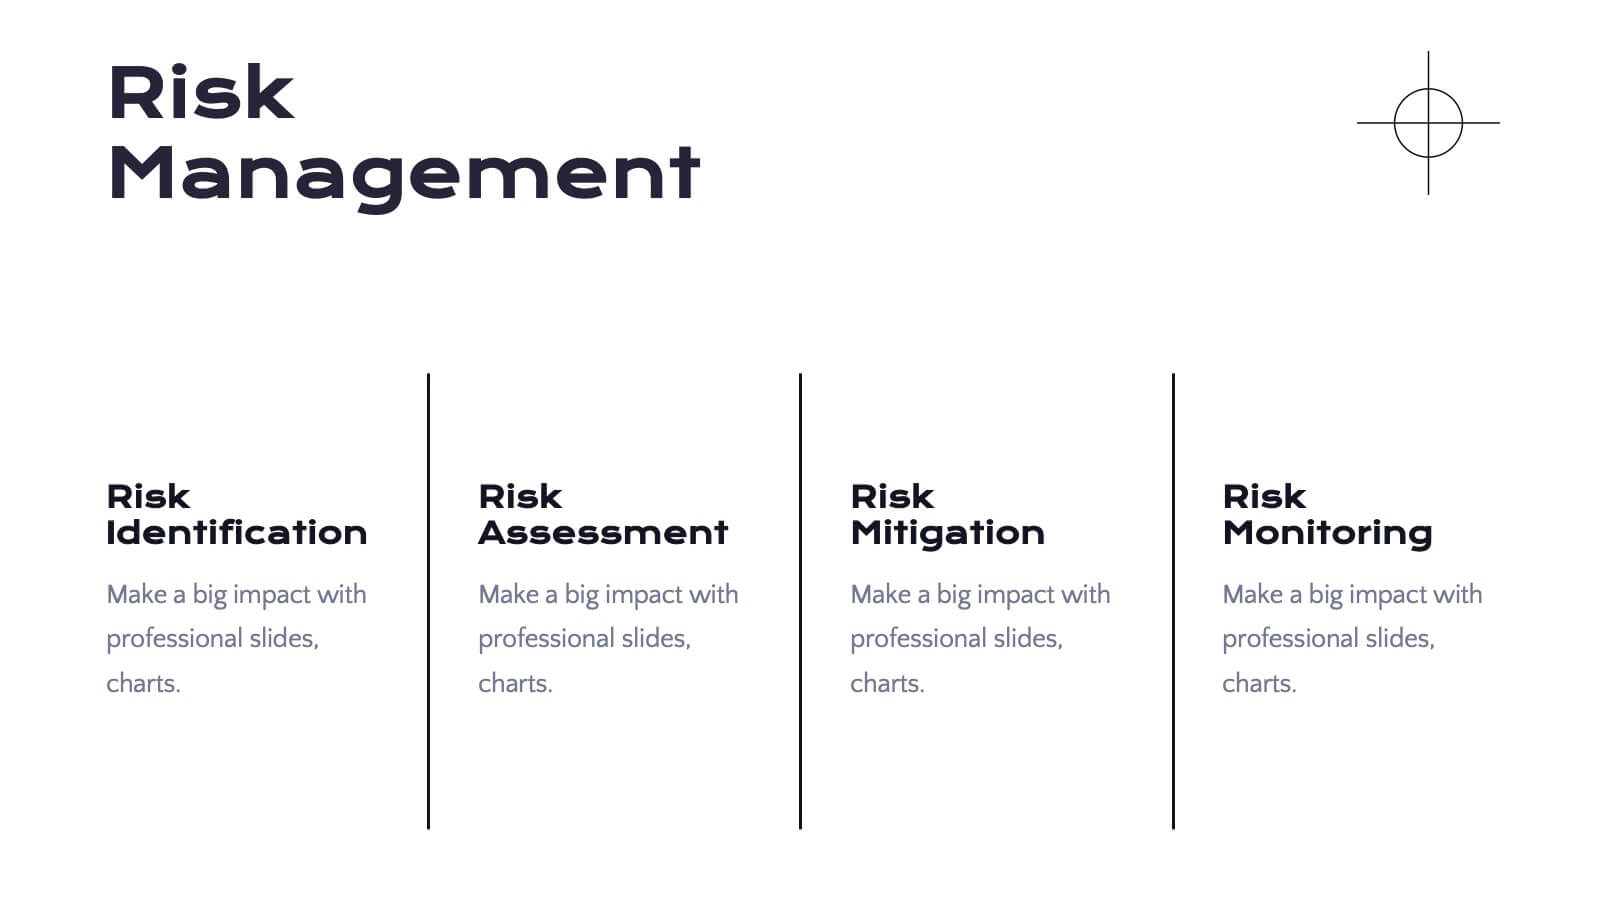
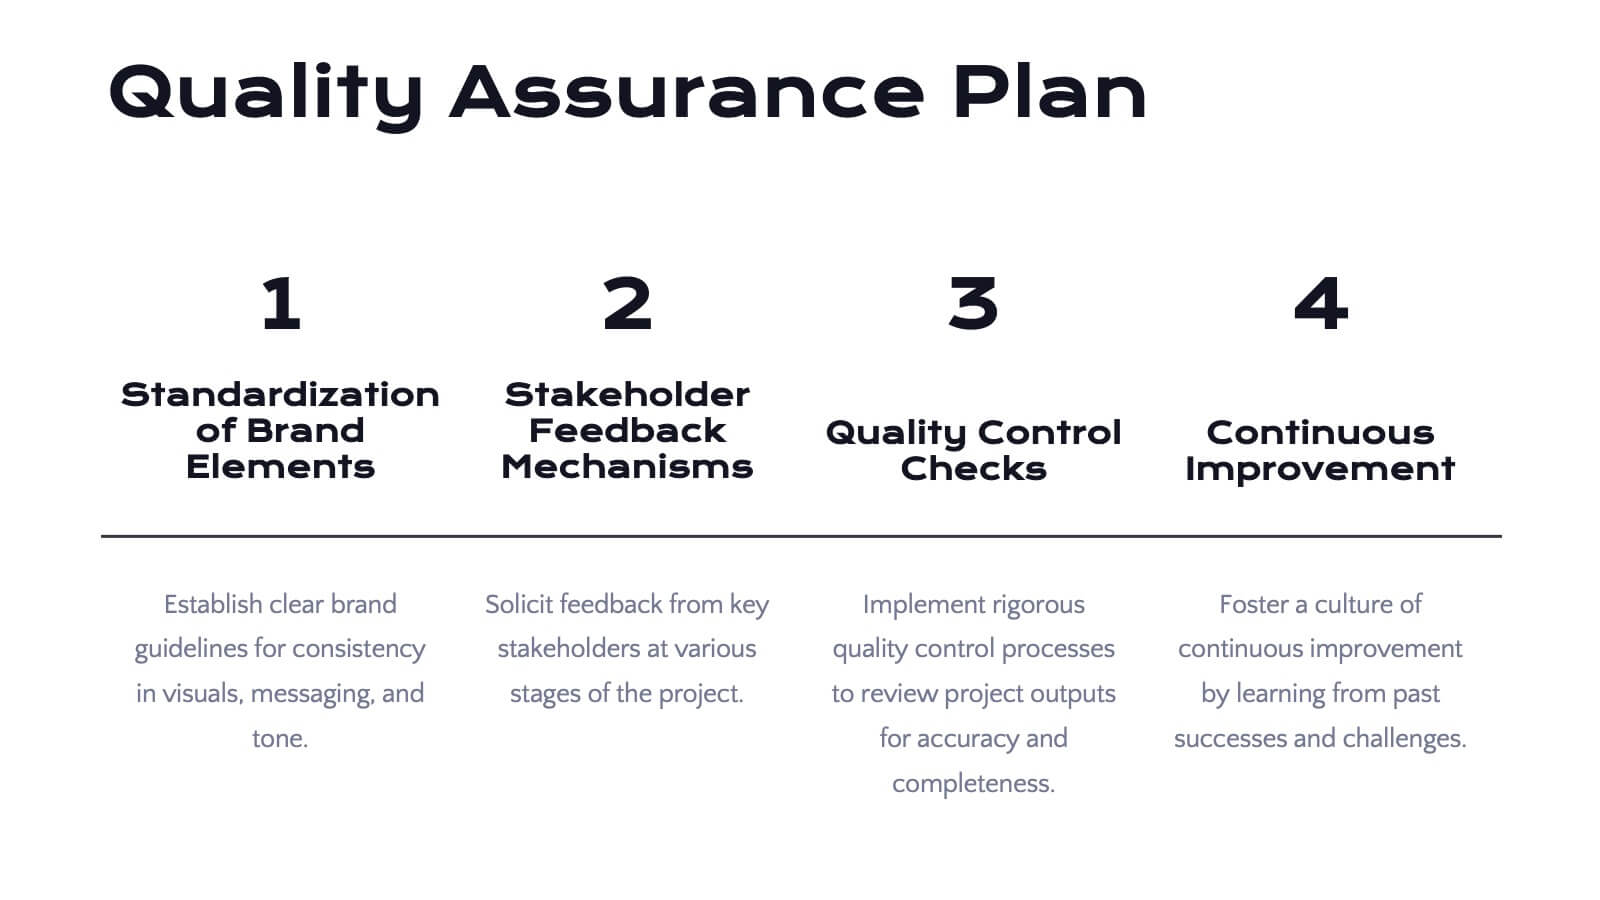
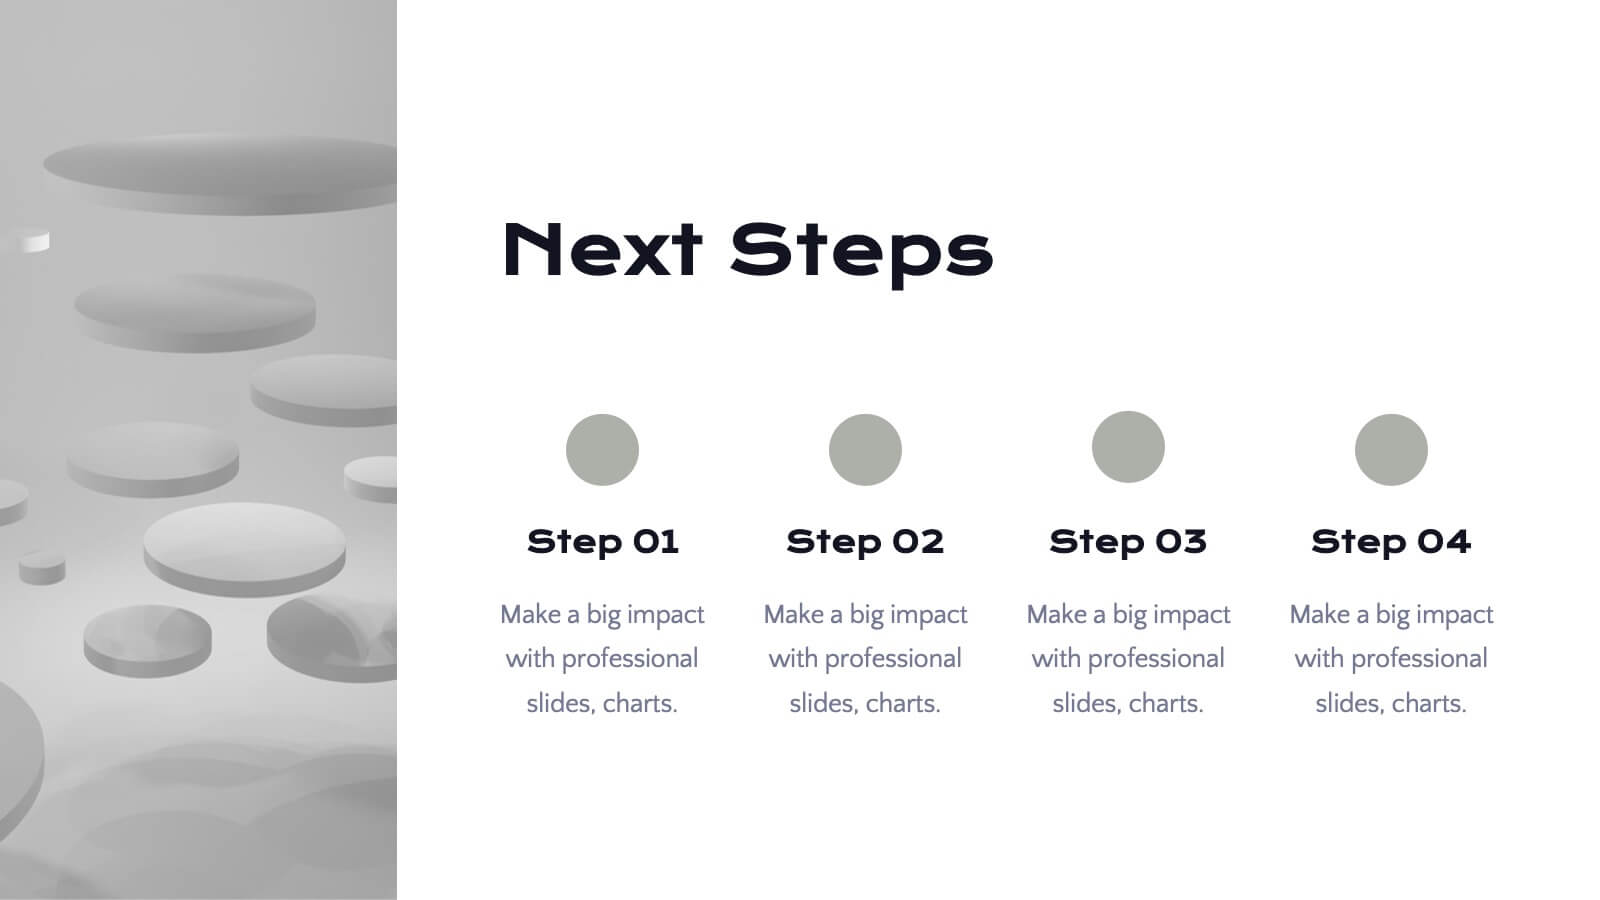
Corporate Risk Assessment and Planning Presentation
Navigate business uncertainties with the Corporate Risk Assessment and Planning template, offering a vivid and structured layout designed for professionals to meticulously detail and analyze potential risks in various business scenarios. It uses hexagonal and circular elements to emphasize the interconnectedness of various risk factors, supporting clear visualization and effective strategic planning. This template is compatible with PowerPoint, Keynote, and Google Slides, making it a versatile tool for comprehensive risk management presentations.


6 slides
McKinsey Strategy Implementation Model Presentation
Visualize organizational alignment with the McKinsey 7S Model slide. Featuring a clean circular layout, it highlights Strategy, Structure, Systems, Shared Values, Style, Staff, and Skills. Ideal for consulting, planning, or leadership presentations. Fully editable and compatible with PowerPoint, Google Slides, and Keynote for easy customization and branding.


7 slides
Customer Service Profile Infographic Presentation
A Customer Profile infographic is a visual representation of a target customer or customer segment that provides important information about their demographics, behavior, preferences, and needs. This template can help businesses and organizations understand their customers better, tailor their products or services to meet their needs, and develop effective marketing strategies. This template can be used for various purposes, such as to guide product development, to inform marketing campaigns, or to improve customer service. This template is compatible with Powerpoint, keynote and google slides.


21 slides
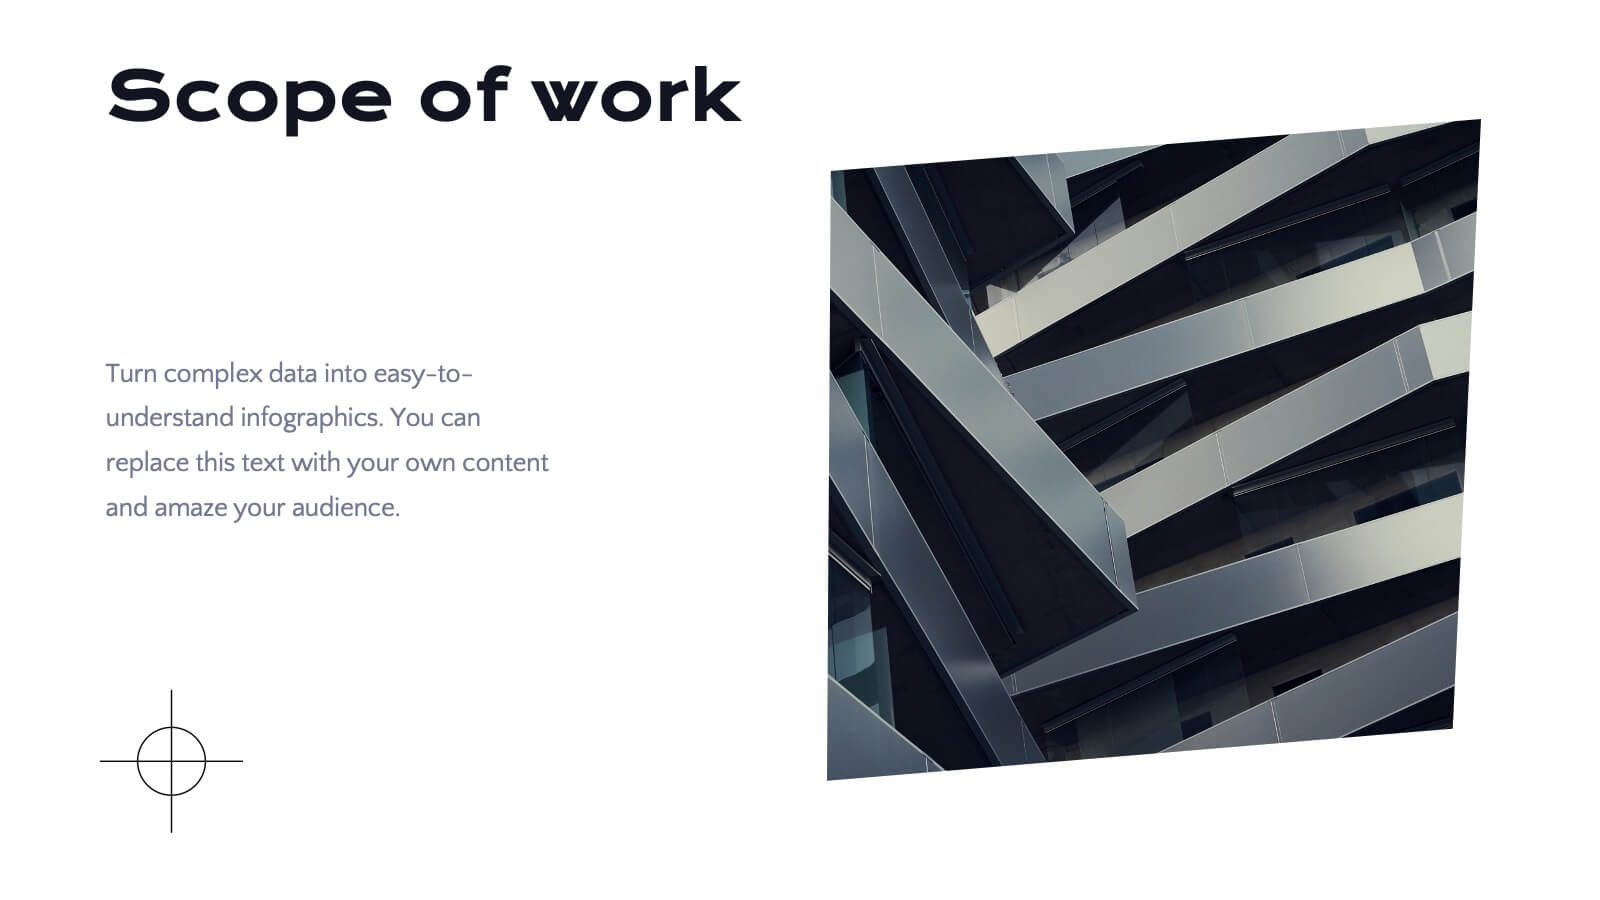
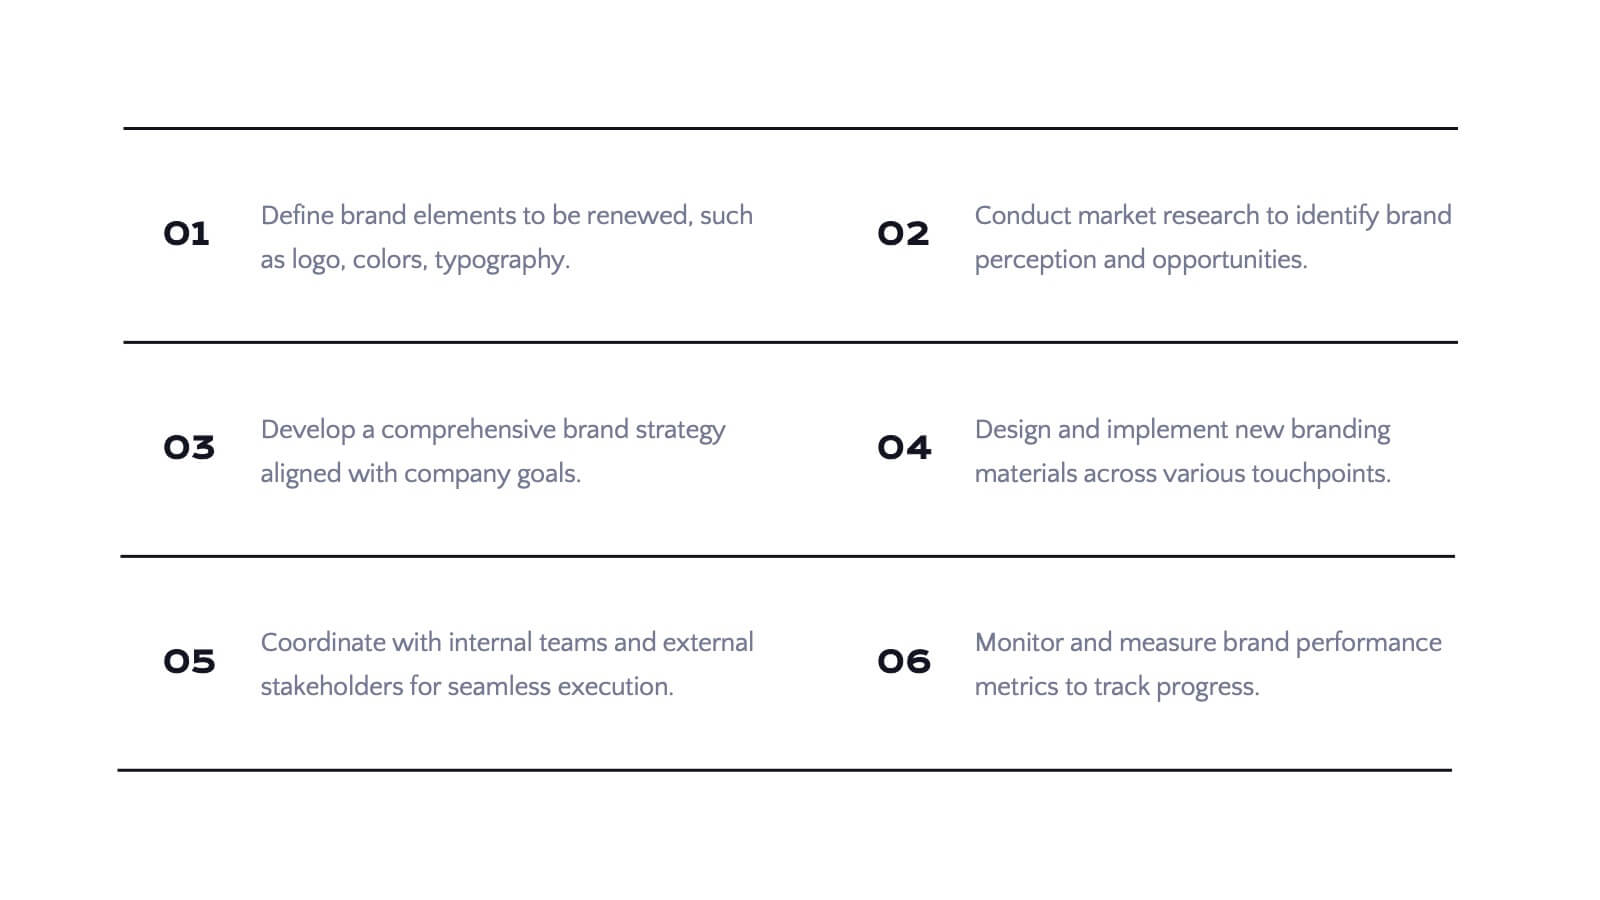
Tourmaline Project Proposal Presentation
This sleek design proposal template covers all essential sections like project summary, objectives, goals, and deliverables. With a modern and professional layout, it's perfect for presenting solutions and methodologies. Compatible with PowerPoint, Keynote, and Google Slides, it’s designed to impress clients and stakeholders with clear, structured information.


23 slides
Fama Business Idea Pitch Deck Presentation
Present your business idea with this impactful pitch deck, covering key areas like problem statement, solutions, competitive landscape, financials, and growth projections. With a bold design, it effectively showcases your startup’s value proposition. Compatible with PowerPoint, Keynote, and Google Slides for dynamic and professional investor presentations.


4 slides
Organizational Hierarchy Infographic
Showcase your team’s structure with a modern, photo-friendly hierarchy layout. This editable infographic is perfect for company overviews, team introductions, or org chart visualizations. Easily customizable in PowerPoint, Keynote, and Google Slides.


4 slides
Remote Learning Classroom Engagement Presentation
Make virtual classrooms more engaging with this clear, conversation-inspired visual. Designed for educators, trainers, and e-learning professionals, this infographic helps highlight interaction points, participation levels, or communication flows in remote learning. Easy to customize and fully compatible with PowerPoint, Keynote, and Google Slides.


7 slides
Home Buyer Checklist Infographic
Step into your dream home with confidence using our Home Buyer Checklist Infographic Template. This visually engaging guide is meticulously designed to streamline the home-buying process, making it transparent and manageable for first-time buyers and seasoned investors alike. This template provides a comprehensive checklist that covers every important aspect of home buying, from budgeting and financing to inspecting and closing. Its intuitive layout and vibrant design elements make complex tasks approachable and easy to understand, ensuring you don’t miss a beat on your journey to homeownership. Tailor each slide to your specific needs by customizing colors, text, and graphics to reflect your personal style or brand identity. Ideal for real estate agents, mortgage advisors, and educational workshops, this template empowers users to navigate the maze of real estate transactions with ease and assurance.


6 slides
Social Challenges Infographics
Address social challenges effectively with our Social Challenge infographic template. This template is fully compatible with popular presentation software like PowerPoint, Keynote, and Google Slides, allowing you to easily customize it to illustrate and communicate various social challenges and their solutions. The Social Challenge infographic template offers a visually engaging platform to outline the nature of social issues, their impact on communities, and strategies for addressing them. Whether you're an advocate, nonprofit organization, community leader, or simply interested in making a positive impact, this template provides a user-friendly canvas to create informative presentations and educational materials. Raise awareness and promote solutions with this SEO-optimized Social Challenge infographic template, thoughtfully designed for clarity and ease of use. Customize it to showcase specific social challenges, statistics, success stories, and calls to action, ensuring that your audience gains a comprehensive understanding of the issue at hand. Start crafting your personalized infographic today to contribute to positive change in society.


6 slides
Food Market Infographic
The food market refers to the industry and marketplace where various food products are produced, processed, distributed, and sold to consumers. This infographic template is designed to provide insights into the food market industry. This aims to showcase key trends, statistics, and market dynamics related to the global food market. Whether used in presentations, reports, or educational material, this infographic will help your audience gain insights into the market, identify growth opportunities, and make informed decisions in the food industry. Compatible with Powerpoint, Keynote, and Google Slides.


21 slides
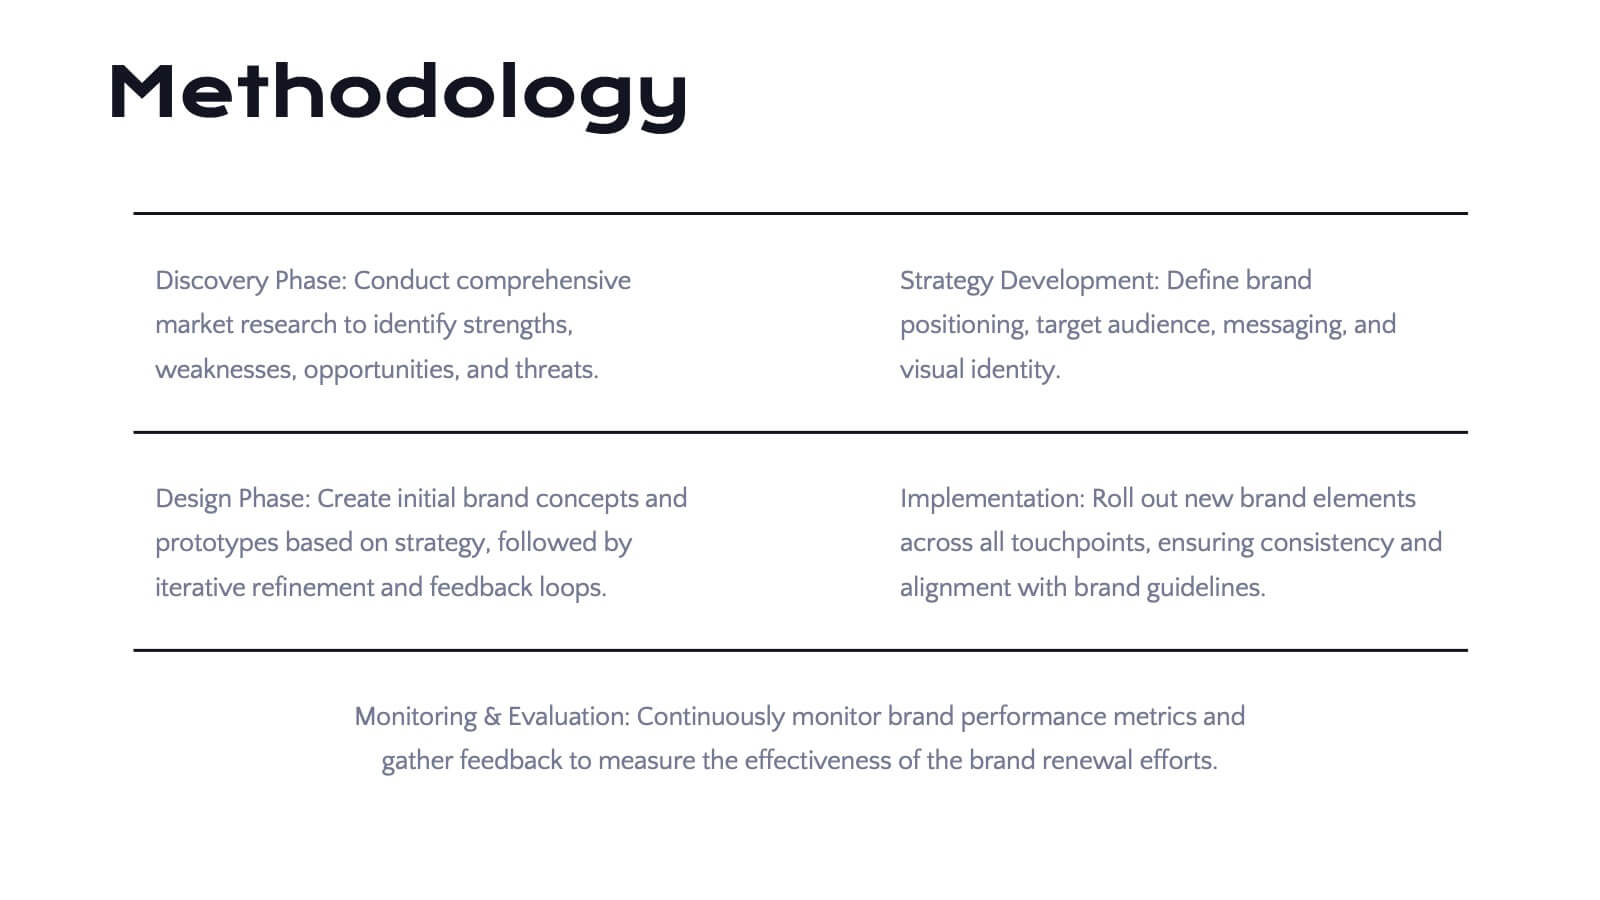
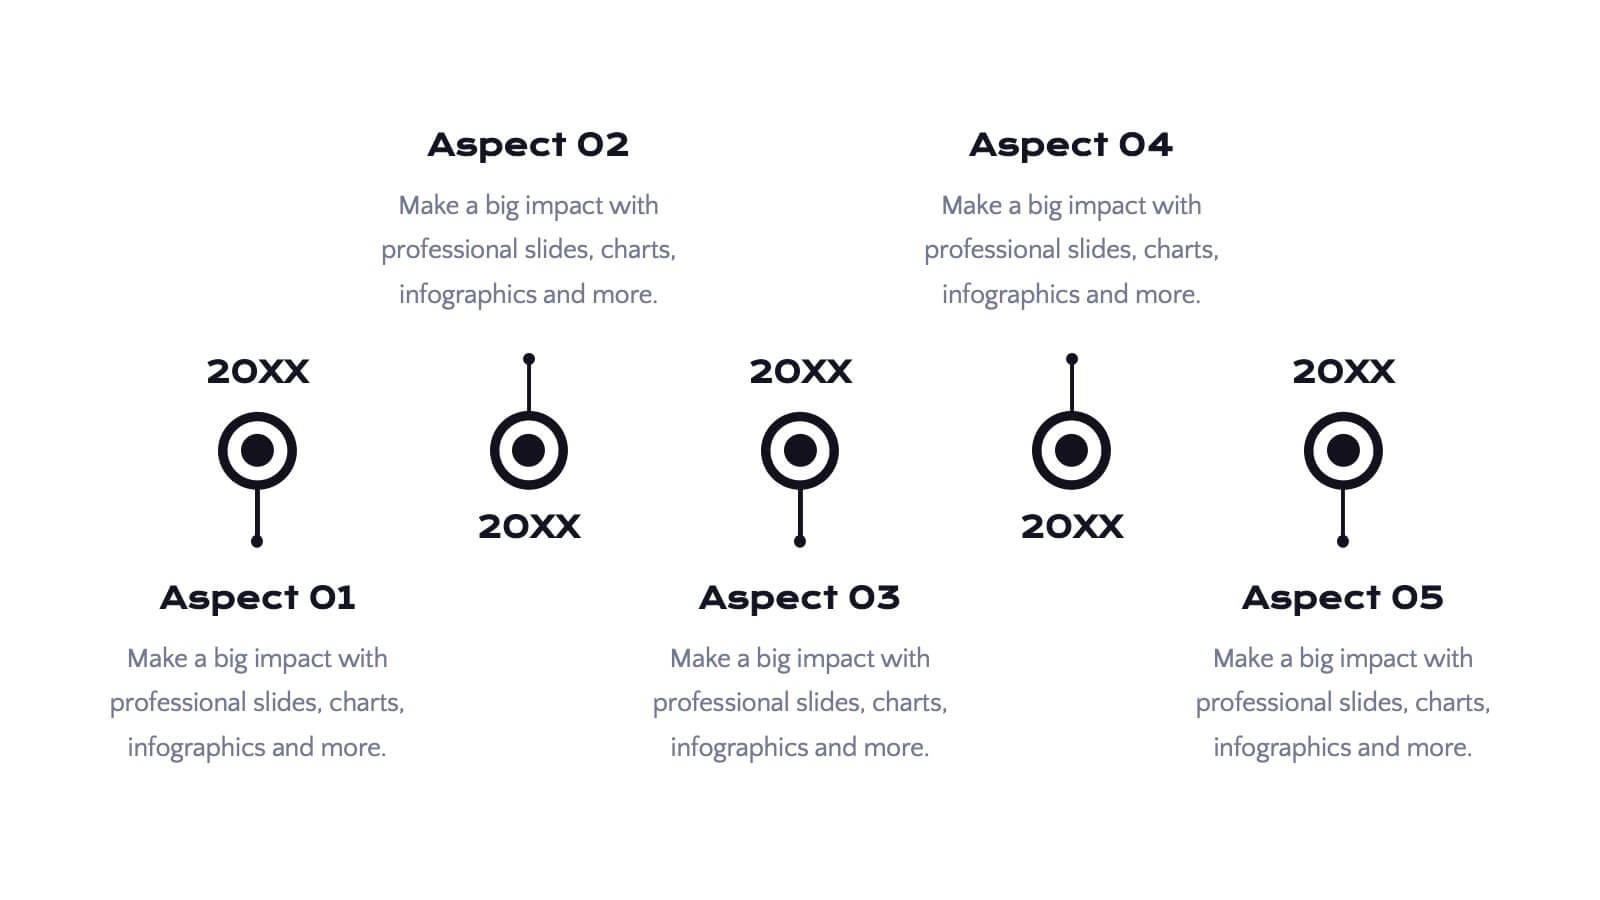
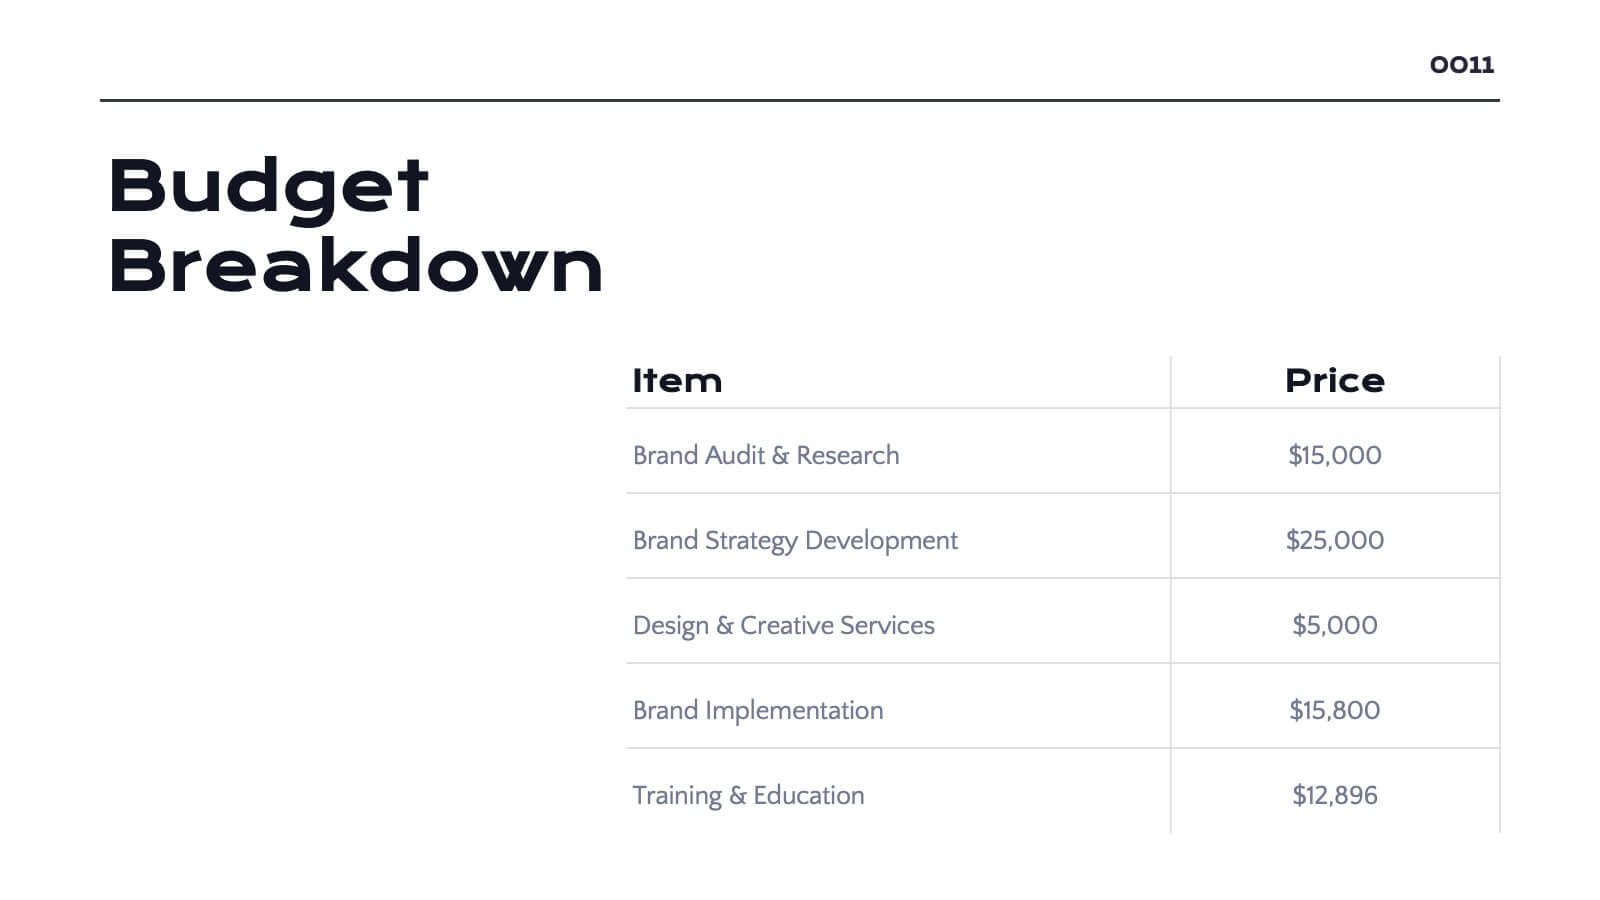
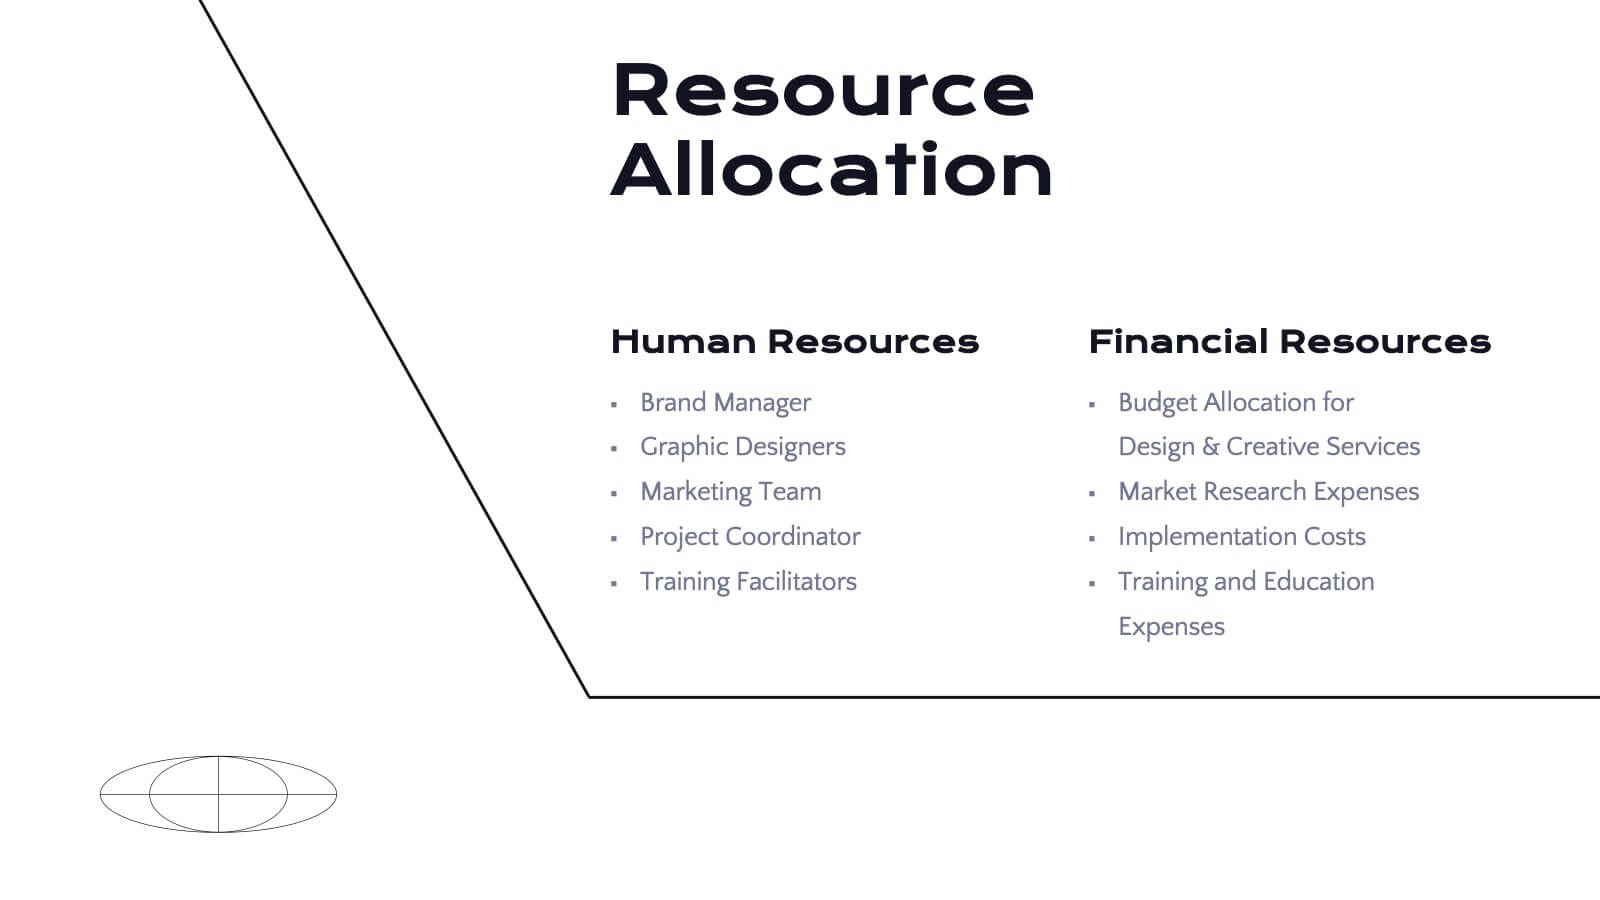
Radiance Detailed Project Execution Plan Presentation
Elevate your project execution presentations with this sleek template, covering everything from objectives to timelines and budget breakdowns. It's perfect for aligning your team and stakeholders. Compatible with PowerPoint, Keynote, and Google Slides, it ensures professionalism and clarity in showcasing your project plans.


10 slides
Search Engine Optimization (SEO) Strategy Presentation
Present your digital marketing plan with clarity using this vibrant SEO strategy layout. Featuring a magnifying glass infographic at the center and five segmented areas for key actions, this template is ideal for mapping keyword research, on-page optimization, content creation, link building, and performance tracking. Great for marketing agencies, SEO consultants, and website owners. Fully editable in PowerPoint, Keynote, and Google Slides.


21 slides
Ember Echo Graphic Design Project Plan Presentation
The Ember Graphic Design Project Plan template is the perfect canvas for your creative journey! Kickstart your project with a sleek and professional introduction that sets the tone for your design vision. This template is designed to guide you through every step of the design process, from the initial brief to the final presentation. Highlight your target audience, concept development, and design elements with beautifully crafted slides that capture the essence of your project. Dive into the specifics with dedicated sections for brand identity components, textures, and the design process itself, ensuring that every detail is covered. The template also includes mood boards, prototypes, and design assets, making it easy to showcase your work in progress. With feedback and testing slides, you can iterate and refine your designs before presenting the final product. This template is fully compatible with PowerPoint, Keynote, and Google Slides, making it versatile and easy to use for any creative project.


5 slides
Scientific Research Presentation
Break down complex processes with clarity using this Scientific Research Presentation Template. Featuring a modern lab flask visual segmented into four stages, it’s perfect for illustrating experimental phases, research progress, or scientific data. Ideal for educators, researchers, and science-based companies. Fully compatible with PowerPoint, Keynote, and Google Slides for effortless editing.


7 slides
5G Advantages Infographic
Explore the power of 5G with this engaging infographic template, designed to clearly showcase the technology's many benefits. Ideal for educators, tech enthusiasts, and professionals, it highlights how 5G enhances connectivity, speeds up data transfer, and supports innovations like smart cities and IoT devices. With vibrant graphics and simple explanations, it makes complex concepts easy to understand. Use this tool in classrooms, workshops, or online to educate and inspire others about 5G's transformative impact on industries like healthcare, entertainment, and finance. Discover the future of technology and how 5G is making it happen today!