


Features
- 6 Unique slides
- Fully editable and easy to edit in Microsoft Powerpoint, Keynote and Google Slides
- 16:9 widescreen layout
- Clean and professional designs
- Export to JPG, PDF or send by email


Do you have any questions?
Recommend


7 slides
Value Chain Business Infographic
The value chain is a concept used in business management to describe the full range of activities that businesses go through to bring a product or service from conception to delivery to customers. This infographic template is designed to showcase the various activities and processes that add value to your product or service, enlightening your audience about the holistic journey from start to finish. Compatible with Powerpoint, Keynote, and Google Slides. Present a visual representation of a value chain analysis, emphasizing the importance of evaluating each activity's contribution to the overall value.


4 slides
Mobile and Laptop Mockup Devices
Present your digital products with style using this modern mockup slide. Featuring a realistic laptop and smartphone duo, this layout is perfect for showcasing websites, apps, or UI designs. Fully editable in PowerPoint, Keynote, and Google Slides—customize text, colors, and layout with ease.


27 slides
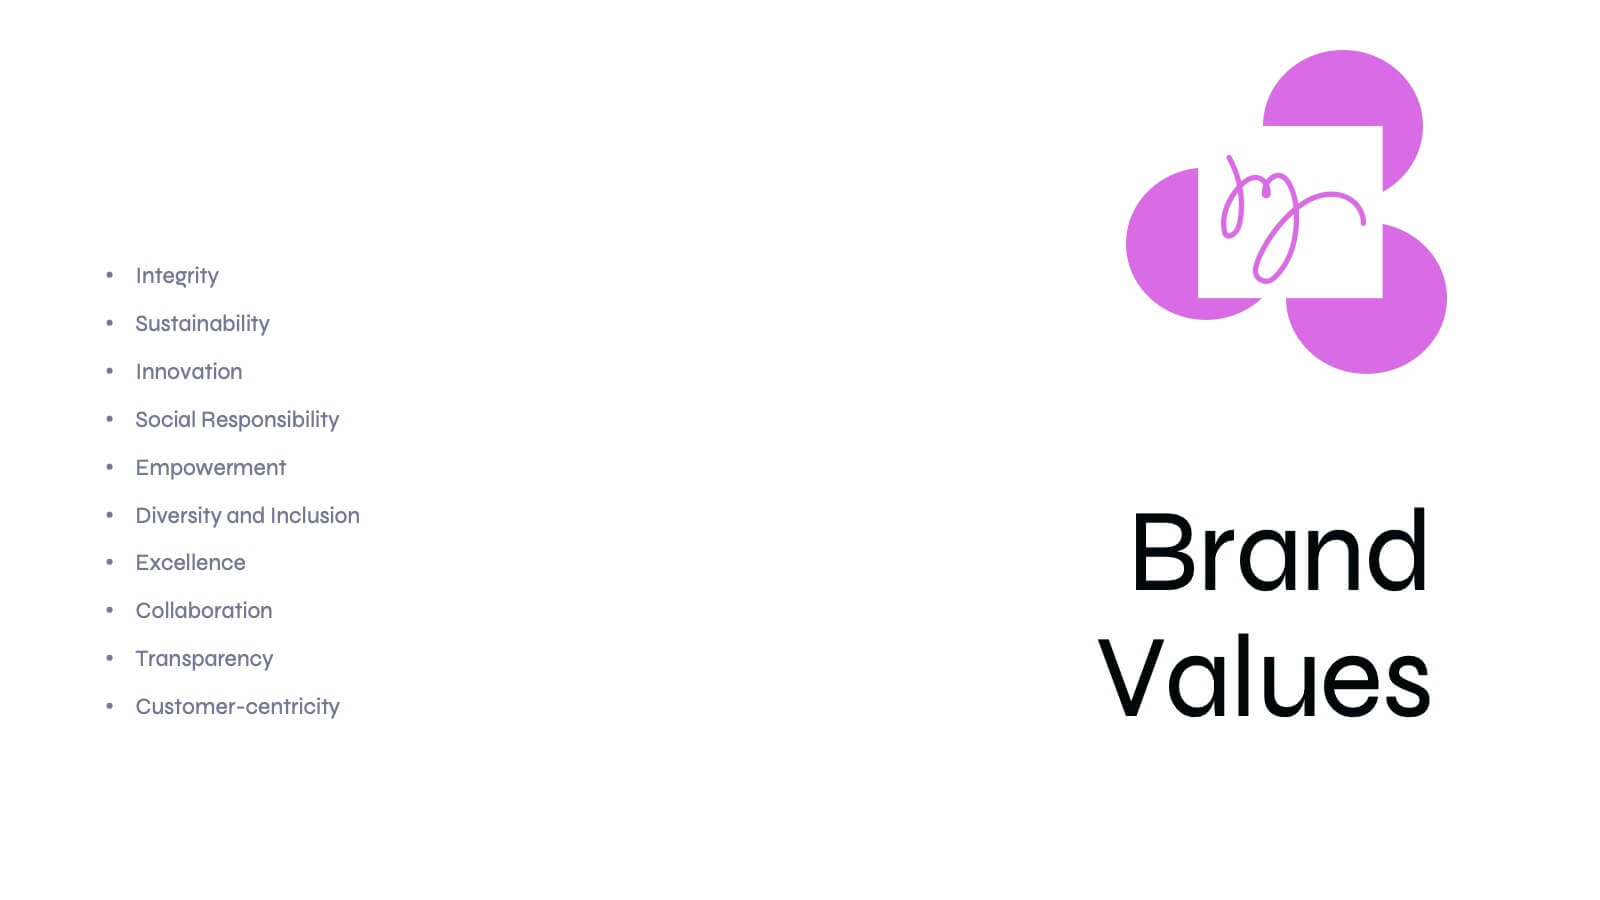
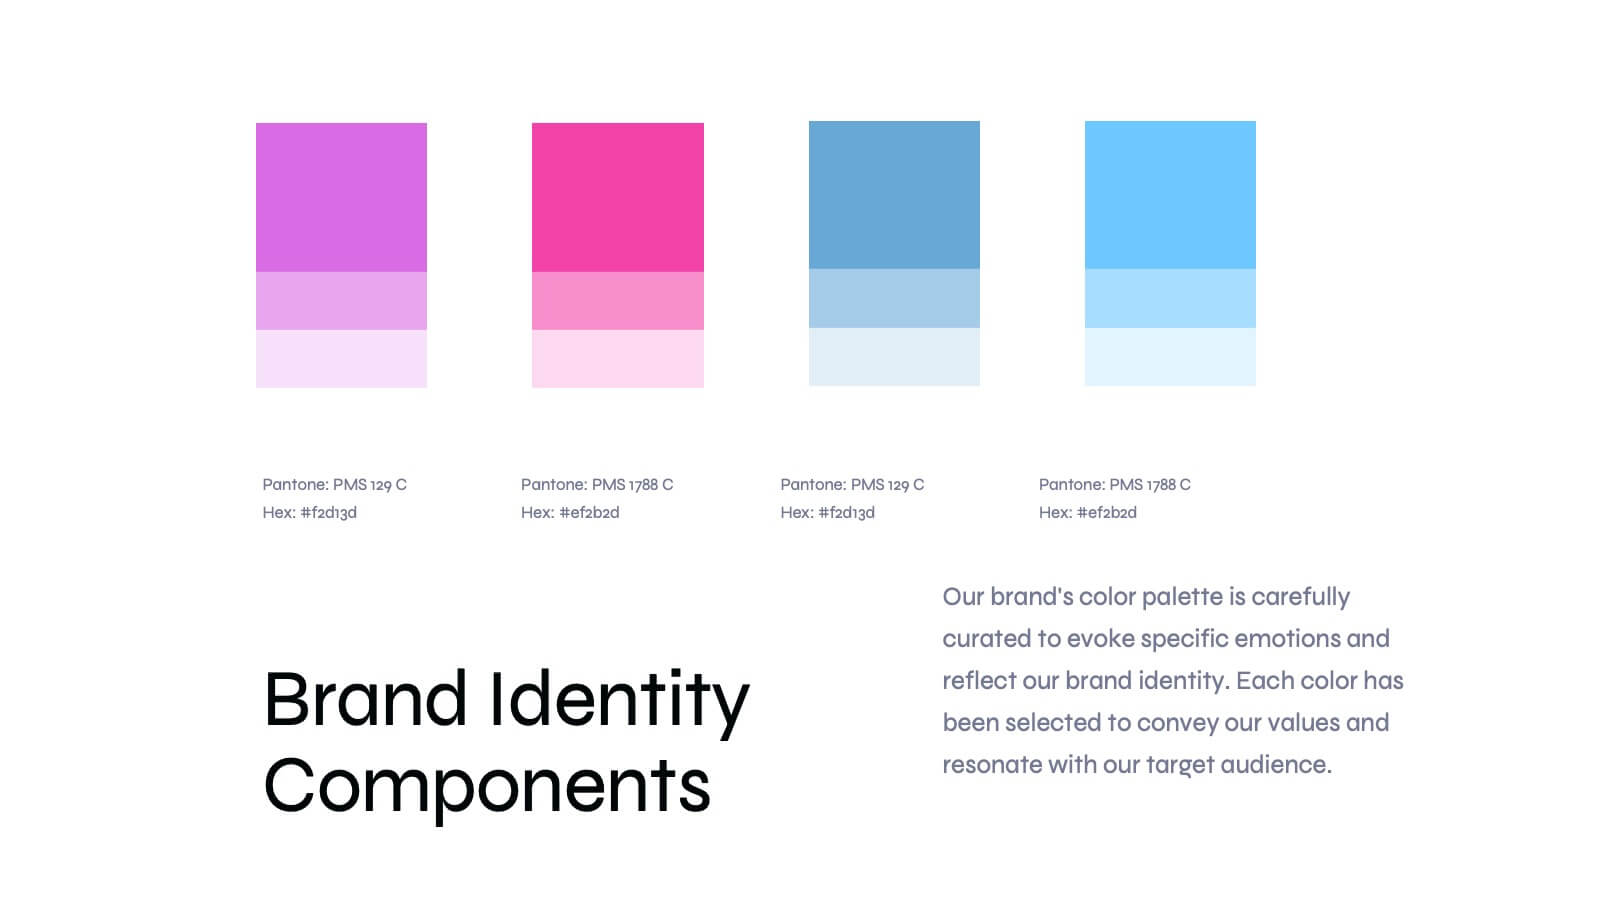
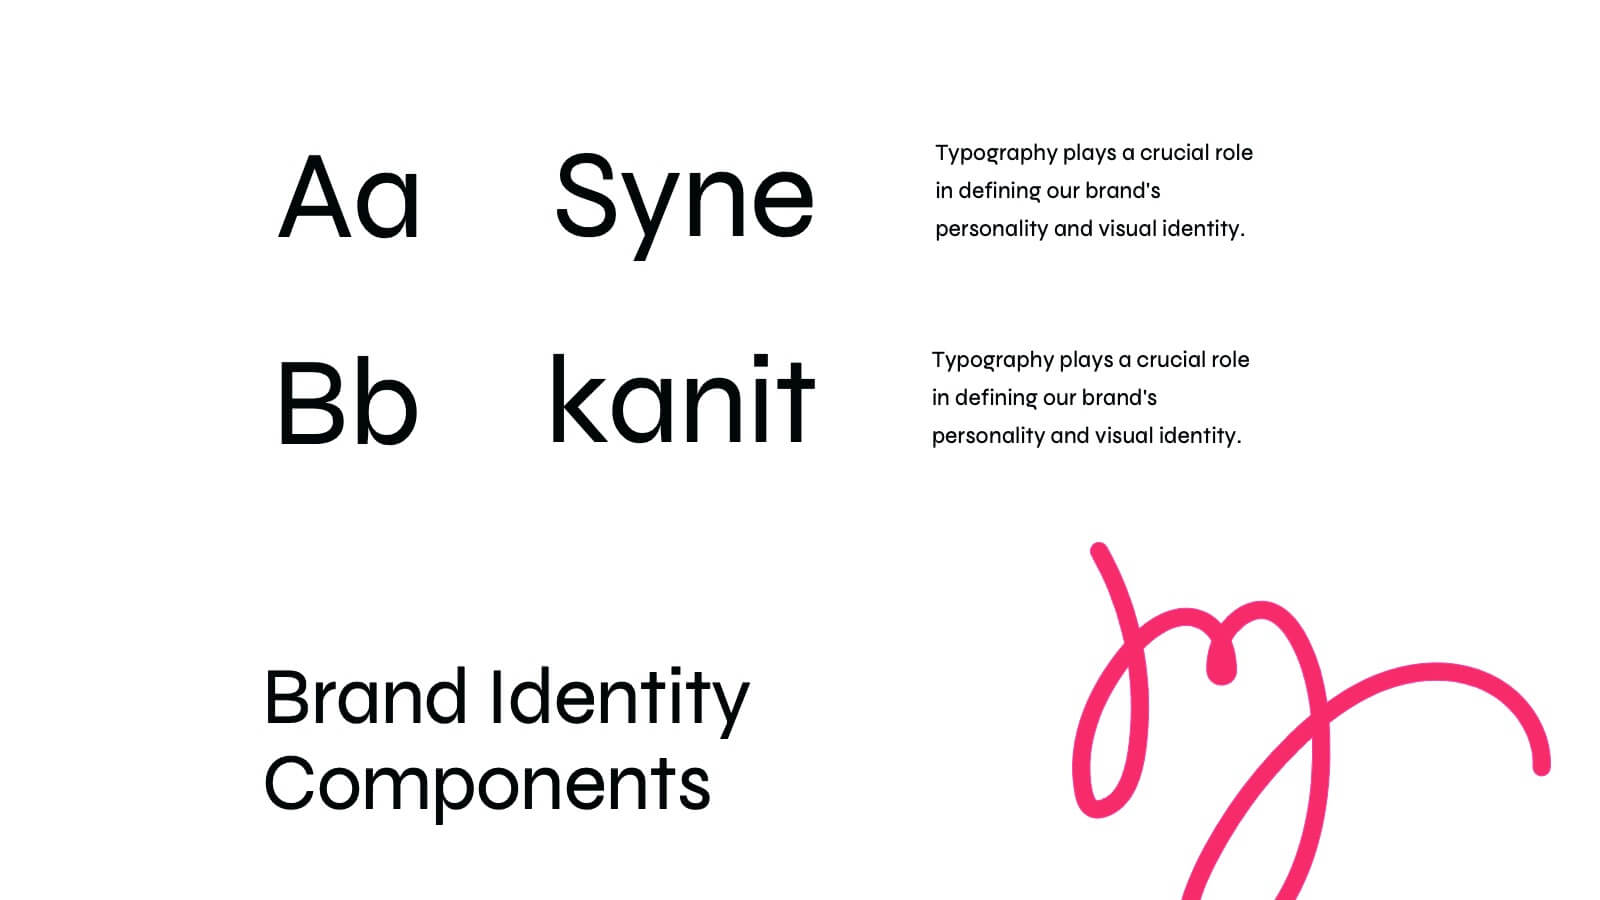
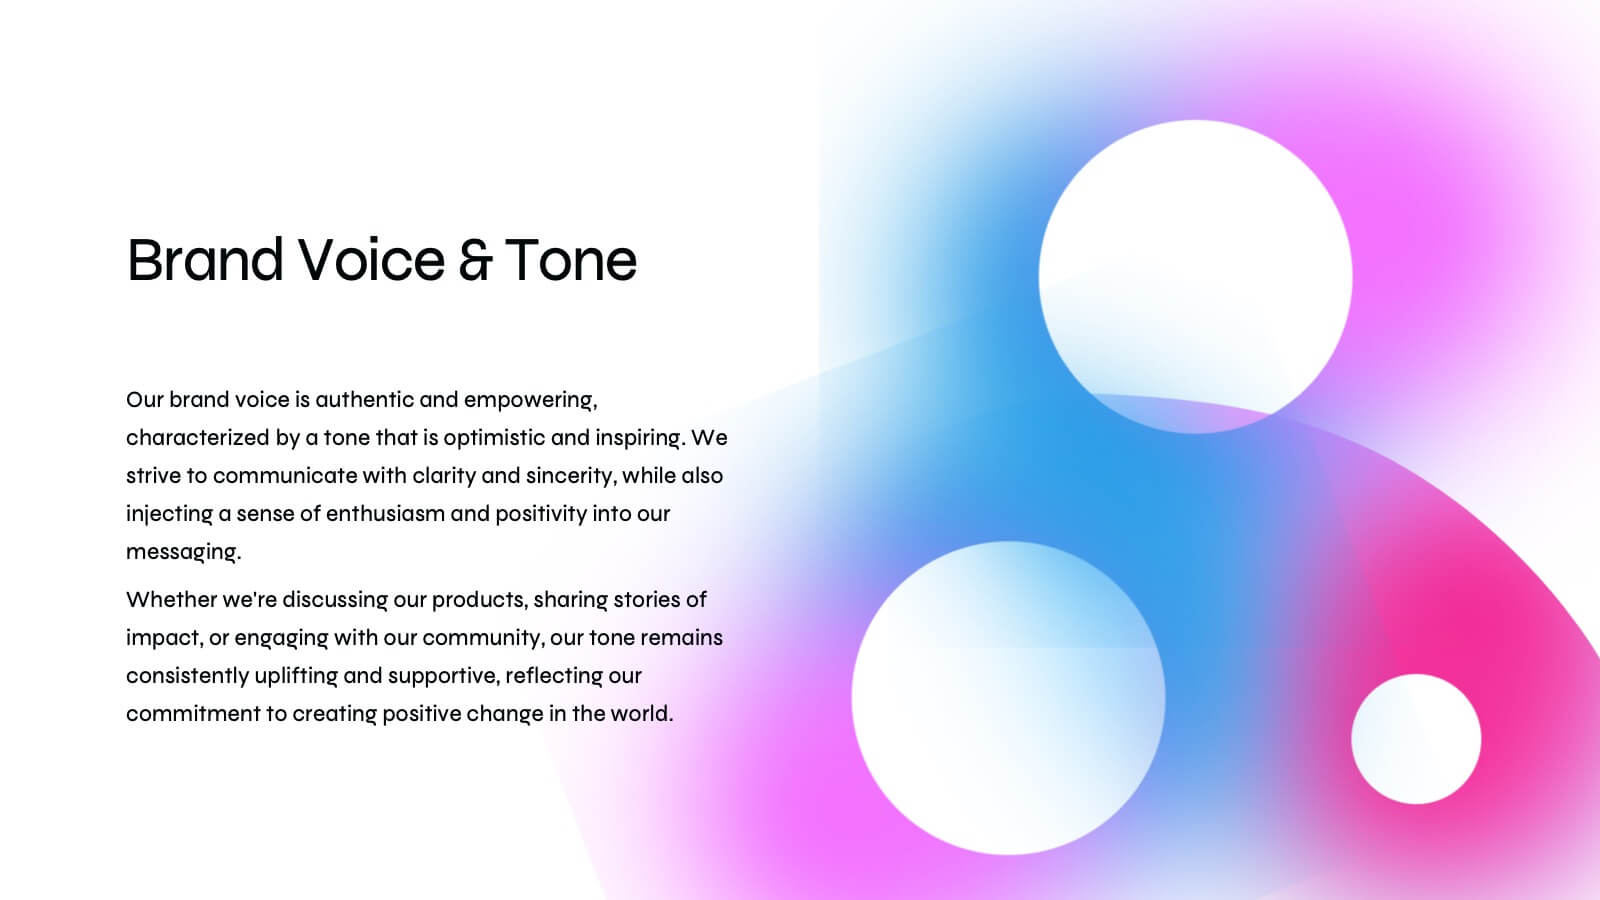
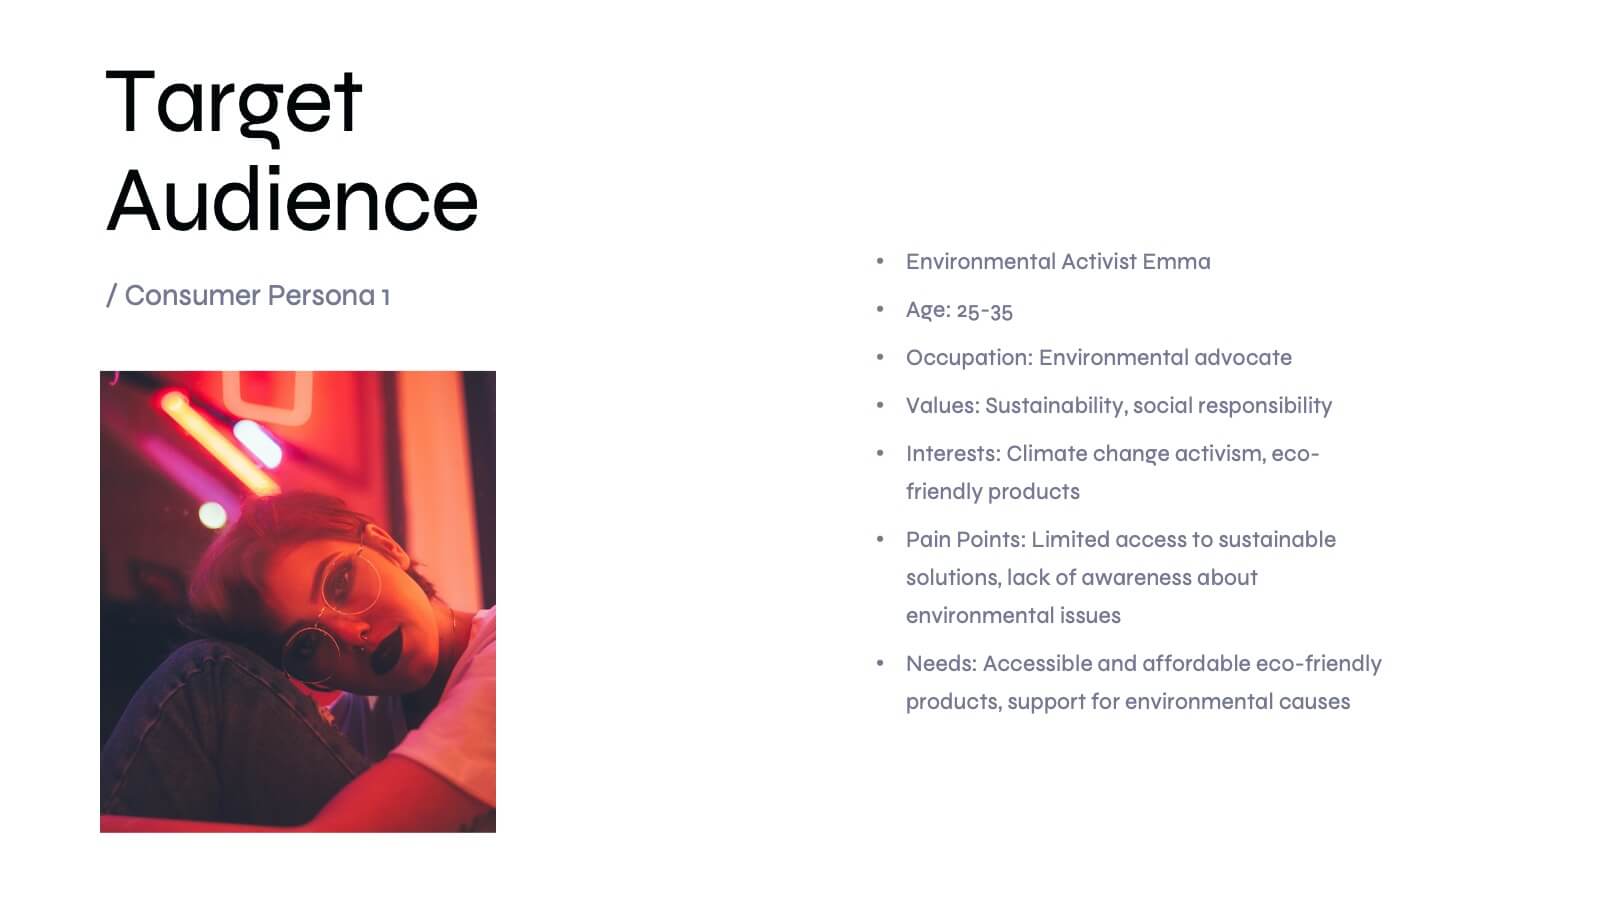
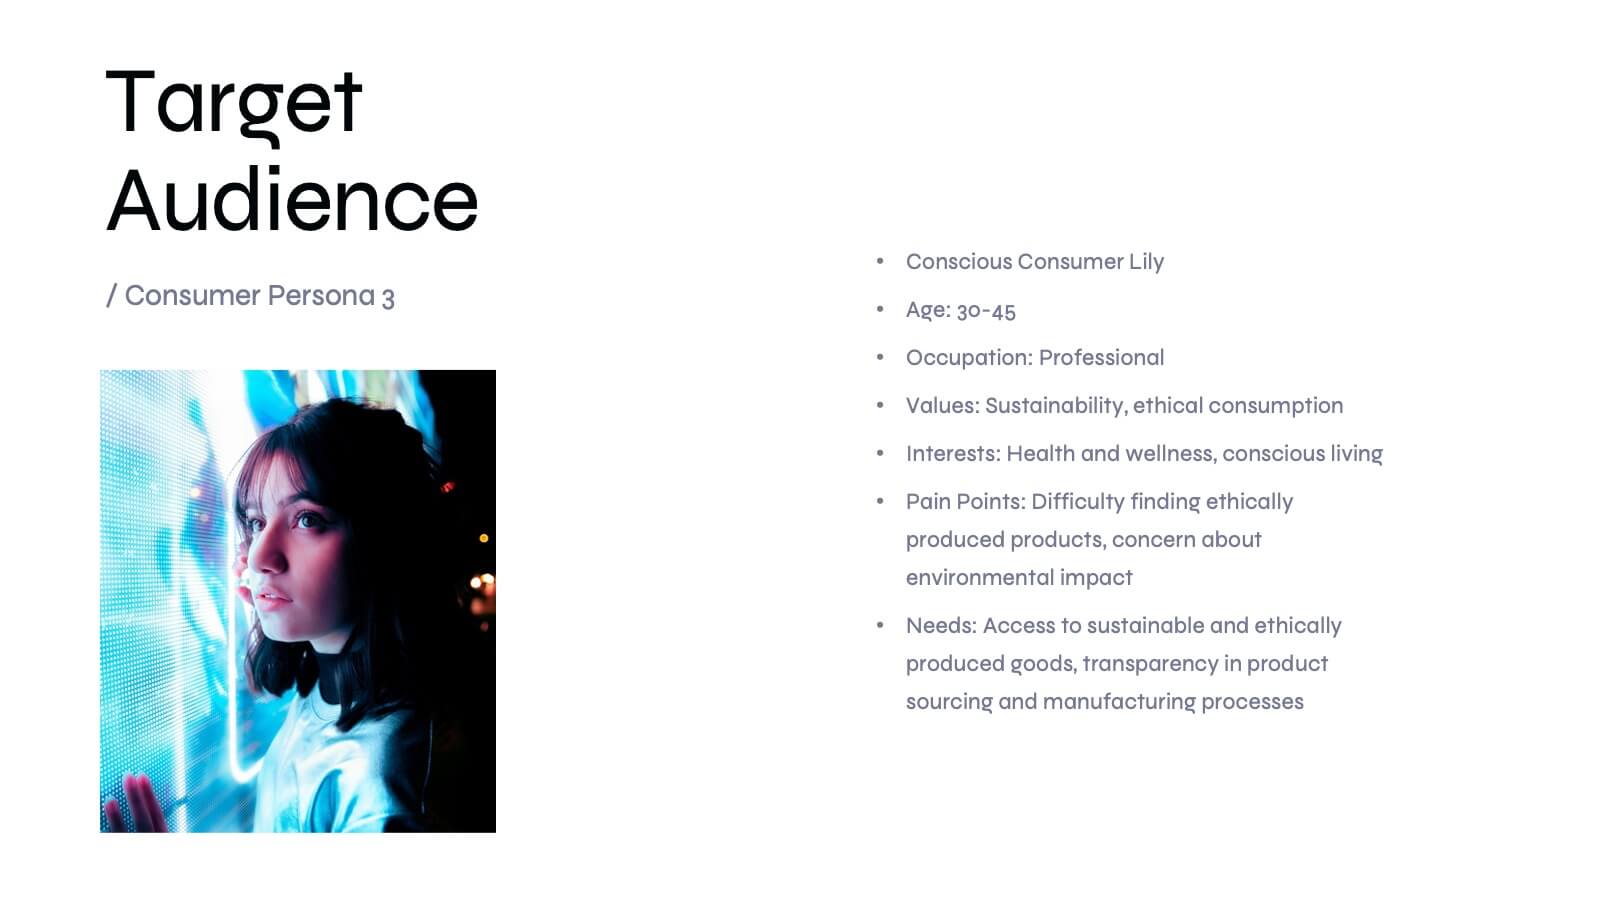
Basilisk Brand Guidelines Proposal Presentation
Present your brand strategy effectively with this modern brand guidelines proposal template! It includes sections for brand vision, values, identity, and market analysis. Fully customizable and compatible with PowerPoint, Keynote, and Google Slides, it’s perfect for showcasing your brand's identity and ensuring consistency across all platforms.


6 slides
Construction Company Infographics
Construct a clear and compelling presentation for your Construction Company with our customizable infographic template. This template is fully compatible with popular presentation software like PowerPoint, Keynote, and Google Slides, allowing you to easily tailor it to showcase various aspects of your construction business. The Construction Company infographic template offers a visually engaging platform to highlight your company's services, projects, team, and achievements. Whether you're a construction company owner, project manager, or marketing professional, this template provides a user-friendly canvas to create informative presentations and promotional materials. Elevate your construction company's profile with this SEO-optimized Construction Company infographic template, thoughtfully designed for clarity and ease of use. Customize it to showcase your company's portfolio, expertise, safety measures, and client testimonials, ensuring you make a lasting impression on your audience. Start crafting your personalized infographic today to showcase your construction company effectively.


5 slides
Social Media Marketing Infographics
Social Media Marketing is an essential component of any modern marketing strategy. These vertical infographics can be used to provide valuable insights into the most effective social media platforms, the latest trends in social media marketing, and tips and strategies for optimizing social media campaigns. These are an excellent way to communicate complex information in an easy-to-digest format and can be used for marketing and educational purposes. Use these infographics to Include data on user demographics, engagement rates, platform-specific best practices, and industry benchmarks.


5 slides
Easy 4-Stage Development Process Presentation
Simplify complex processes with this clean, 4-step development diagram. Ideal for product lifecycles, workflows, or phased planning, this slide uses connected blocks and clear numbering to illustrate each stage. Fully editable in PowerPoint, Keynote, and Google Slides—perfect for project managers, engineers, and teams needing to communicate clear development strategies.


6 slides
Business Task and To-Do List Slide
Organize tasks with clarity using this colorful checklist-style layout, perfect for showcasing priorities, timelines, or team responsibilities. With six editable sections and engaging icons, this layout brings structure and visual appeal to business updates or project meetings. Fully customizable in PowerPoint, Keynote, and Google Slides.


6 slides
Workforce Development Strategy Presentation
Enhance your workforce development strategies with our "Workforce Development Strategy Presentation" template. This infographic effectively displays essential workforce statistics and initiatives, organizing data into visually distinct segments for clarity. It covers various demographics and departmental roles, color-coded to differentiate data points like gender distribution and participation rates. Ideal for HR professionals and corporate trainers, this template supports strategic decisions in talent management and training. It simplifies complex information, making it accessible for all stakeholders. Compatible with PowerPoint, Keynote, and Google Slides, this template is essential for delivering impactful and strategic human resource presentations.


7 slides
Technology Development Infographic Presentation
Technology has become an integral part of modern society and plays a crucial role in almost every aspect of our lives. This is a high quality, easily editable and fully layered infographic template. It includes many useful elements to add your data such as icons, charts, text boxes, bullet points, and a map to grab your audience’s attention. Showcase how technology has been developed over the years and how it is developing today. You can use this template for your class or for professional presentations. This is a multipurpose template, compatible with PowerPoint, Keynote and Google Slides.


4 slides
Business Growth through AIDA Model Presentation
Visualize the buyer’s journey with this engaging AIDA model slide. Featuring rounded 3D-style shapes and clear progression from Attention to Action, this layout is ideal for marketing plans, customer engagement strategies, or sales funnels. Each stage is color-coded and icon-enhanced for clarity. Easily customizable in PowerPoint, Keynote, and Google Slides.


20 slides
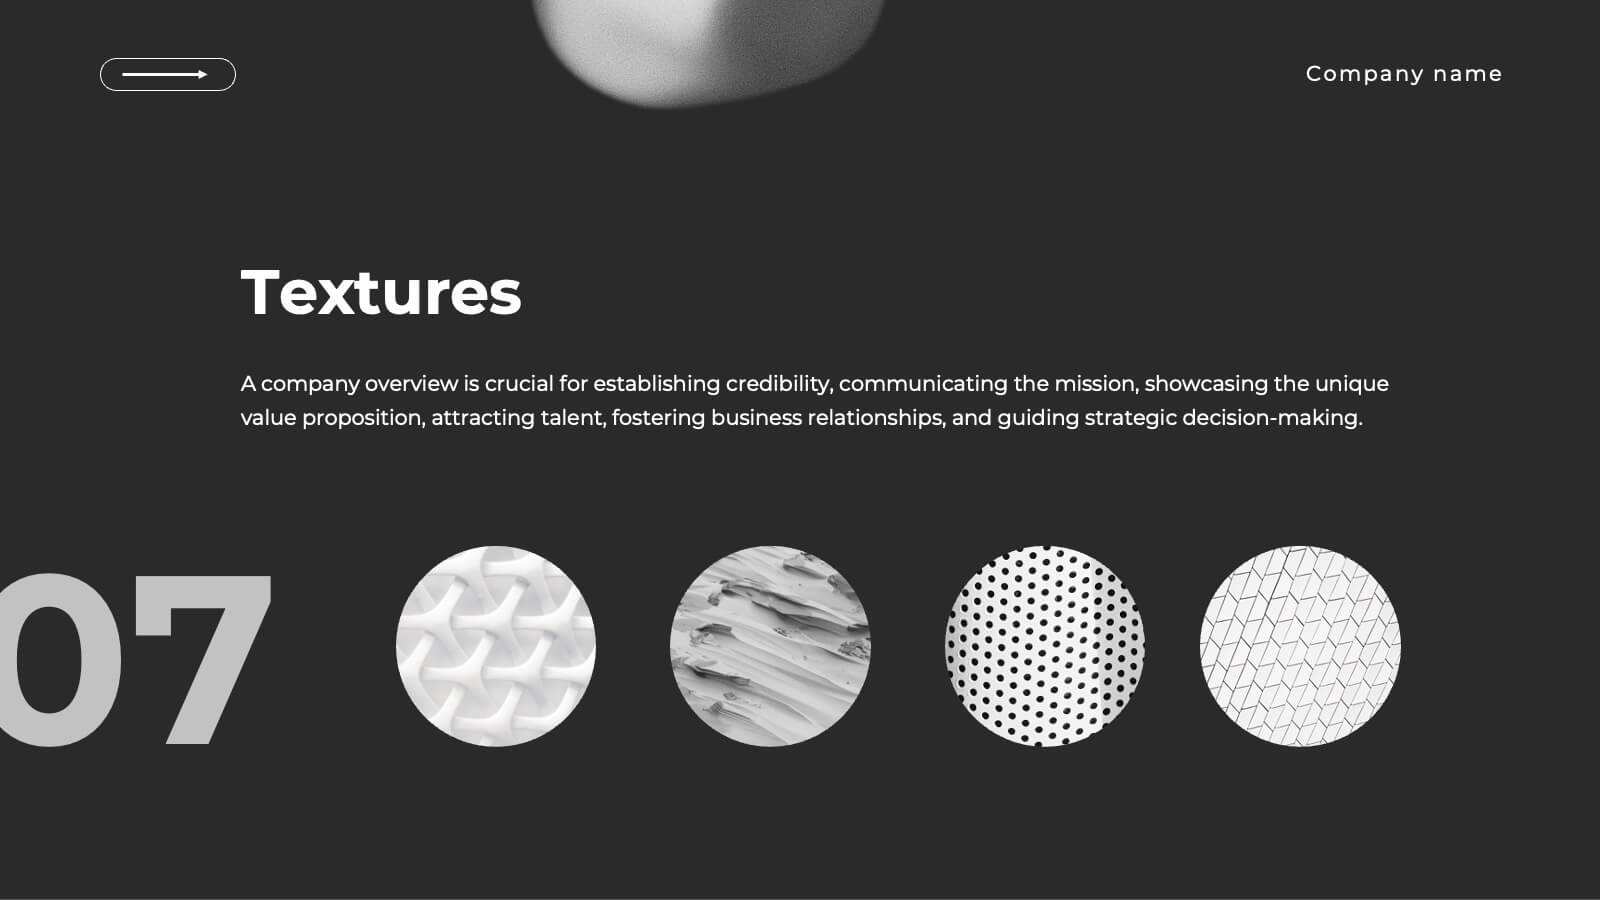
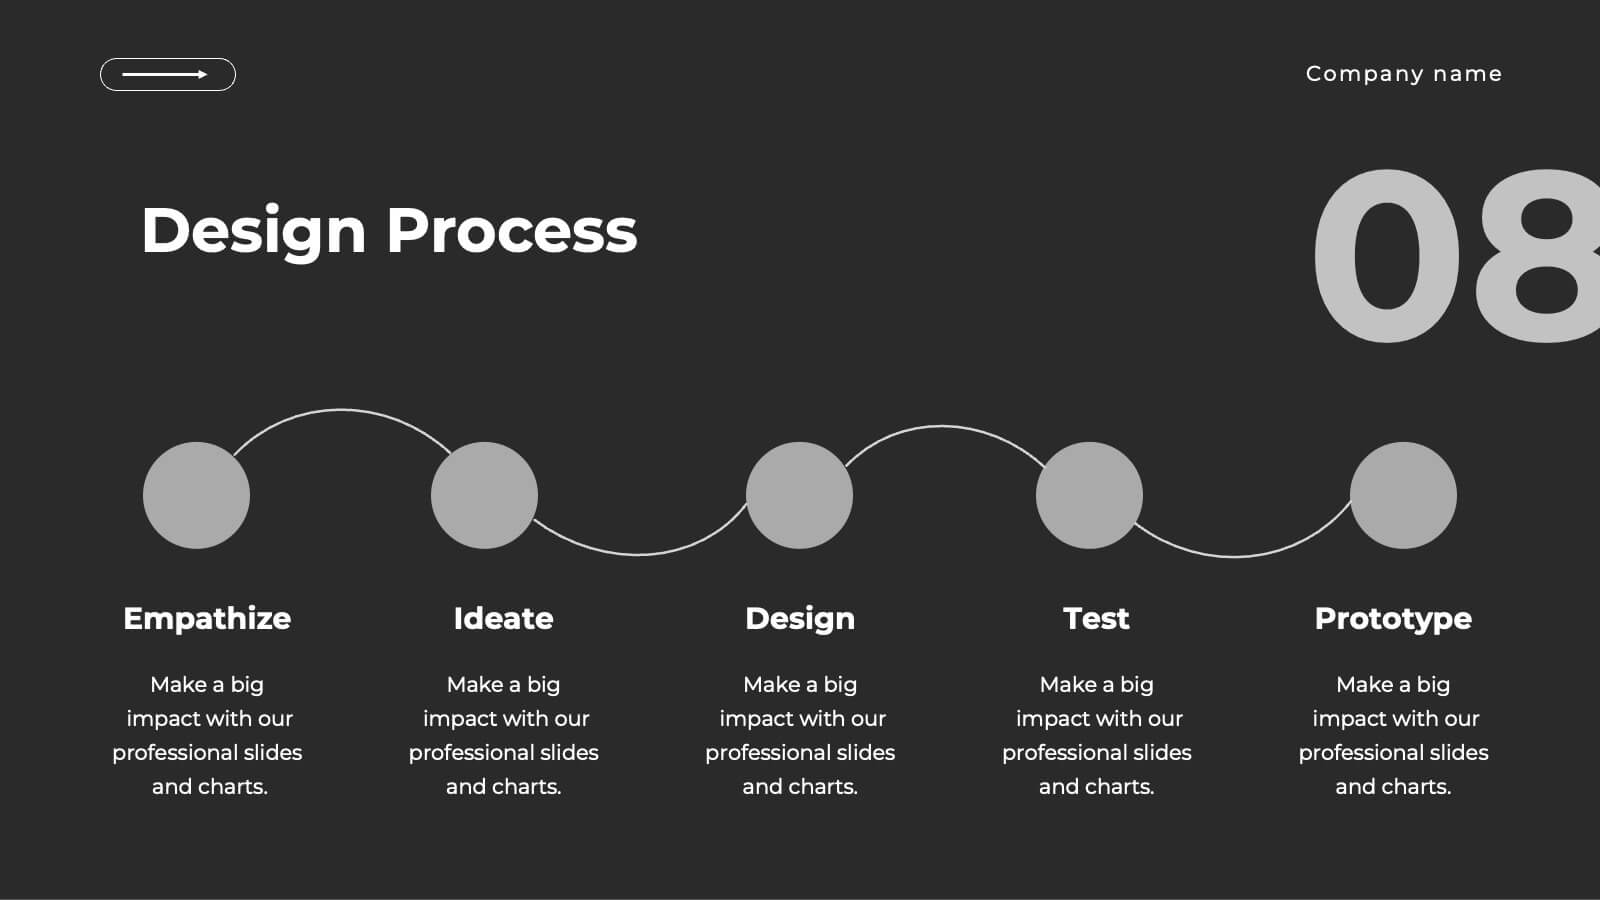
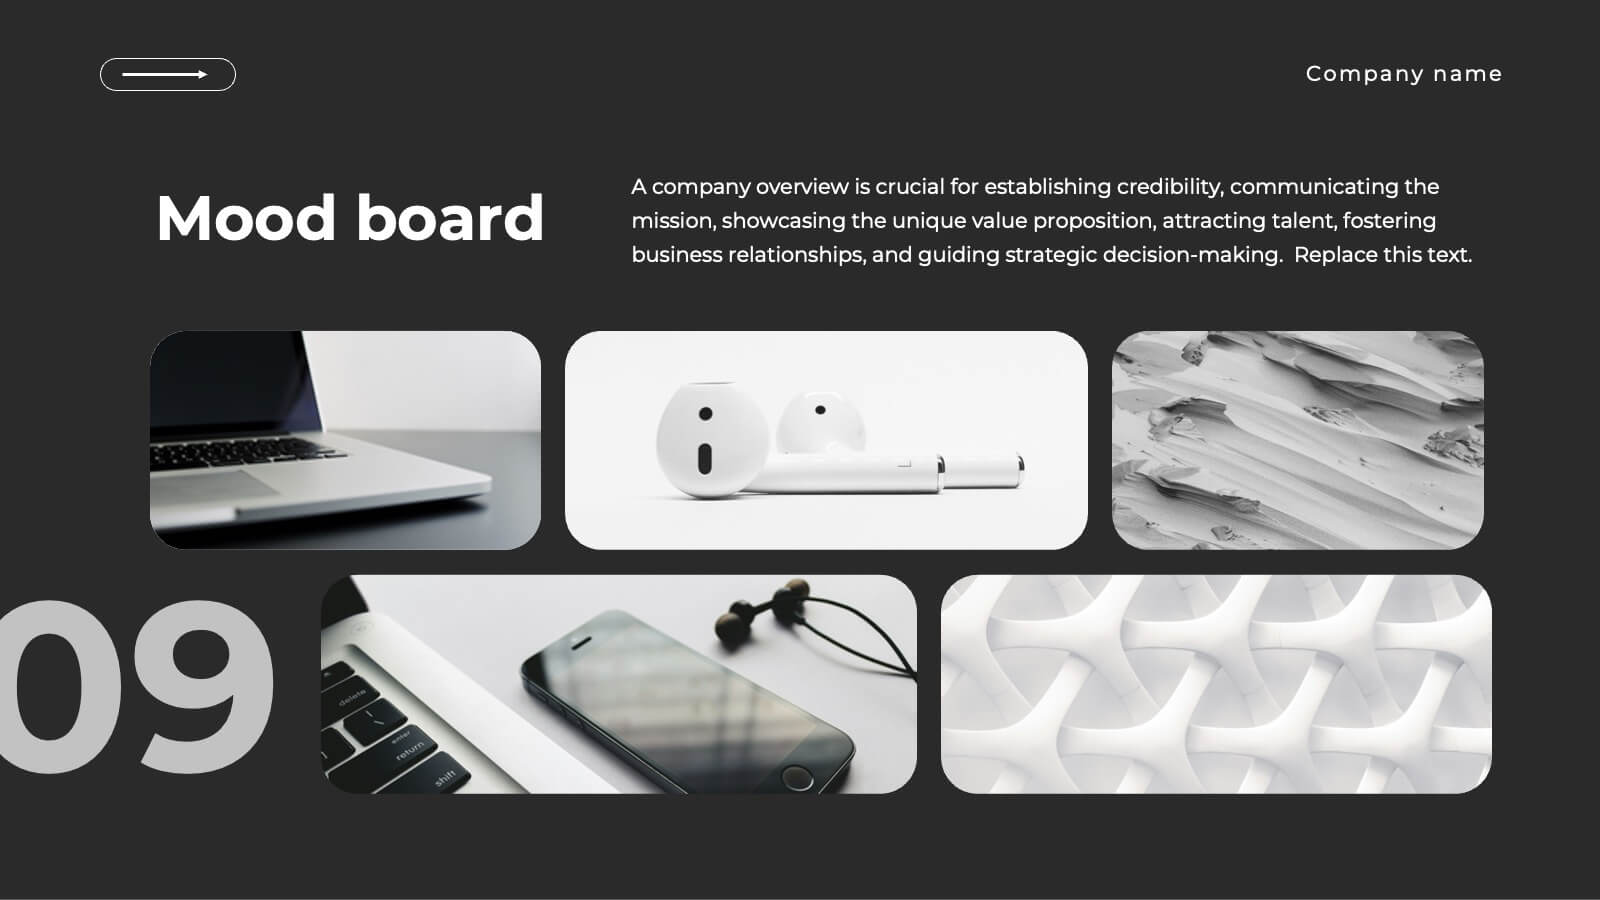
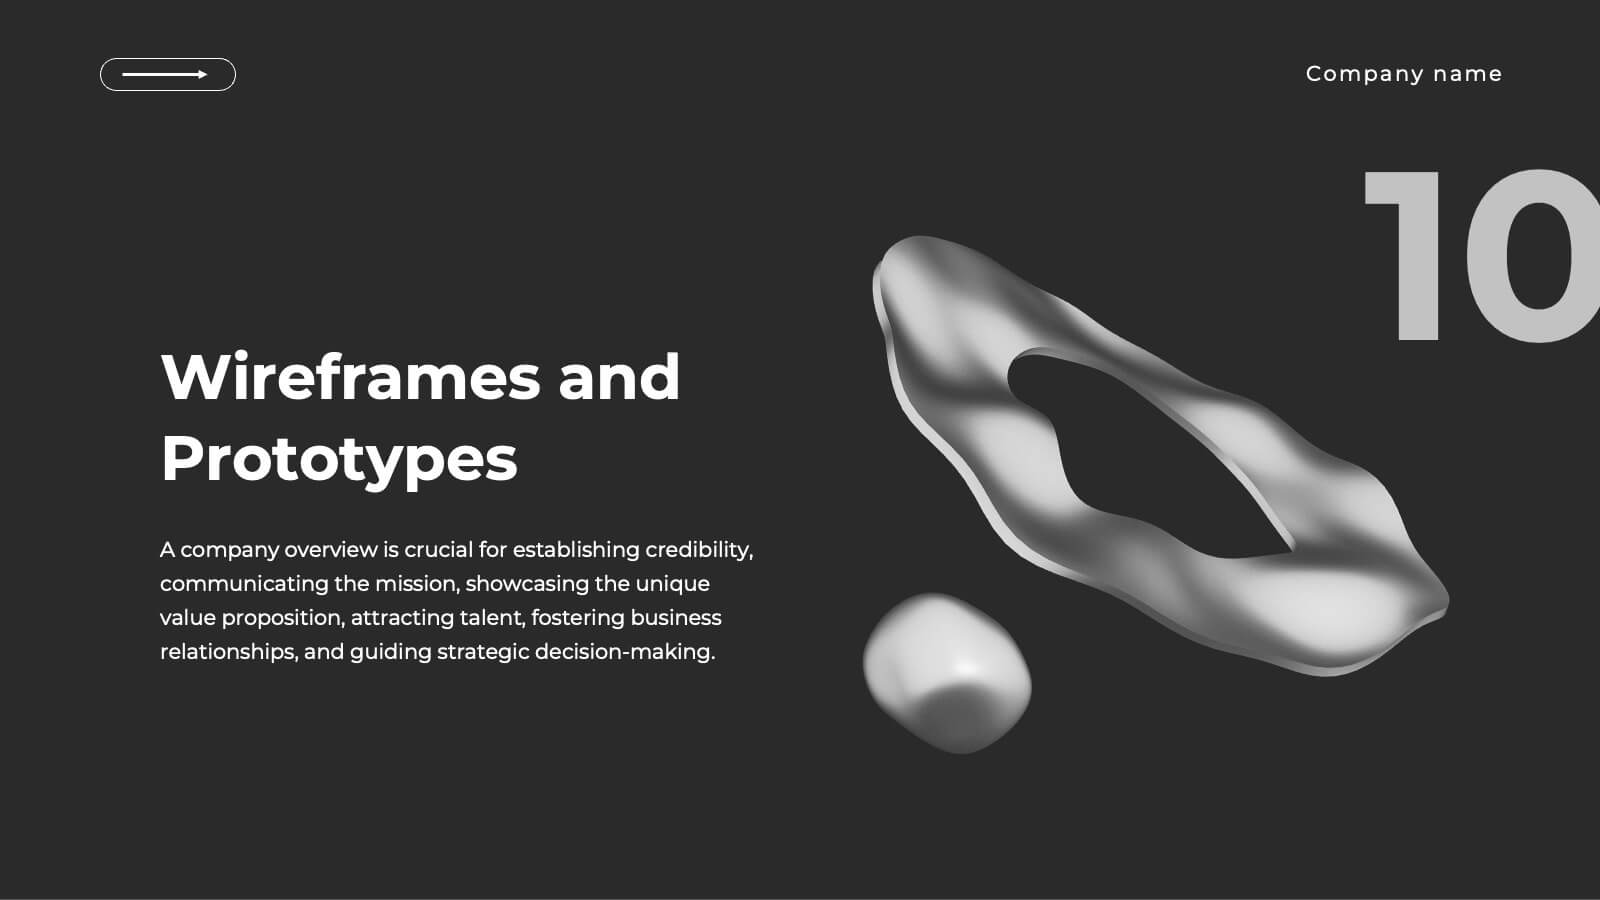
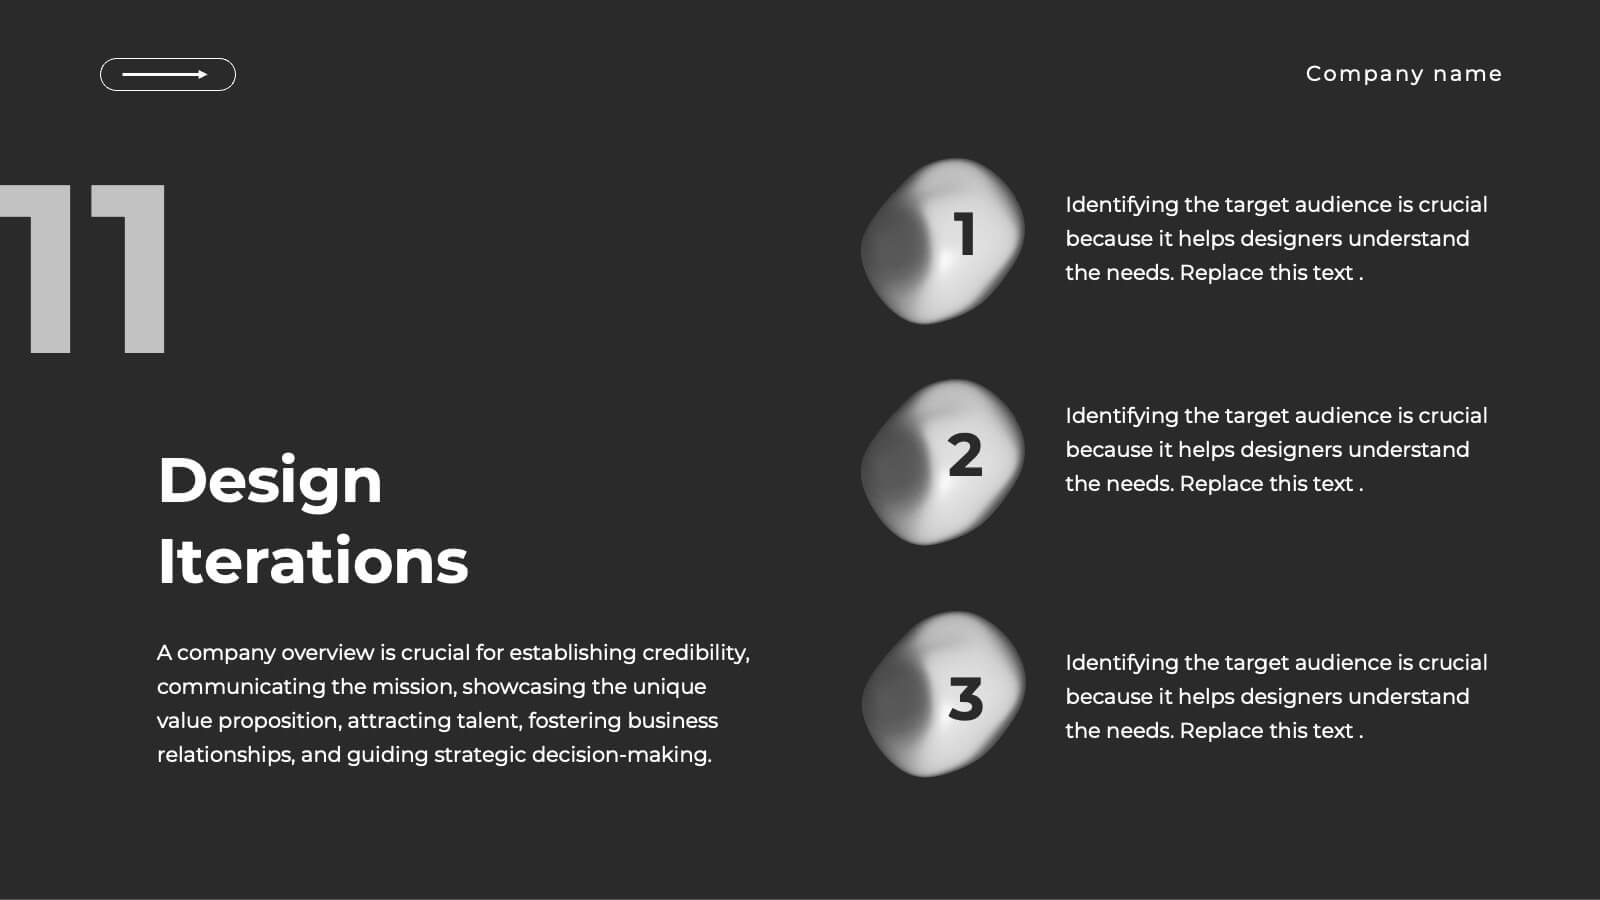
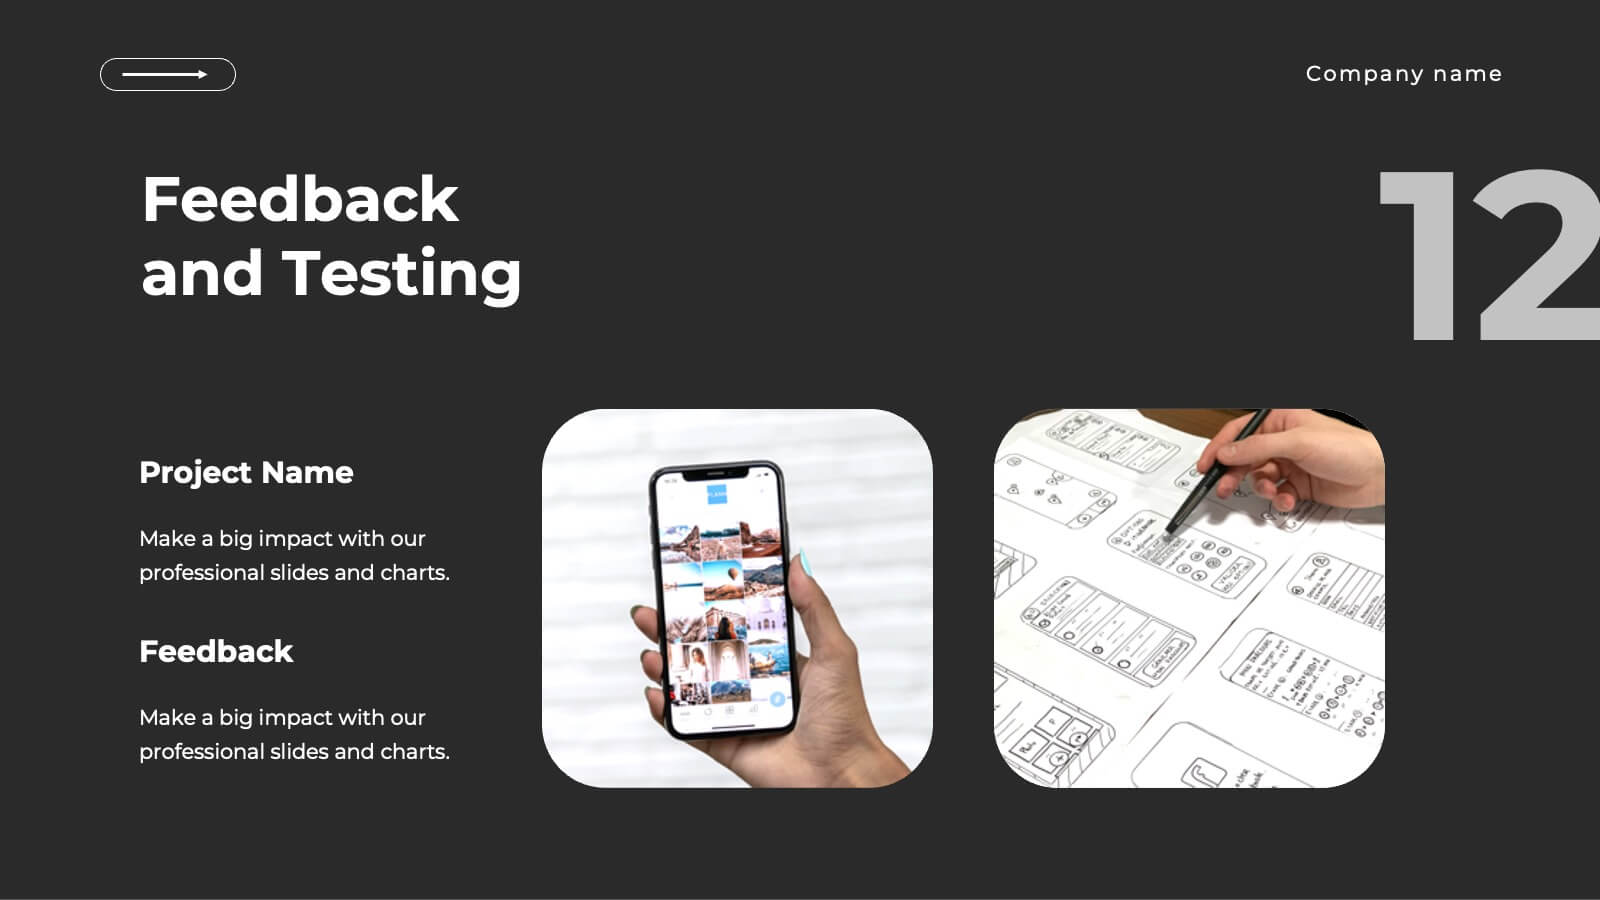
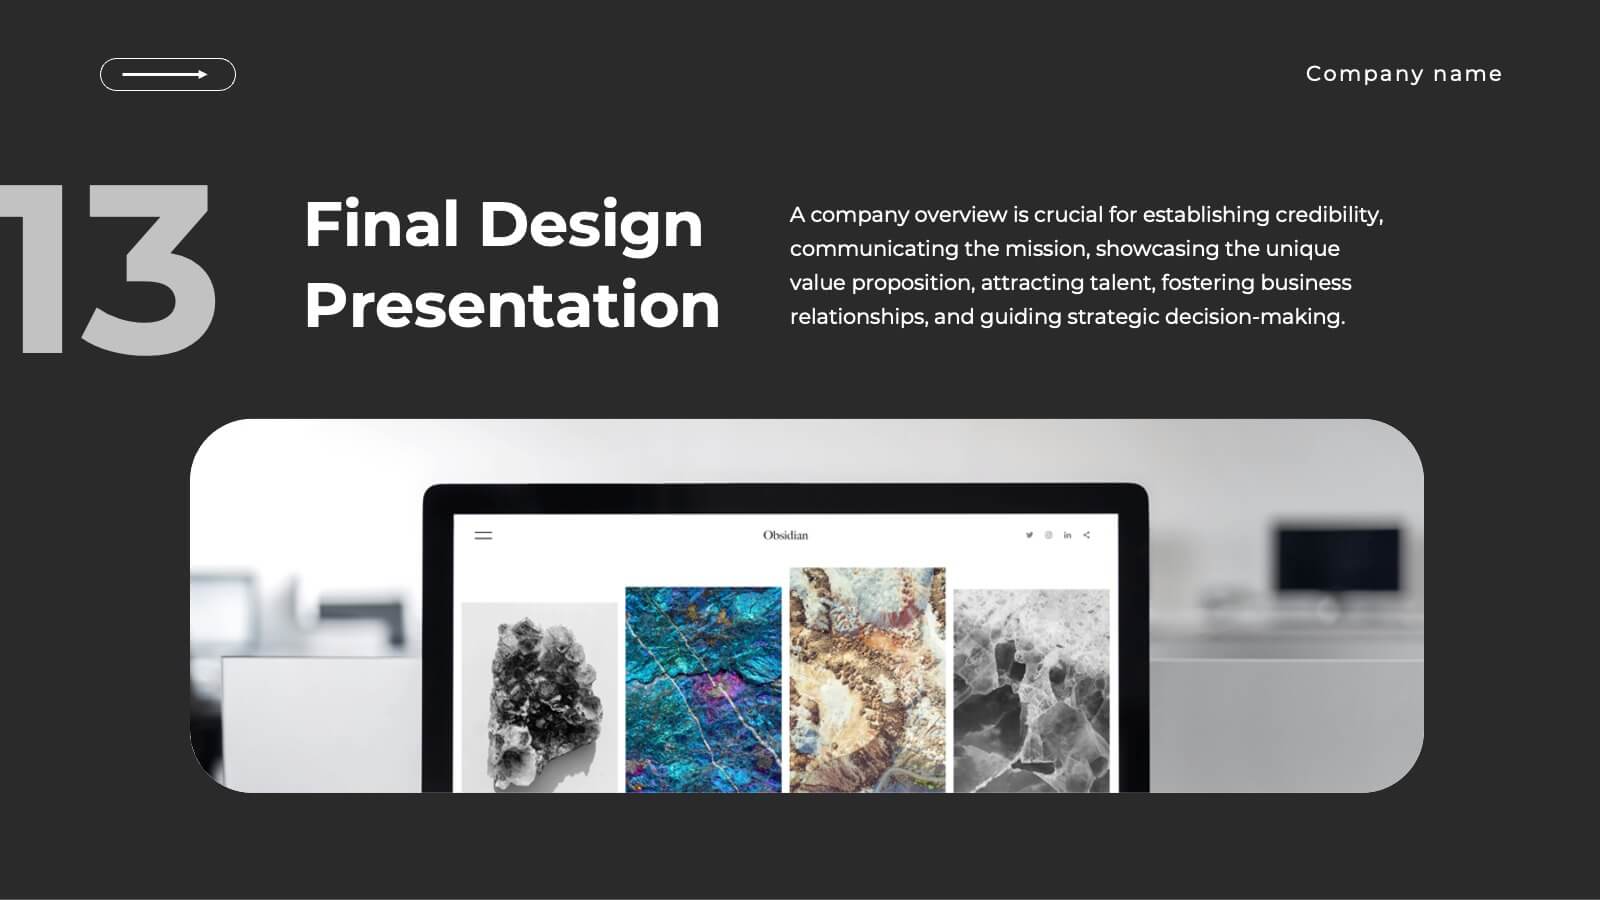
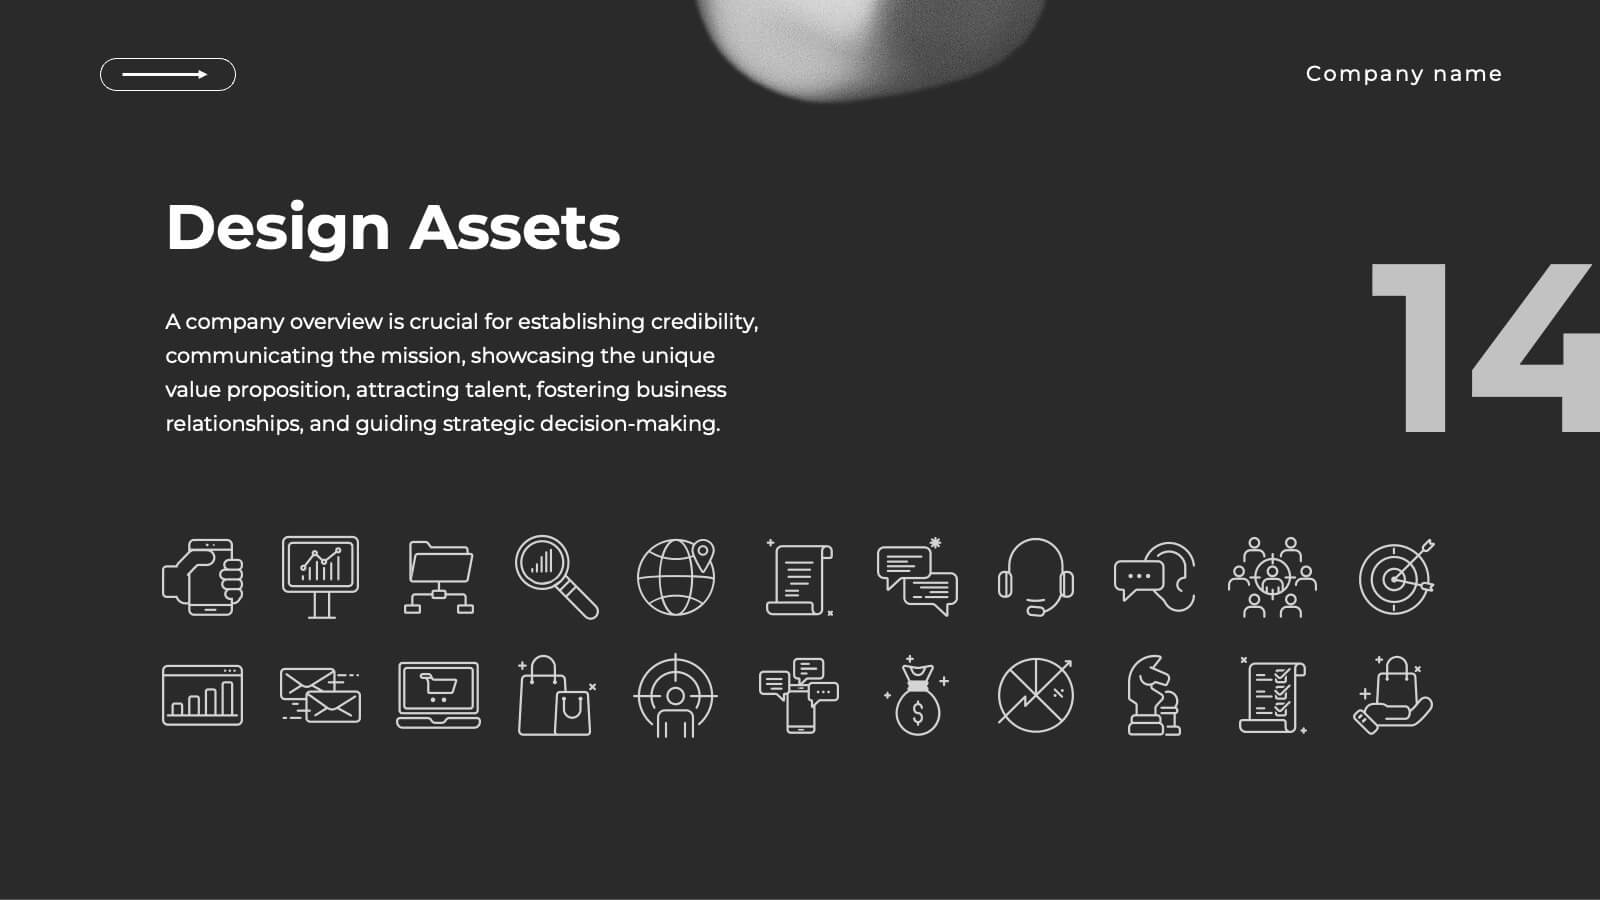
Realm UX UI Design Pitch Deck Presentation
Present your UX/UI design process with this sleek and modern design template! It covers everything from concept development to wireframes, prototypes, design iterations, and final design presentation. Fully customizable and compatible with PowerPoint, Keynote, and Google Slides, it’s perfect for design teams and professionals looking to showcase their creative process effectively.


6 slides
Modern Science Report Presentation
Bring your findings to life with a clean, dynamic layout designed to make scientific insights easy to follow. This presentation highlights key data, research points, and lab observations in a structured, visually engaging format that supports clarity and accuracy. Fully compatible with PowerPoint, Keynote, and Google Slides.


7 slides
Hierarchy Infographic Presentation Template
This Hierarchy infographic template presents information in a hierarchical format and makes it easy to see the most important pieces of information without having to read through all of your content. Use this template as a starting point to create an effective hierarchy chart by copying and pasting the template into PowerPoint. It features an assortment of color schemes and styles that can be customized. Our hierarchy infographic template will help you build an amazing presentation. This isn't just an ordinary Infographic template, it features a design that will stand out in the crowd!


4 slides
Construction Project Planning
Streamline your workflow and improve clarity with this vibrant project planning wheel designed for construction professionals. This slide helps visualize key phases—such as planning, team coordination, and logistics—using color-coded segments and editable icons. Perfect for architects, contractors, and project managers. Fully customizable in PowerPoint, Keynote, and Google Slides.


6 slides
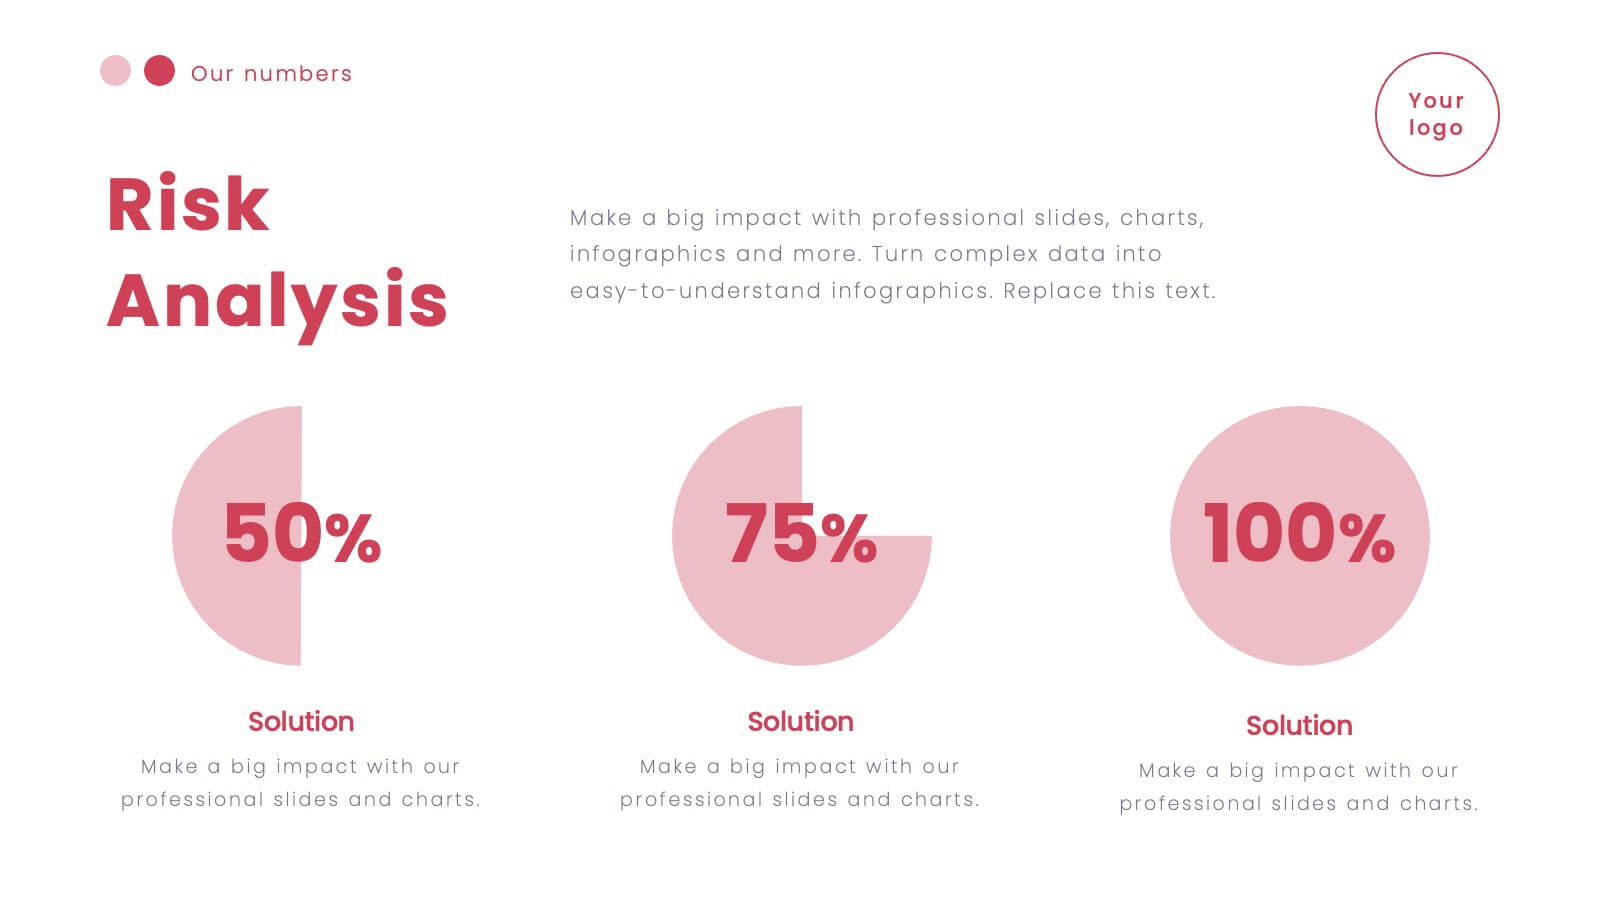
Risk Management Strategies Infographic
Risk management is the process of identifying, assessing, prioritizing, and mitigating risks in order to minimize their impact on an organization's objectives and projects. This infographic template is designed to convey important information about identifying, assessing, and mitigating risks in various contexts. The icons and symbols are added to represent different stages of risk management, such as identification, assessment, mitigation, and monitoring. This Infographic can effectively communicate the importance of risk management and provide insights into the strategies used to mitigate potential risks in various contexts.

22 slides
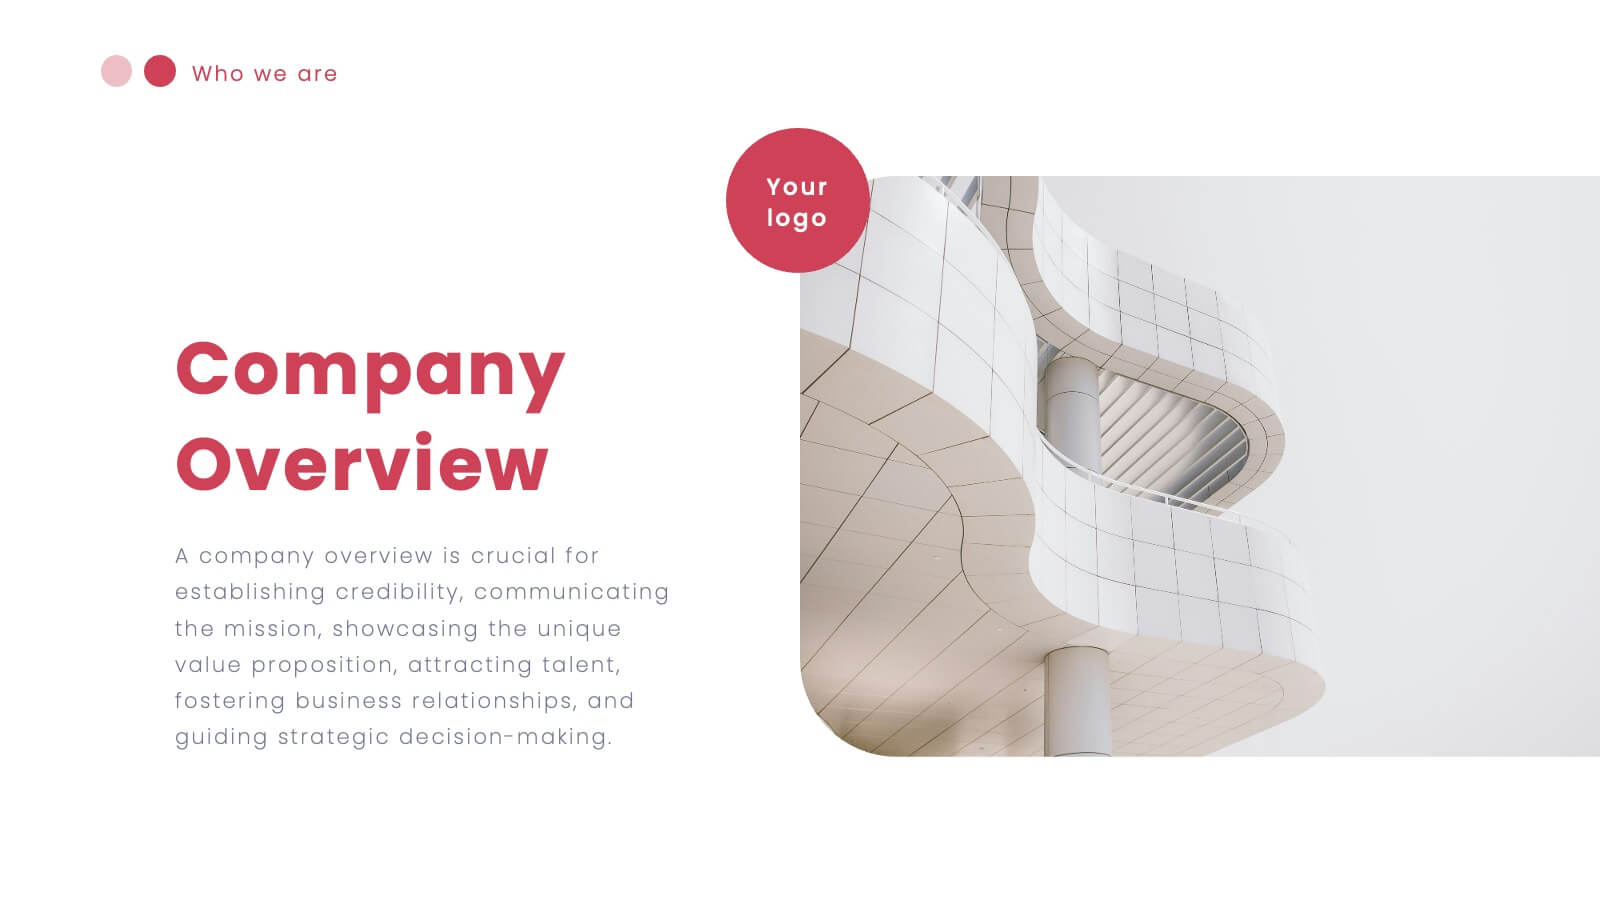
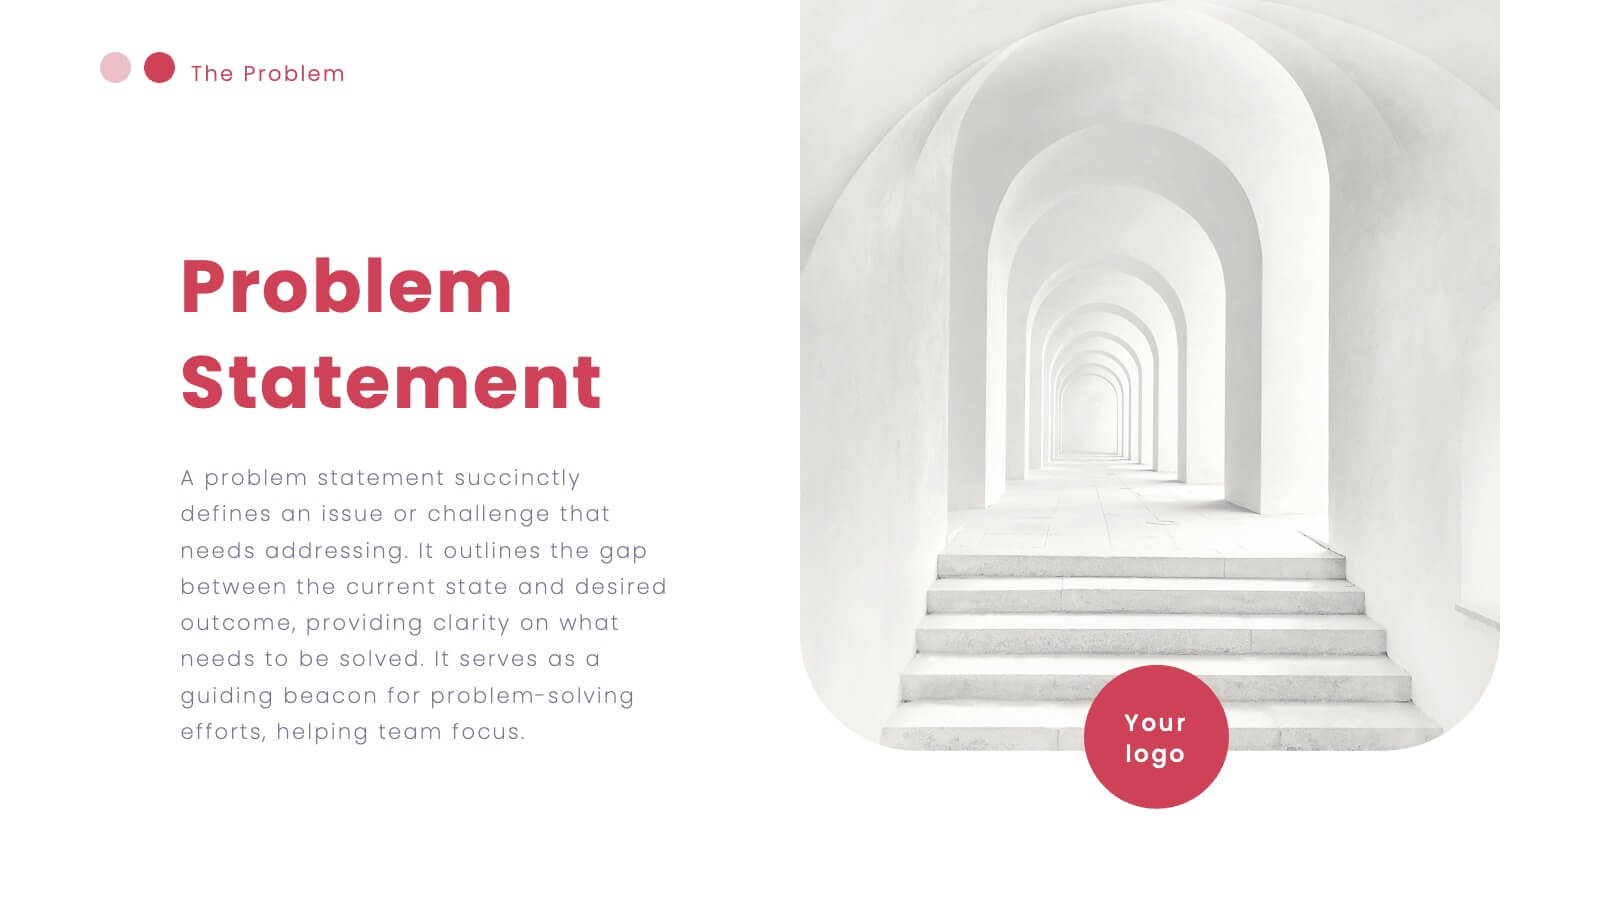
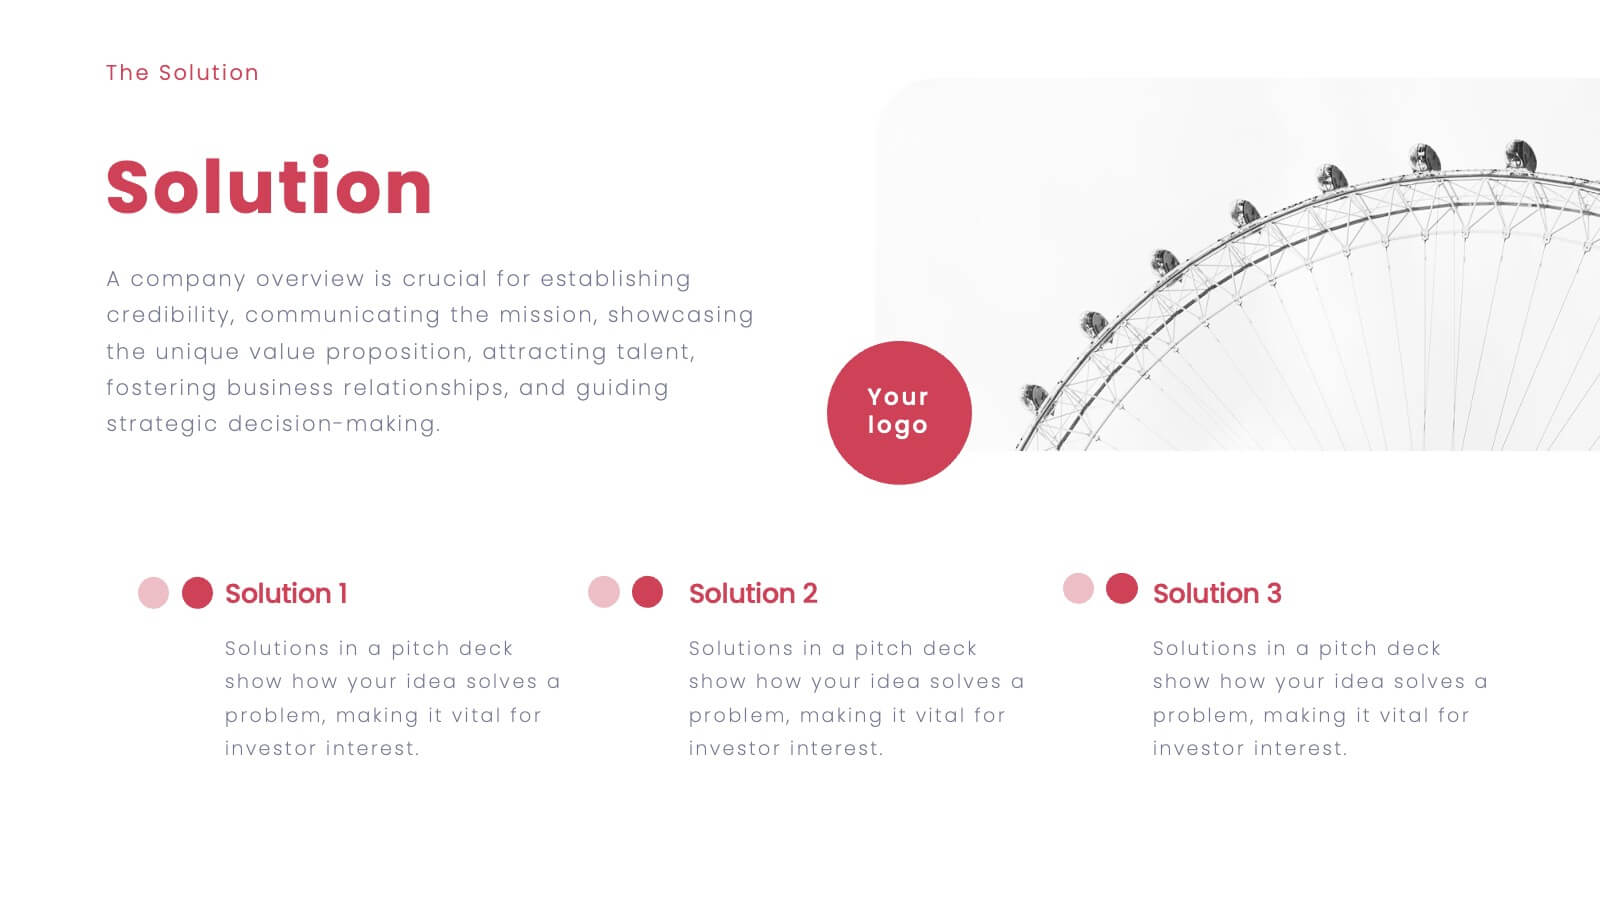
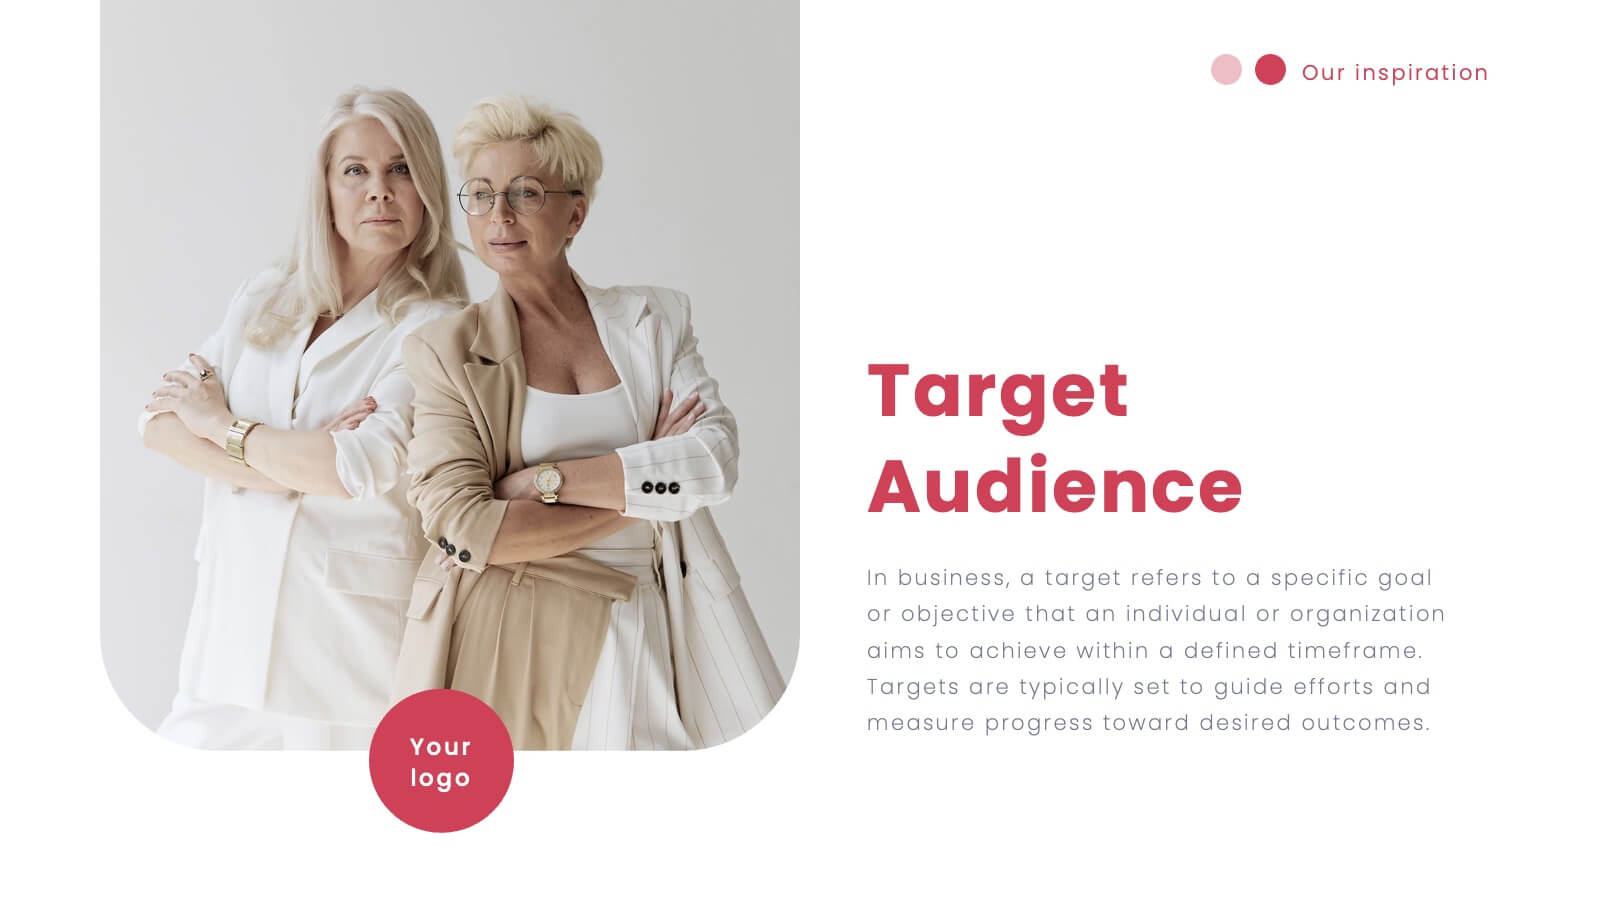
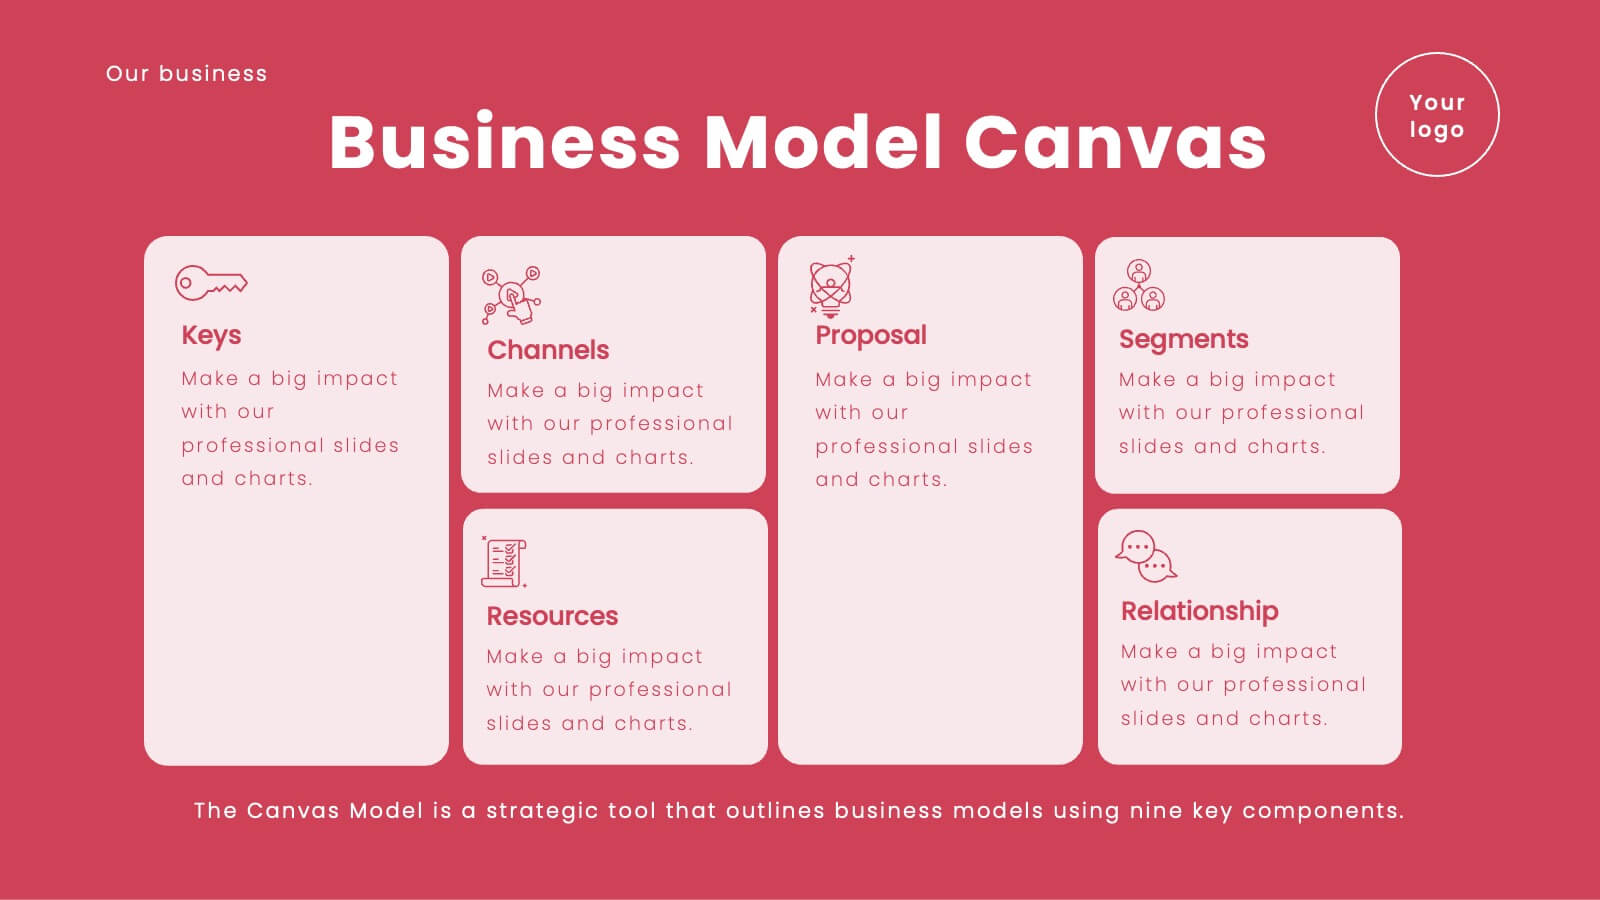
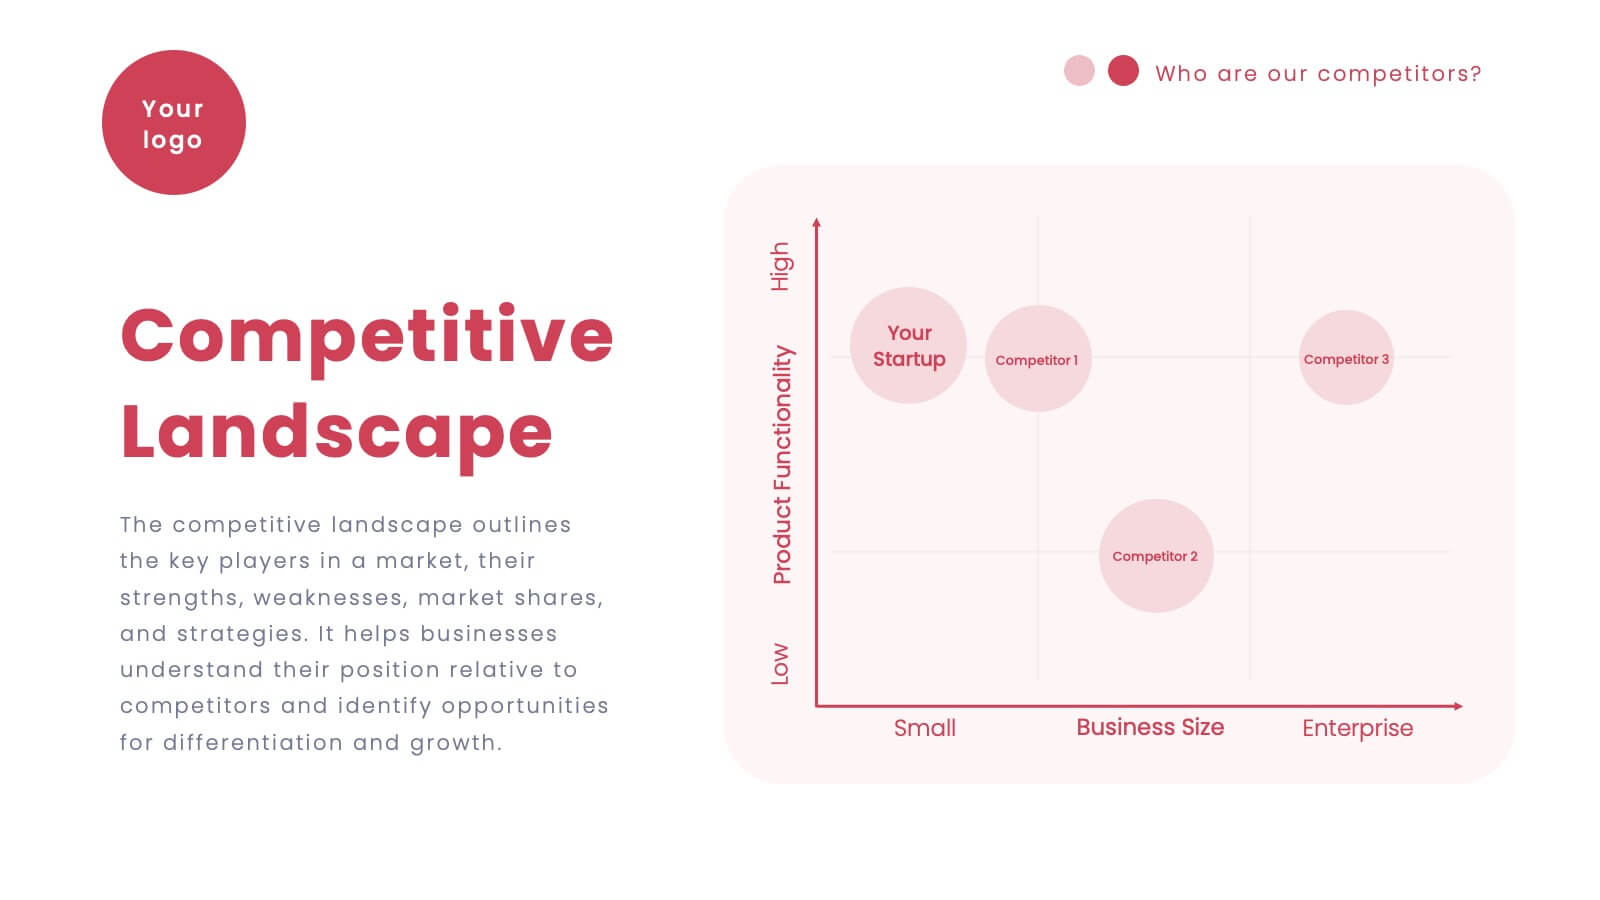
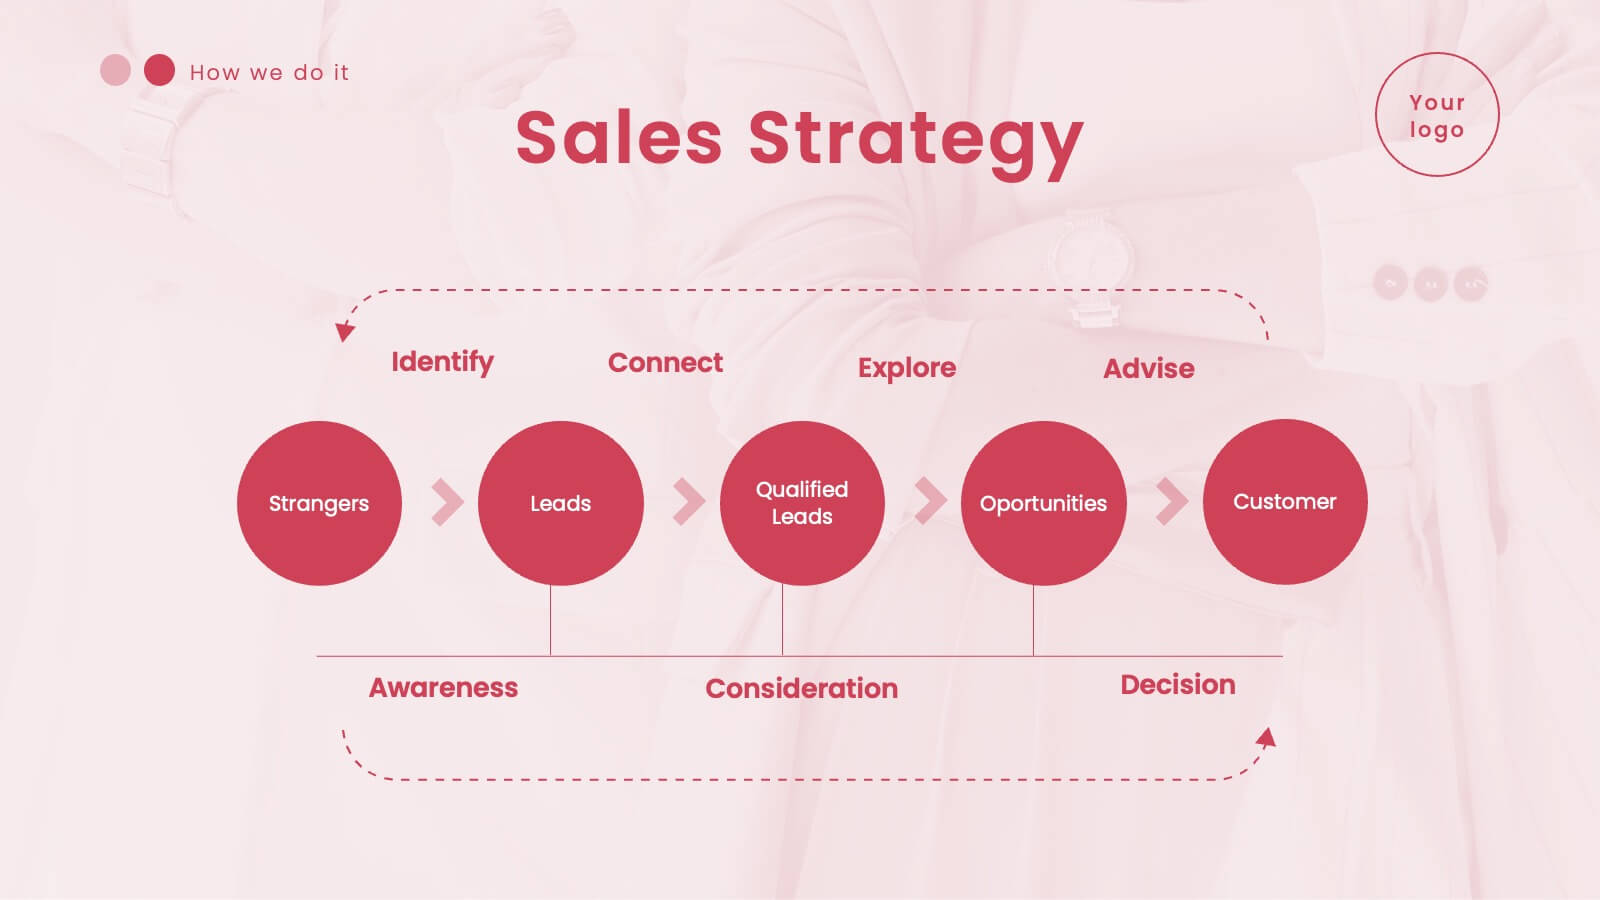
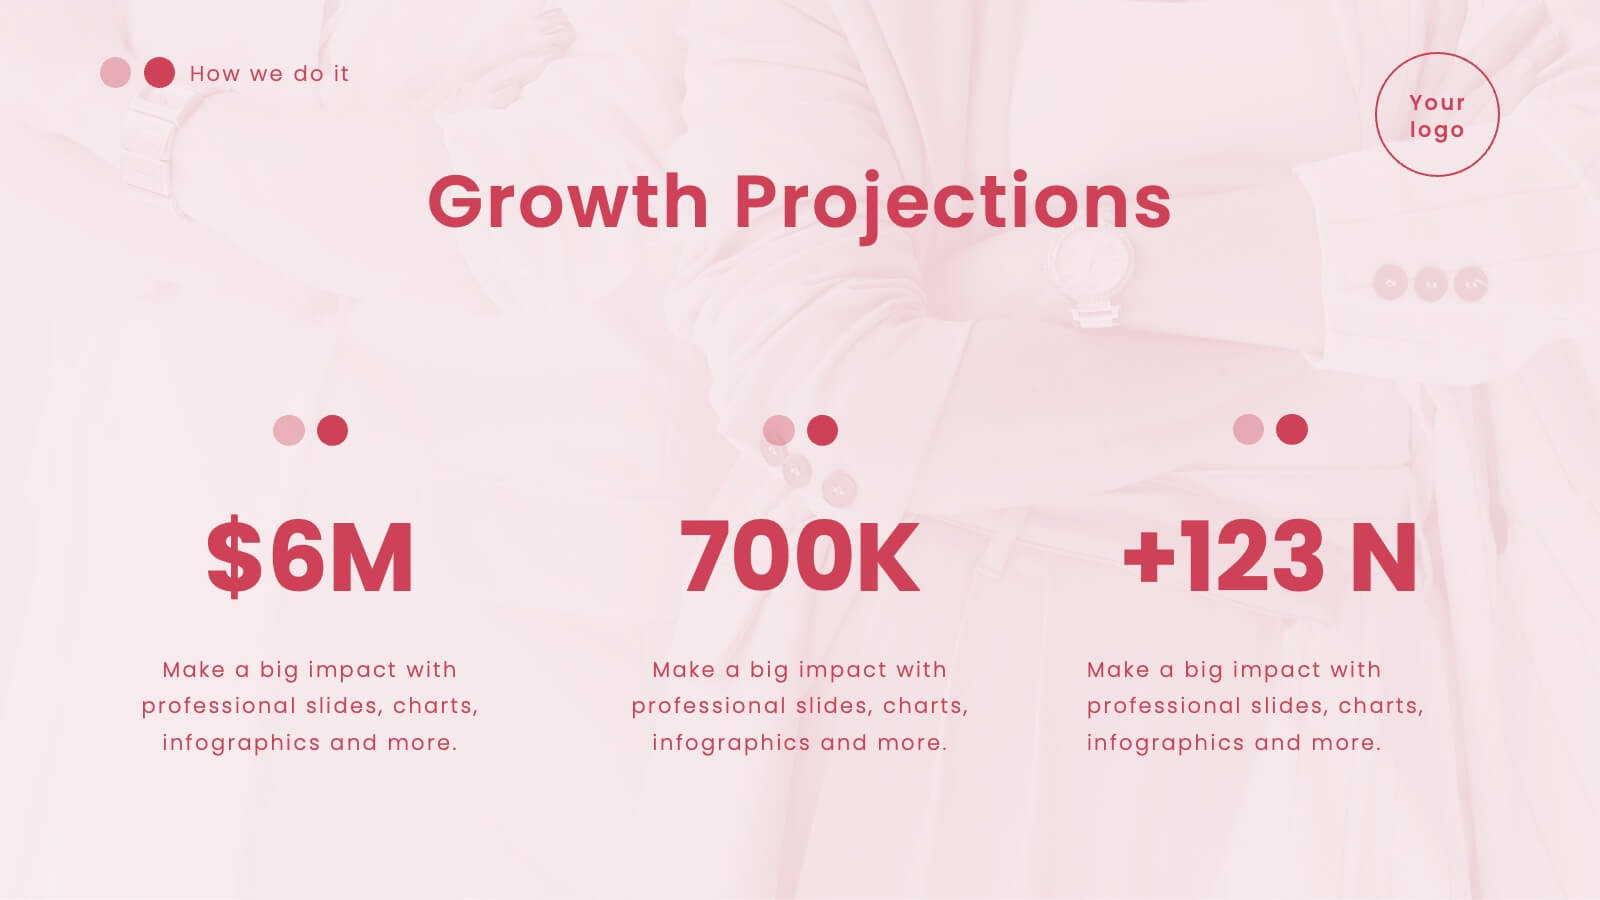
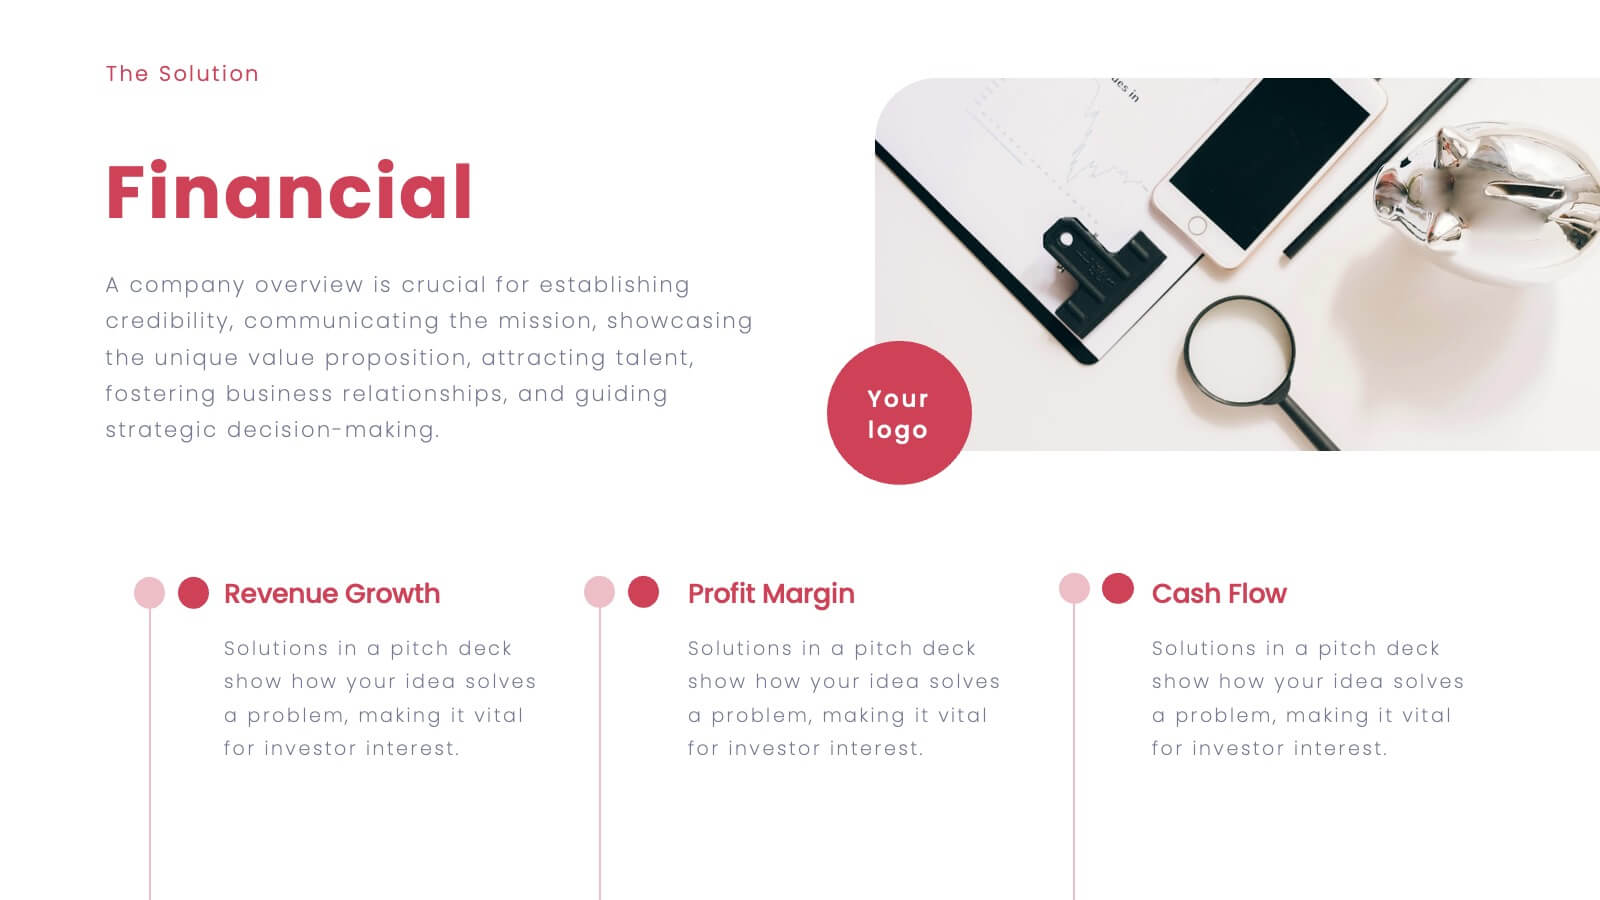
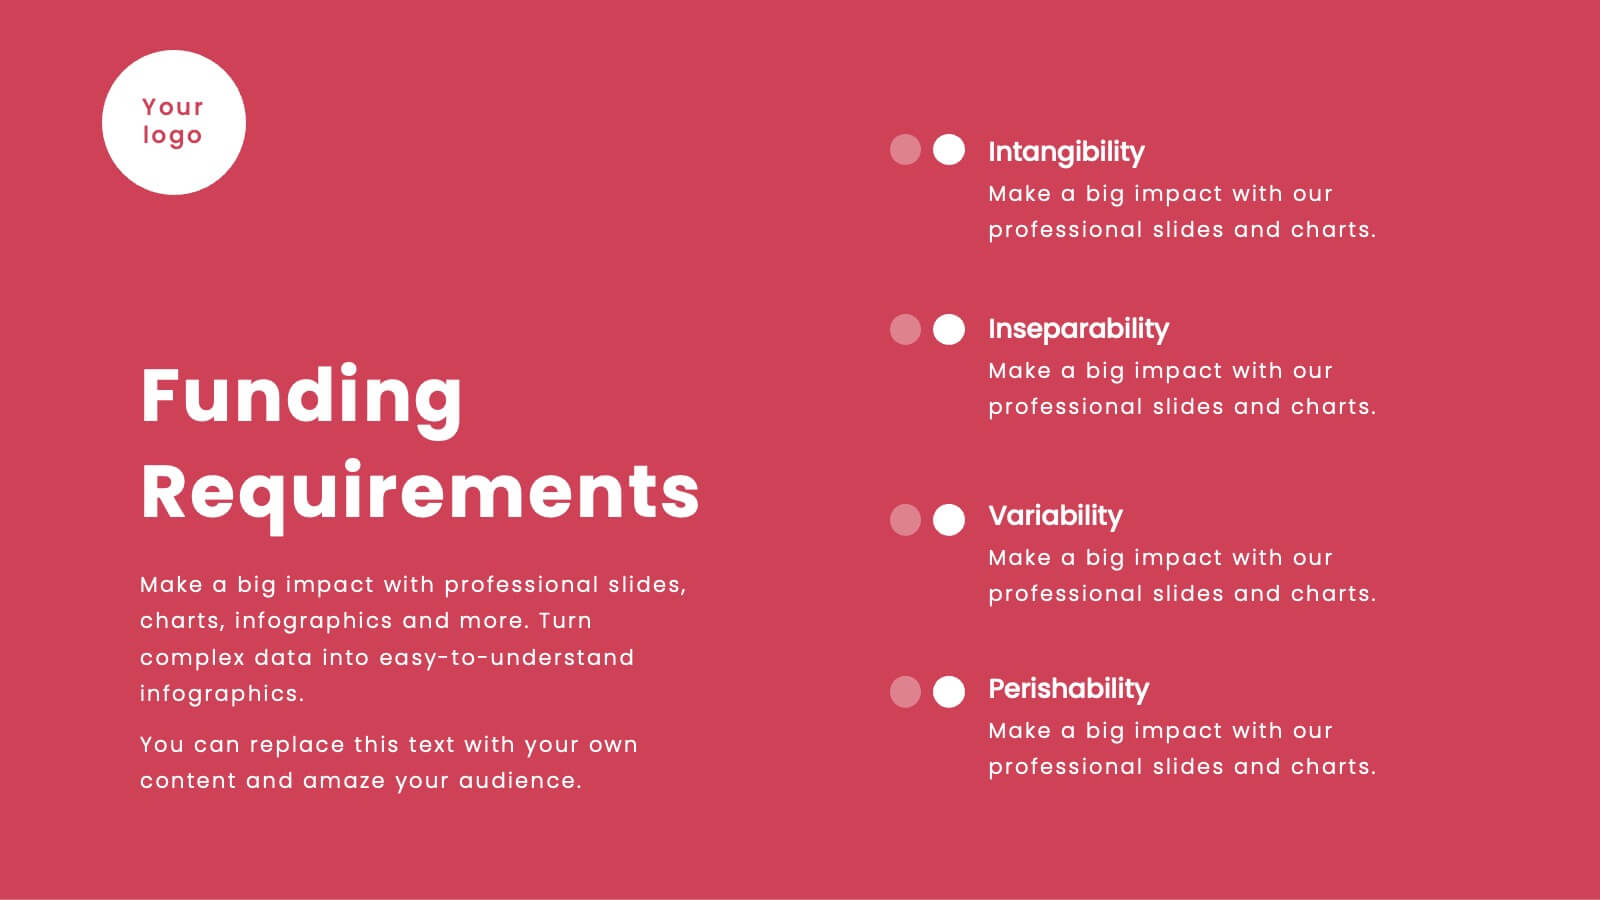
Vortex Startup Pitch Deck Presentation
Launch your ideas into action with this vibrant red pitch deck template, designed to captivate and inform potential investors. It covers everything from company overview to financials and market strategy, ensuring your vision is communicated effectively. Compatible with PowerPoint, Google Slides, and Keynote, this template is perfect for startups seeking to impress and engage.


10 slides
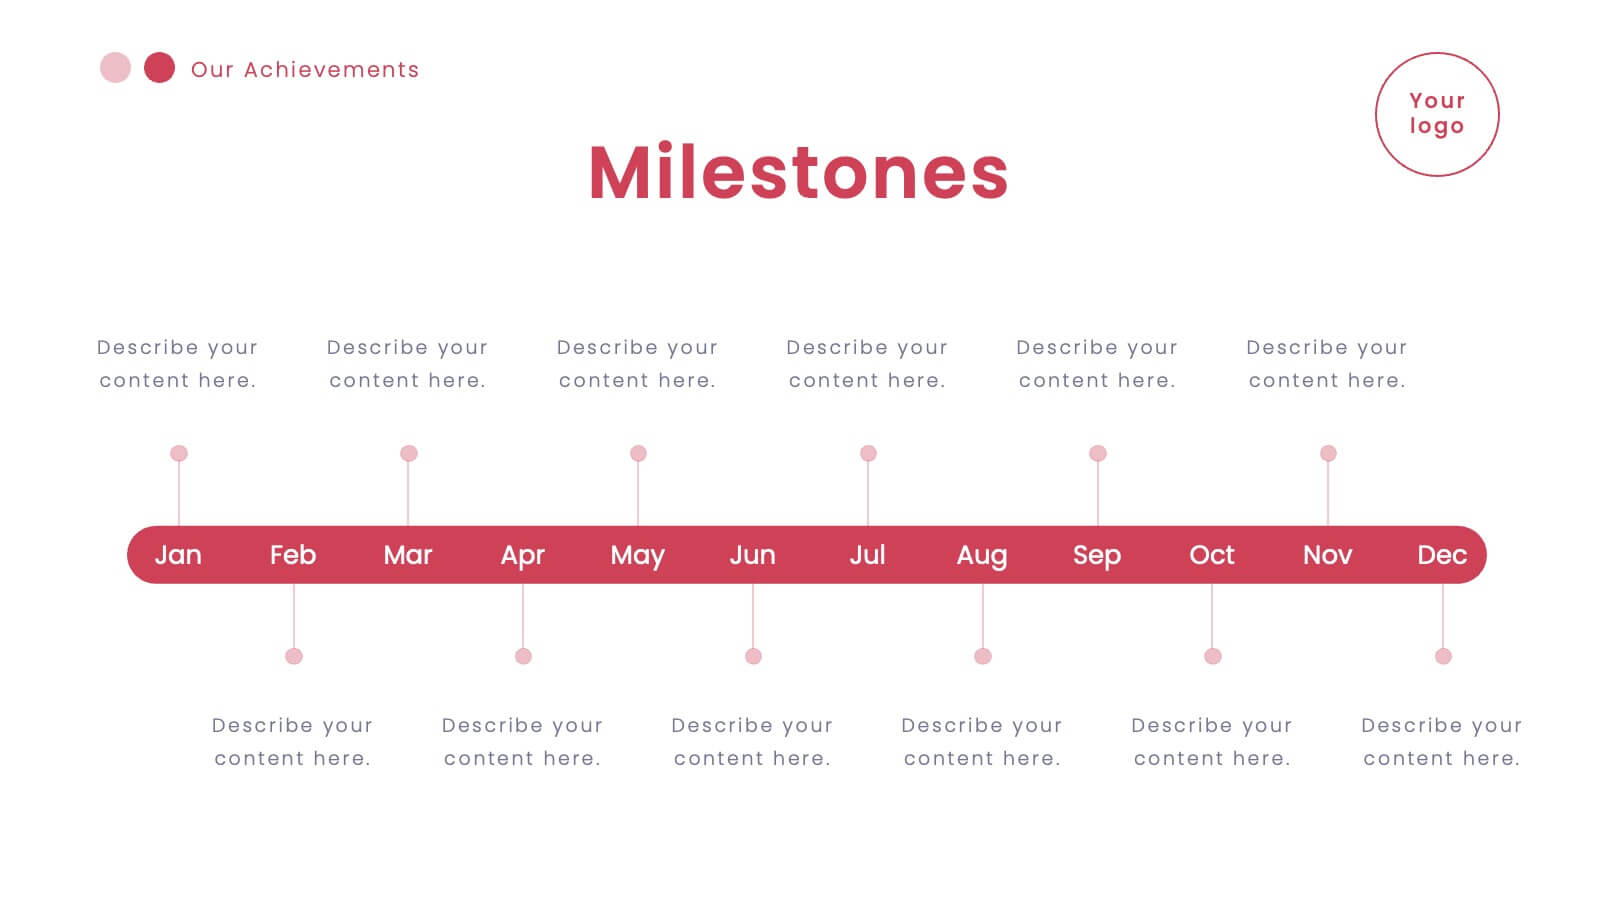
Chronological Event Timeline Presentation
Present events with clarity using this linear timeline slide. Ideal for showcasing project milestones, historical developments, or sequential achievements. Features 5 editable points with icons, titles, and dates for easy customization. Compatible with PowerPoint, Keynote, and Google Slides—perfect for planners, managers, educators, and strategists needing organized time-based visuals.