


Features
- 6 Unique slides
- Fully editable and easy to edit in Microsoft Powerpoint, Keynote and Google Slides
- 16:9 widescreen layout
- Clean and professional designs
- Export to JPG, PDF or send by email


Do you have any questions?
Recommend


5 slides
Myths & Facts About Cases Of Mass Hysteria Infographics
Delve into the intriguing world of collective human psychology with myths & facts about cases of mass hysteria infographics. Set against an engaging purple backdrop, these infographics are designed to captivate, educate, and debunk misconceptions surrounding mass hysteria events. Ideal for historians, educators, psychologists, and students. The creative use of vibrant colors and compelling icons help in breaking down complex psychological phenomena into understandable content, making it easier to spark discussion on this fascinating subject. Whether it's for academic purposes, or informational content, this template stands out by blending education with intriguing storytelling.


7 slides
Buyer Persona Guide Infographic
Elevate your marketing strategy with our Buyer Persona Guide Infographic Template, designed to distill complex customer data into stunning, easy-to-understand visual profiles. This template is a canvas for creativity, allowing marketers to paint detailed portraits of their ideal customers using a mix of vibrant colors, engaging layouts, and succinct text. Craft each persona with care, detailing demographics, preferences, behaviors, and needs, all laid out in an aesthetically pleasing format that makes data pop off the page. Whether you're presenting to stakeholders, guiding your content strategy, or training your sales team, these visuals serve as your roadmap to deeper customer connections. Fully customizable to reflect your brand's unique voice and style, this template adapts seamlessly to your needs, ensuring that every insight into your audience is not just informative but also visually captivating. It's an essential tool for anyone looking to enhance their understanding of their market and refine their approach to meet customer demands.


7 slides
Supply Chain Logistic Infographics
Streamline your logistics insights with our Supply Chain Logistics Infographic, tailored for logistics managers, supply chain analysts, and operations directors. This infographic provides a visual tool to depict the intricacies and flow of your supply chain from procurement to distribution. Our infographic offers a comprehensive layout to map out each step of the supply chain, highlighting key processes such as supplier selection, manufacturing, inventory management, and logistics. It's designed to facilitate a better understanding of each segment's role in the overall efficiency and effectiveness of the supply chain. Customize this infographic with specific data points, such as lead times, turnover rates, and transportation modes, to provide a detailed view of your logistics operations. This SEO-optimized infographic is crafted to make your supply chain data accessible and actionable. Implement our infographic to communicate the complexities of supply chain logistics succinctly, ensuring that stakeholders grasp the full scope of your supply chain dynamics.


6 slides
Target Audience Segmentation Strategy
Break down your audience with clarity using the Target Audience Segmentation Strategy Presentation. This slide features a vibrant vertical funnel layout, ideal for displaying five customer segments or persona categories. Each layer is numbered and color-coded, with connected callout areas for detailed insights. Perfect for marketers, campaign strategists, or product teams presenting customer journey data, audience demographics, or behavioral insights. Fully customizable in PowerPoint, Keynote, and Google Slides—easily align the design with your brand colors and content structure.


8 slides
Directional Diagram with Progress Arrows Presentation
Showcase milestones, track development, or visualize progress with the Directional Diagram with Progress Arrows Presentation. This modern layout features arrow-based steps, making it ideal for roadmaps, process stages, or timeline breakdowns. Customize labels, icons, and colors to suit your message. Fully editable in PowerPoint, Google Slides, and Canva.


6 slides
Supply Chain Management Infographics
Elevate your presentation with our Supply Chain Management template, designed for clarity and impact. The slides are a blend of professional and engaging visuals, perfect for showcasing the intricacies of supply chain operations. Ideal for professionals and educators, they simplify complex logistics concepts into understandable visuals. The design is clean, making it perfect for business presentations that need to convey detailed processes and strategies effectively. With these slides, you're equipped to deliver a powerful message about the importance of streamlined supply chain management.


5 slides
Banking and Rewards Credit Card Presentation
Highlight the value of credit card programs and customer incentives with this engaging rewards-themed infographic layout. The dynamic card and path visuals help illustrate benefits, user behavior, or loyalty stages effectively. Perfect for banking institutions, fintech startups, or rewards program pitches. Fully customizable in PowerPoint, Keynote, and Google Slides.


2 slides
Weekly Agenda Presentation
Keep your week running smoothly with a clean, organized layout that highlights priorities, tasks, and key reminders at a glance. This presentation makes planning effortless, helping teams stay aligned and focused throughout the week. Ideal for meetings, schedules, and productivity workflows. Fully compatible with PowerPoint, Keynote, and Google Slides.


5 slides
How to Prevent Cyberbullying Infographics
Cyberbullying is a serious issue that can have detrimental effects on individuals' mental and emotional well-being. These vertical infographics provide essential information and tips for preventing cyberbullying. These are designed to raise awareness about the issue and educate individuals on how to effectively address and prevent cyberbullying incidents. The infographics feature a visually appealing design with attention-grabbing colors, icons, and illustrations. The engaging visuals are intended to capture the attention of the audience and convey the seriousness of the topic. The infographics offer practical tips and strategies for preventing cyberbullying.


8 slides
Team Roles & Skills Chart Presentation
Bring your team’s strengths to life with this clean, engaging slide designed to highlight individual roles, skill levels, and key capabilities. It helps teams clearly visualize expertise, compare competencies, and communicate responsibilities with ease. Fully editable and compatible with PowerPoint, Keynote, and Google Slides.


26 slides
Protecting Your Digital Assets with Cybersecurity Presentation Template
Safeguard your digital world with this sleek and professional presentation on protecting your digital assets with cybersecurity! This template is designed to simplify complex concepts while showcasing the importance of online safety, data protection, and risk management. Featuring modern layouts, detailed infographics, and customizable charts, it’s ideal for exploring cybersecurity strategies, emerging threats, or best practices for organizations and individuals. The polished design, complete with high-tech visuals and a calming color palette, ensures your audience stays engaged while absorbing critical information. Perfect for IT professionals, educators, or businesses, this template is fully compatible with PowerPoint, Keynote, and Google Slides, making it an essential tool for impactful presentations.

20 slides
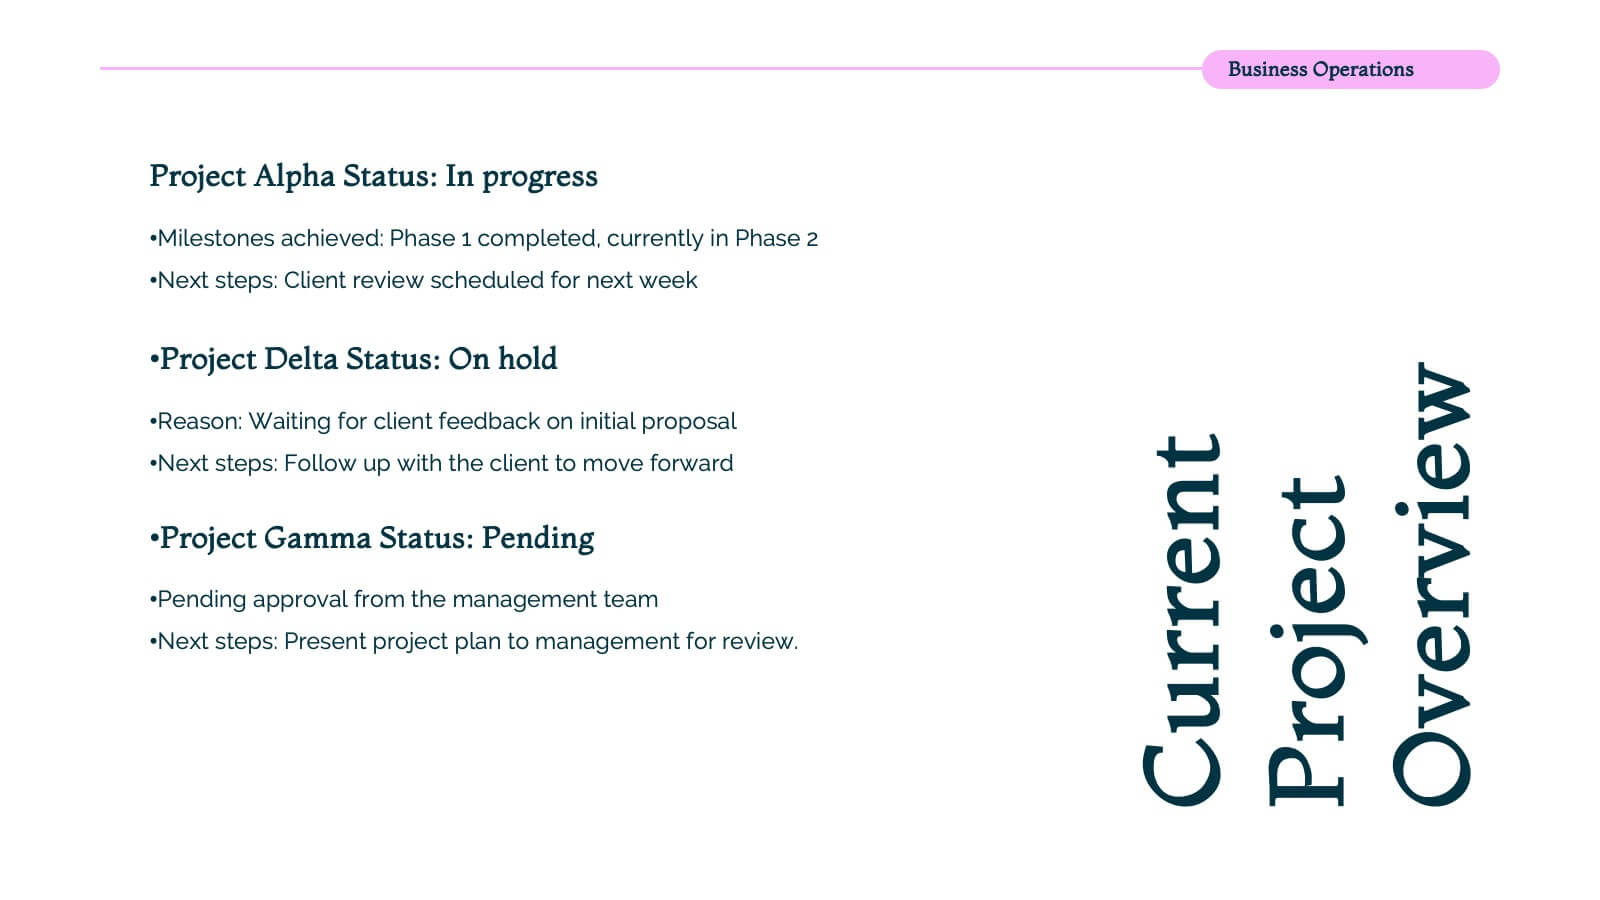
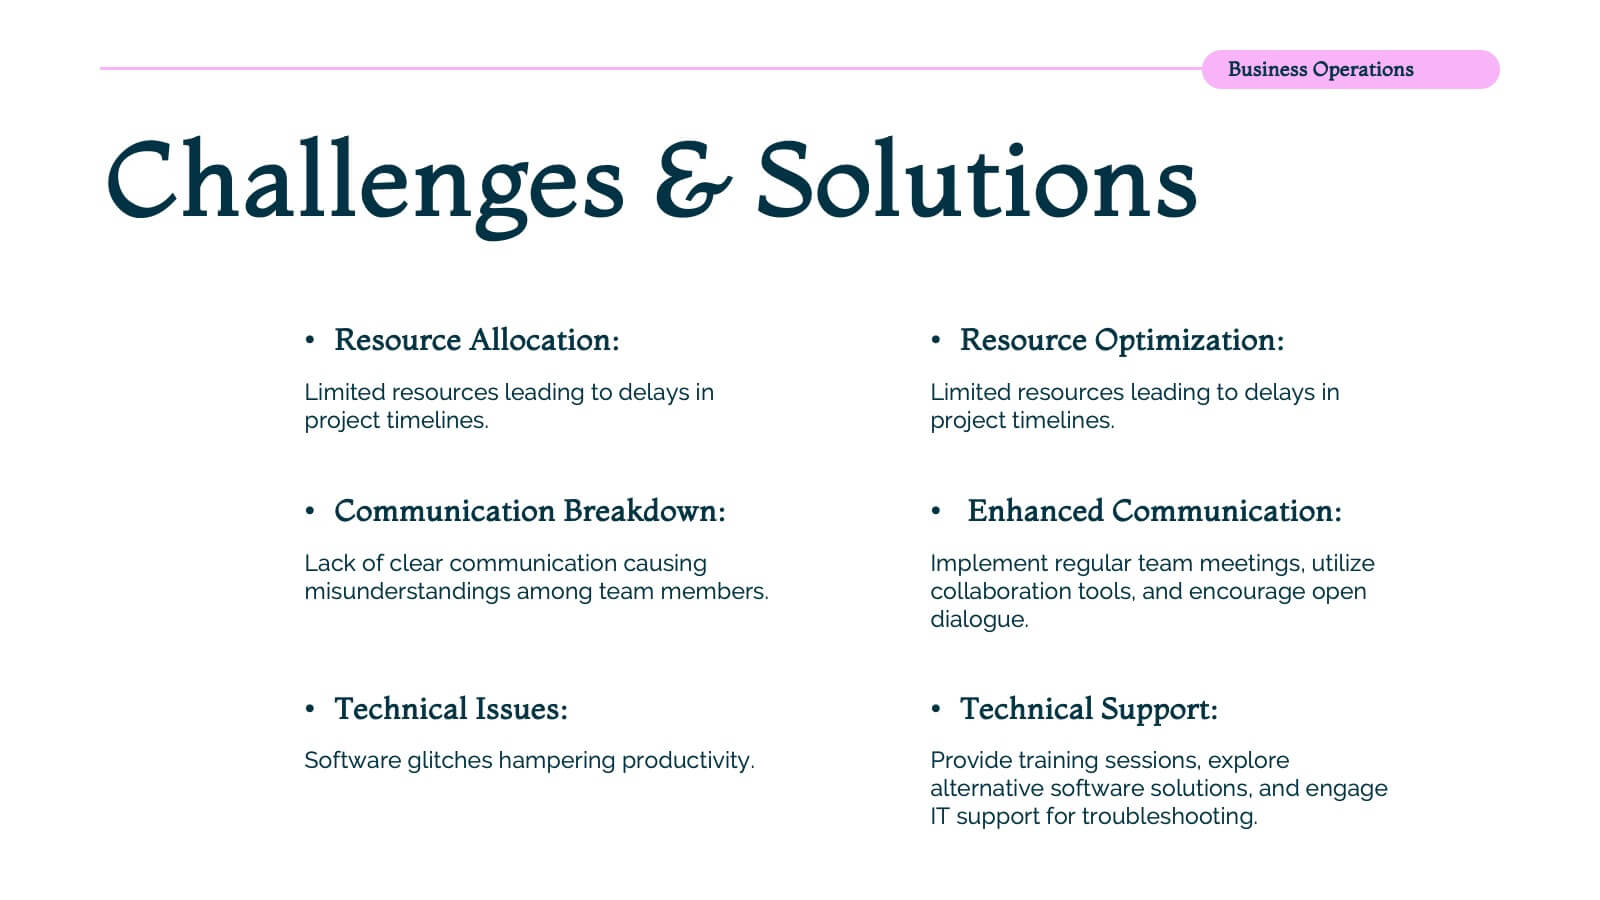
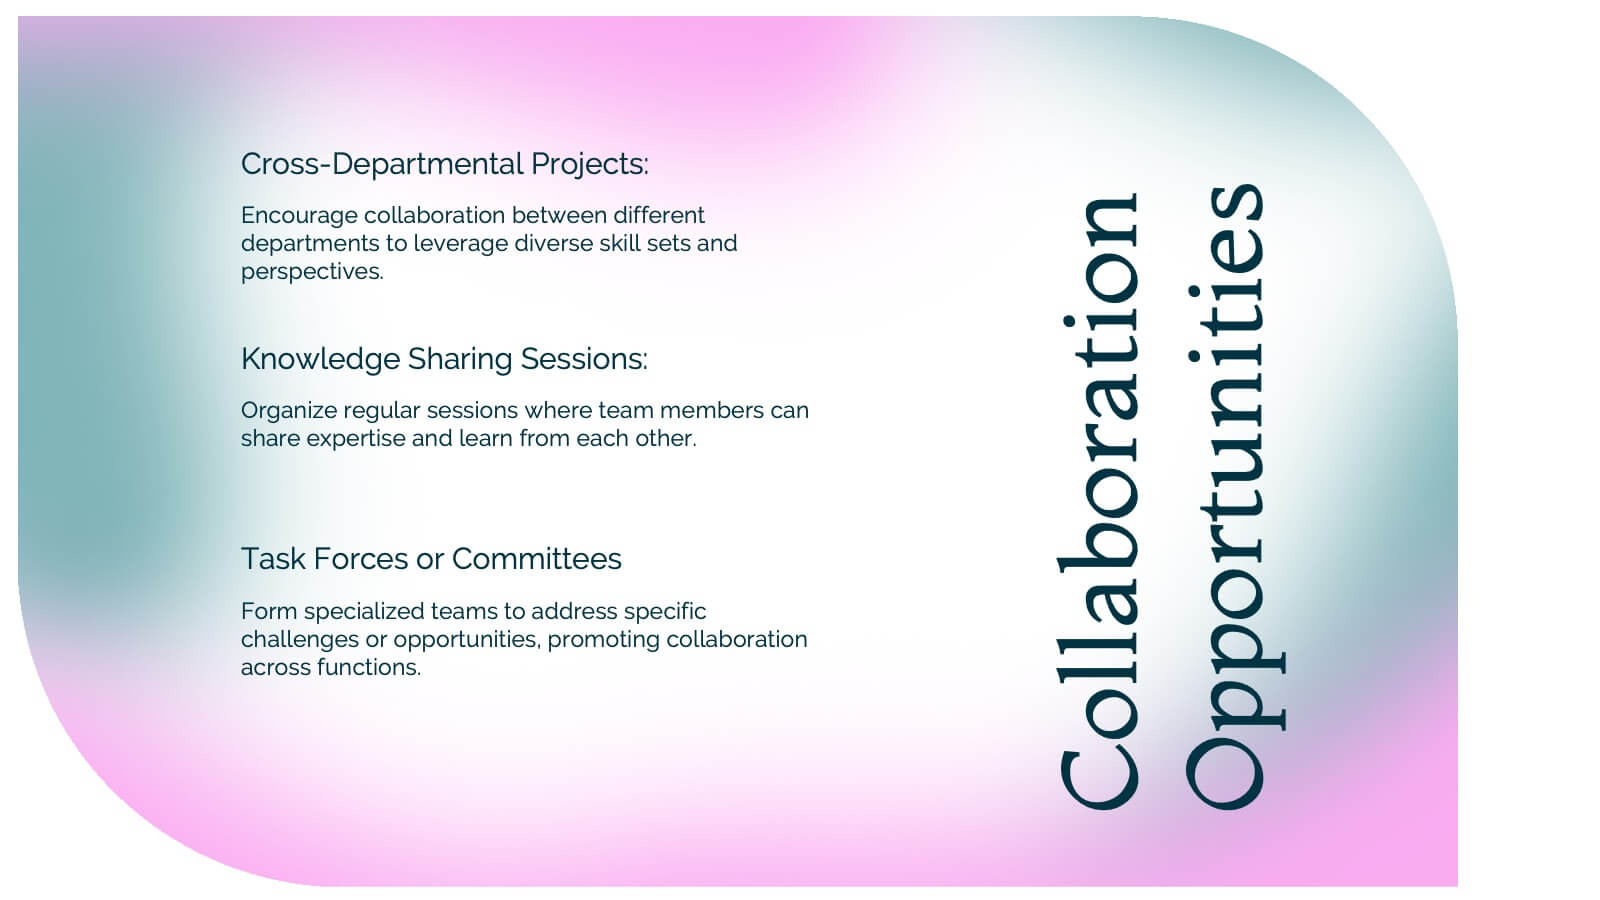
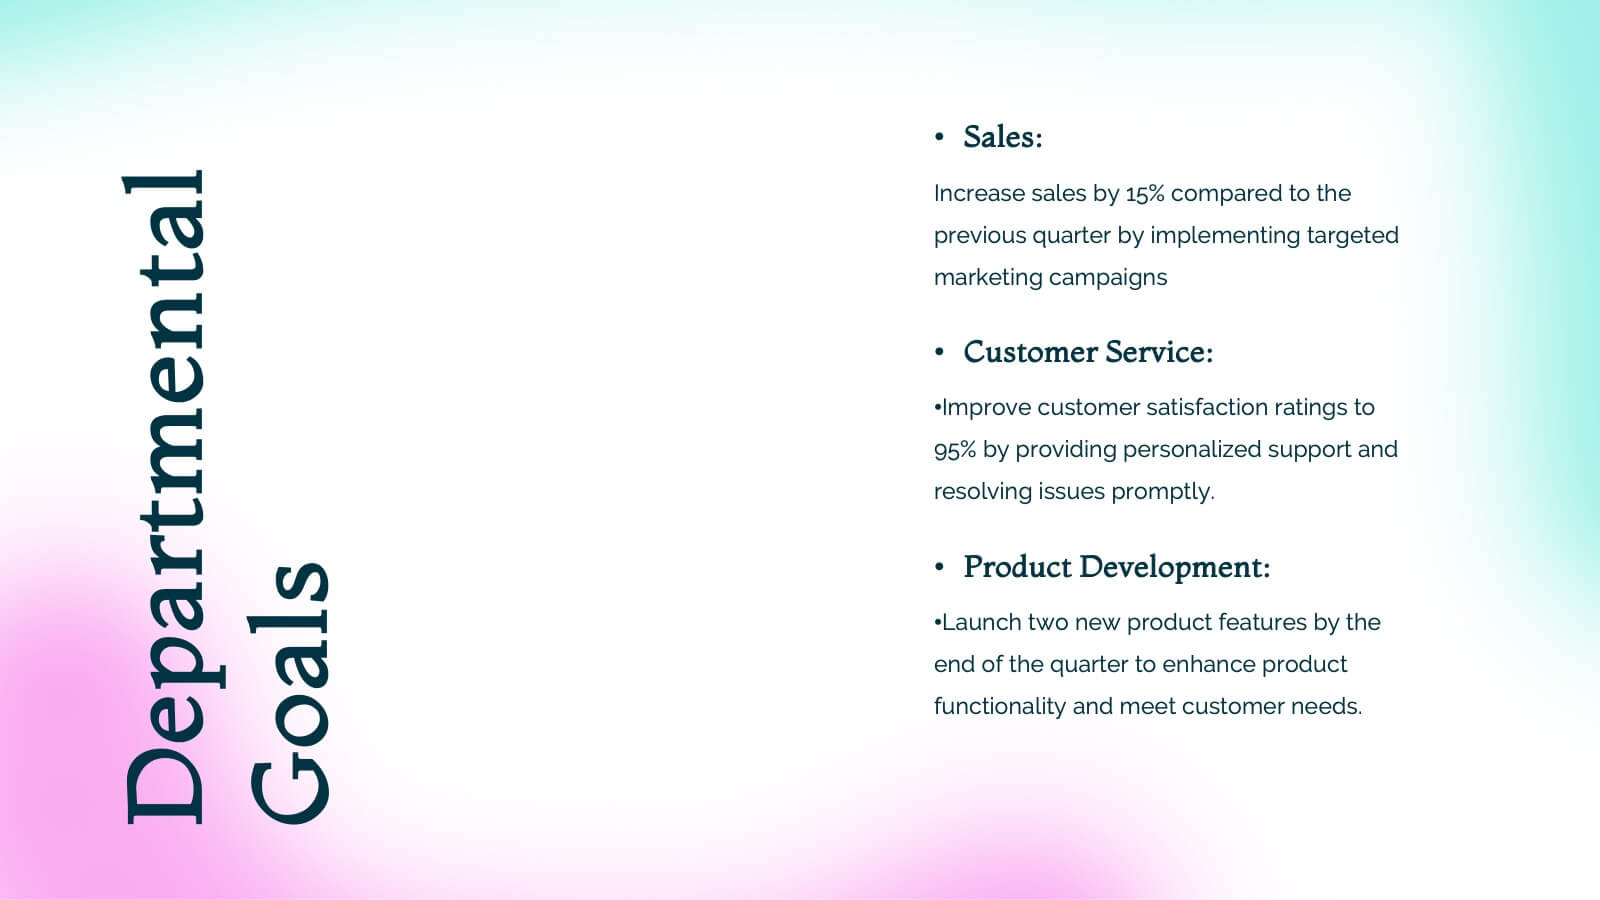
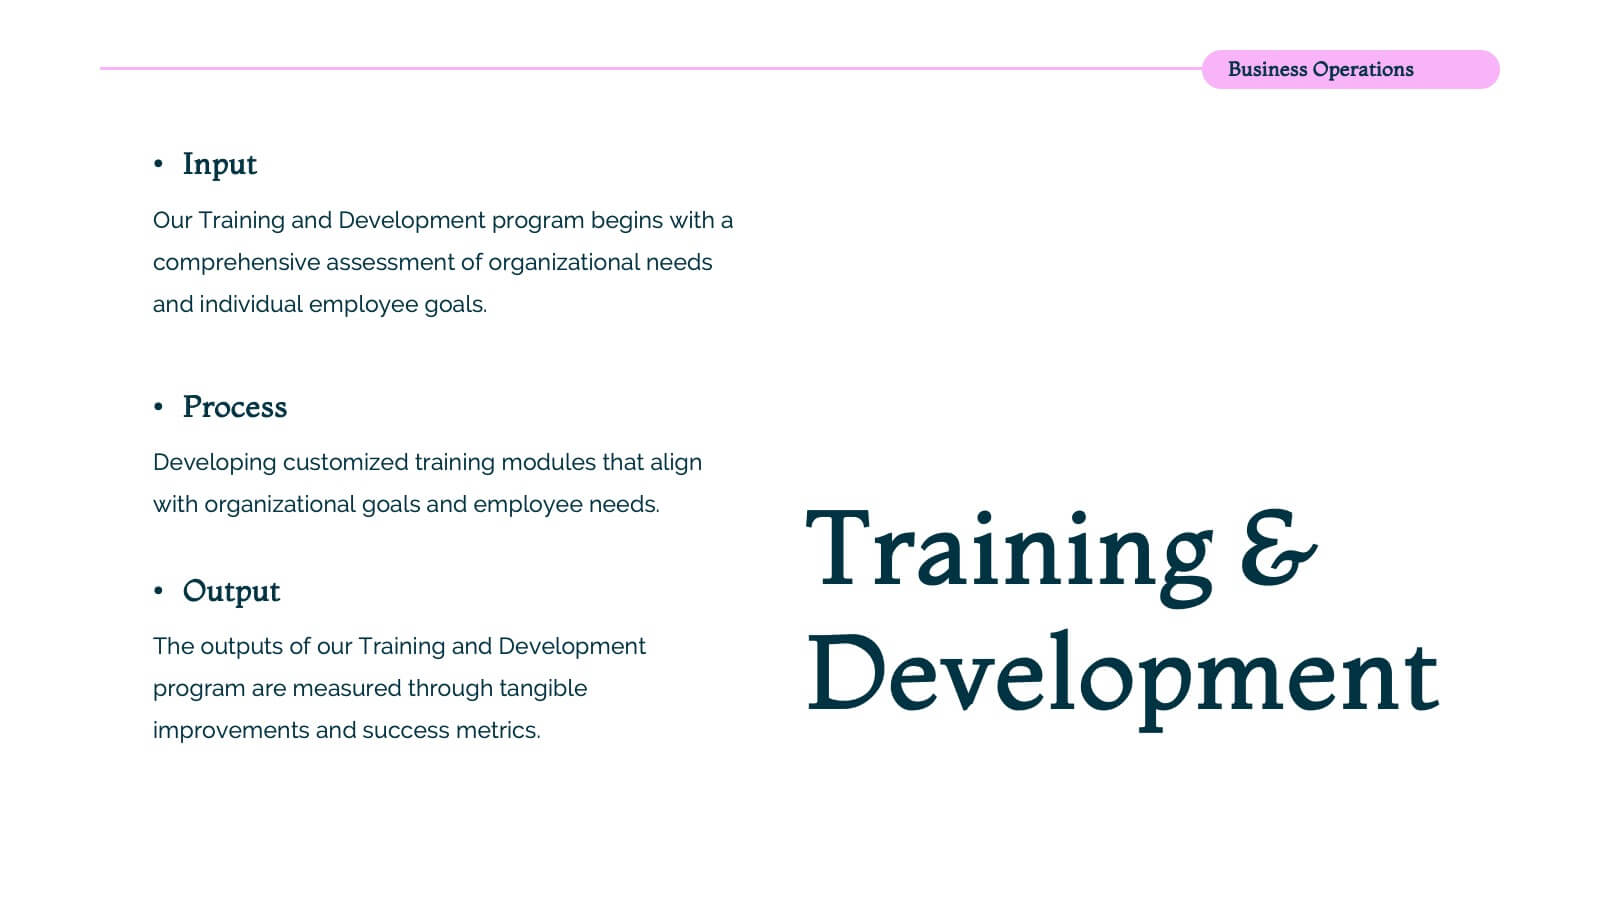
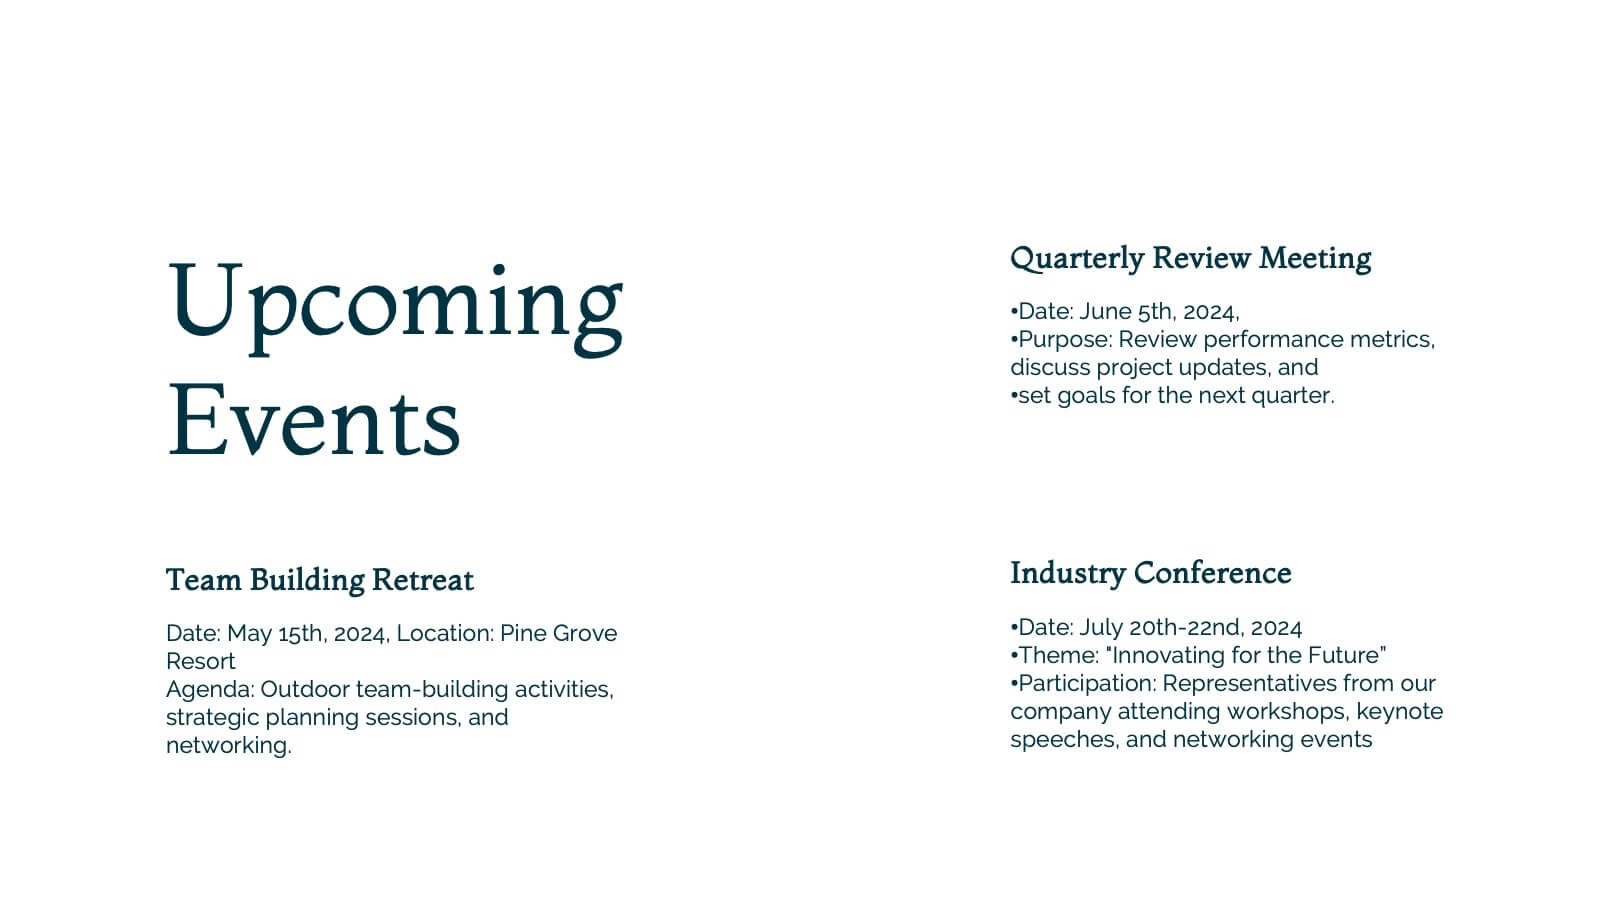
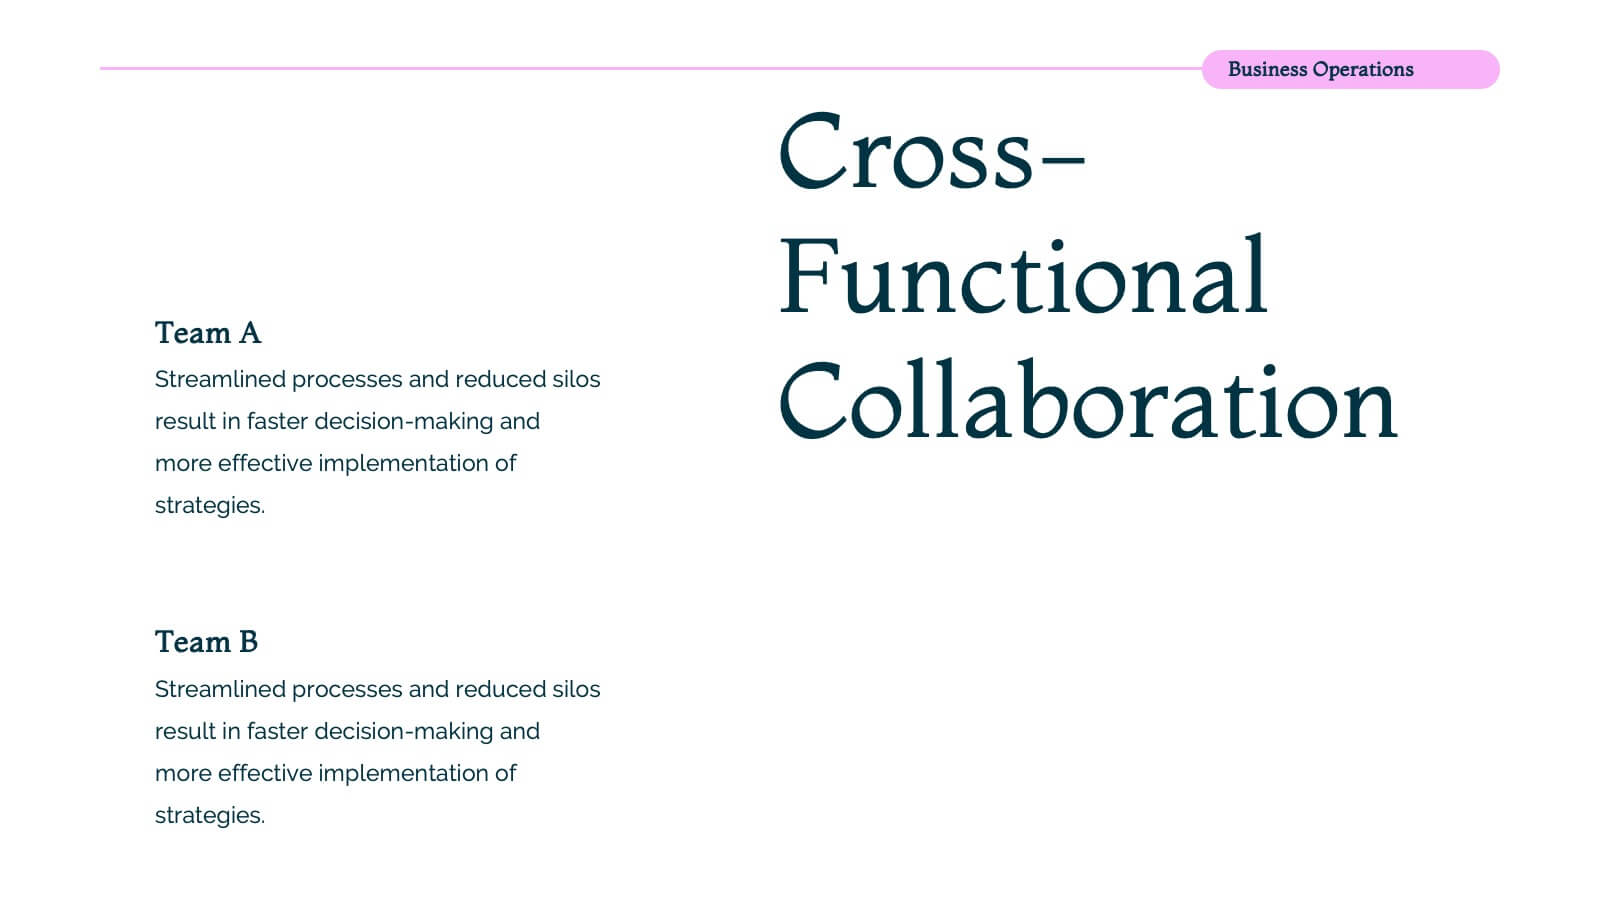
Nova Business Operations Plan Presentation
Create a polished business operations plan with this modern and organized template! It covers everything from team updates and project overviews to resource allocation and collaboration opportunities. Perfect for structuring departmental goals, process improvements, and employee recognition. Compatible with PowerPoint, Keynote, and Google Slides for a seamless, professional presentation.


4 slides
Breast Cancer Awareness Campaign Presentation
Raise awareness with impact using the Breast Cancer Awareness Campaign Presentation. This visually engaging design uses symbolic visuals to highlight key messages, educate audiences, and inspire action. Perfect for nonprofit initiatives, educational sessions, or health campaigns. Fully editable in PowerPoint, Google Slides, Keynote, and Canva for easy customization.


6 slides
Organizational Structure Framework Presentation
Unlock the potential of your organization with our Organizational Structure Framework template. This versatile tool is designed to help you present and analyze various business structures, from chain-of-command to functional divisions. Ensure clear, concise communication of strategies across your organization. Perfect for use in PowerPoint, Keynote, and Google Slides, this template supports a professional presentation of your organizational strategy, ensuring alignment and clarity in your business processes.


4 slides
Organizational Hierarchy Infographic
Showcase your team’s structure with a modern, photo-friendly hierarchy layout. This editable infographic is perfect for company overviews, team introductions, or org chart visualizations. Easily customizable in PowerPoint, Keynote, and Google Slides.


8 slides
Business Framework Strategy
Simplify your strategy breakdown with this layered, step-by-step infographic. Ideal for presenting three core pillars or stages of a business model, this layout highlights each section with a bold letter identifier (A, B, C), vivid icons, and space for supporting content. Fully editable in PowerPoint, Keynote, and Google Slides.


6 slides
Industry Analysis Porter's 5 Forces Presentation
Analyze industry competition with this Porter's Five Forces template! This structured layout visually breaks down key factors like buyer power, supplier influence, competitive rivalry, new market entrants, and substitution threats, making it ideal for strategic planning and market assessments. Fully customizable and compatible with PowerPoint, Keynote, and Google Slides.