


Features
- 8 Unique slides
- Fully editable and easy to edit in Microsoft Powerpoint, Keynote and Google Slides
- 16:9 widescreen layout
- Clean and professional designs
- Export to JPG, PDF or send by email


Do you have any questions?
Recommend


10 slides
5-Level Circular Diagram Presentation
Visualize complex concepts with this professional 5-Level Circular Diagram template. Perfect for business strategies, project planning, and hierarchical structures, it provides a clear, layered approach. Fully editable and compatible with PowerPoint, Keynote, and Google Slides, this design ensures a polished, impactful presentation with structured, easy-to-understand visuals.


7 slides
Growth Mindset Infographic Presentation
A Growth Infographic is a visual representation of data that displays the growth of a particular business, industry, or market over time. It can be used to illustrate growth in areas such as revenue, profits, customer base, or market share. This growth template includes a timeline and graphs that shows the change in data over time, presented in a visually appealing way using icons, symbols, and color-coding. Use this infographic to include additional information such as industry trends, key drivers of growth, and future projections. Easily edit in Powerpoint, Keynote, and Google Slides.


7 slides
Mind Map Project Infographic
A mind map is a visual representation of information, ideas, or concepts arranged around a central topic or theme. This template is a powerful brainstorming and organizational tool that helps individuals or teams visually connect related ideas, explore new connections, and see the bigger picture. This diagram organizes information around a central theme or idea, with branches extending outwards to represent related concepts or tasks. This infographic is perfect for for capturing ideas, and presenting complex information in a structured and easily manner. This template is customizable and compatible with Powerpoint, Keynote, and Google Slides.


4 slides
Sales Strategy 30-60-90 Day Plan
Accelerate your sales team’s performance with this 30-60-90 Day Strategy template. Designed with clean circular progress visuals and clear milestone stages, it helps you outline sales goals, track onboarding, and align strategic efforts. Ideal for new hires, quarterly planning, or sales enablement. Fully editable in PowerPoint, Keynote, and Google Slides.


6 slides
Four Pillar of Success Presentation
Build a strong foundation for your ideas with this elegant and structured infographic layout. Perfect for presenting key principles, business strategies, or organizational goals, it balances clarity and design beautifully. Fully customizable and compatible with PowerPoint, Keynote, and Google Slides for seamless editing and professional presentations.


7 slides
AIDA Selling Model Infographic
The AIDA model is a widely used marketing and advertising framework that outlines the stages a consumer typically goes through when engaging with a product or service. This infographic template is a dynamic and compelling tool designed to conquer the attention and minds of your audience. AIDA, the cornerstone of marketing, stands for Attention, Interest, Desire, and Action—an unyielding formula for successful engagement. Fully customizable and compatible with Powerpoint, Keynote, and Google Slides. Prepare to take your marketing strategies to exhilarating heights with this infographic.


7 slides
Europe Countries Map Infographic
This Europe Countries Map infographic template is a versatile presentation tool for showcasing various data across European nations. The template is fully compatible with PowerPoint, Google Slides, and Keynote and features different infographic styles, such as color-coded maps, bar charts, and statistical representations. It is perfect for displaying country-specific information like population size, economic statistics, or any other relevant data. The clear and concise design ensures that viewers can easily interpret the information, making it suitable for educators, students, business professionals, and anyone needing to present European data in an engaging and informative manner.


10 slides
Sustainable Farming Practices
Present eco-friendly agricultural strategies with this visually structured layout. Featuring a linear process flow and eco-themed icons, this slide is ideal for outlining key sustainability practices, steps, or phases. Use it for presentations on regenerative agriculture, organic farming, or environmental policy. Fully editable in PowerPoint, Keynote, and Google Slides.


10 slides
Business Performance Metrics Presentation
Track and display your business metrics effectively with the "Business Performance Metrics" presentation templates. These visually engaging slides are designed to help you present key performance indicators in a clear and structured manner, enhancing understanding and decision-making. Ideal for corporate presentations, these templates are fully compatible with PowerPoint, Keynote, and Google Slides, ensuring seamless integration into your workflow.


20 slides
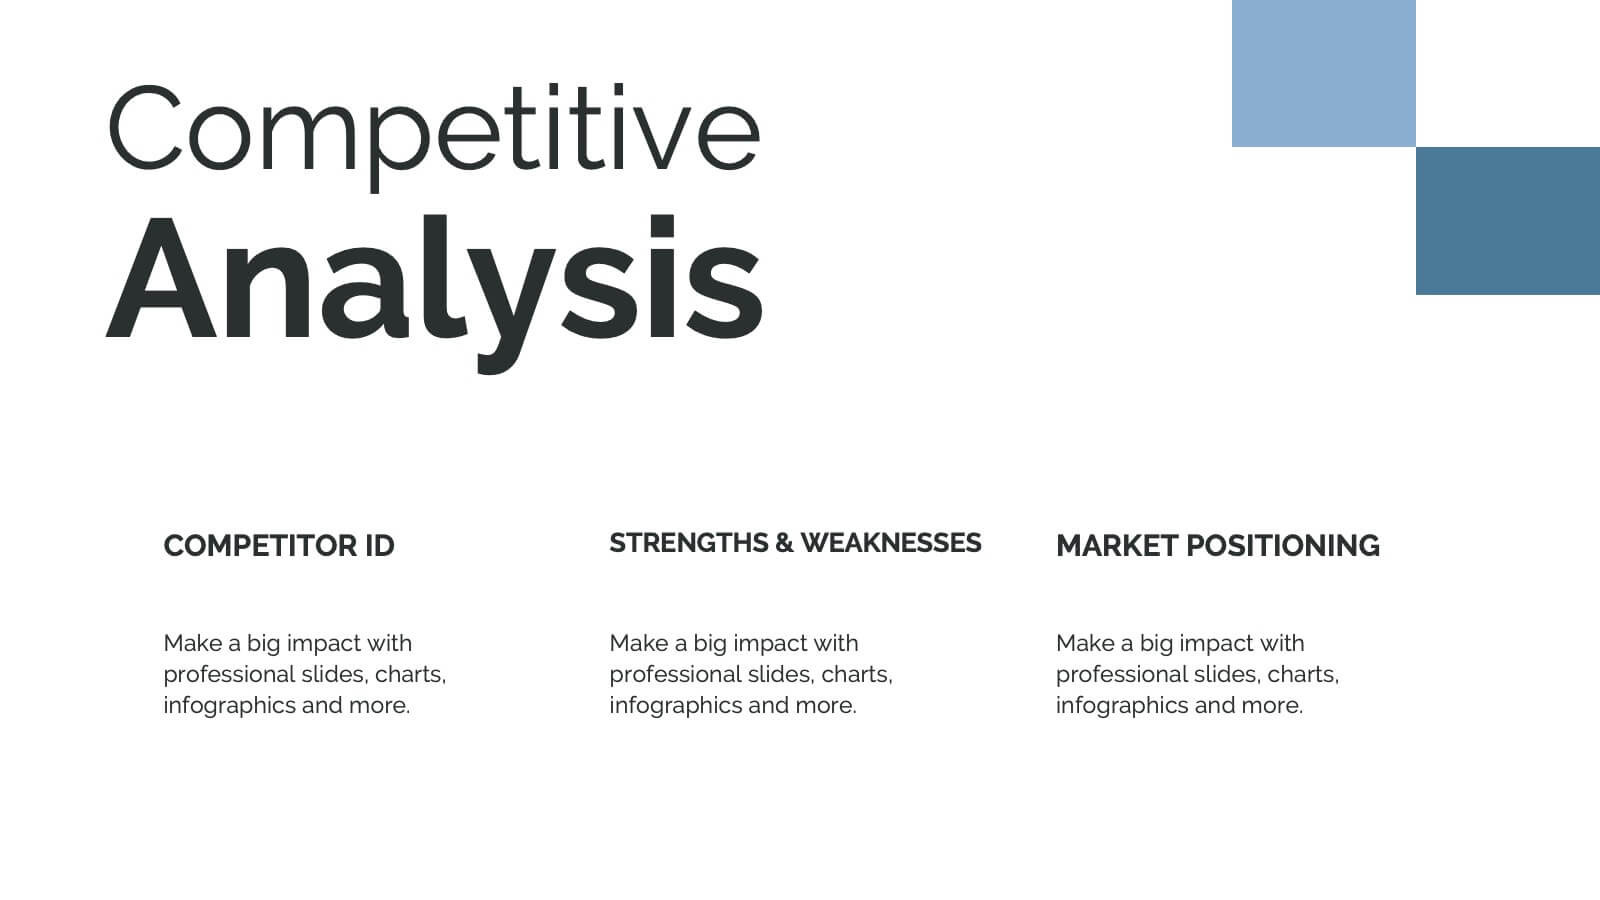
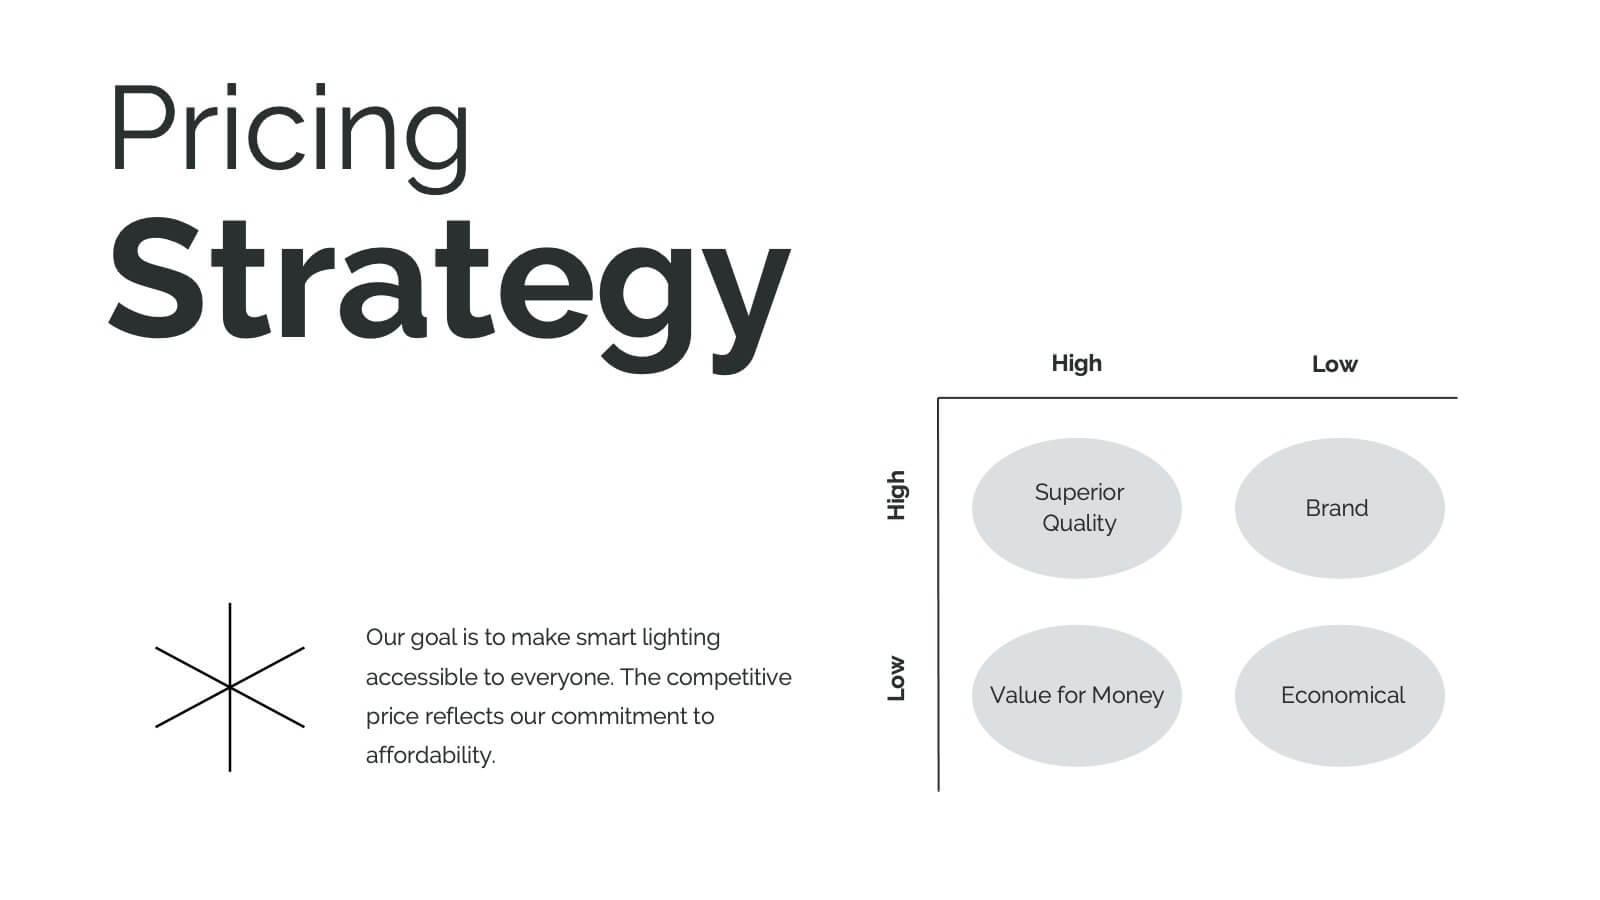
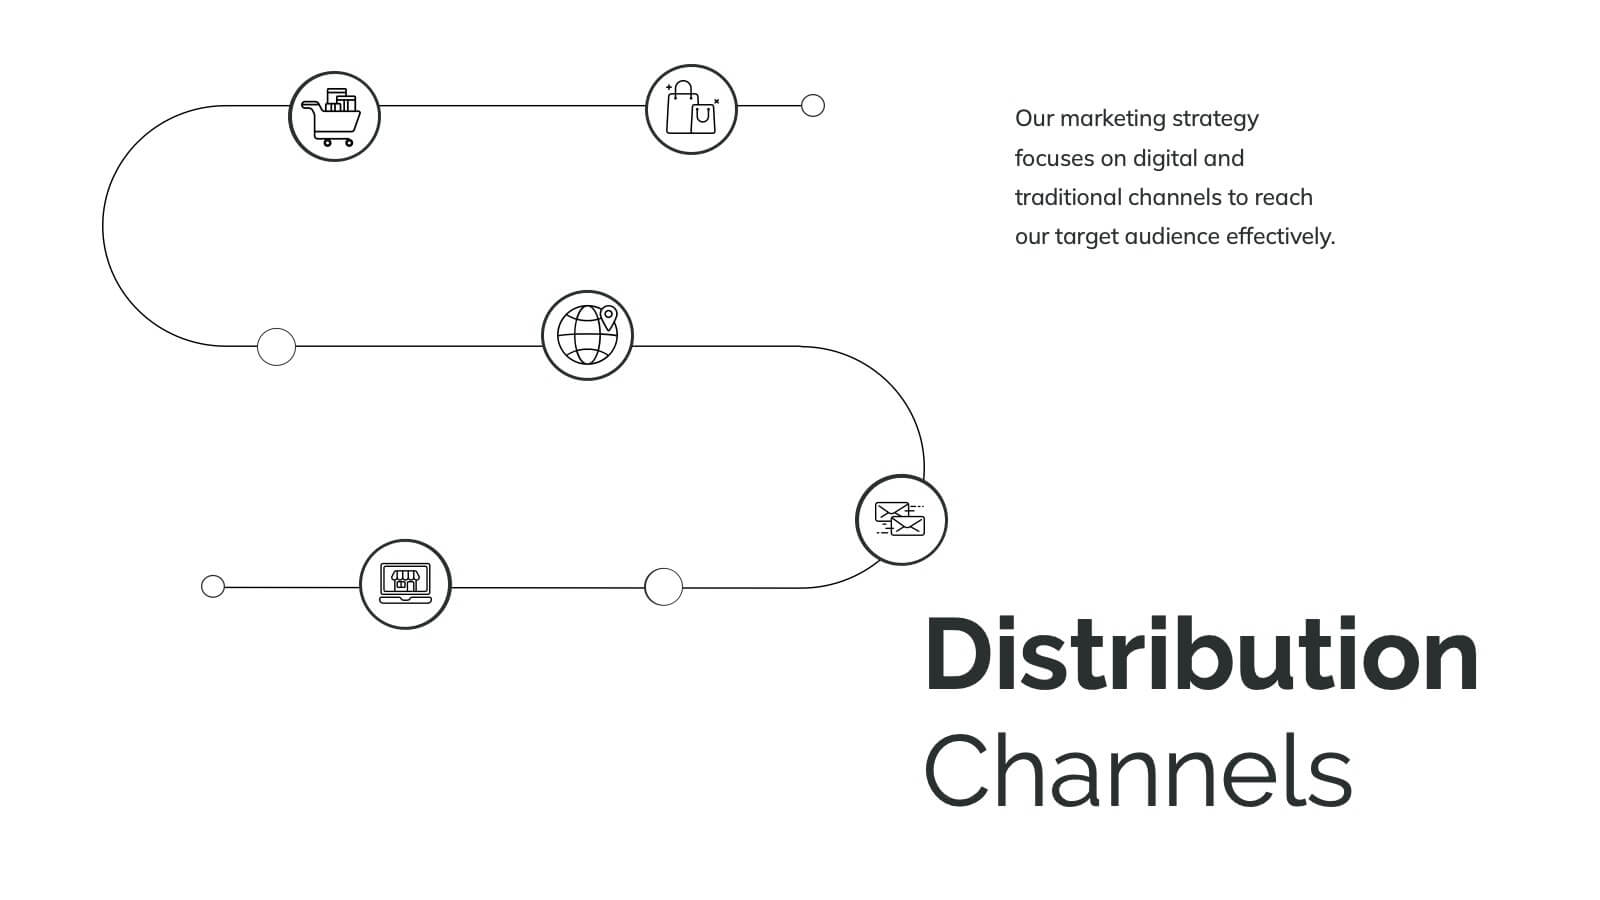
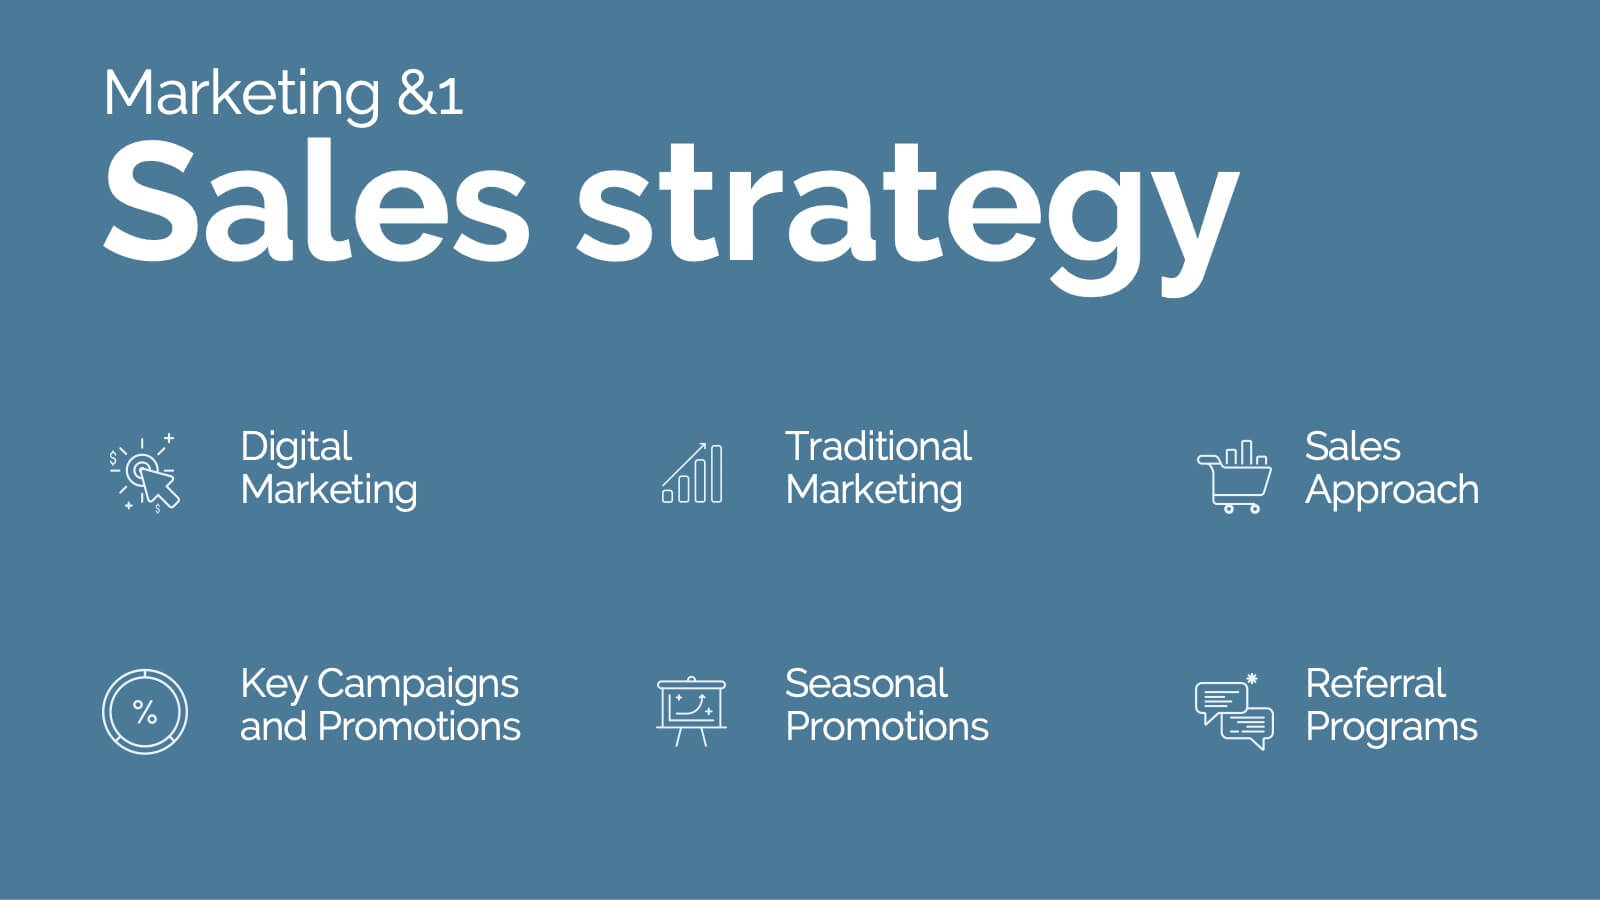
Hydra Product Launch Presentation
Unveiling your latest product has never been easier or more captivating! This comprehensive presentation template covers every aspect of your product's journey—from launch to competitive analysis. Engage your audience with detailed slides on features, target analysis, and pricing strategy. Seamlessly compatible with PowerPoint, Keynote, and Google Slides for maximum flexibility and impact.


5 slides
Demographic and Psychographic Segments Presentation
Break down your audience with clarity using the Demographic and Psychographic Segments Presentation. This slide is ideal for showcasing four key consumer dimensions through a centered circular layout and quadrant icons. Perfect for marketing campaigns, branding strategies, and audience targeting. Fully editable in Canva, PowerPoint, Keynote, or Google Slides.


5 slides
Target Market and Audience Segmentation Presentation
Identify and engage your ideal audience with the Target Market and Audience Segmentation presentation. This clear, timeline-style infographic uses a bullseye layout to highlight key market segments and their progression. Ideal for marketing strategies, customer profiling, and campaign planning. Fully customizable in Canva, PowerPoint, and Google Slides.


5 slides
Problem Framing and Opportunity Identification Presentation
Spot challenges and uncover growth potential with this Problem Framing and Opportunity Identification presentation. Ideal for strategy sessions, this layered pyramid layout helps you organize problems from surface-level to root causes while aligning them with strategic opportunities. Fully editable in Canva, PowerPoint, or Google Slides for seamless customization.


8 slides
Cloud Data Storage and Security Presentation
Visualize cloud security effortlessly with this Cloud Data Storage and Security template. Designed for IT teams, cybersecurity professionals, and cloud architects, this slide simplifies complex data protection strategies, storage models, and access controls. Featuring a modern cloud-based layout with clear, structured elements, it ensures easy interpretation of key security components. Fully editable and compatible with PowerPoint, Keynote, and Google Slides for seamless presentations.


5 slides
Comparison Table for Feature Mapping Presentation
Compare your product features with ease using this Comparison Table for Feature Mapping presentation. Ideal for highlighting similarities and differences across multiple offerings, this layout uses clean visuals and color-coded elements to show feature availability per product. Perfect for product teams, marketing, or internal decision-making. Compatible with PowerPoint, Canva, and Google Slides.


6 slides
Territorial Presence Across the Globe Presentation
Visualize your worldwide footprint with this territorial presence map. Highlight key regions using color-coded markers linked to strategic points, teams, or operations. Ideal for corporate overviews, investor updates, and expansion plans. Fully editable and easy to customize in PowerPoint, Keynote, or Google Slides for impactful global presentations.


5 slides
Home Investment and Property Value Presentation
Visualize key real estate insights with this skyline-themed slide, ideal for showcasing home investment data and market value trends. Designed for realtors, analysts, or housing consultants, it features a cityscape layout for clear comparison. Fully editable in PowerPoint, Keynote, and Google Slides for effortless customization and polished presentations.