


Features
- 7 Unique slides
- Fully editable and easy to edit in Microsoft Powerpoint, Keynote and Google Slides
- 16:9 widescreen layout
- Clean and professional designs
- Export to JPG, PDF or send by email.


Do you have any questions?
Recommend


5 slides
Executive Leadership Development Plan
Showcase leadership growth with the Executive Leadership Development Plan Presentation. Designed to visualize a clear progression of skills or initiatives, this four-stage layout uses diagonal segments and icons to represent each development milestone. Ideal for HR, executive coaching, or talent management presentations. Compatible with PowerPoint, Keynote, and Google Slides.


5 slides
Business Innovation Strategy Presentation
Present a compelling Business Innovation Strategy with this modern infographic. Designed to highlight key insights, innovative solutions, and strategic approaches, this template is perfect for business professionals, consultants, and startups. Fully editable and compatible with PowerPoint, Keynote, and Google Slides.


5 slides
Procurement Strategy Presentation
ChatGPT PlusBring clarity and structure to your business process with this modern, visually engaging presentation. Perfect for outlining purchasing plans, supplier relationships, and cost-saving strategies, it helps convey information with precision and flow. Fully customizable and compatible with PowerPoint, Keynote, and Google Slides for seamless editing and professional results.


7 slides
Business Plan Strategy Infographic
A business plan is a written document that outlines a company's goals and the strategy it will use to achieve those goals. This infographic template is a comprehensive roadmap for how a business intends to operate, grow, and succeed in its market. Compatible with Powerpoint, Keynote, and Google Slides. This template is meticulously designed to help you craft a well-structured business plan, empowering entrepreneurs and professionals to navigate their journey to success. Let this be your compass as you navigate the complexities of entrepreneurship and strive for business excellence!


7 slides
E-Learning Infographic Presentation Template
An E-learning Infographic is an informative design that shows all the different ways that e-learning can be used in your classroom, as well as the benefits associated with each one. This infographic illustrates the popularity of e-learning and gives tips for creating compelling learning materials. This template is equipped with all the resources needed to create your e-learning infographic. It comes fully customizable and ready-to-use. This Infographic template provides a bare-bone structure and design, leaving space for you to add your own content and create the best presentation!
4 slides
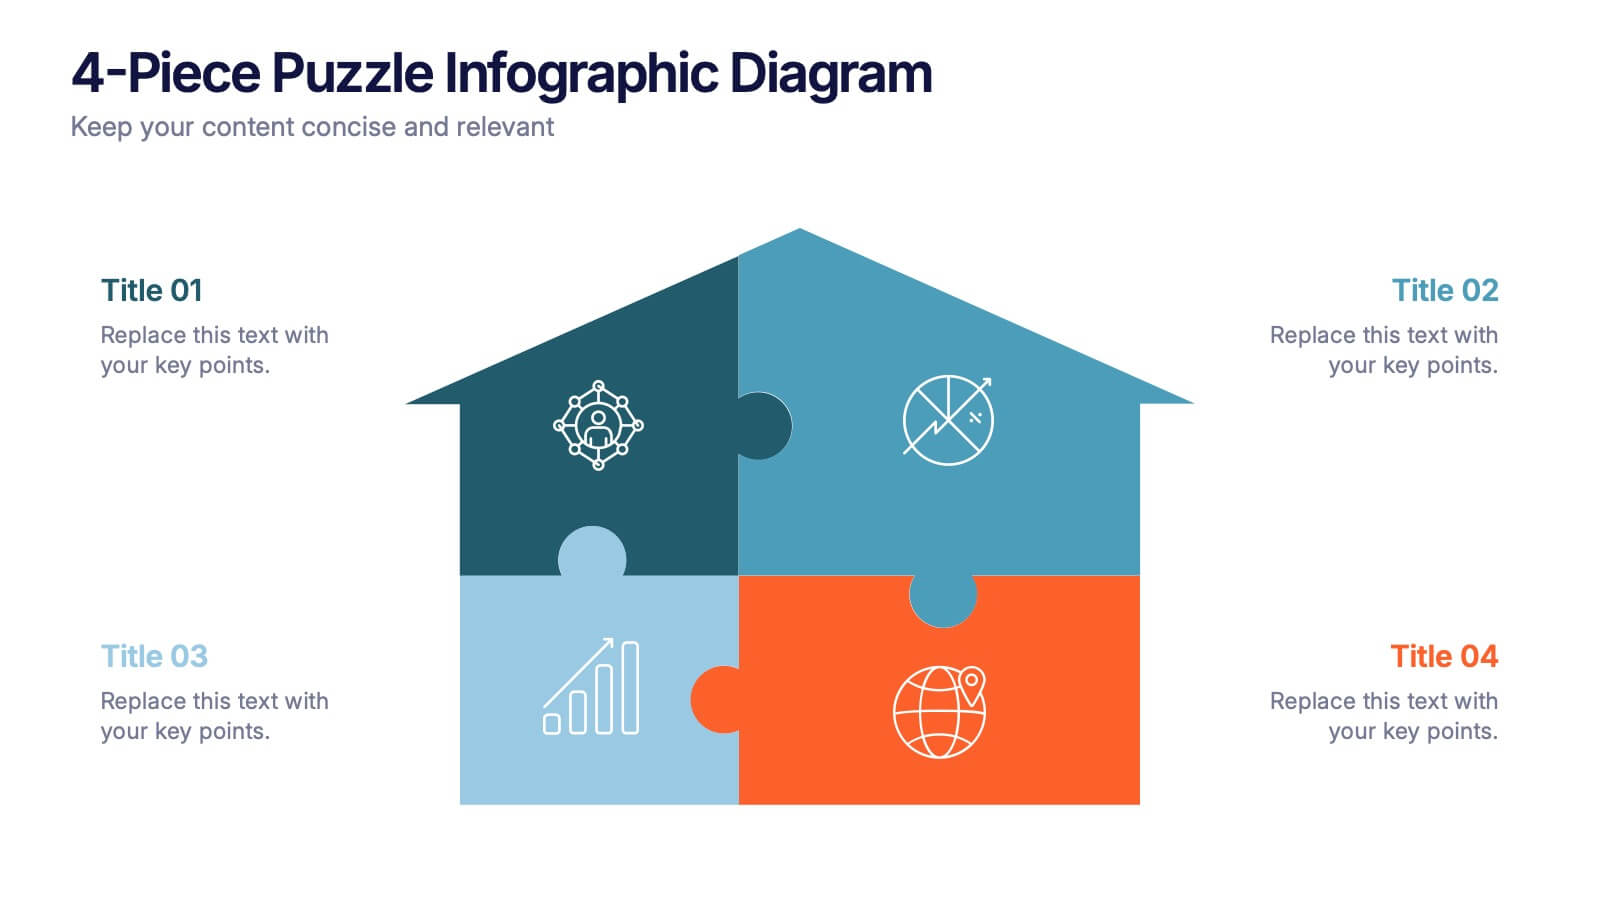
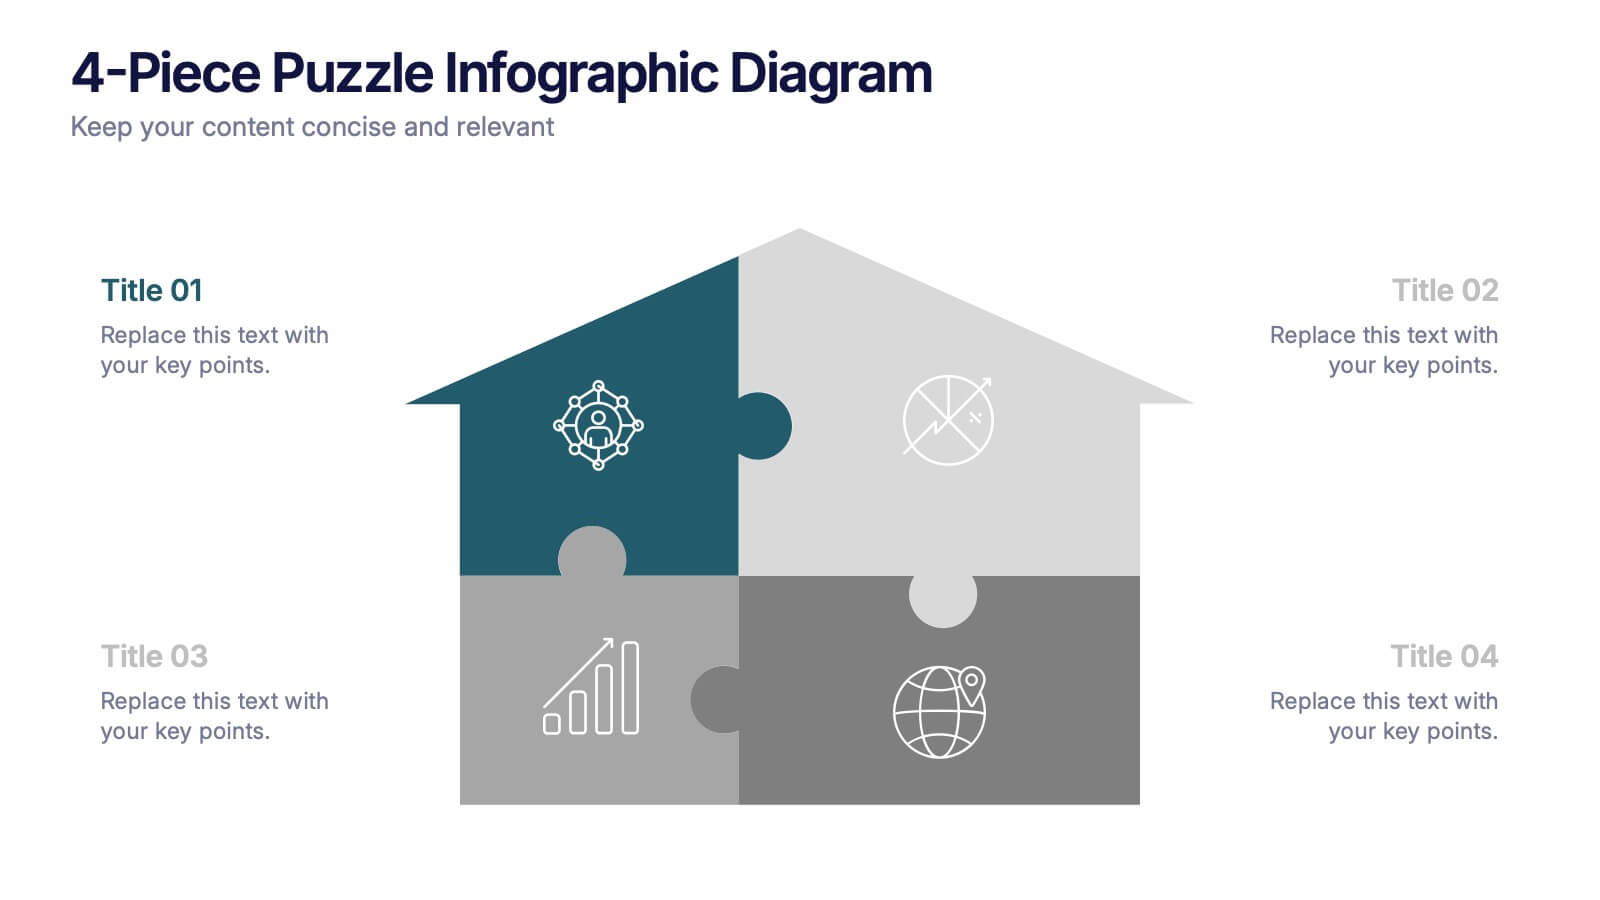
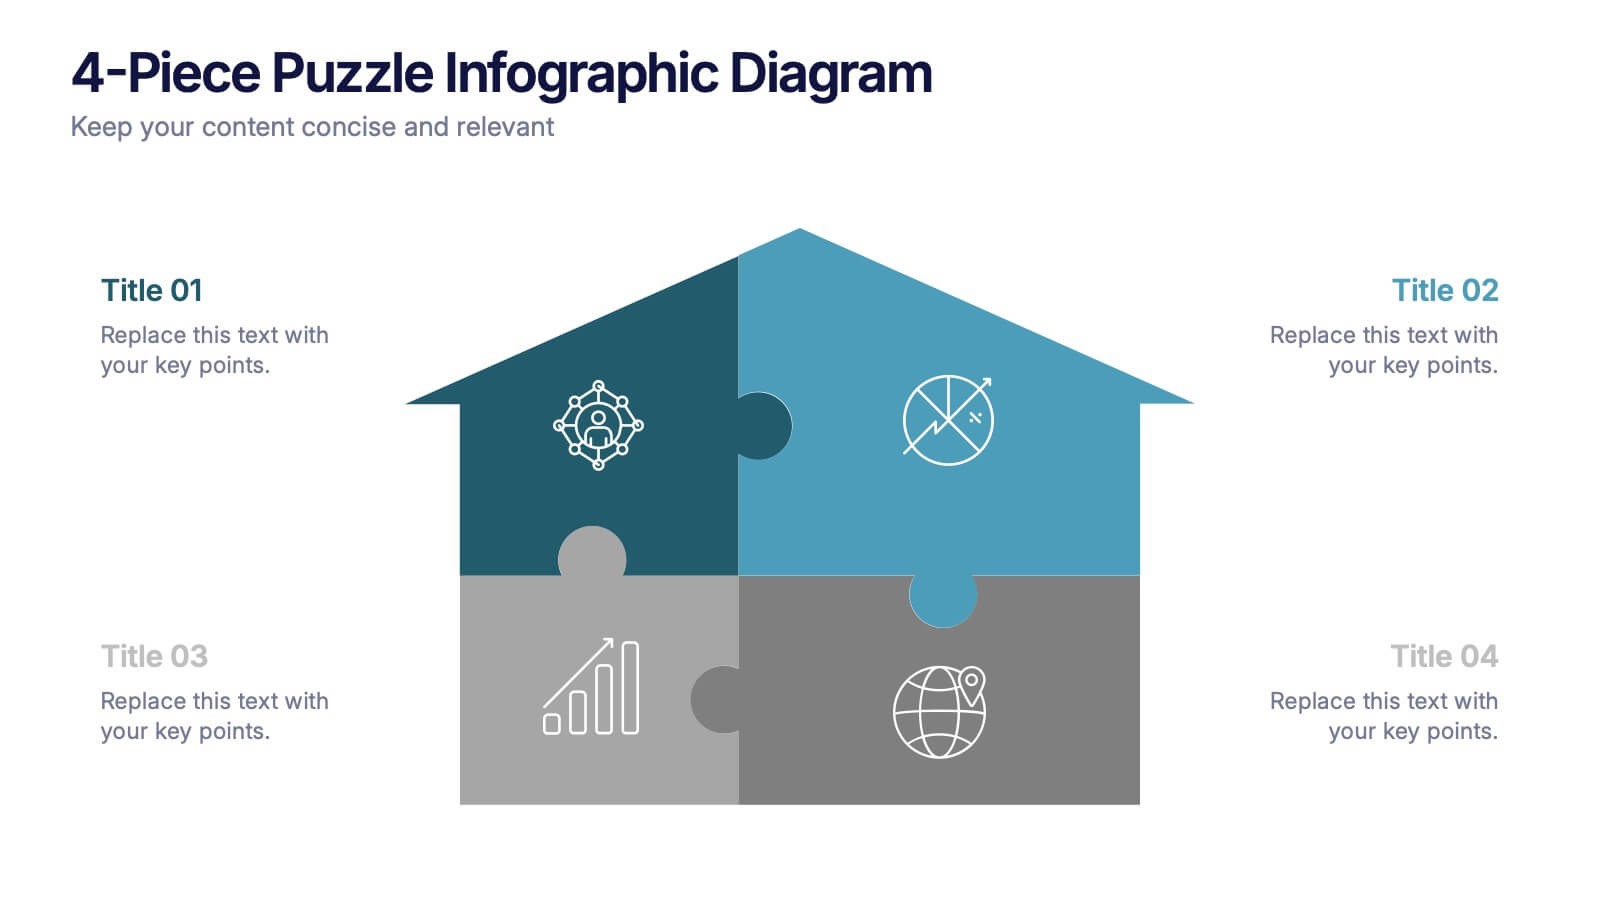
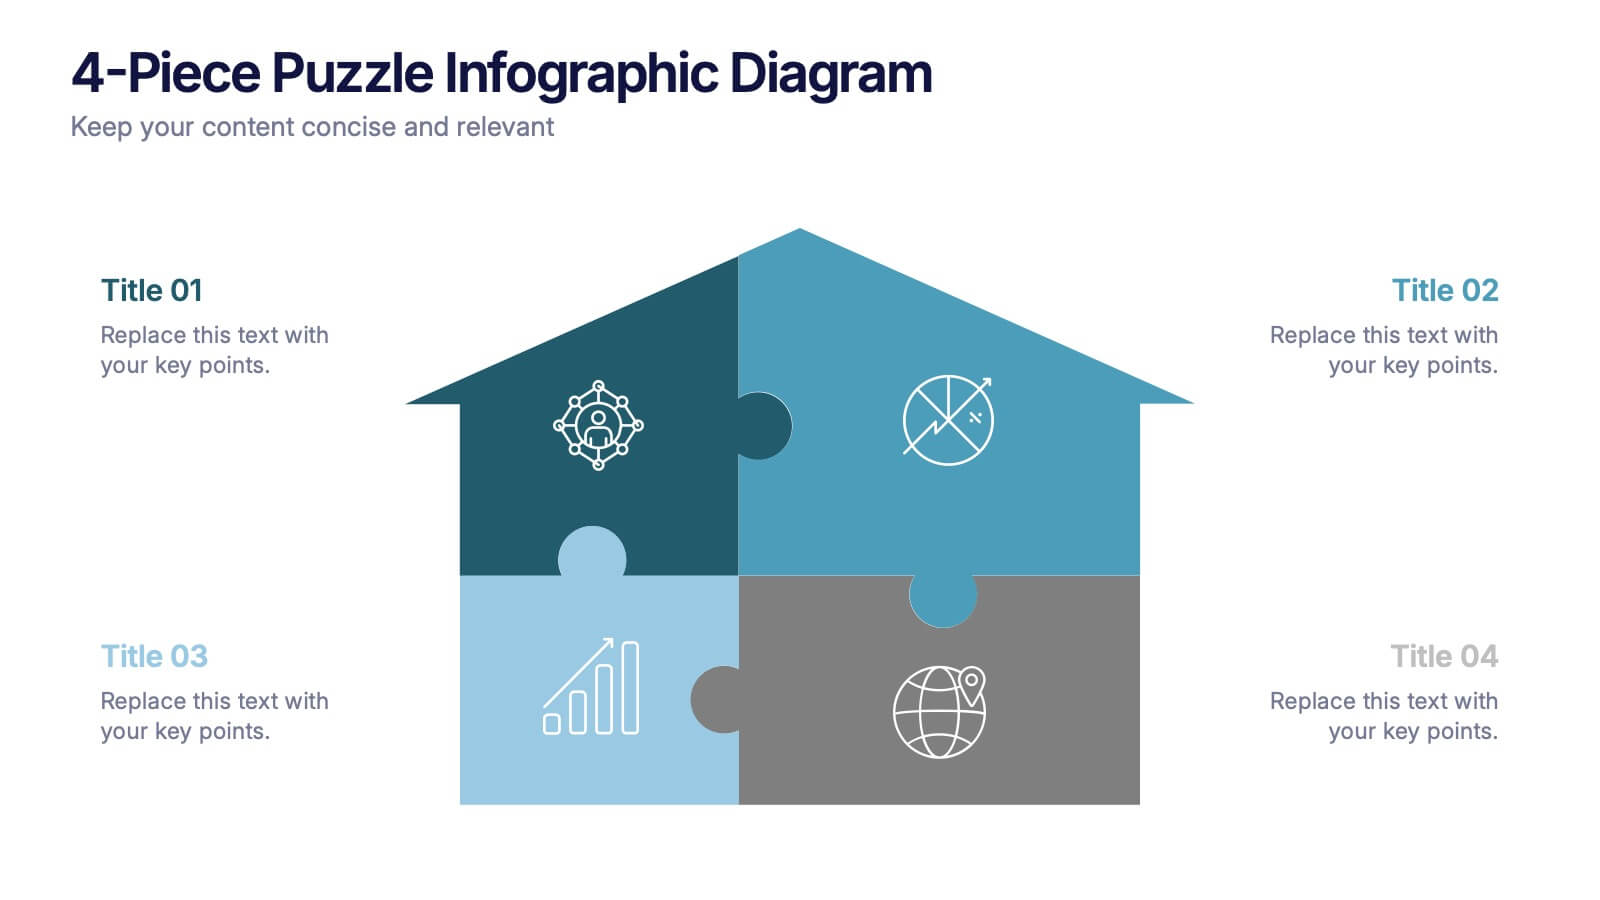
4-Piece Puzzle Infographic Diagram Presentation
Bring clarity and impact to your message with a visual layout that snaps big ideas together like a puzzle. This presentation helps you break complex concepts into four connected sections, making explanations easier and more engaging for any audience. Ideal for planning, insights, or strategy sessions. Fully compatible with PowerPoint, Keynote, and Google Slides.
6 slides
Key Project Milestone Tracker Presentation
Stay on top of project timelines with this clean and colorful milestone tracker. Ideal for Gantt-style overviews, this slide helps teams visualize progress across months for multiple tasks. Compatible with PowerPoint, Keynote, and Google Slides for seamless editing.


6 slides
Leadership Vision and Strategy Presentation
Present your organization’s goals with this leadership vision and strategy template, designed with a hierarchy graphic to represent team structure and growth. Perfect for strategic planning, leadership meetings, and corporate presentations. Fully editable in Canva, PowerPoint, or Google Slides, making it easy to customize colors, text, and layout to fit your brand.


5 slides
Market Expansion Strategies in South America Map Presentation
Explore opportunities with the Market Expansion Strategies in South America Map template, showcasing key business insights across various regions in South America. This presentation is your gateway to understanding market dynamics and planning strategic moves. It features a customizable map with percentage indicators, ideal for displaying market growth and regional trends. Compatible with PowerPoint, Keynote and Google Slides.


7 slides
AIDA Model Infographic Presentation Template
The AIDA model is the most commonly used marketing communication formula. It describes how people are influenced by advertising, and how brands can use this to their advantage. The AIDA model of marketing is a well-known strategy for organizations to use when presenting products and services. With this template you will be sure you have every element of the AIDA model covered in your presentation. This template will provide you with a perfect and easy way to create your ideal AIDA model presentation. This includes a comprehensive overview of the AIDA marketing funnel and how it works.


5 slides
Four-Step Marketing Funnel Plan Presentation
Streamline your messaging with the Four-Step Marketing Funnel Plan Presentation. This clean, vertical funnel layout highlights each stage of your strategy—ideal for visualizing lead nurturing, sales processes, or campaign progression. Each level is clearly marked and editable, helping you deliver focused insights with ease. Fully compatible with PowerPoint, Canva, Keynote, and Google Slides.


6 slides
Business Task and To-Do List Slide
Organize tasks with clarity using this colorful checklist-style layout, perfect for showcasing priorities, timelines, or team responsibilities. With six editable sections and engaging icons, this layout brings structure and visual appeal to business updates or project meetings. Fully customizable in PowerPoint, Keynote, and Google Slides.


4 slides
Preventive Health Services Layout Presentation
Make health data more human with this modern infographic layout for service-based reporting. This preventive health slide design clearly maps wellness categories to body parts, making it easy to communicate medical insights and early intervention strategies. Fully editable and compatible with PowerPoint, Keynote, and Google Slides for smooth integration into any deck.


8 slides
Annual Business Performance Report Presentation
Visualize your company’s progress with the Annual Business Performance Report Presentation. This sleek, data-driven template combines donut charts and bar graphs to showcase KPIs, milestones, and key achievements. Perfect for year-end summaries and stakeholder updates. Fully editable in Canva, PowerPoint, and Google Slides for easy customization and professional results.


6 slides
Project Management Skills Infographic
Optimize your project management presentations with our Project Management Skills Infographic. This intuitive template breaks down complex project stages into an easy-to-follow visual flow, perfect for PowerPoint, Google Slides, and Keynote users. Ideal for managers, team leaders, and educators, it emphasizes critical skills in project management. Customize each segment with your milestones, timelines, or skill requirements. Its sleek design and adaptable format make it a go-to for illustrating project roadmaps and management strategies. Equip your audience with a clear understanding of project dynamics and foster a collaborative environment with this essential tool.


4 slides
Audience Demographic Profile Overview
Present audience composition with clarity using the Audience Demographic Profile Overview Presentation. This slide is designed to showcase gender-based or group-specific data through visual figures, percentage markers, and supporting bar charts. Ideal for marketers, analysts, and researchers who need to communicate user distribution and behavior insights. Fully editable in PowerPoint, Keynote, and Google Slides.


7 slides
Leadership Principles Infographic Presentation
A Leadership Infographic provides information about leadership principles, practices, and strategies. This template has been designed as a tool for presenting complex leadership concepts and ideas, using visual elements such as icons, charts, and diagrams. This infographics can be used to cover a wide range of topics related to leadership, including leadership styles, communication, decision-making, team building, and problem-solving. Use the text boxes and charts to provide information on the qualities and skills of effective leaders, such as empathy, vision, and strategic thinking.