


Features
- 6 Unique Slides
- Fully editable and easy to edit in Microsoft Powerpoint, Keynote and Google Slides
- 16:9 widescreen layout
- Clean and professional designs
- Export to JPG, PDF or send by email


Do you have any questions?
Recommend


5 slides
Fitness Program Infographics
A fitness program is a structured plan designed to improve and maintain physical health and well-being. These vertical infographics outline the key elements and benefits of a fitness program. This template is ideal for gyms, personal trainers, and fitness enthusiasts looking to educate and inspire others to adopt a healthy and active lifestyle. The infographics offer space to include customizable workout plans tailored to different fitness levels, such as weight loss, muscle gain, or overall fitness improvement. Helpful nutrition tips are incorporated to complement the fitness program, emphasizing the importance of achieving fitness goals.


5 slides
User Experience Empathy Map Strategy Presentation
Step into the user’s mindset with the User Experience Empathy Map Strategy Presentation. This template helps you visualize your audience’s thoughts, feelings, behaviors, and perceptions using a structured empathy map format. Ideal for UX workshops, customer journey analysis, or product design strategy sessions. Fully customizable in PowerPoint, Keynote, Canva, and Google Slides.


6 slides
Personal Productivity Time Management Techniques Presentation
Streamline your workflow with the Personal Productivity Time Management Techniques presentation slide. Featuring a step-by-step staircase layout, this template visually maps out five core techniques or habits leading to improved efficiency and goal achievement. Each step includes an icon and placeholder text for easy customization. Ideal for productivity coaches, corporate trainers, or time management workshops. Fully editable in PowerPoint, Keynote, and Google Slides.


2 slides
Professional Introduction Slide Presentation
Make a lasting first impression with this Professional Introduction Slide. Designed for business presentations, personal branding, and team introductions, this modern layout features bold shapes, a photo placeholder, and space for key details. Ideal for PowerPoint, Keynote, and Google Slides, this fully editable template lets you customize colors, text, and images to match your brand identity.


6 slides
Market Share Visualization Pie Chart Presentation
Showcase percentage breakdowns with impact using the Market Share Visualization Pie Chart Presentation. This infographic slide features a bold, segmented pie chart styled with cloud-shaped backdrops and colorful wedges, ideal for presenting market analysis, segment comparisons, or share allocation. Each slice is clearly labeled with percentage values and customizable titles, while matching icons reinforce your data points visually. Whether you're pitching to stakeholders or presenting internal reports, this design ensures clarity and engagement. Fully editable in PowerPoint, Keynote, and Google Slides.


20 slides
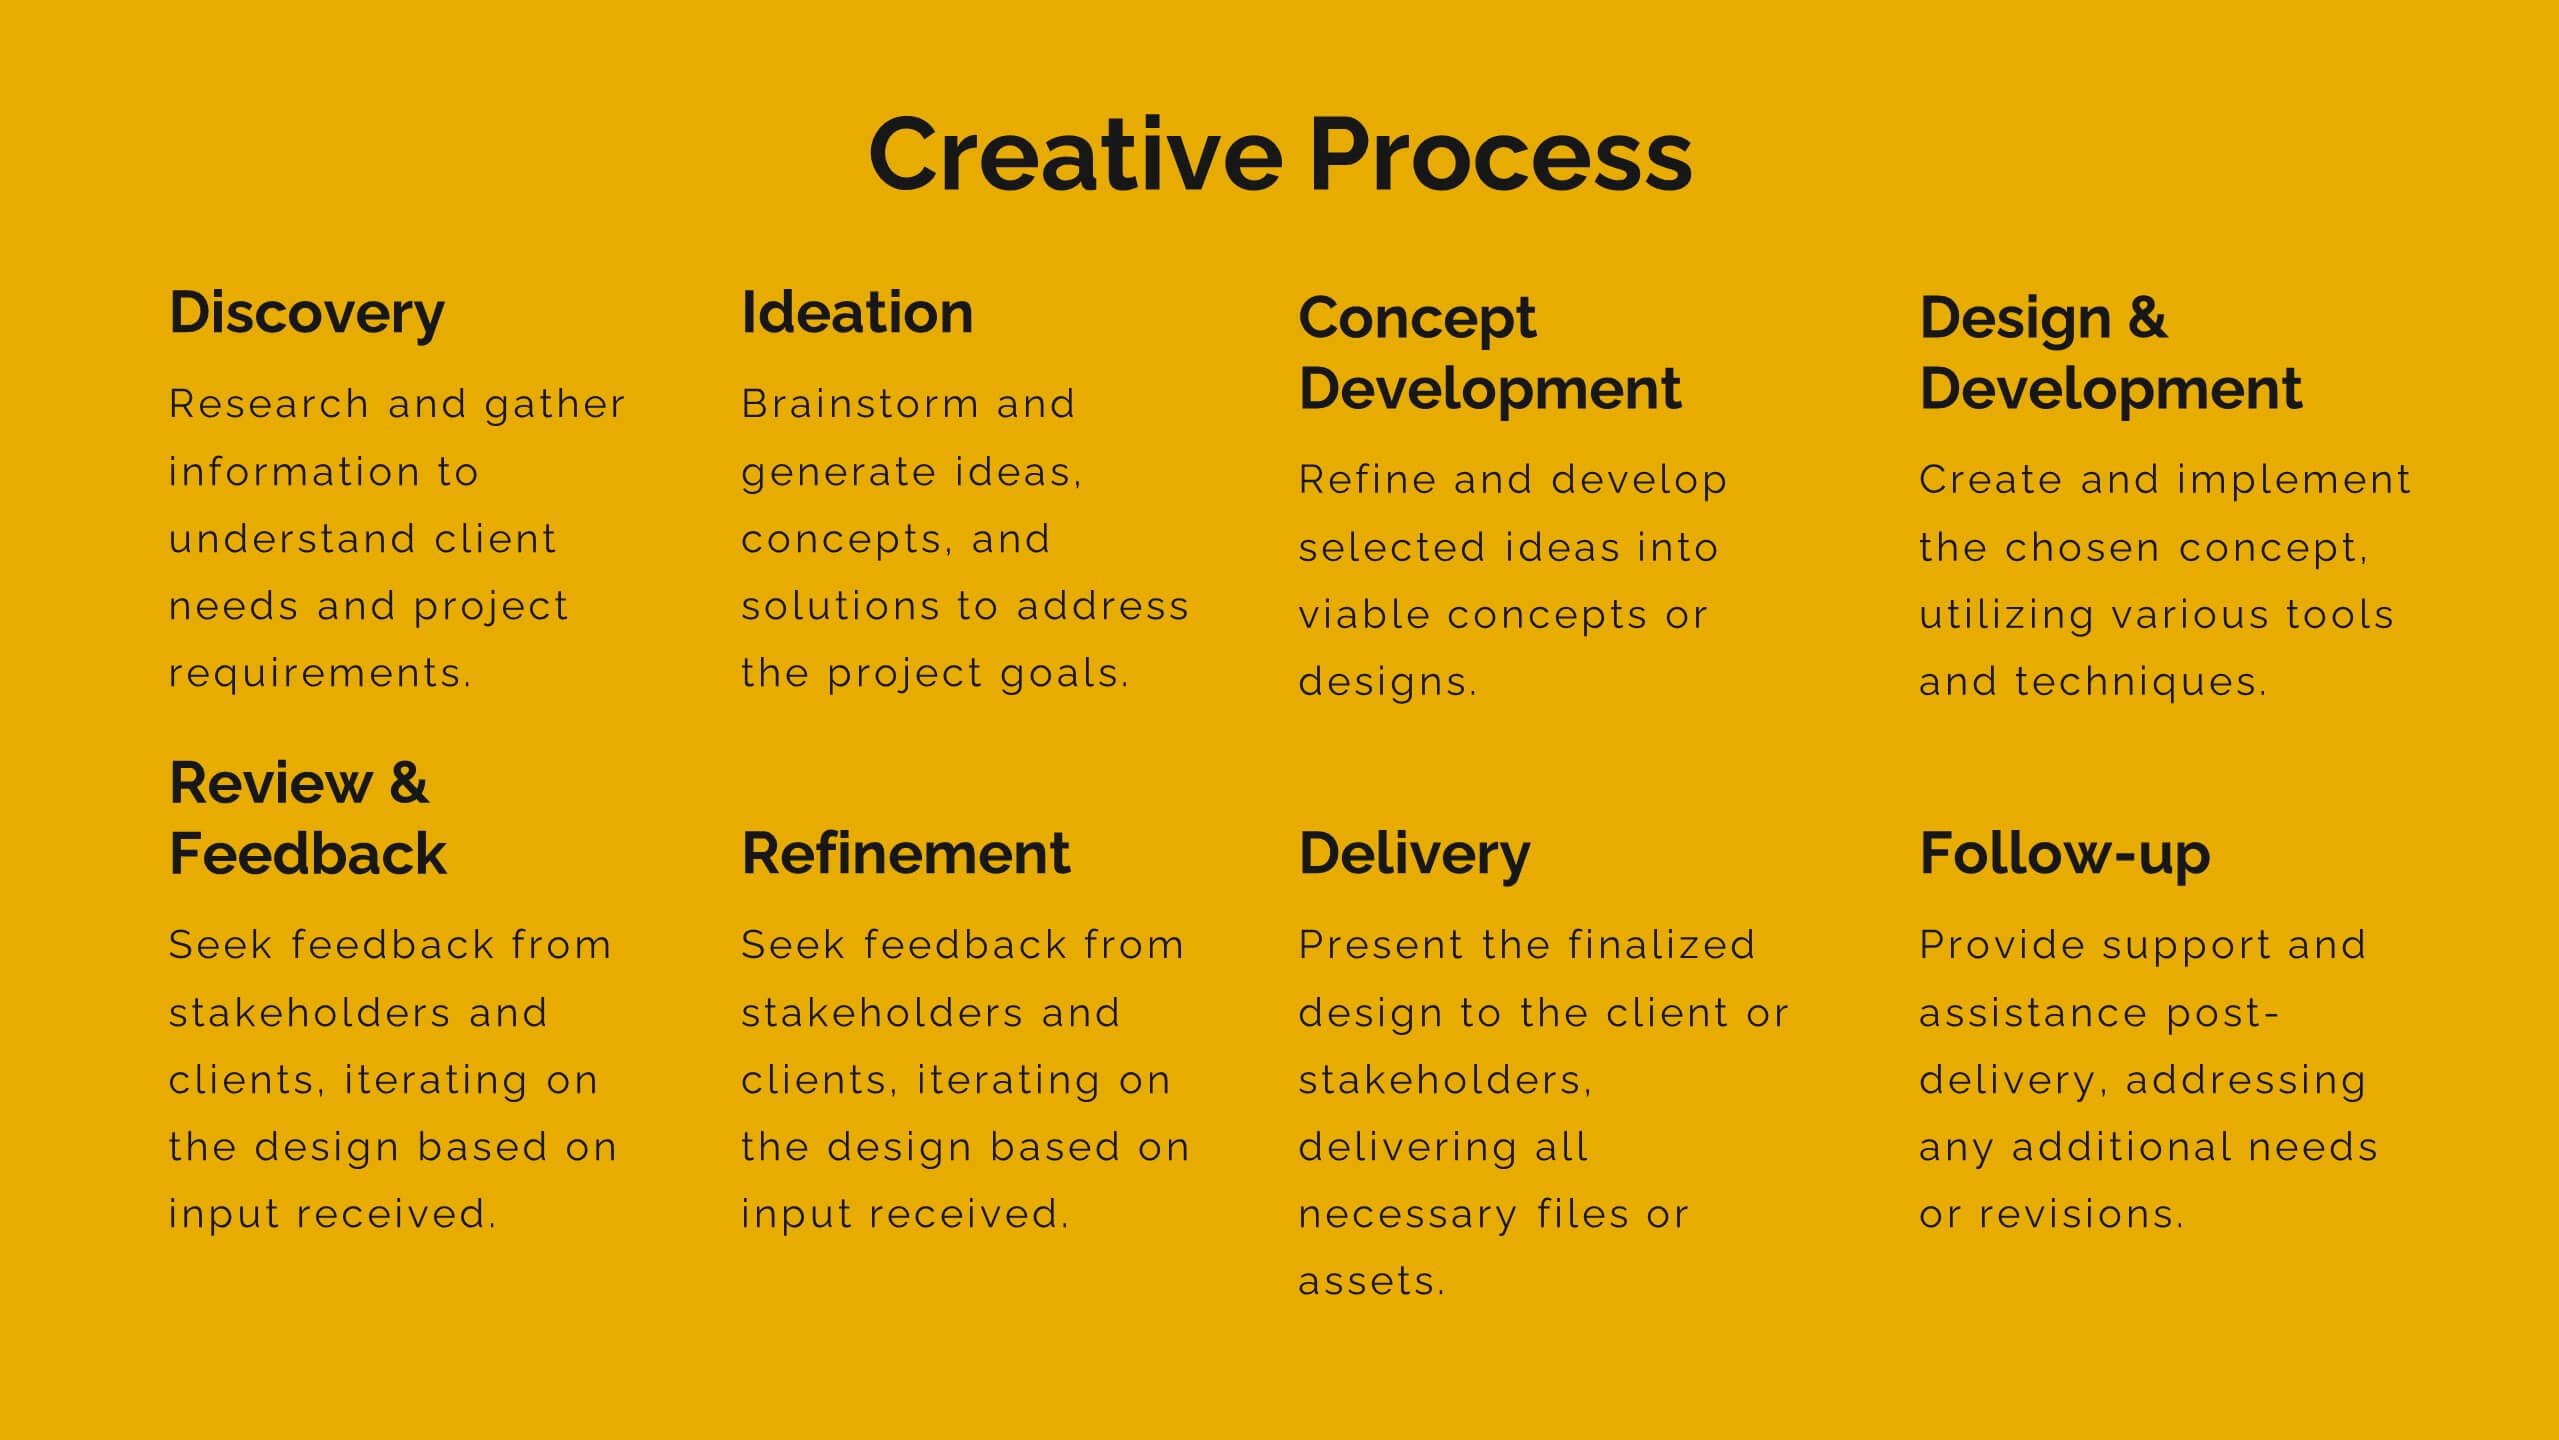
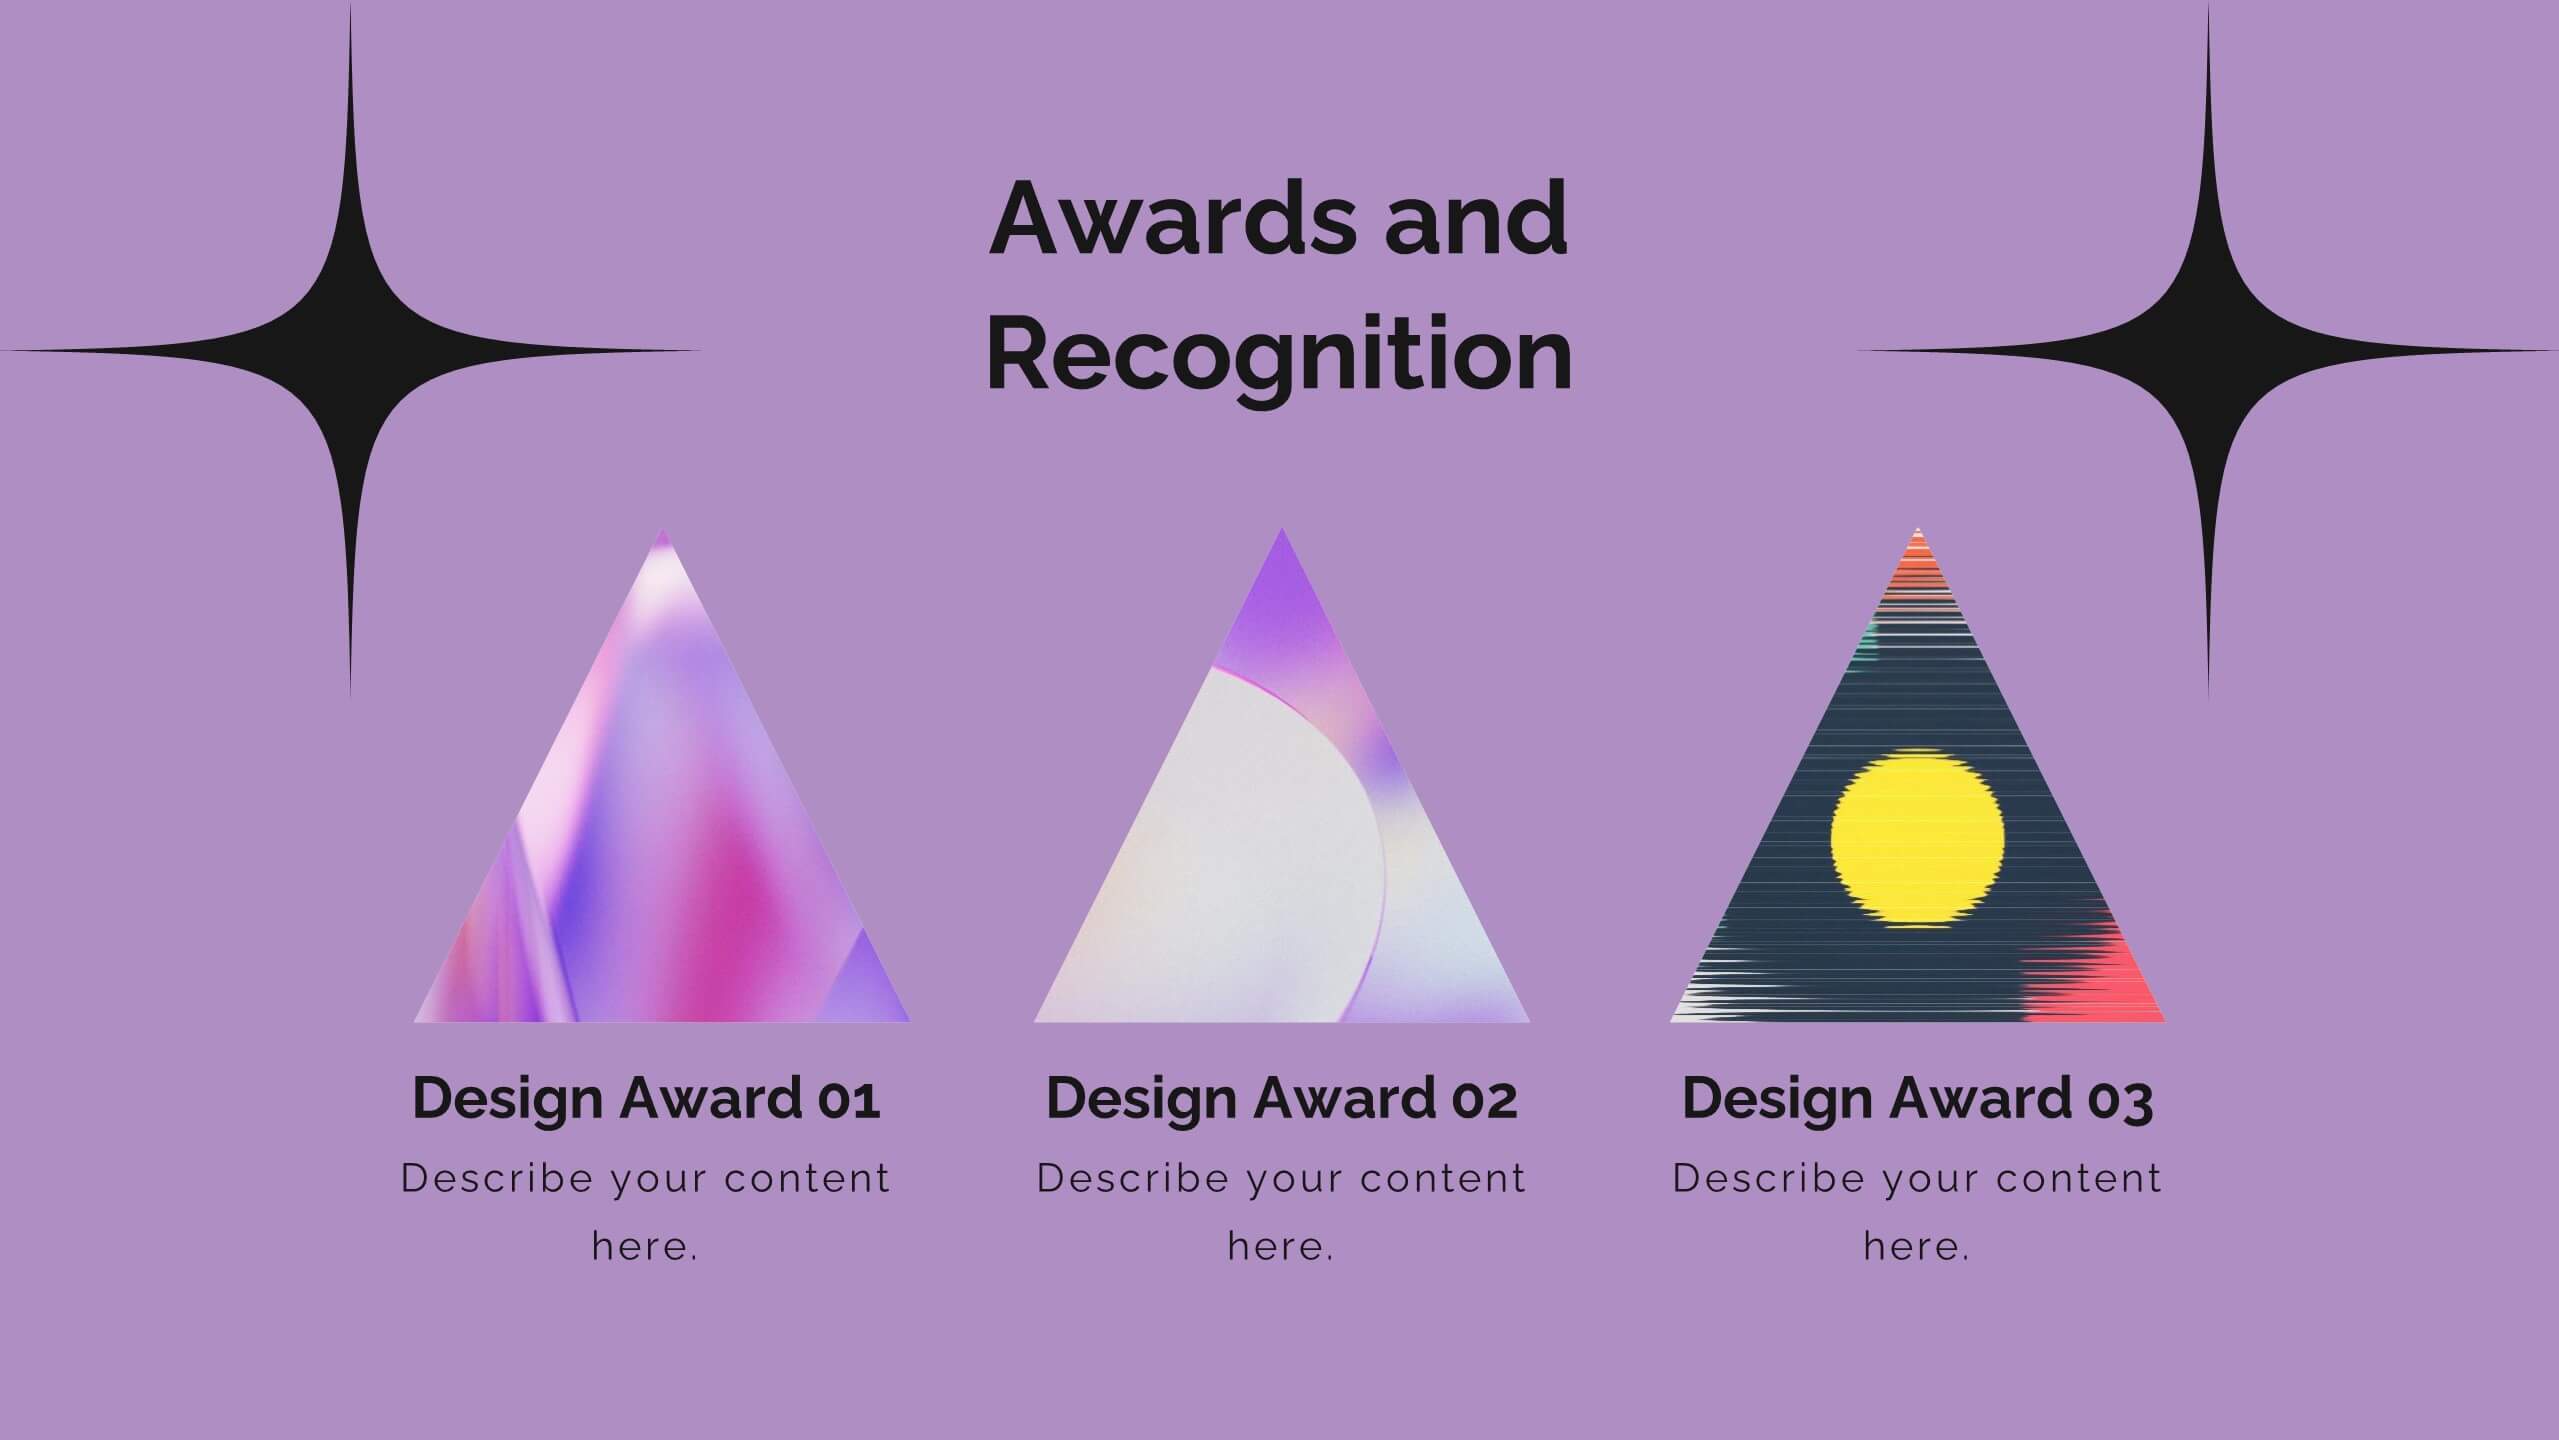
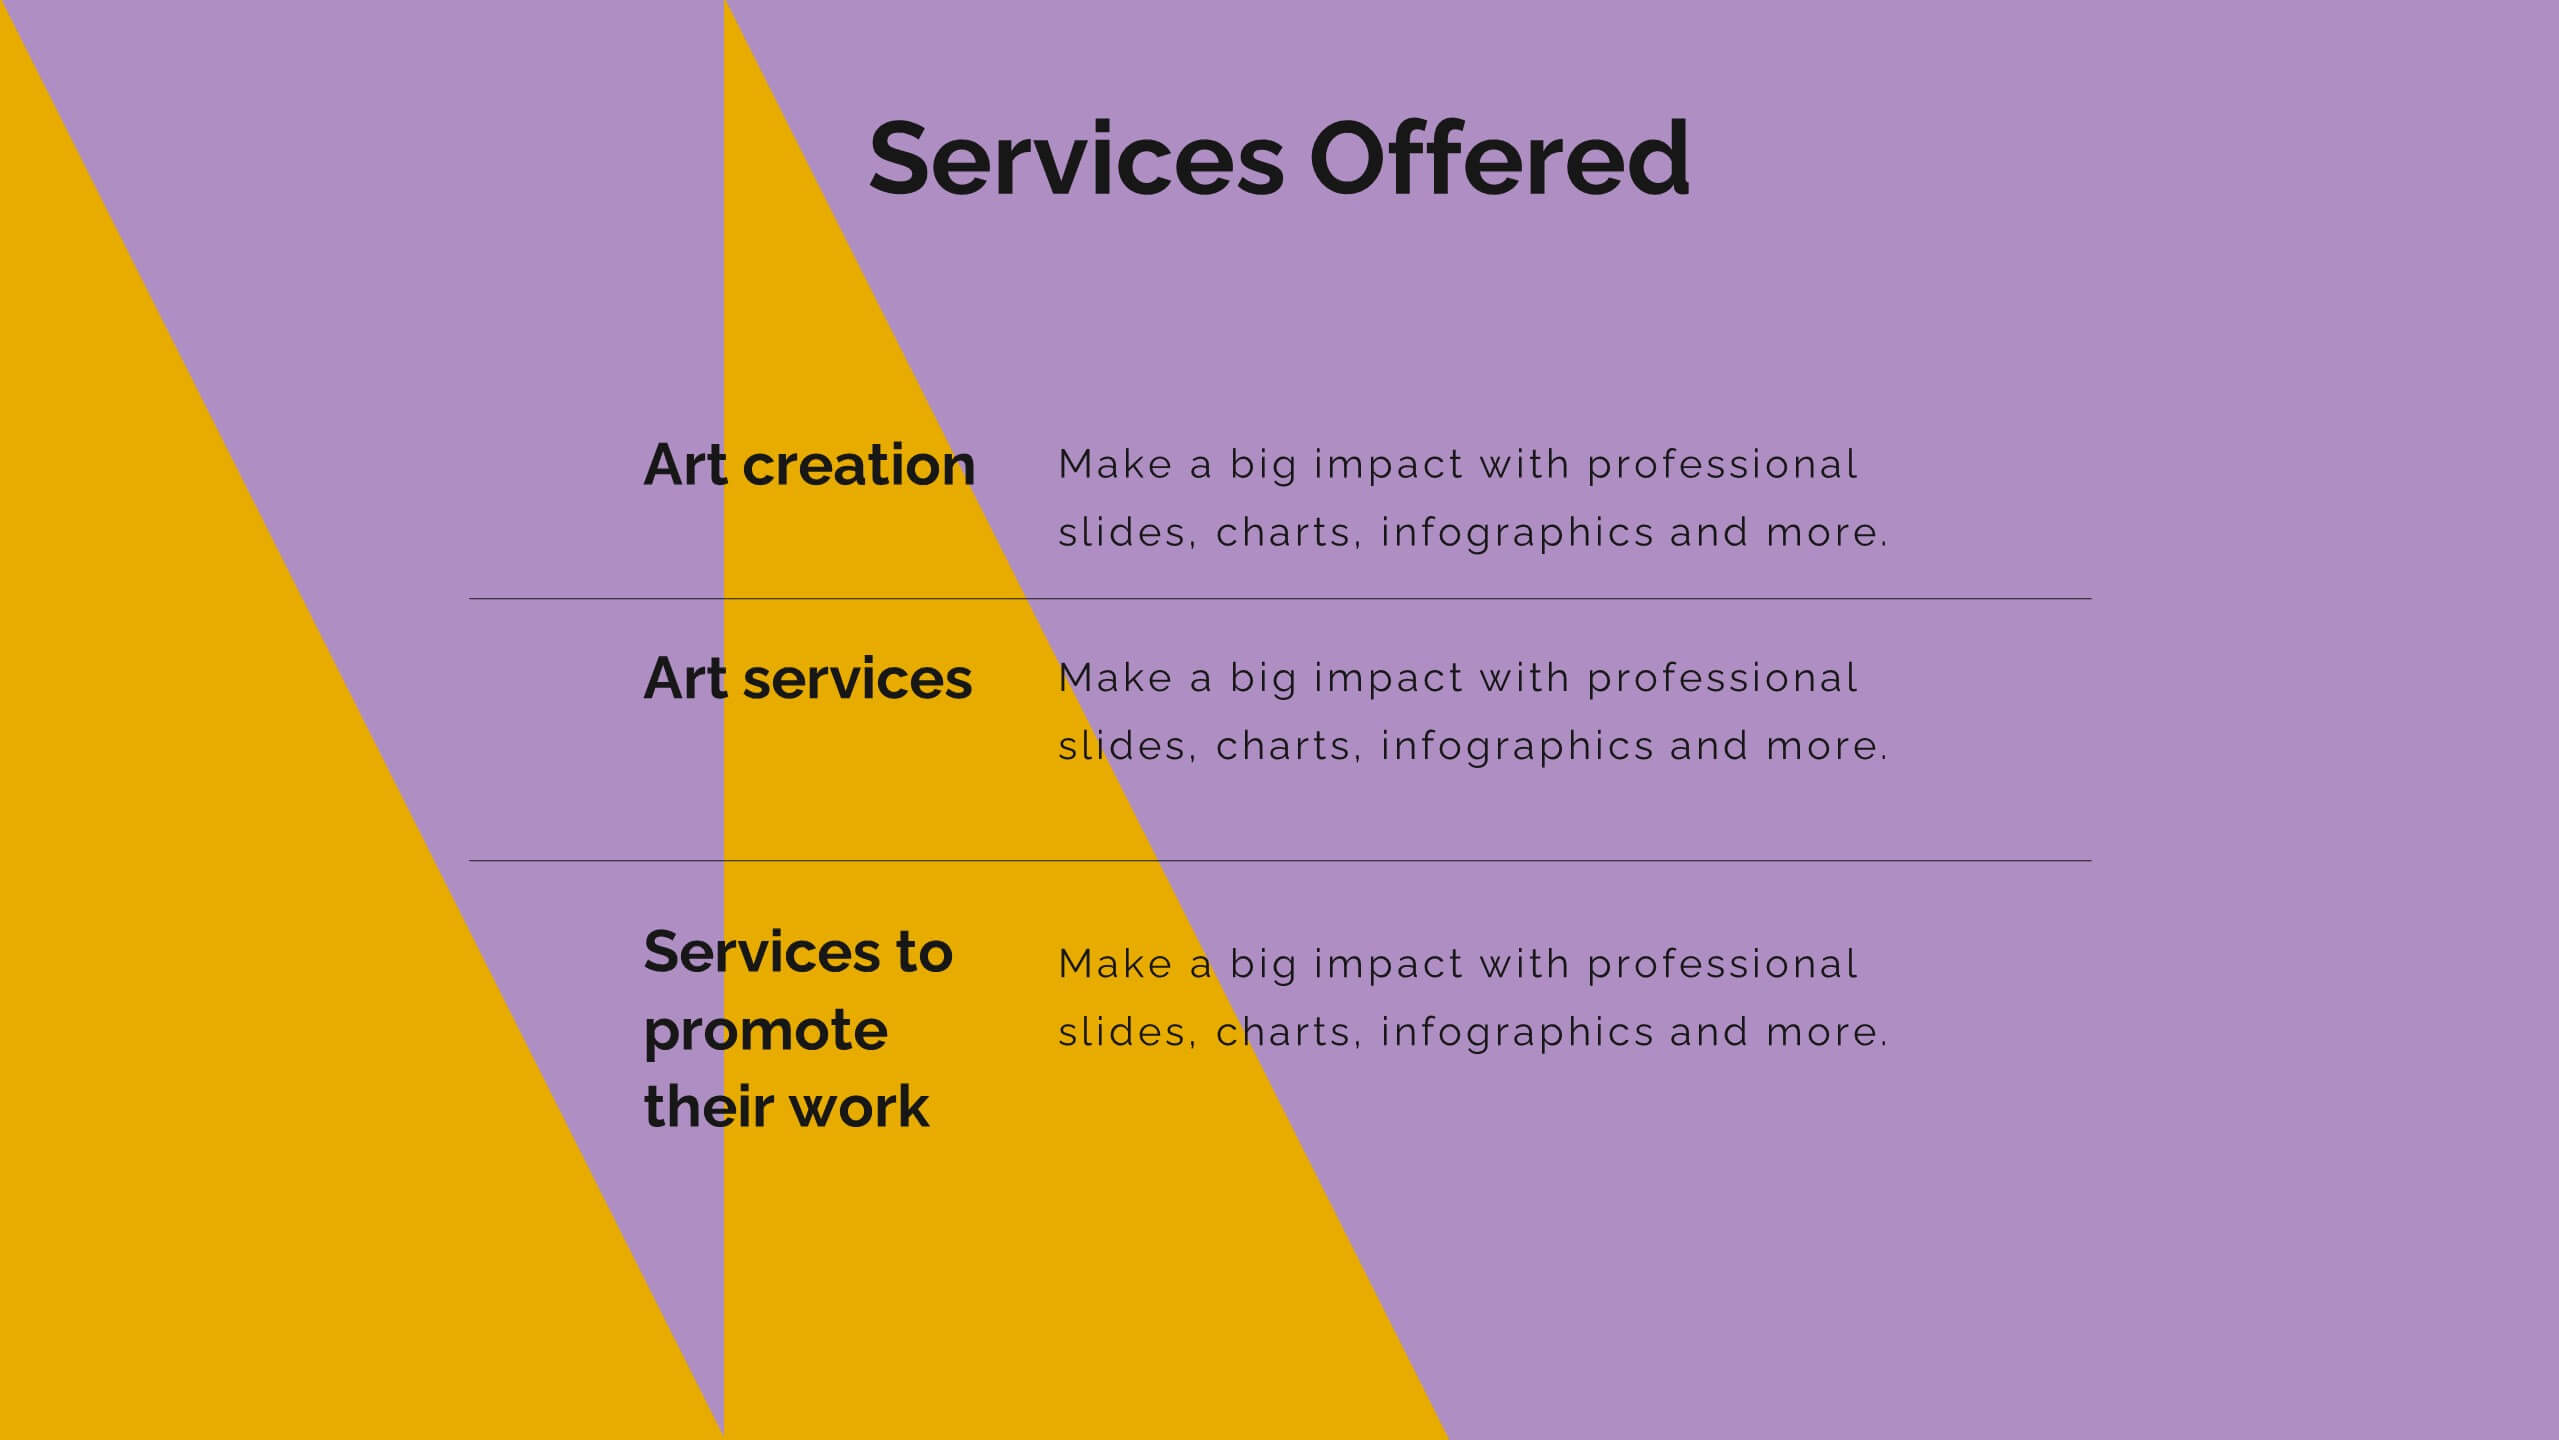
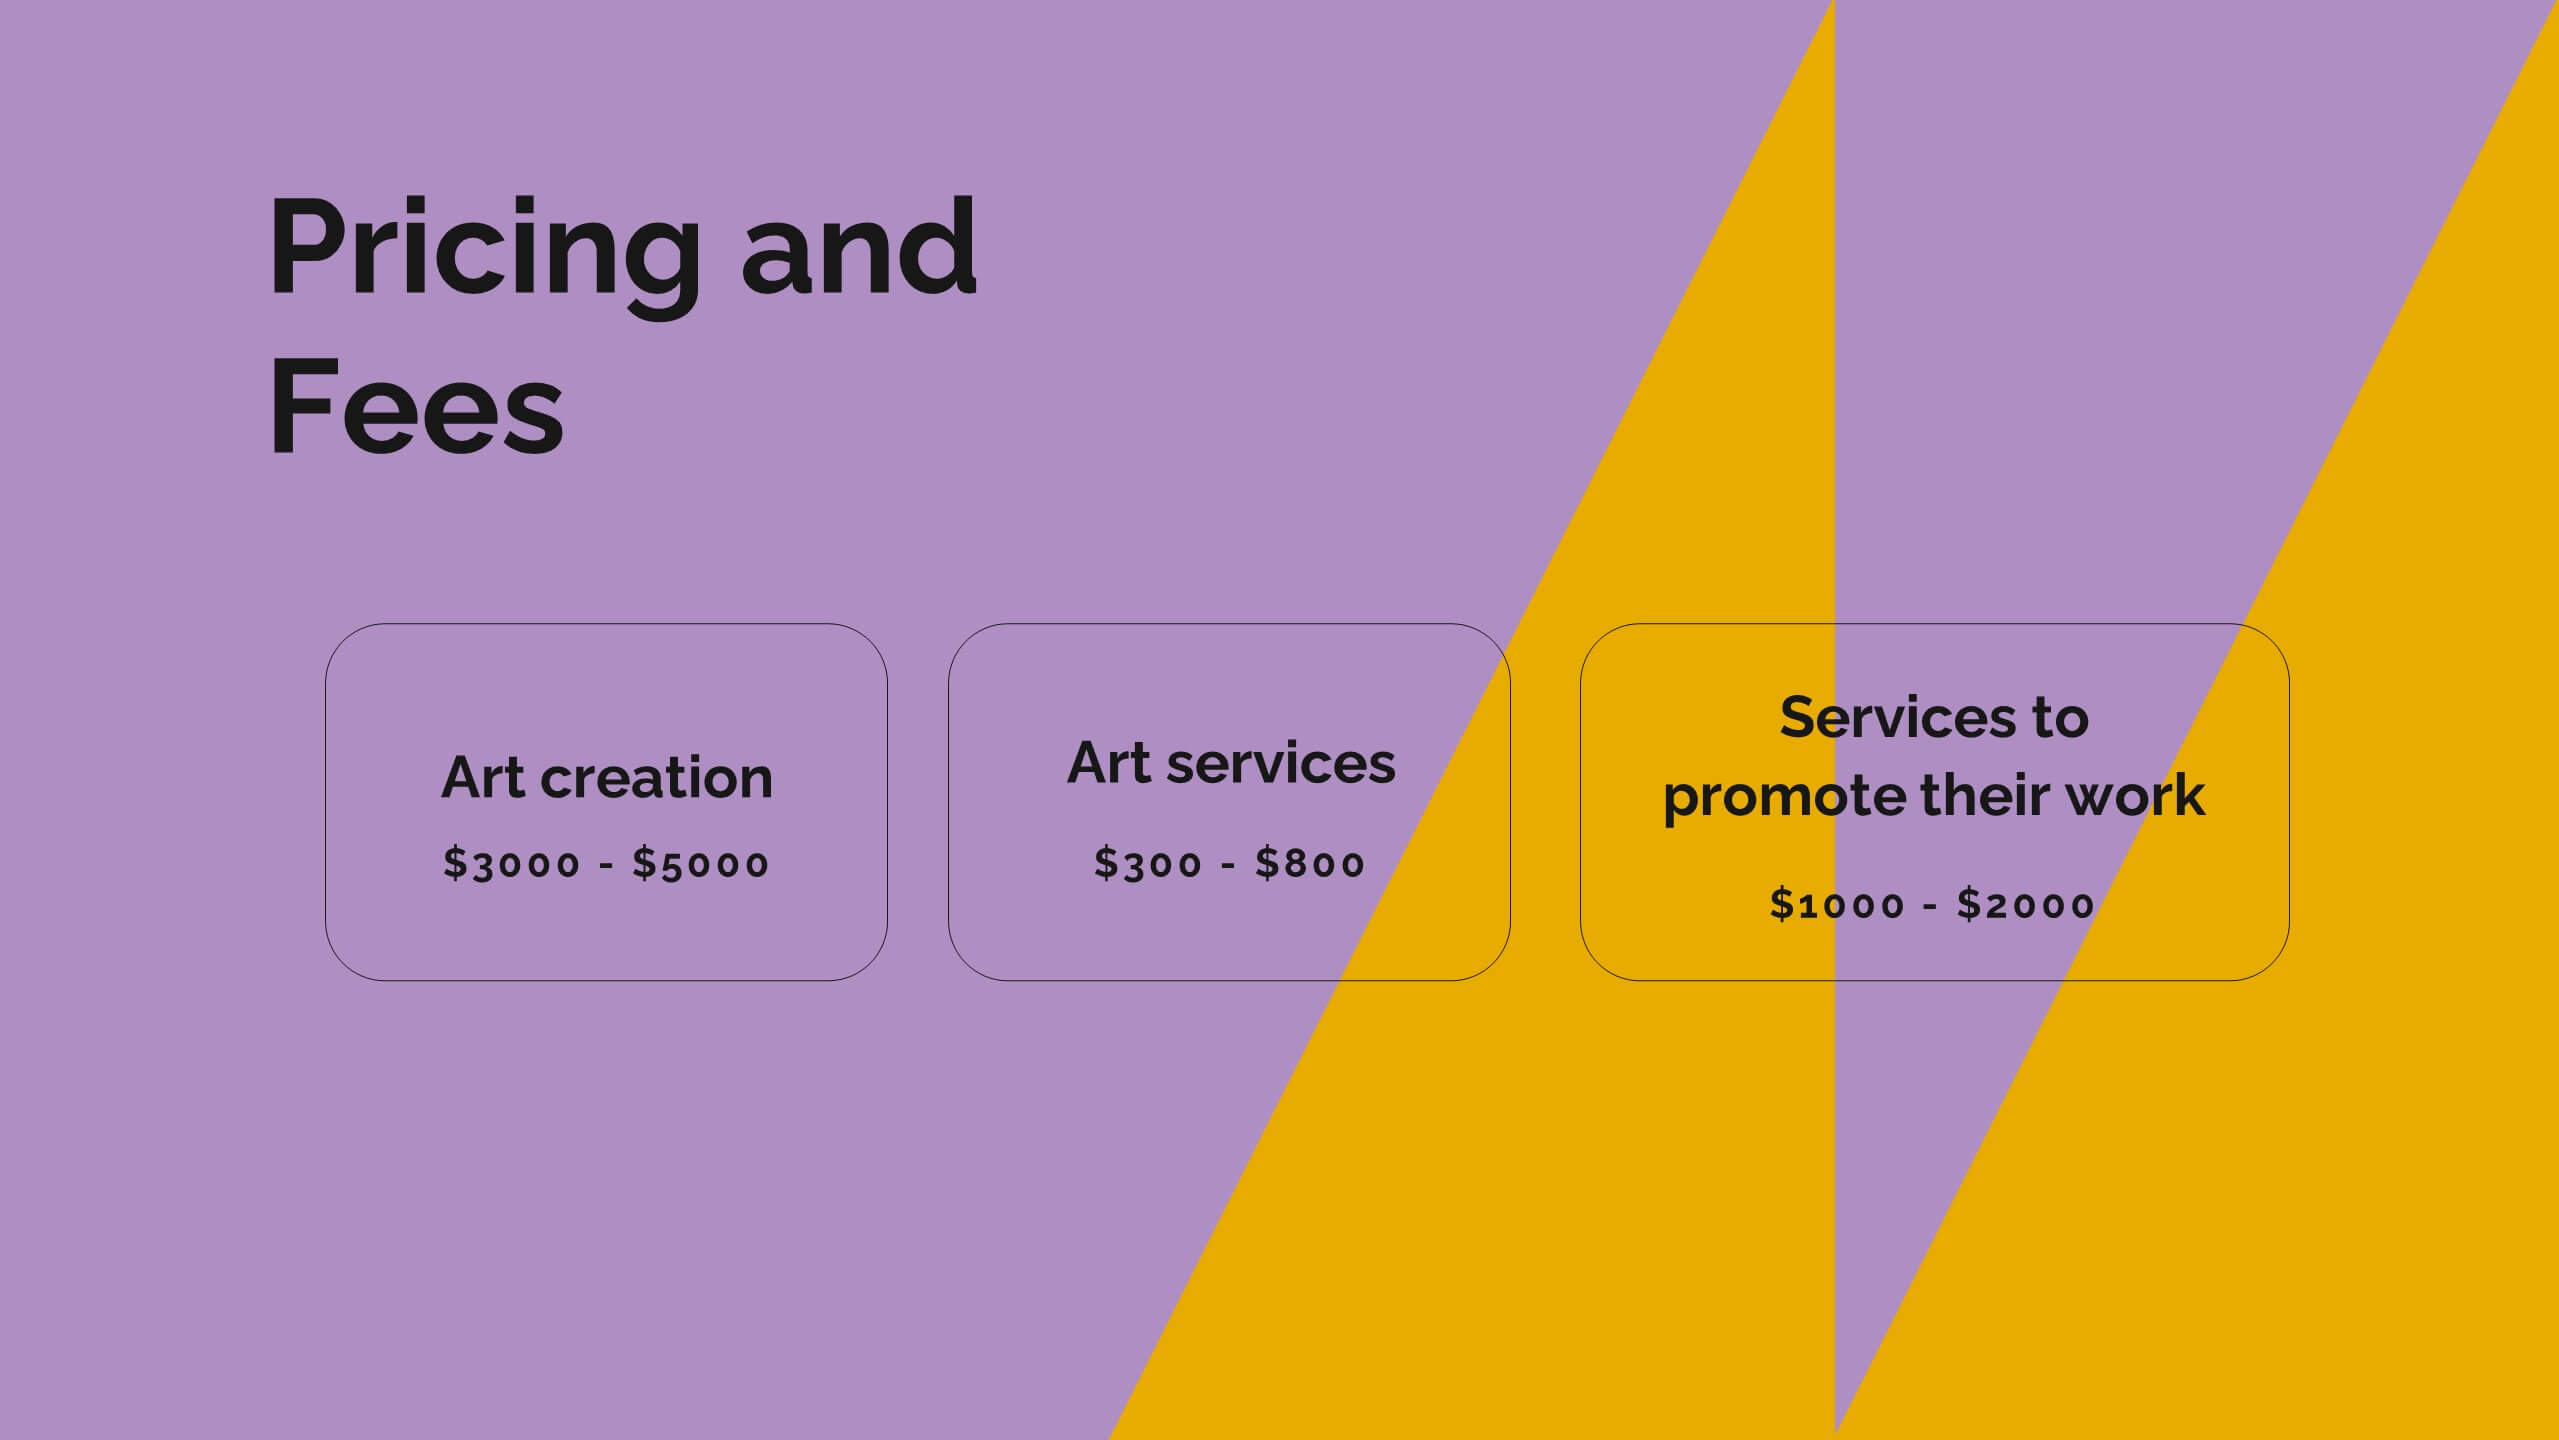
Vortex Artist Portfolio Template Presentation
Showcase your artistic brilliance with this eye-catching portfolio presentation template! Perfect for highlighting your projects, creative process, and awards, it features vibrant slides for your philosophy, collaborations, and client testimonials. Impress potential clients and collaborators with a stunning, well-organized portfolio. Compatible with PowerPoint, Keynote, and Google Slides for seamless presentations on any platform.


4 slides
Client Proposal Overview Presentation
Present your ideas with confidence using a sleek and structured layout that turns client insights into a compelling story. Ideal for outlining project goals, value propositions, or proposal summaries, this template keeps every detail polished and professional. Fully compatible with PowerPoint, Keynote, and Google Slides for effortless customization.


8 slides
3-Part Business Triangle Diagram
Showcase interconnected ideas or processes with this clean 3-part triangle layout. Ideal for illustrating strategies, relationships, or project phases in a clear and visually engaging way. Fully customizable in PowerPoint, Keynote, and Google Slides for seamless editing.


6 slides
Child Development Psychology Presentation
Bright colors and geometric birds bring this slide to life, making complex concepts easy to follow. This presentation template simplifies the key stages of emotional and psychological growth in children, helping you explain theories and behaviors clearly. Compatible with PowerPoint, Keynote, and Google Slides for seamless use across platforms.


4 slides
Digital Marketing Strategy Presentation
Present your marketing insights with impact using this engaging digital marketing strategy slide. Featuring a modern bar chart with layered 3D blocks and icon-labeled highlights, this slide is perfect for showcasing strategy breakdowns, campaign priorities, or market performance data. Customize each section with concise titles and professional content. Ideal for marketers, agencies, and analysts. Fully editable in PowerPoint, Keynote, and Google Slides.


4 slides
Business Growth and Strategy Plan Presentation
Showcase your company’s path forward with this Business Growth and Strategy Plan Presentation. Designed with a curved arrow layout, it visually maps out three key milestones or initiatives. Ideal for strategic roadmaps, planning sessions, or executive updates. Fully editable in Canva, PowerPoint, or Google Slides.


26 slides
Thadd Presentation Template
Thadd presents your business in a professional light. The bold fonts and colors make for a clean, professional aesthetic that won't distract from your message. It features a strong horizontal identity that instantly communicates your brand. Charts, timelines and easy to edit text give this template an edge over the competition. It comes with easy to edit text and images, making changing content a breeze. It makes for a great business tool for companies who want to get their message across without wasting time on graphics and design. Invest in your future and download this template today.


7 slides
International Finance Infographic
International finance is a branch of economics and financial studies that deals with monetary interactions that occur between two or more countries. Dive into the intricate world of finance with our visually captivating international finance infographic. This template is your passport to understanding the complexities and opportunities in the global financial landscape. With this template you will be able to analyze the dynamics of exchange rates, foreign investment, and how these factors influence global economics. This infographic is crafted to provide a holistic view of the world of finance.


7 slides
Aviation Infographic Presentation Template
Featuring our light, vibrant and eye-catching aviation infographic template compatible with PowerPoint. The theme is designed to show you the key facts and figures about your topic, so you can easily produce a stunning presentation. This infographic is a visual representation of information related to aviation, presented in a clear and visually appealing way. With this template cover topics such as aviation history or the economic impact of the aviation industry. The information in the template can be in the form of statistics, data visualizations, timelines, maps, or other graphical elements.


6 slides
6-Step Circular Process Diagram Presentation
Bring your workflow to life with a clean circular layout that makes every phase feel connected and easy to follow. This presentation breaks complex processes into six intuitive steps, ideal for strategy, planning, or operations. Fully compatible with PowerPoint, Keynote, and Google Slides.


4 slides
Preventative Healthcare Strategies Presentation
Present medical insights with clarity using this syringe-themed slide layout designed for preventative healthcare strategies. Ideal for showcasing public health plans, vaccination drives, or early intervention tactics. Fully editable in PowerPoint, Keynote, and Google Slides, this modern visual aids healthcare professionals in delivering data-driven, concise messages with professional impact.


4 slides
Data Visualization Pie Chart
Make your insights pop with this engaging Pie Chart slide. Perfect for reporting KPIs or comparing segmented data, the radial design blends clear visuals with editable text sections. Ideal for marketing, analytics, or strategy meetings. Fully customizable in PowerPoint, Keynote, and Google Slides.