


Features
- 6 Unique Slides
- Fully editable and easy to edit in Microsoft Powerpoint, Keynote and Google Slides
- 16:9 widescreen layout
- Clean and professional designs
- Export to JPG, PDF or send by email


Do you have any questions?
Recommend


7 slides
E-Learning Solutions Infographic
Elevate the e-learning experience with our E-Learning infographic. Featuring a harmonious blend of serene purple and crisp white, this infographic encapsulates the transformative world of digital learning. Tailored for educators, e-learning consultants, and instructional designers, it vividly illustrates the nuances of online education. Incorporated within are ingenious graphics, relevant icons, and dedicated image placeholders, all set to anchor your content and enhance comprehension. Regardless of your preferred platform – PowerPoint, Keynote, or Google Slides – this template is your tool to effectively convey the dynamism of e-learning.


6 slides
Ecommerce KPI Dashboards Infographic
Elevate your eCommerce reporting with our comprehensive KPI Dashboard Infographics. Tailored for seamless integration with PowerPoint, Google Slides, and Keynote, this template offers a clear and colorful representation of key performance indicators critical to online business success. From tracking sales growth to monitoring customer engagement metrics, our infographics provide an intuitive layout to display data-driven insights that drive decision-making. This template transforms complex data sets into straightforward visuals, making it easier to communicate progress with your team. Use this template to keep a pulse on your eCommerce performance and narrate the story behind the numbers.


5 slides
Website UI Mockup Device Display
Present your web interface with clarity and flair using this clean device display slide. Designed around a desktop monitor mockup, it’s perfect for showcasing UI designs, website pages, or digital layouts. Fully customizable in PowerPoint, Keynote, and Google Slides—edit colors, fonts, and content to match your project needs.


7 slides
World Maps Medical Security Infographic
Introducing our world map medical security infographic, a template designed to spotlight global medical security concerns and solutions. With a pristine white backdrop punctuated by shades of blue, this infographic offers a tranquil yet informative ambiance, reminiscent of the medical field. Embedded within are custom graphics of the world map, tailor-made to highlight regions based on their medical security levels, accompanied by relevant icons that represent various aspects of healthcare protection and risks. It’s compatibility with platforms such as PowerPoint, Keynote, and Google Slides ensures seamless presentations across various devices and audiences.


5 slides
Movies & Film Market Infographics
Step into the spotlight with our movies & film market infographics, designed to orchestrate your data into a cinematic experience. In the enchanting hues of blue and purple, this template captures the essence of the big screen, offering a vertical layout that resonates with the the film industry. It's a tool for film marketers, and cinema analysts, providing a platform to depict trends, and reviews with a touch of Hollywood style. The set includes captivating graphics, themed icons, and adaptable image placeholders, all curated to help you direct your audience's attention to key insights in the ever-evolving realm of movies and entertainment.


6 slides
Organizational Structure Overview Presentation
Map out your team’s structure with clarity using this simple organizational chart template. Ideal for showcasing departments, reporting lines, or team roles, it helps stakeholders quickly understand who’s who and how responsibilities are divided. Perfect for internal meetings, onboarding decks, or company overviews. Works with PowerPoint, Keynote, and Google Slides.


5 slides
USA Economic Map Infographic
Navigate the complexities of the American economy with our USA economic map infographic. Crafted in shades of blue and diverse colors, this creative, vertical infographic is a boon for economists, researchers, and educators. It's designed to dissect financial data across states, highlighting economic indicators vividly. From GDP growth, employment rates to industry-specific insights, make economic trends accessible. This template, beneficial for anyone addressing economic audiences, features intuitive graphics, state icons, and designated areas for relevant imagery, ensuring each economic facet is visually compelling and information-rich.


7 slides
Project Stakeholder Analysis Infographic
Stakeholder analysis is a technique used in project management and organizational strategy to identify and understand the interests, influence, and impact of individuals or organizations that can significantly affect or be affected by a project or decision. This infographic template is your compass to navigating the intricate landscape of stakeholders, understanding their influence, and engaging them effectively for project success. Compatible with Powerpoint, Keynote, and Google Slides. The vibrant design and strategic insights of our template will empower you to navigate the stakeholder cosmos and steer your project towards triumph.


8 slides
4-Quadrant Matrix Presentation
The "4-Quadrant Matrix Presentation" template is meticulously designed for strategic analysis and planning, perfect for visualizing business data across four key areas. Each quadrant highlights a distinct category, allowing for a comprehensive breakdown of information such as performance metrics, risk assessments, market trends, or operational efficiency. The template is color-coded to distinguish between the quadrants, making it visually engaging and easy to understand. Icons within each quadrant can be customized to symbolize different business functions or data points, enhancing the clarity and effectiveness of the presentation. This tool is ideal for executives, managers, and analysts who need to present complex data in a structured and insightful way, enabling informed decision-making and strategic planning in corporate settings.


21 slides
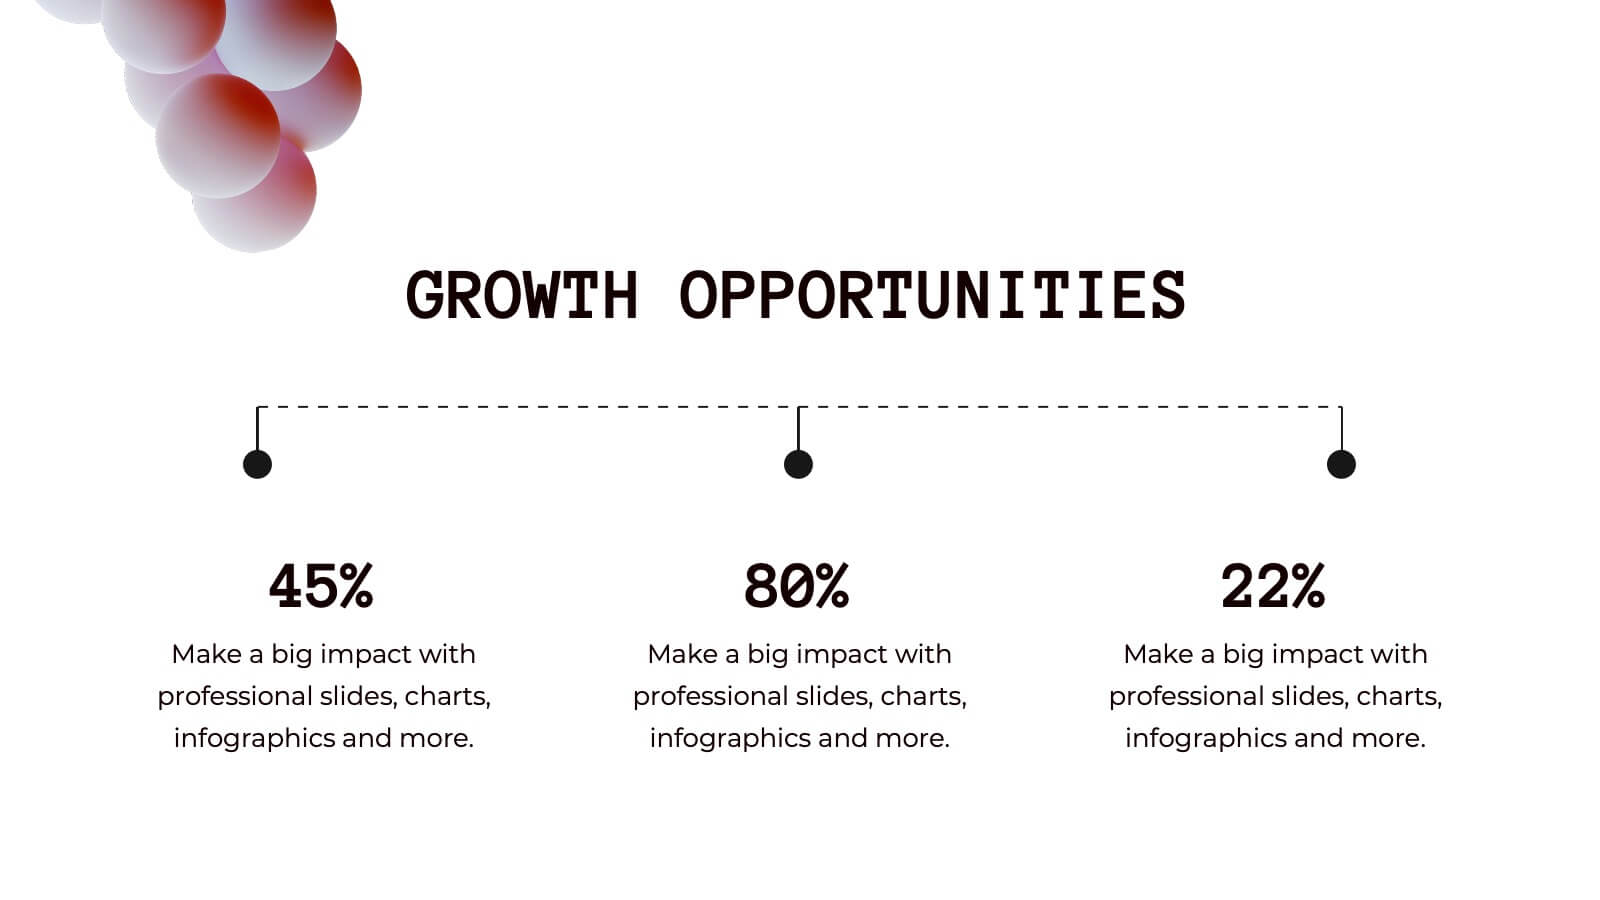
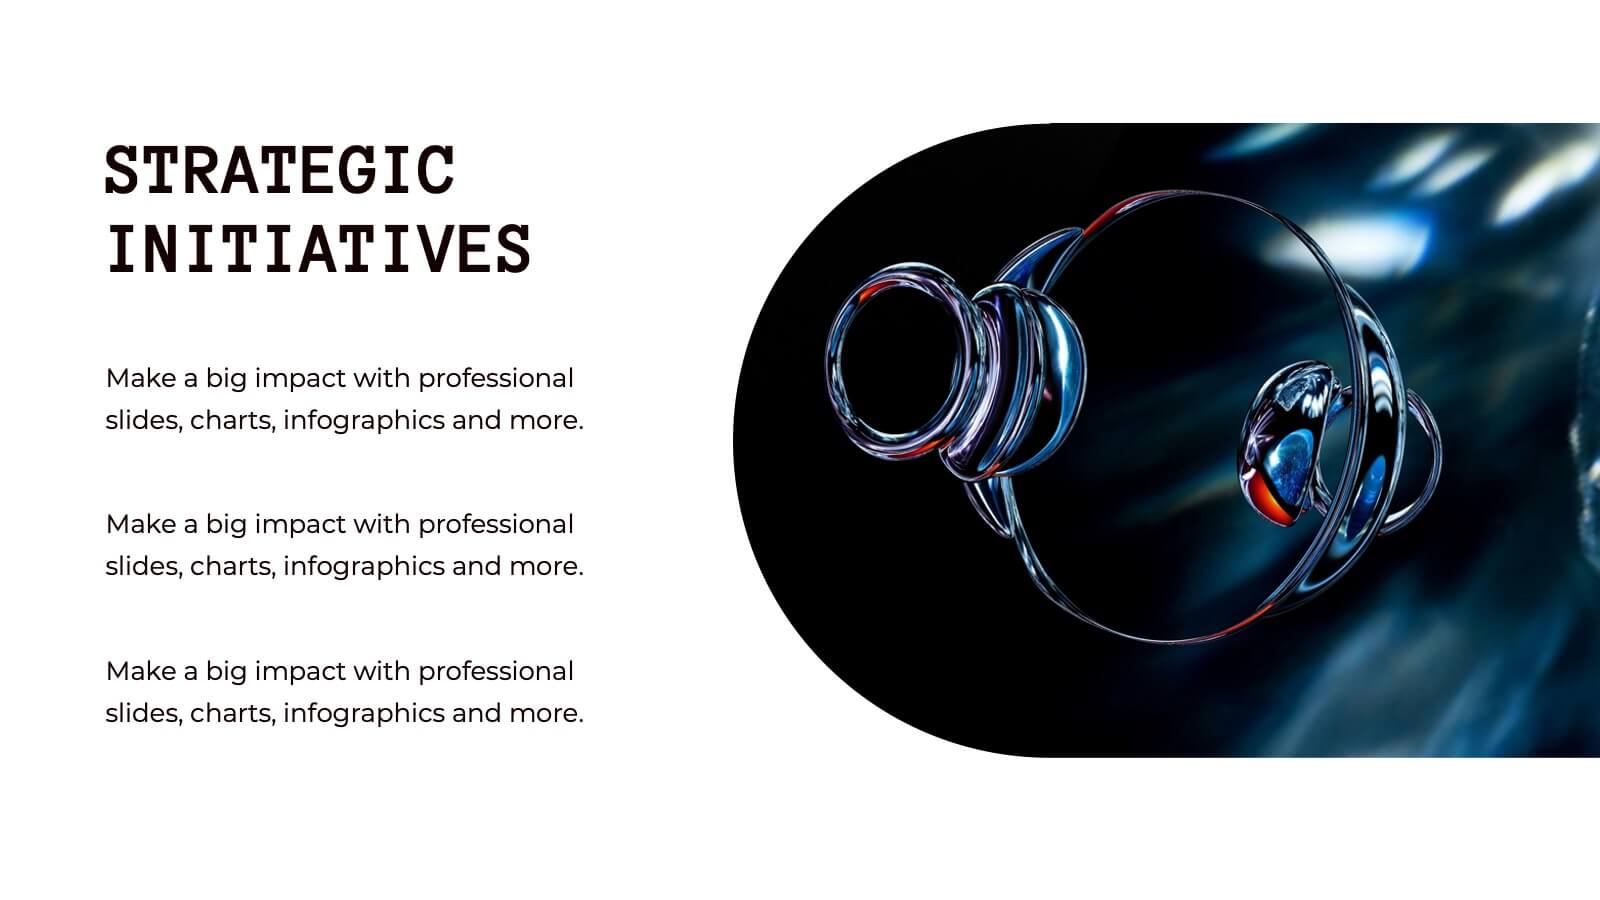
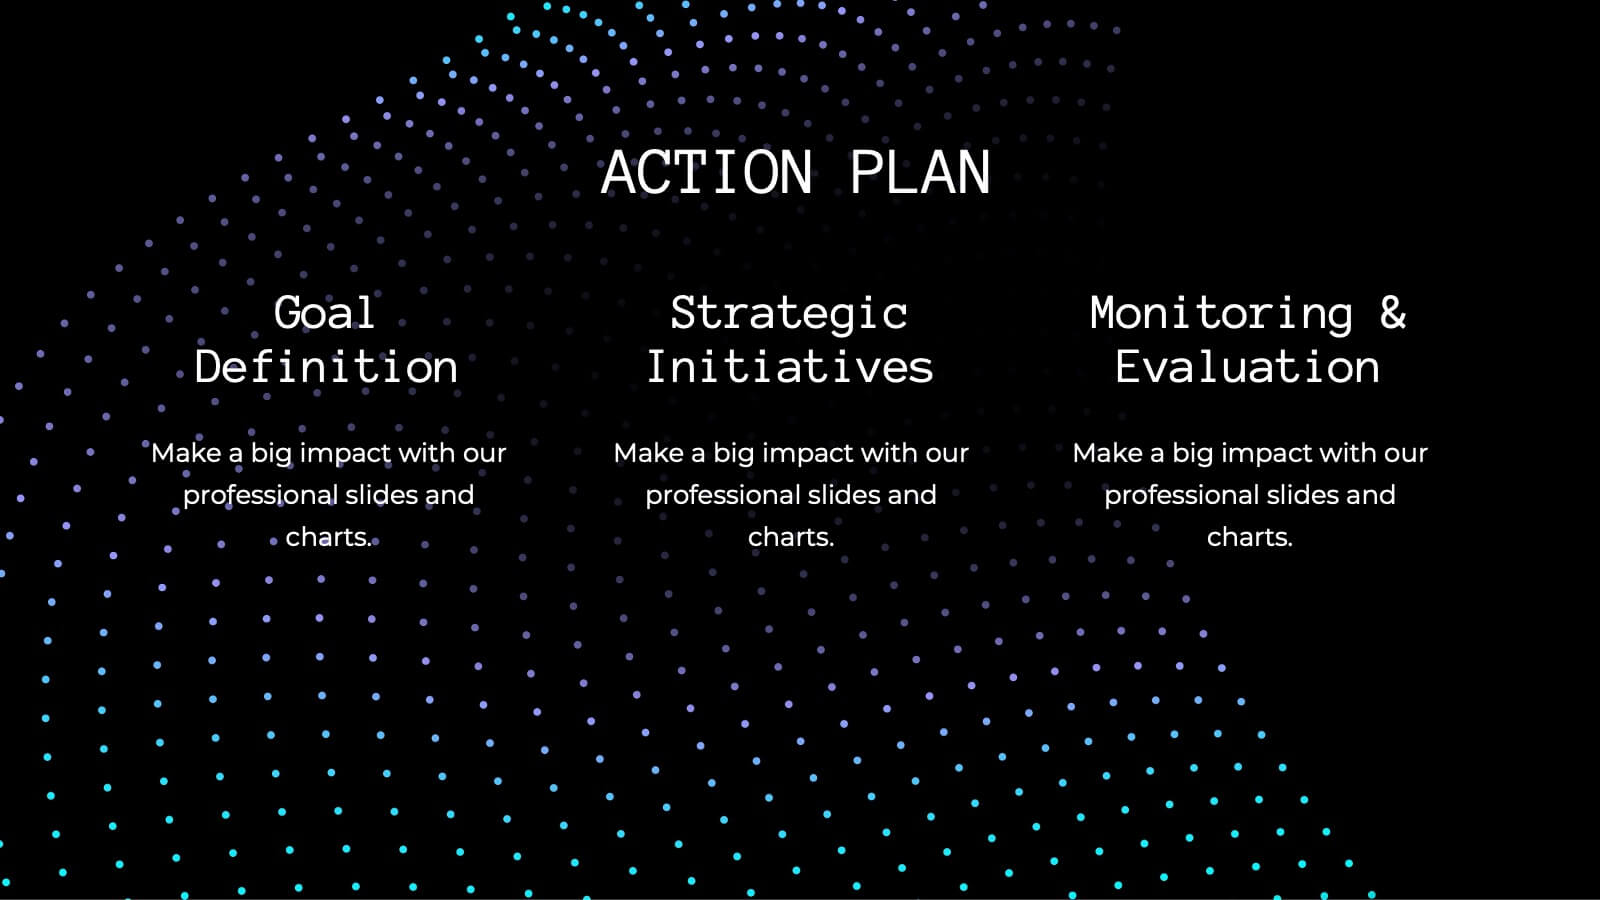
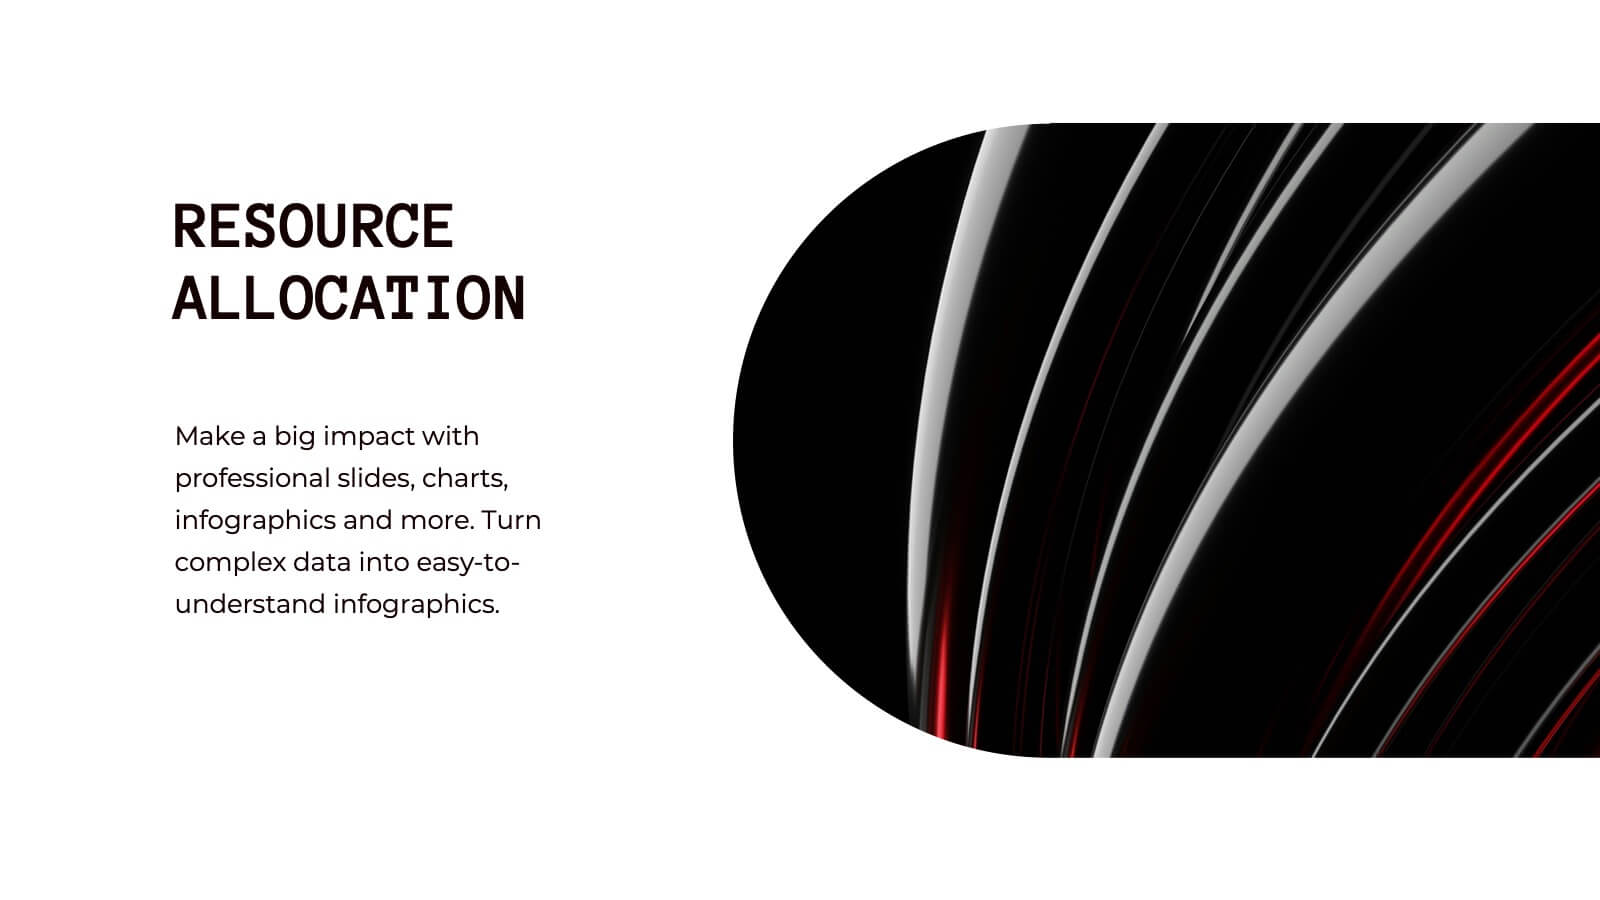
Mermaid Corporate Strategy Proposal Presentation
Present your corporate strategy with confidence using this sleek, modern proposal template! It covers strategic objectives, market trends, SWOT analysis, and resource allocation, ensuring a comprehensive overview of your plan. Fully customizable and compatible with PowerPoint, Keynote, and Google Slides, this template is ideal for launching new initiatives and achieving business goals.


7 slides
Smile Rating Infographic Presentation Template
Our Smile Rating Infographic is a template that is best used for promoting services. This useful template includes charts that can assist you to convey information about your business, company or product. This Smile Rating infographic is a powerful tool for instilling positive behavior in your customers. This template will show customer's interactions with you and gives you valuable information about what they expect from their most recent experience. This infographic is designed to help your customers rate their experience, and let you know where they think improvements can be made.


7 slides
Smart House Concept and Design Layout Presentation
Present your smart home innovations with the Smart House Concept and Design Layout Presentation. This slide features a central house icon and six circular nodes, ideal for explaining home automation systems, IoT integrations, or security features. Fully editable in Canva, PowerPoint, Keynote, and Google Slides—perfect for tech startups, product demos, and future living pitches.


3 slides
Short-Term and Long-Term Action Goals Presentation
Plan with purpose using the Short-Term and Long-Term Action Goals Presentation. This clear, side-by-side layout helps you organize initiatives by timeframe—perfect for project planning, strategy roadmaps, or goal tracking. Fully editable in Canva, PowerPoint, and Google Slides for easy customization across teams and presentations.


6 slides
Modern Agriculture Industry Trends
Highlight key data and insights with this visually engaging agriculture-themed slide. Designed with circular data visuals and crop illustrations, it's perfect for showcasing percentages, trends, or growth stats in modern farming, agri-tech, and sustainability initiatives. Fully editable in PowerPoint, Keynote, and Google Slides.


6 slides
Oceania Regional Coverage Strategy Presentation
Plan and present your regional focus with the Oceania Regional Coverage Strategy Presentation. This slide template features a clear map of Oceania with pinpoint markers and corresponding callout labels, perfect for visualizing expansion zones, logistics hubs, or target markets. Fully customizable in Canva, PowerPoint, and Google Slides.


21 slides
Phoenix Design Portfolio Presentation
Elevate your design presentations with this stylish, contemporary template. Perfect for showcasing design portfolios, concept development, and project timelines, it features a modern layout with vibrant colors. Highlight key elements like color palettes, textures, and design processes to captivate your audience. Compatible with PowerPoint, Keynote, and Google Slides, it ensures seamless presentations on any platform.


7 slides
Business Concept Mind Map Presentation
Visualize strategic thinking with the Business Concept Mind Map Presentation. This clear, central-diagram layout helps organize six core ideas around a business theme, making complex concepts easy to grasp. Ideal for planning, brainstorming, or presentations. Fully editable and compatible with PowerPoint, Keynote, and Google Slides for maximum flexibility.