


Features
- 3 Unique slides
- Fully editable and easy to edit in Microsoft Powerpoint, Keynote and Google Slides
- 16:9 widescreen layout
- Clean and professional designs
- Export to JPG, PDF or send by email


Do you have any questions?
Recommend


7 slides
Business People Networking Infographic
Networking is the lifeblood of any thriving business. Our business people networking infographic, designed in a pristine white backdrop with striking orange highlights and sophisticated black nuances, encapsulates the essence of professional connections and collaborations. It provides a visual representation of how relationships can foster growth, open opportunities, and catalyze success. Tailored for business leaders, conference organizers, and networking event planners, this template offers a compelling narrative of networking's power. Fully optimized, it's compatible with leading presentation platforms: PowerPoint, Keynote, and Google Slides.


4 slides
Side by Side Comparison Presentation
Enhance your presentations with our "Side by Side Comparison Presentation" template. Designed for clarity, this infographic facilitates effective comparison of key business insights across multiple categories using a side-by-side layout. Color-coded arrows distinctly mark each comparison point, ensuring easy navigation and comprehension. Ideal for strategic reviews, product comparisons, or competitive analyses, this template helps present complex data clearly and engagingly. Its structured format is perfect for professionals looking to articulate differences and similarities effectively. Fully compatible with PowerPoint, Keynote, and Google Slides, it's an indispensable tool for those needing to present comparative data succinctly and persuasively.


6 slides
Transportation and Logistics Jobs Infographic
Transportation and logistics jobs involve managing the movement of goods, materials, and people from one location to another. This infographic template is essential in ensuring the efficient and smooth operation of supply chains, distribution networks, and transportation systems. This infographic is an informative representation of the various job roles and career opportunities available within the transportation and logistics industry. This template is designed to provide valuable insights to individuals seeking careers in this field, as well as professionals looking to explore different career paths within transportation and logistics.


6 slides
Scalable Data Systems and Analytics Presentation
Break down your cloud data architecture with clarity and flow using this visual diagram template. It helps illustrate how your scalable data systems interact—from ingestion to processing and analytics. Perfect for IT teams and tech presentations. Easily editable and compatible with PowerPoint, Keynote, and Google Slides.


7 slides
Organized Table of Content Slide Presentation
Present your topics with clarity using this Organized Table of Content Slide template. Designed for structured overviews, it features clean, modern layouts with customizable section markers and icons. Ideal for reports, proposals, and presentations. Fully editable in Canva, PowerPoint, and Google Slides to fit your brand’s style and color palette.


7 slides
Basic Tables Of Content Infographic
Our basic tables of content infographic provides a streamlined and visually engaging way to present a list of topics or sections in a document, presentation, or any content piece. With a foundational white background contrasted by vivid touches of red and multicolored highlights, this template brings both simplicity and vibrancy to the often-standard table of contents. Perfect for authors, researchers, educators, and students, this infographic offers an efficient way to present a roadmap of what lies ahead. Whether you're working on PowerPoint, Keynote, or Google Slides, this template ensures that your table of contents stands out, guiding your audience effortlessly.


8 slides
Investor Business Plan Presentation
The "Investor Business Plan Presentation" template is innovatively designed to illustrate the balance and interdependence of various business elements critical for attracting investors. Utilizing a seesaw mechanism as a metaphor, this template vividly demonstrates how key aspects like Partners, Resources, Activities, and Channels contribute to maintaining a stable and functional business model. Each section of the seesaw is colored differently to distinguish between the categories, providing a clear visual hierarchy. This presentation format is excellent for startups and existing businesses preparing to pitch to investors, highlighting how each strategic component is vital for overall success and stability in the market.


4 slides
Budget Projection with Predictive Analysis Presentation
Visualize future financial outcomes with clarity using the Budget Projection with Predictive Analysis Presentation. This modern funnel-style layout helps break down key stages of budget forecasting, making it easy to communicate progressions and data-driven insights. Perfect for financial planning, reporting, or strategic reviews. Fully editable in PowerPoint, Google Slides, Keynote, and Canva.


10 slides
Cloud Services Deployment Strategy Presentation
Present your IT roadmap with clarity using the Cloud Services Deployment Strategy slide. This vertical flowchart features ascending arrows and cloud icons, ideal for showing phased rollouts, service tiers, or migration plans. Easy to customize in PowerPoint, Keynote, and Google Slides.


5 slides
Milestones Timeline Presentation
The "Milestones Timeline Presentation" template is designed to illustrate the chronological development of a project or event. It's an effective visual tool that aligns milestones along a straightforward horizontal pathway, enhancing clarity and focus on important dates and goals. Each milestone is marked with distinct icons and titles, making it easy to convey progress and upcoming objectives. This template is particularly useful for project managers, team leaders, and educators who need to communicate key phases and achievements in a temporal context. It serves as an invaluable asset for meetings, reports, or educational materials, ensuring that each milestone is clearly highlighted and easily understood.


24 slides
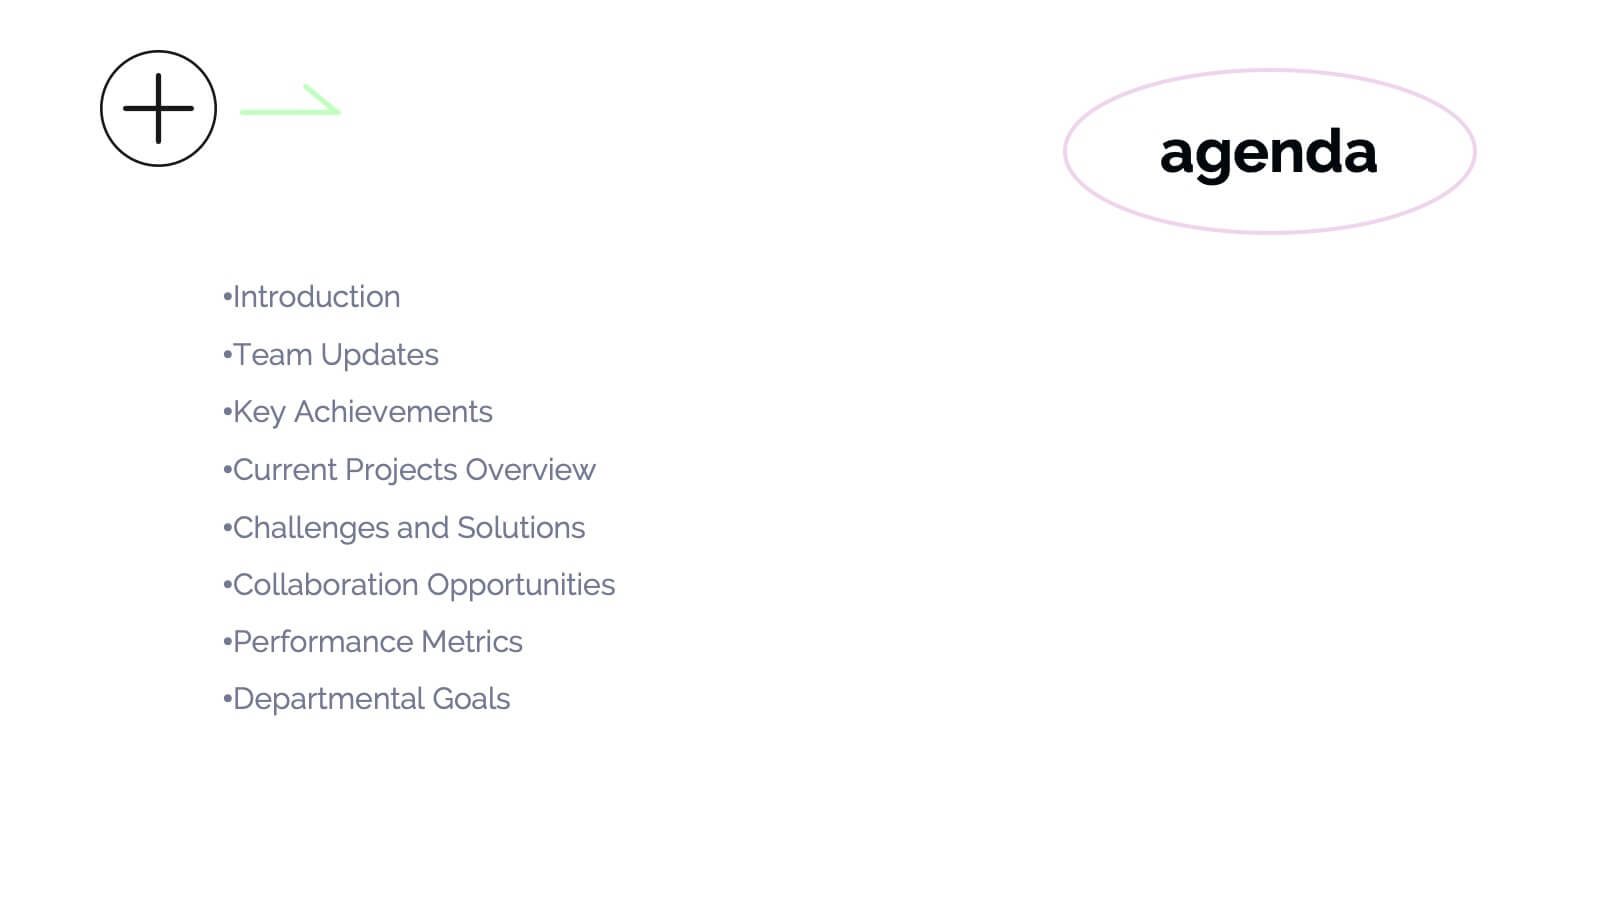
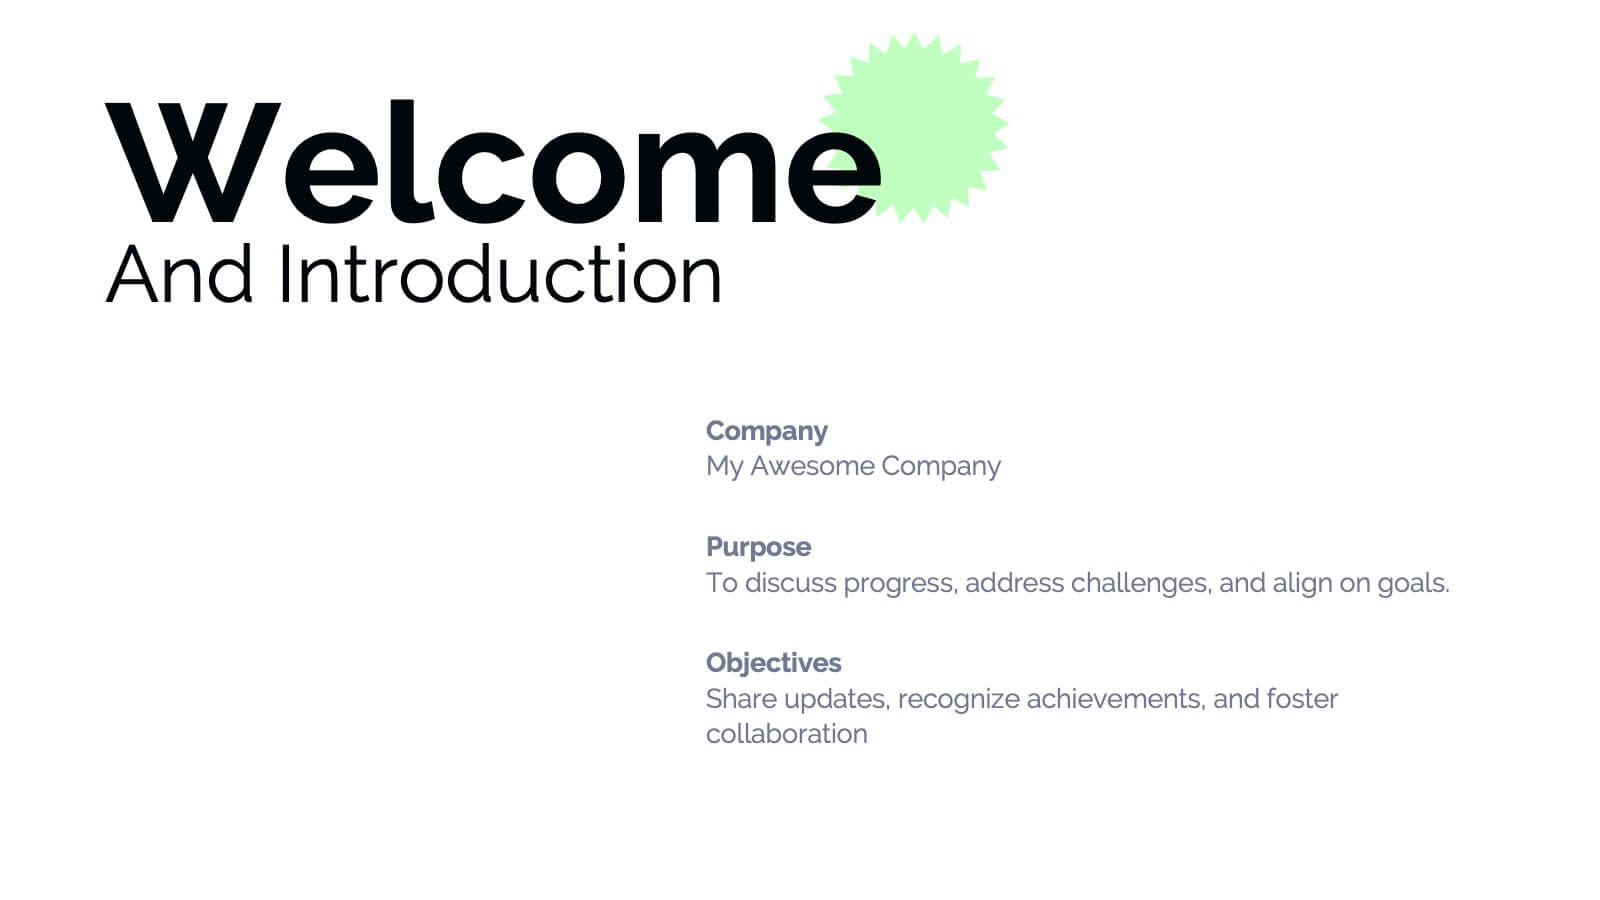
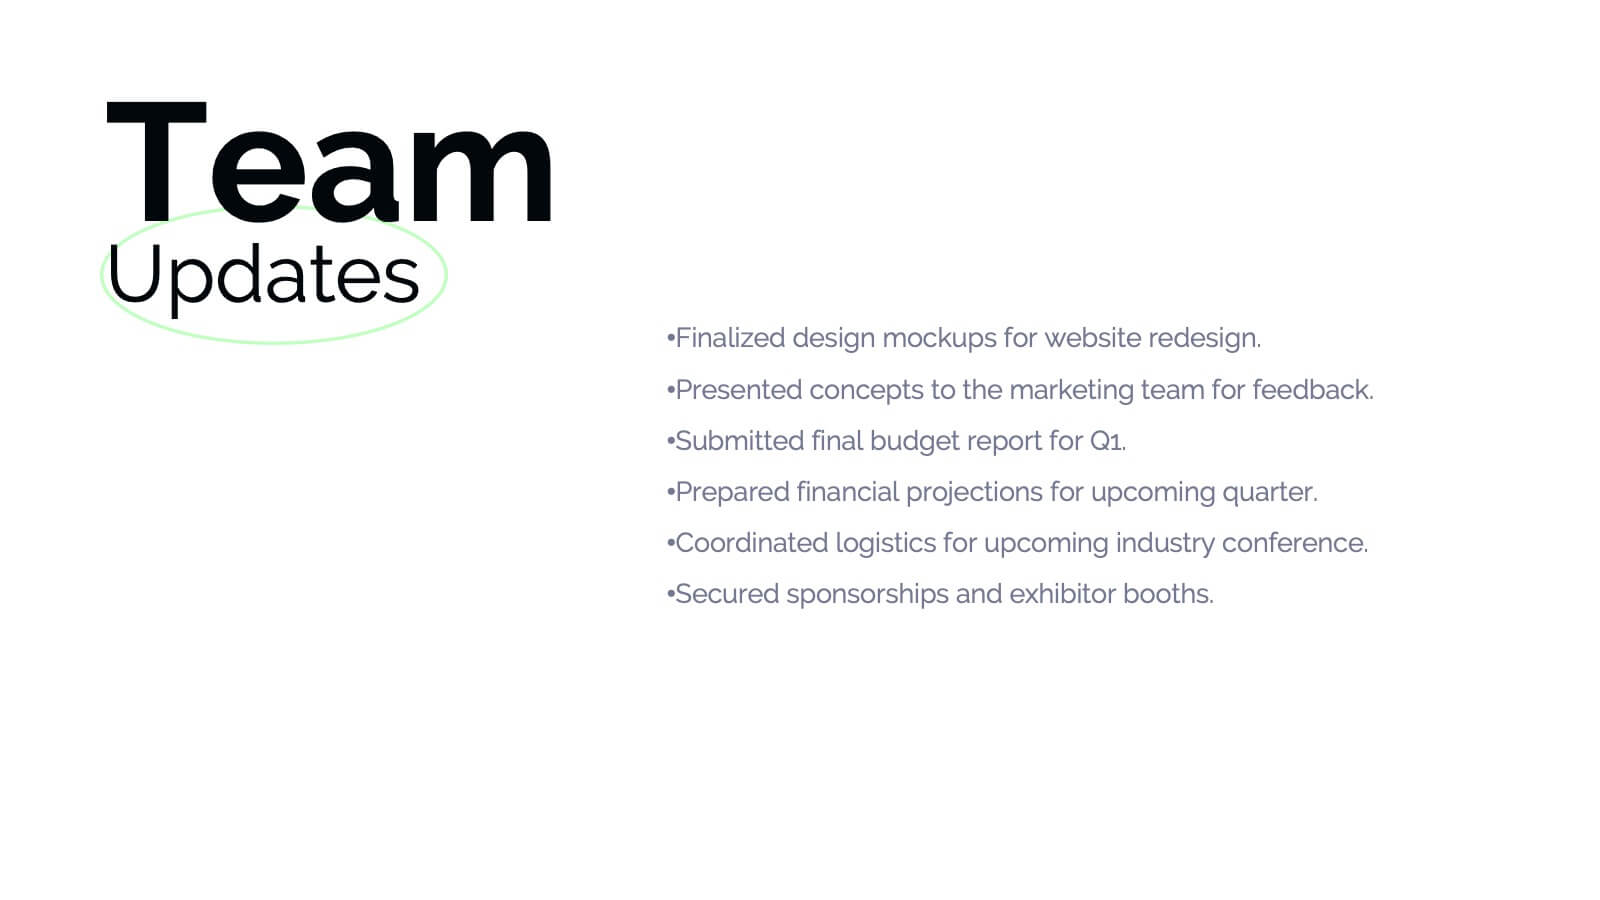
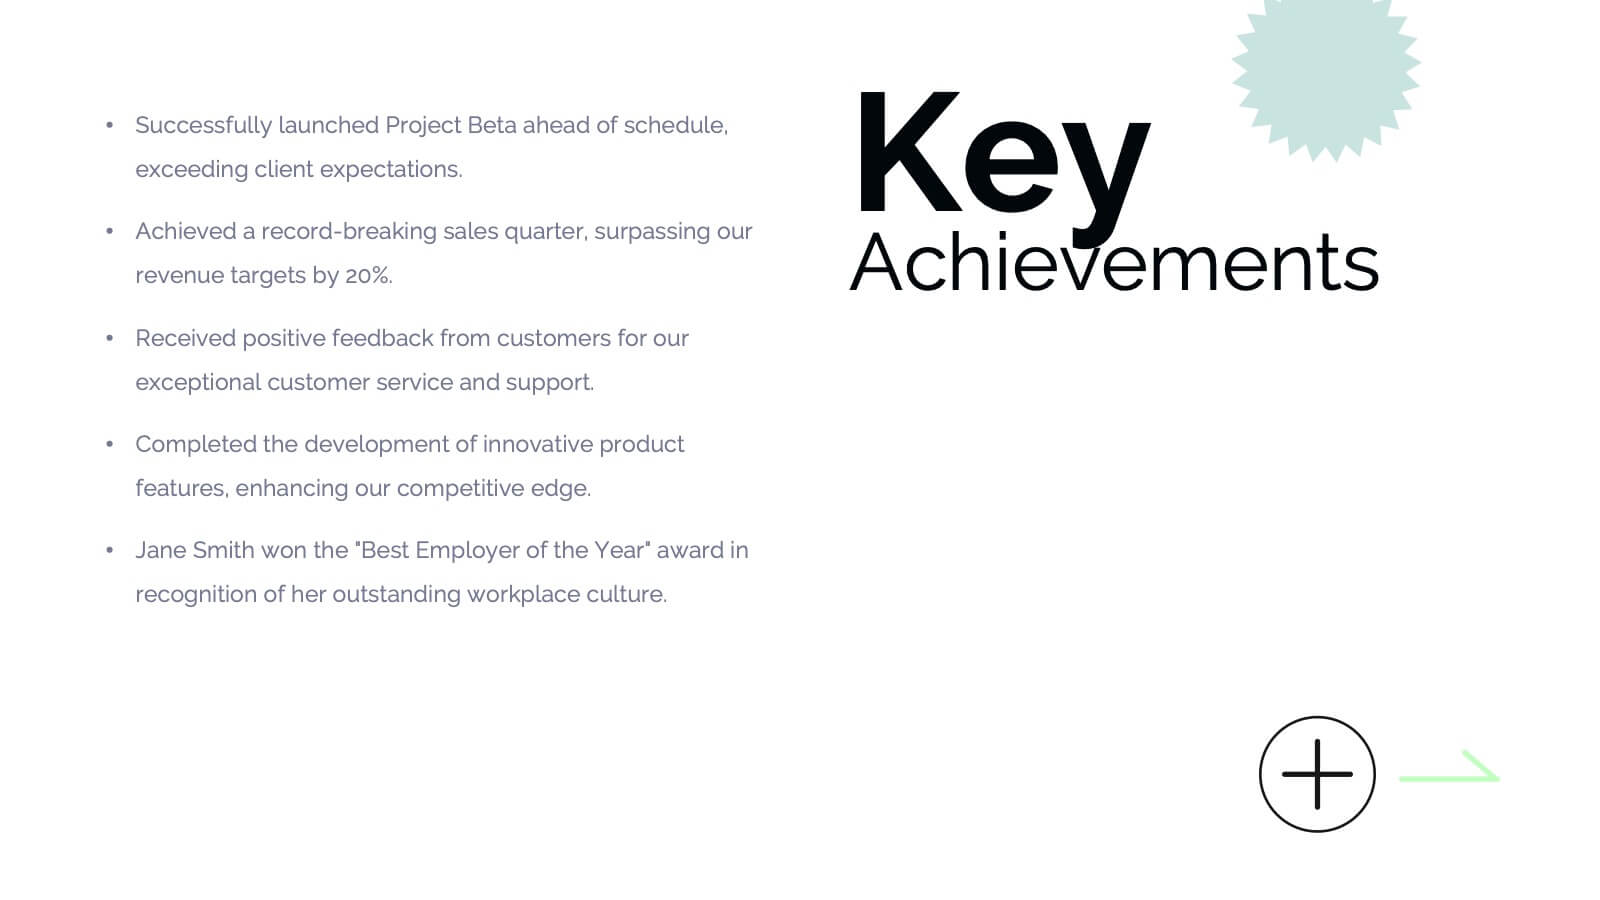
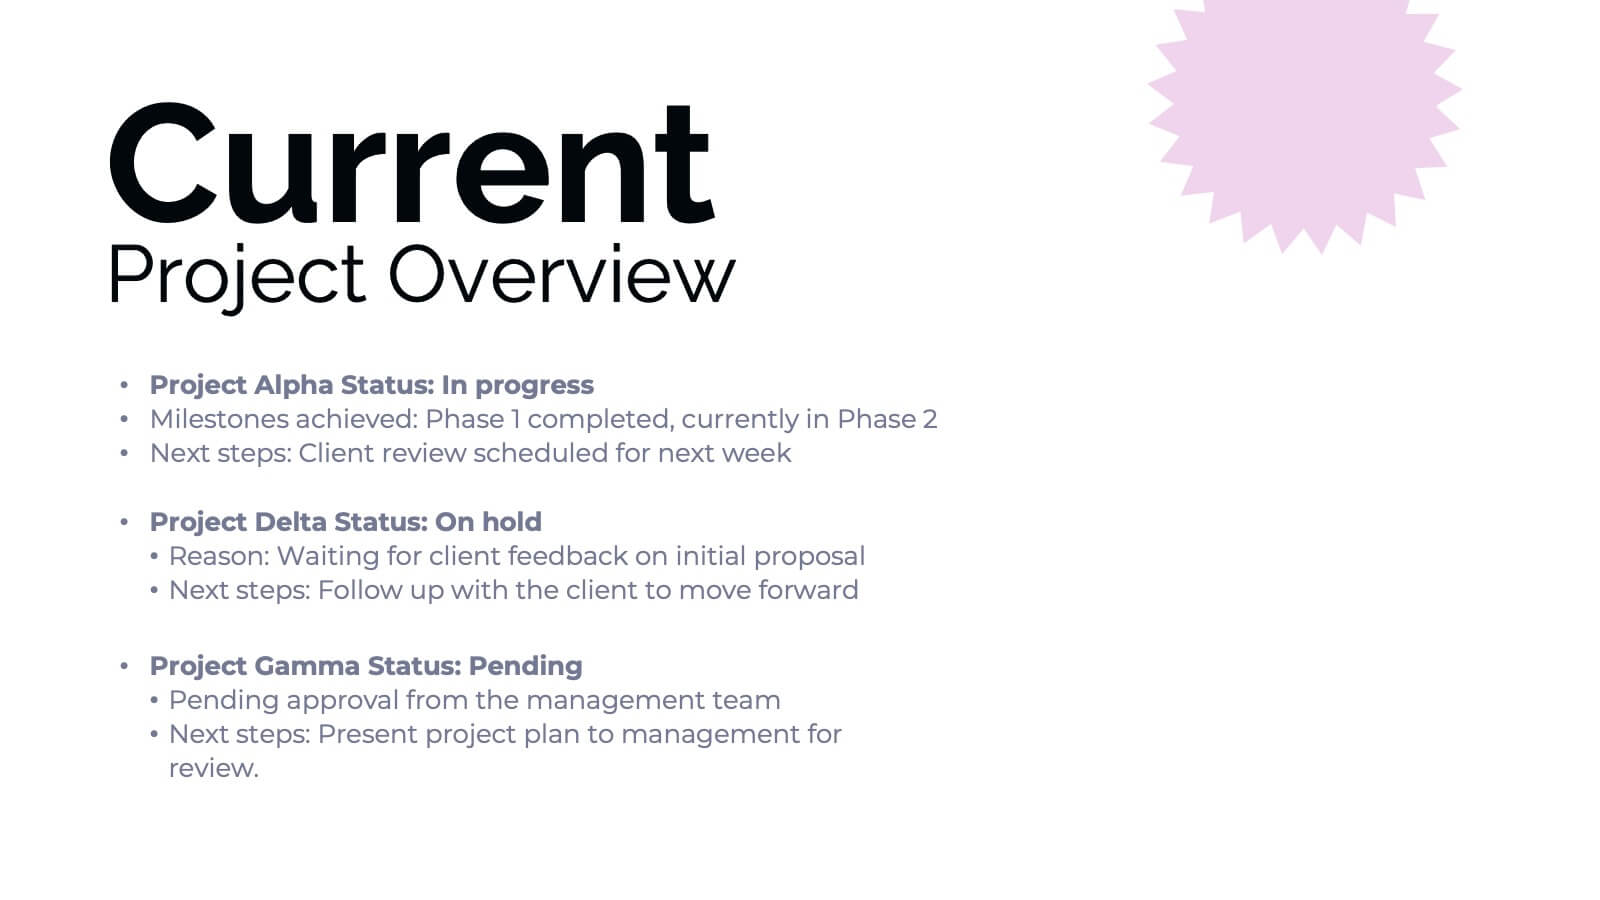
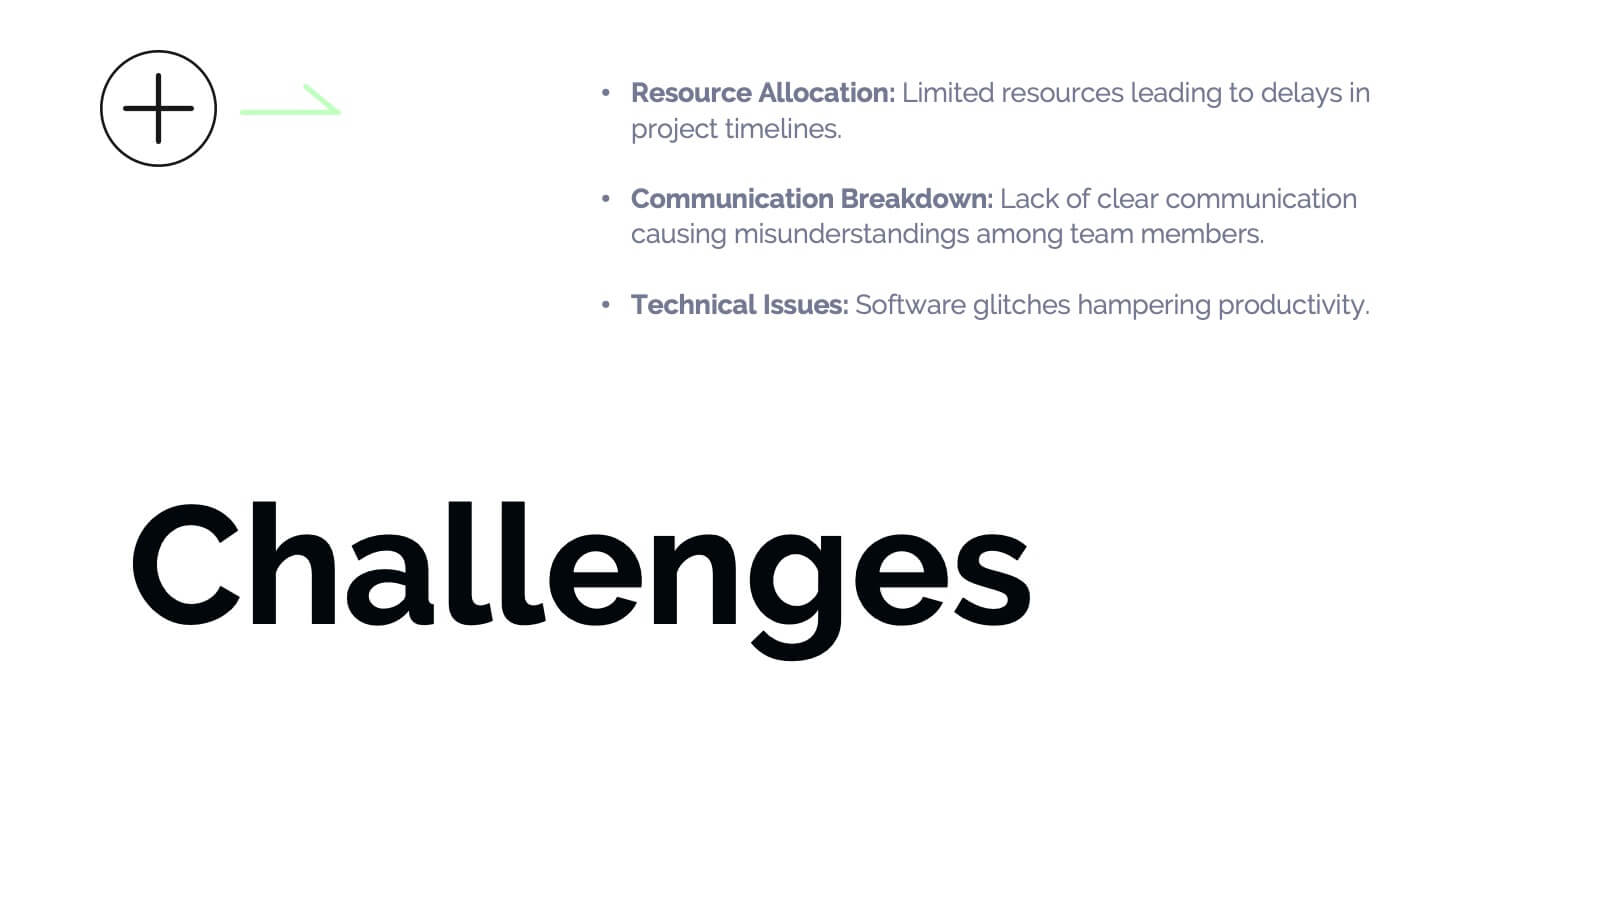
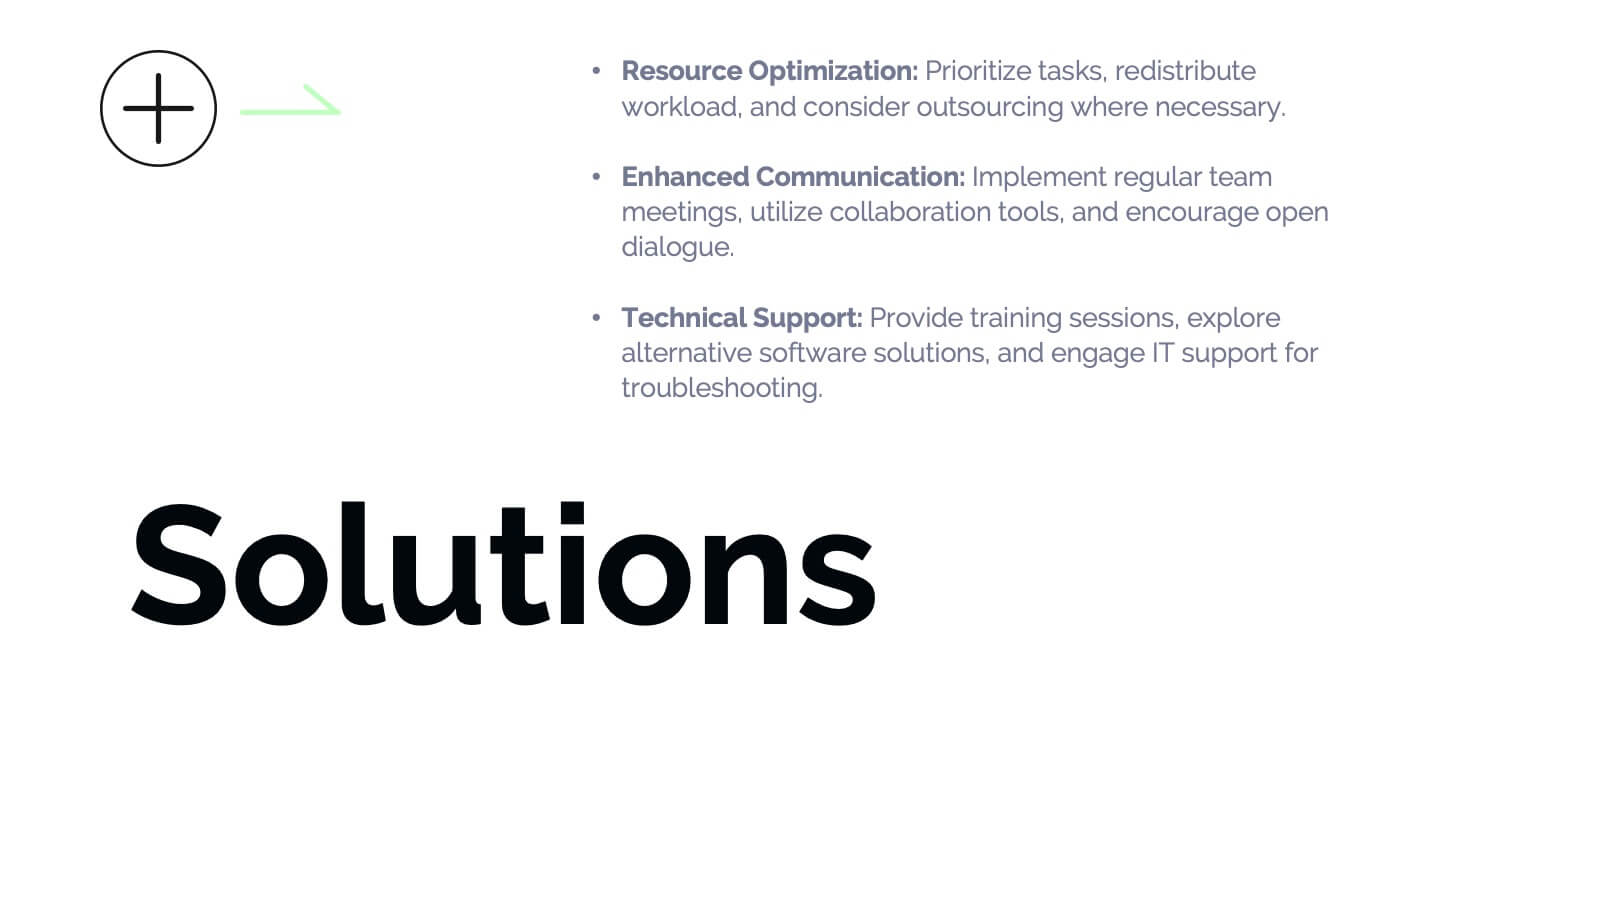
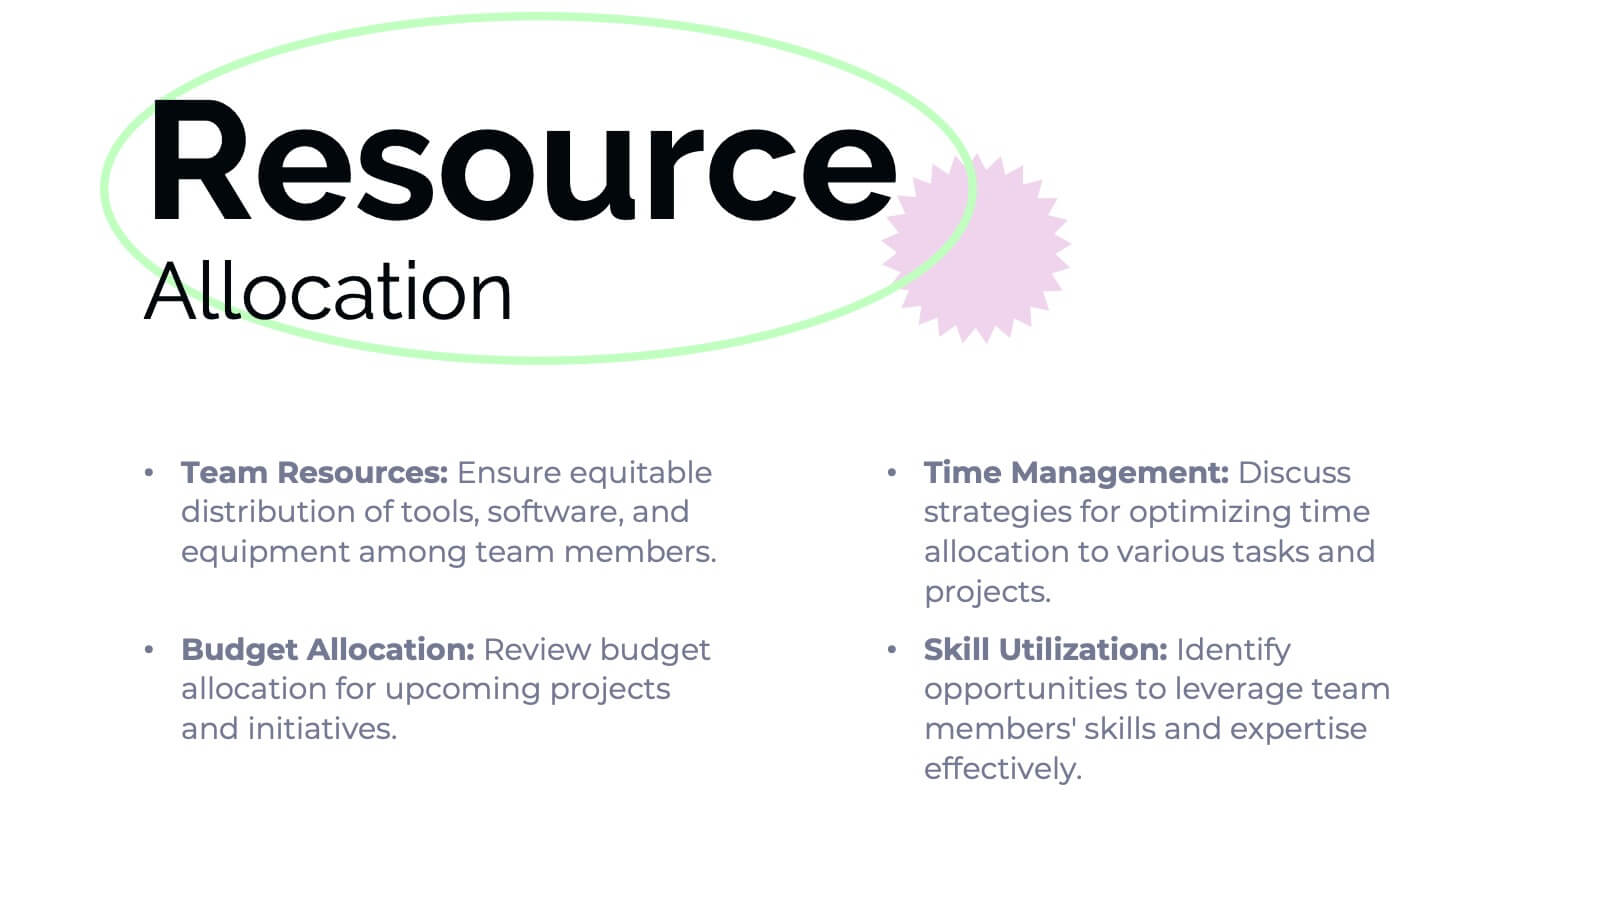
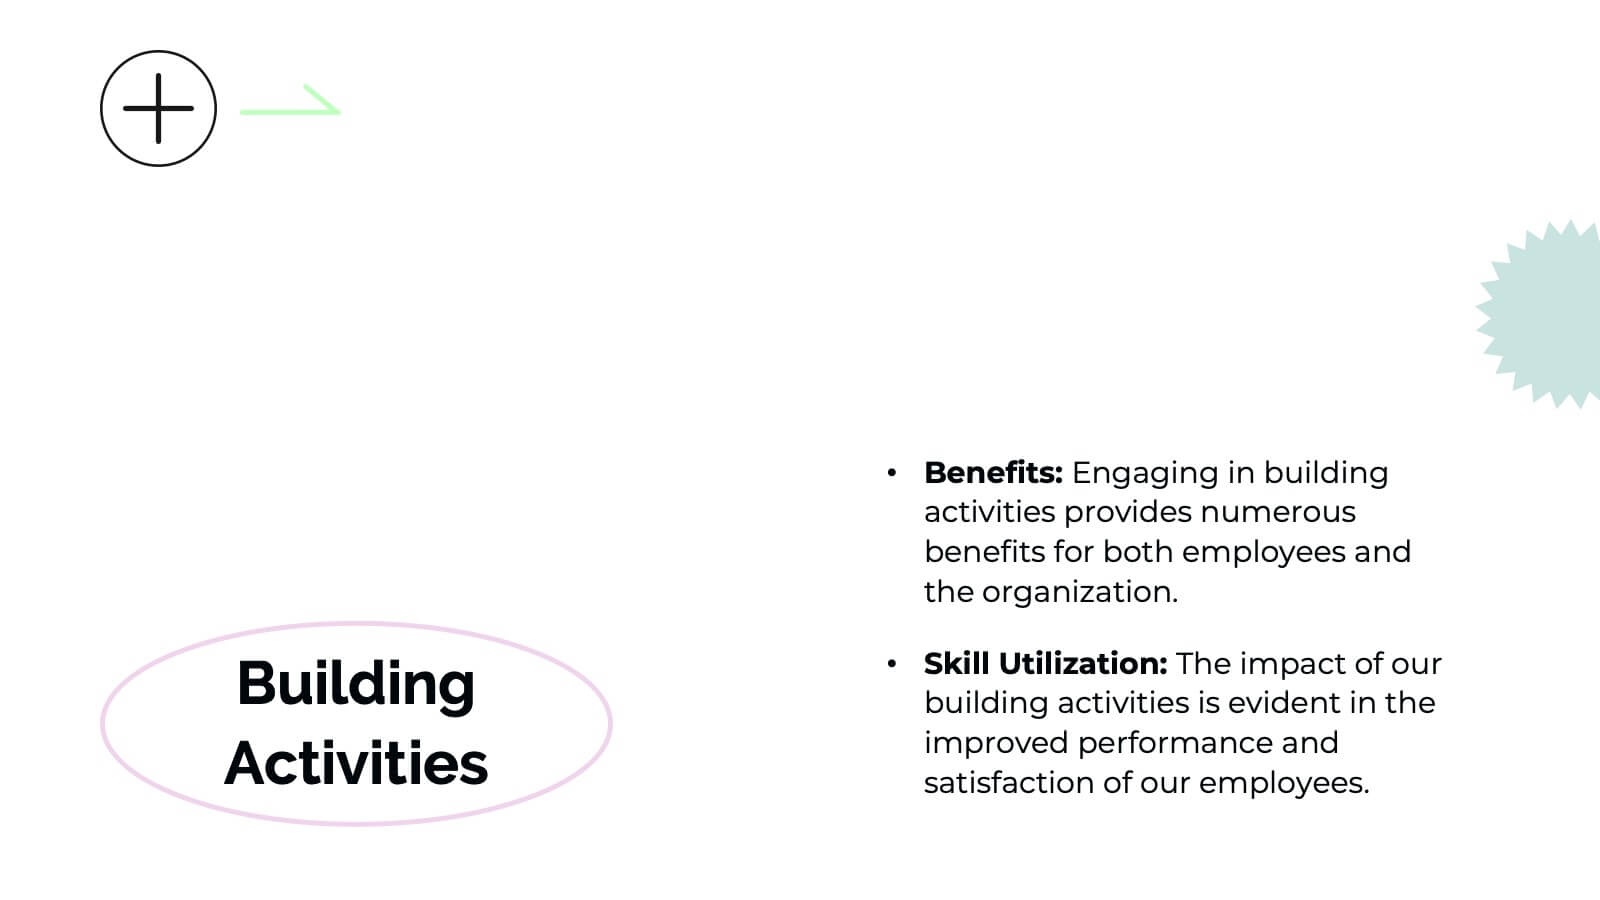
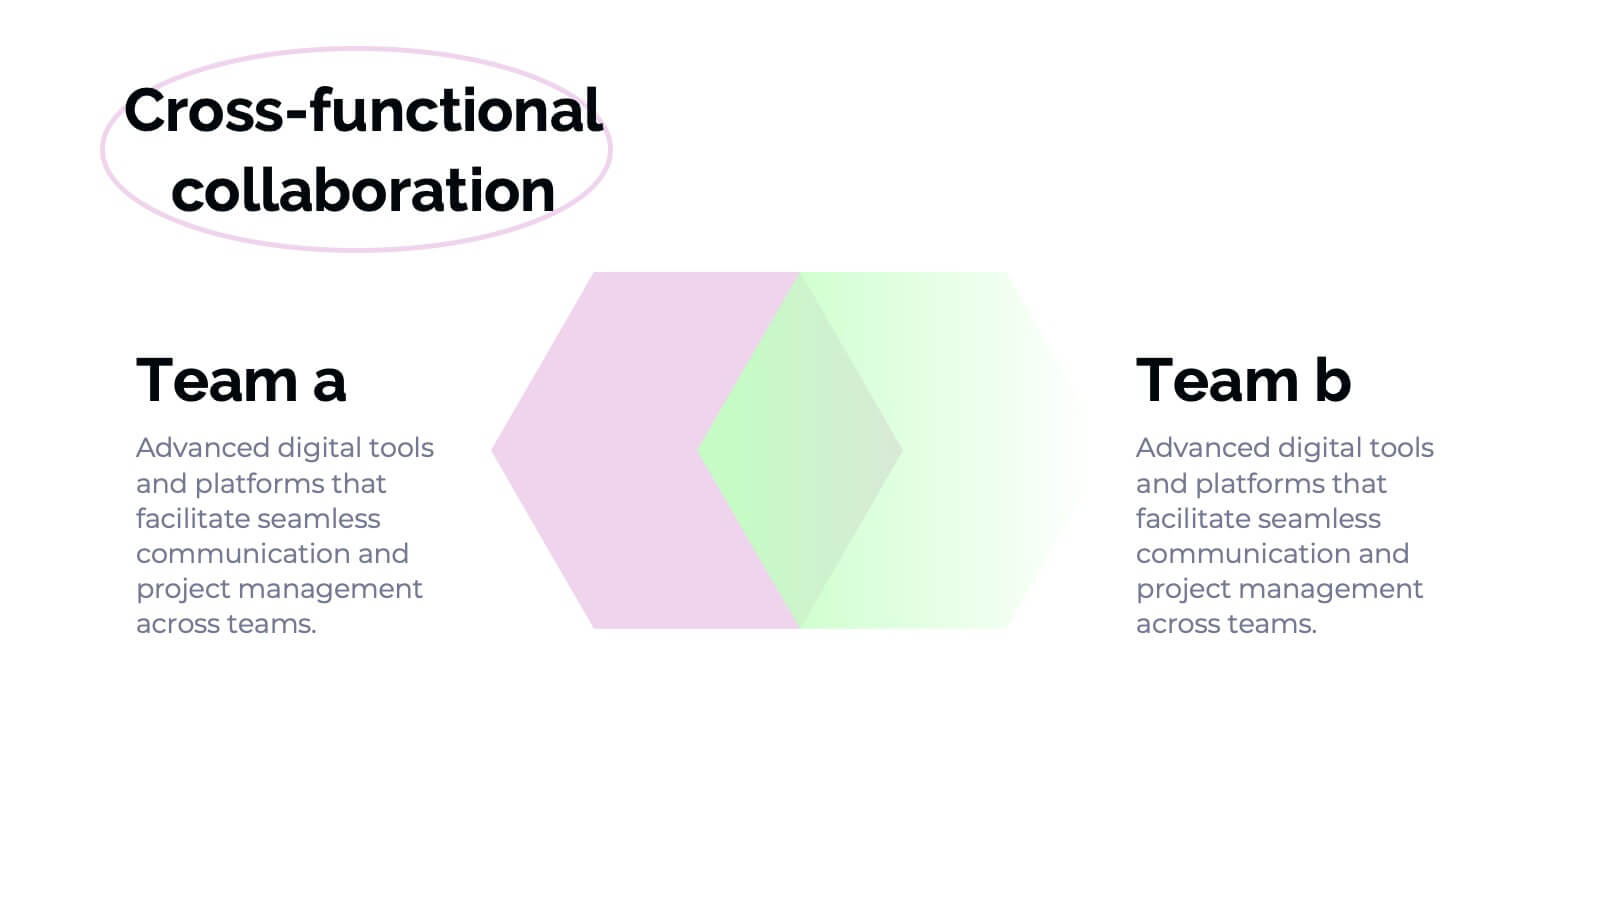
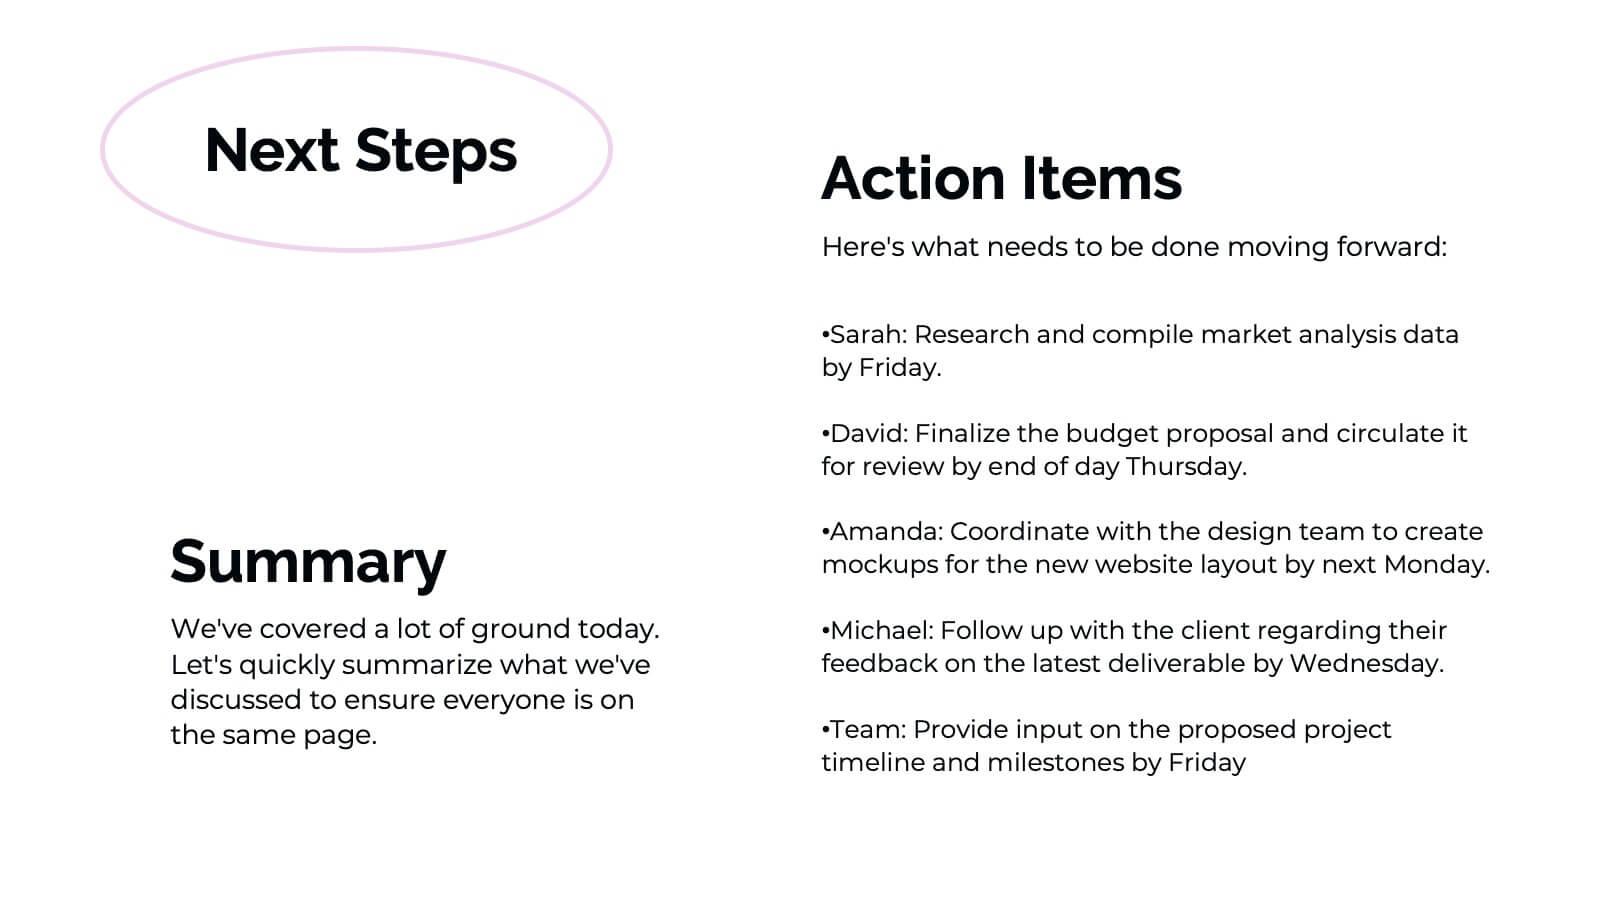
Banshee Business Operations Plan Presentation
Streamline your business operations with this comprehensive presentation template! From team updates and key achievements to challenges and solutions, every aspect of your business plan is covered. Ideal for tracking performance metrics, resource allocation, and upcoming events, this design keeps your operations organized and efficient. Compatible with PowerPoint, Keynote, and Google Slides for seamless integration.


5 slides
Performance Scaling Overview Presentation
Illustrate performance development with this sleek layered pyramid chart. Designed to visualize growth stages, team levels, or scaling strategies, each tier includes editable text and icons for clarity. Ideal for business reviews, capability mapping, or operational planning. Fully customizable in PowerPoint, Keynote, and Google Slides for effortless updates.


22 slides
Metaphor Advertising Agency Proposal Presentation
The Advertising Agency Proposal Presentation Template offers a polished structure to present your agency's expertise. With slides covering mission, case studies, services, and market analysis, it’s designed to leave a lasting impression. Perfect for securing new clients, it’s fully editable and works seamlessly with PowerPoint, Keynote, and Google Slides.


4 slides
Leadership Development and Growth Presentation
Explore the dynamics of effective leadership with our Leadership Development and Growth Presentation. This template illustrates the progressive stages of leadership maturity with unique, visually appealing graphics, making it ideal for workshops and seminars. Compatible with major presentation software to ensure accessibility and ease of use.


5 slides
Messaging Strategy and Flow Presentation
Communicate with clarity using this streamlined messaging strategy and flow presentation template. Designed to visualize the stages of message planning—from audience segmentation to final delivery—this layout helps teams align communication goals and channels. Ideal for marketing, PR, or internal comms presentations. Fully compatible with PowerPoint, Keynote, and Google Slides.


6 slides
PESTEL Analysis Business Presentation
The "PESTEL Analysis Business Presentation" template effectively facilitates a comprehensive review of the political, economic, social, technological, environmental, and legal factors that impact strategic business decisions. This template is designed to help strategists, analysts, and managers evaluate and present external factors that could affect their business operations and market environment. Each segment of the analysis is visually represented through connected circles, making complex data easily understandable. This layout encourages a structured discussion on each PESTEL aspect, ensuring that all critical elements are covered, making it an essential tool for businesses looking to align their strategies with external conditions.


9 slides
Business Dashboard Infographics
A business dashboard, often referred to as a business intelligence dashboard, is a visual representation of an organization's key performance indicators and critical business metrics. Empower your business analysis and strategy with our Infographic. This dynamic template enables you to present key business metrics, performance indicators, and trends in a clear and impactful manner. Compatible with Powerpoint, Keynote, and Google Slides. This template is a powerful tool to visualize your business progress, identify opportunities, and communicate your success story to viewers, clients, or team members.