


Features
- 5 Unique slides
- Fully editable and easy to edit in Microsoft Powerpoint, Keynote and Google Slides
- 16:9 widescreen layout
- Clean and professional designs
- Export to JPG, PDF or send by email


Do you have any questions?
Recommend


6 slides
Geographic Asia Overview Template Presentation
Discover insights across Asia with a clean, professional layout that brings your regional data to life. Perfect for showcasing demographics, market distribution, or geographic highlights, this visual map design ensures clarity and impact in every slide. Fully compatible with PowerPoint, Keynote, and Google Slides for effortless editing and presentation.


5 slides
Sprint Planning and Agile Cycle Overview Presentation
Break down agile sprints with this clean, circular cycle layout. Ideal for scrum teams and product managers to illustrate sprint planning, task flow, and iterative progress. Includes five key stages with icon support. Fully customizable in PowerPoint, Keynote, and Google Slides for agile ceremonies, planning sessions, or team training.


4 slides
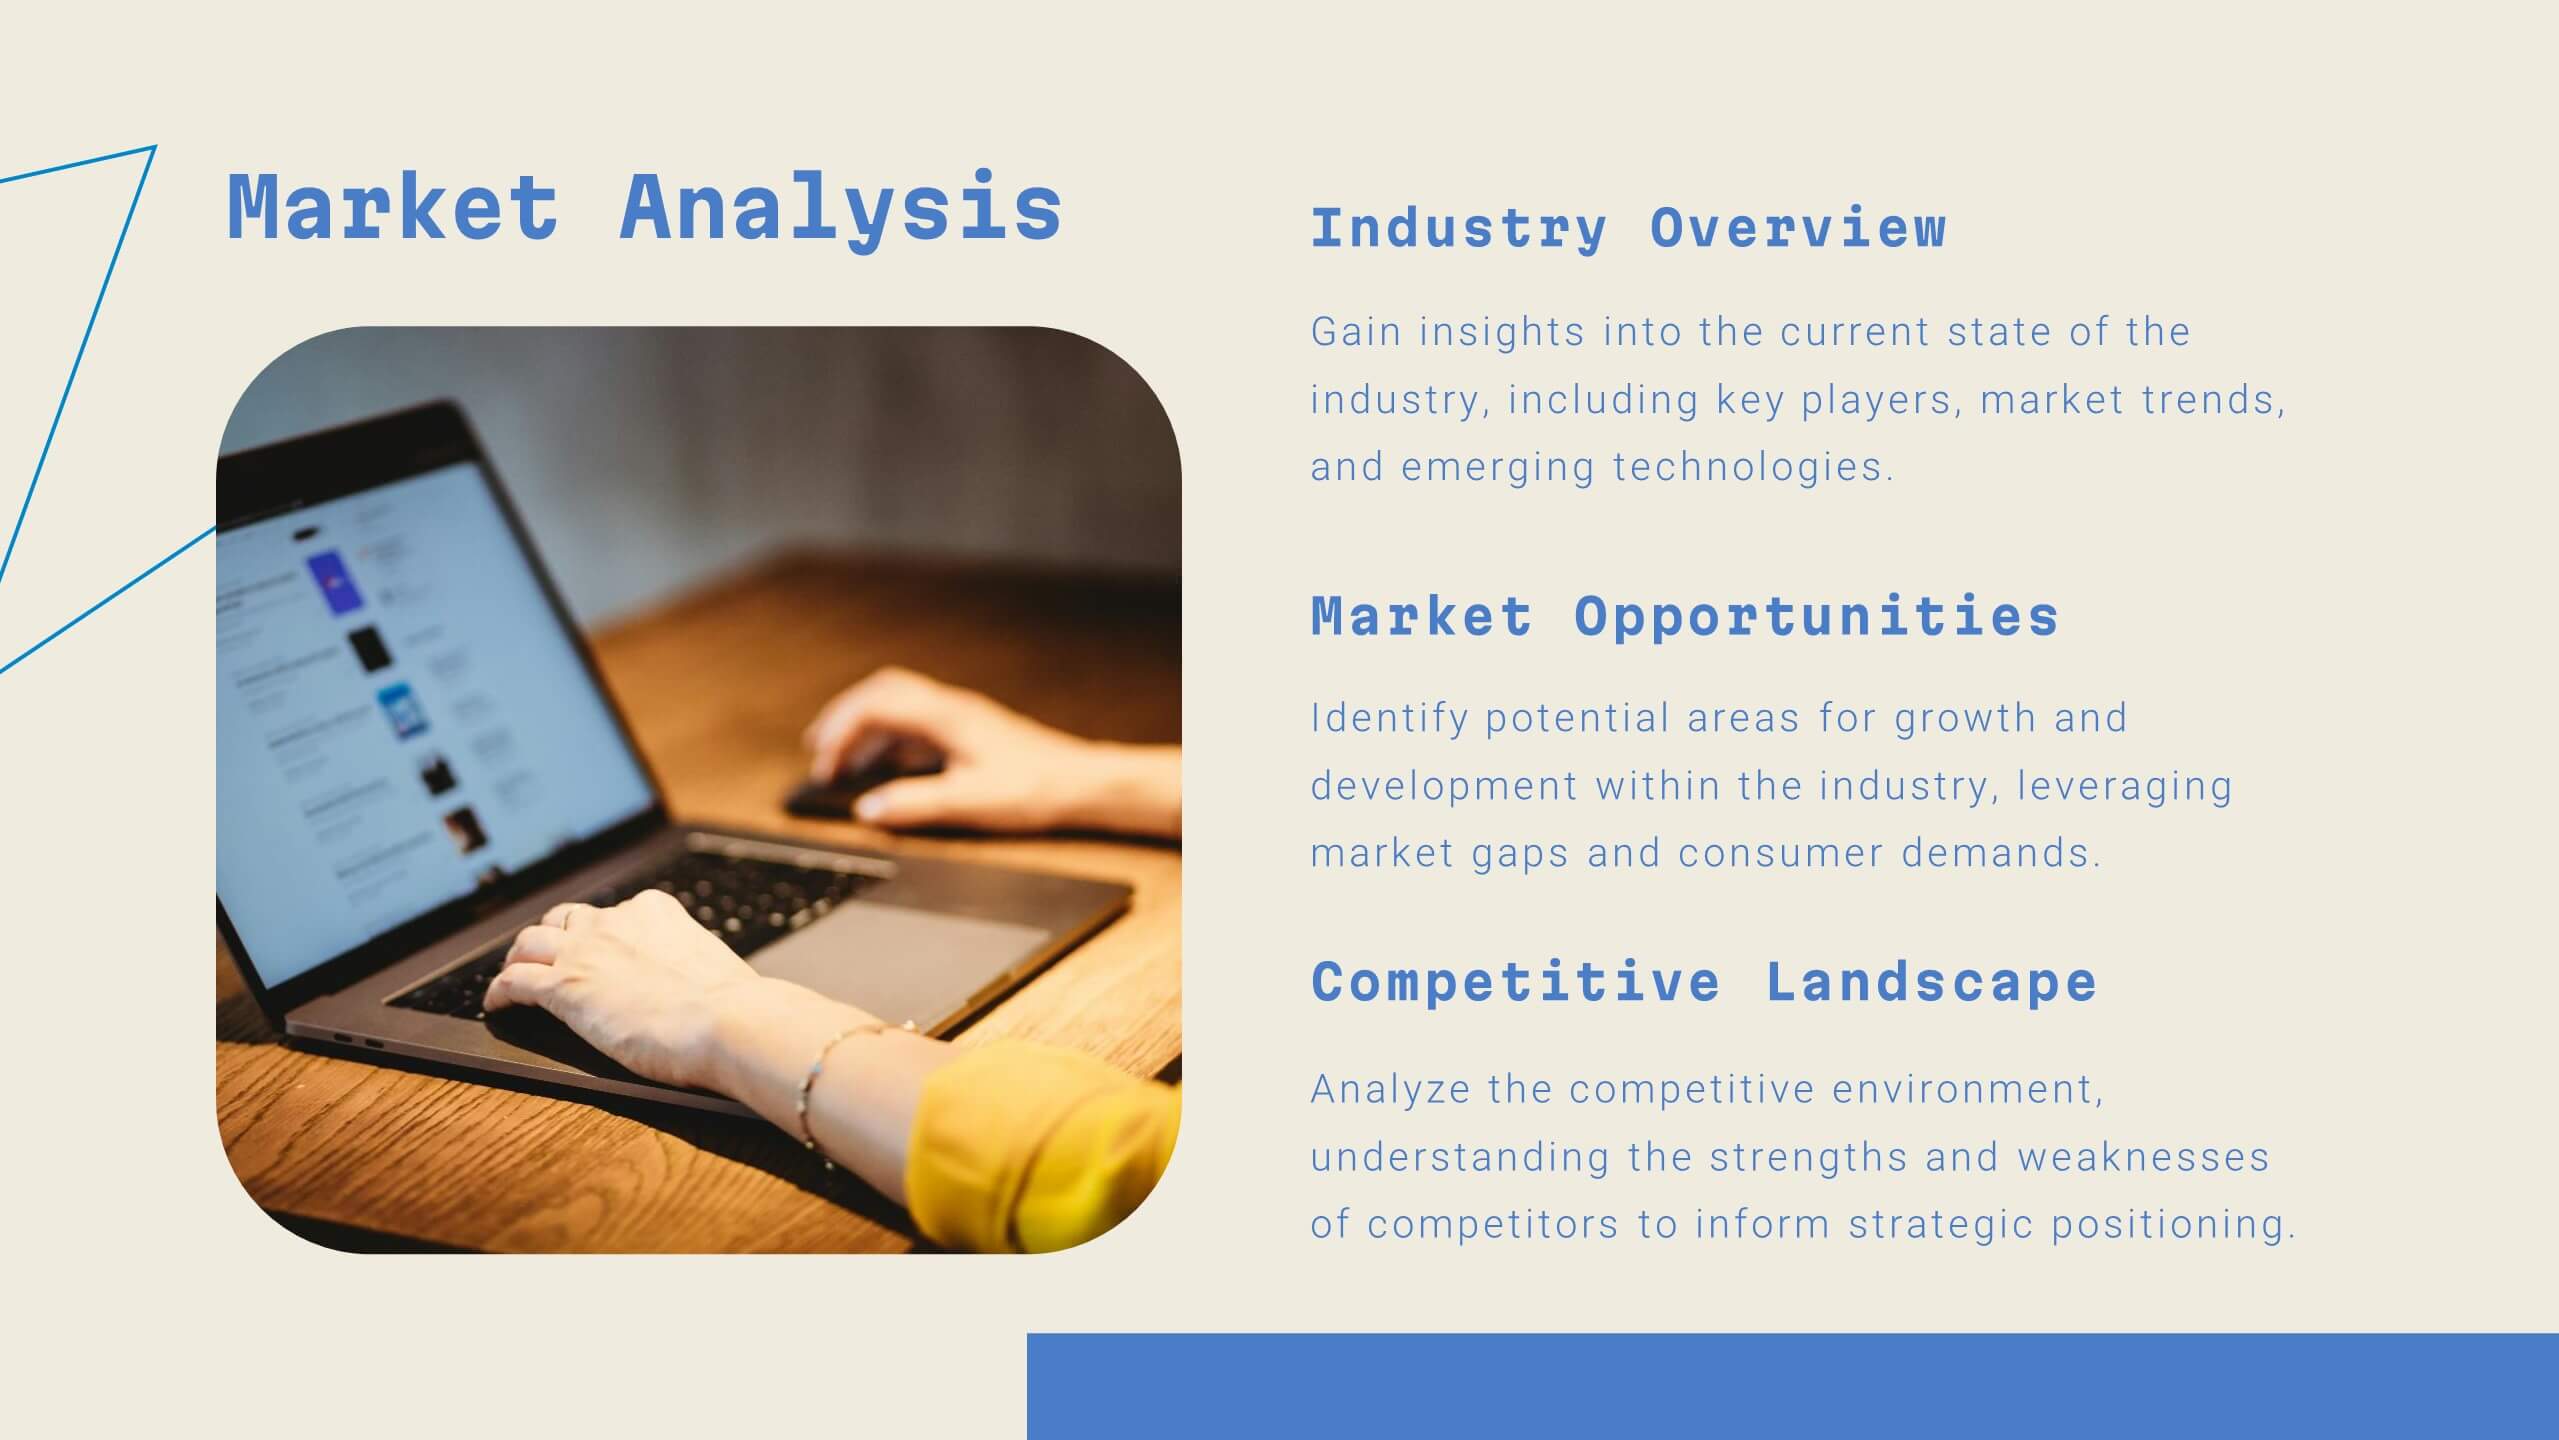
Social Media and Online Marketing Trends
Showcase emerging strategies with this mobile-inspired layout perfect for social media and online marketing updates. The clean design highlights trends like SEO, influencer marketing, and content innovation with clarity. Fully customizable and compatible with PowerPoint, Keynote, and Google Slides.
22 slides
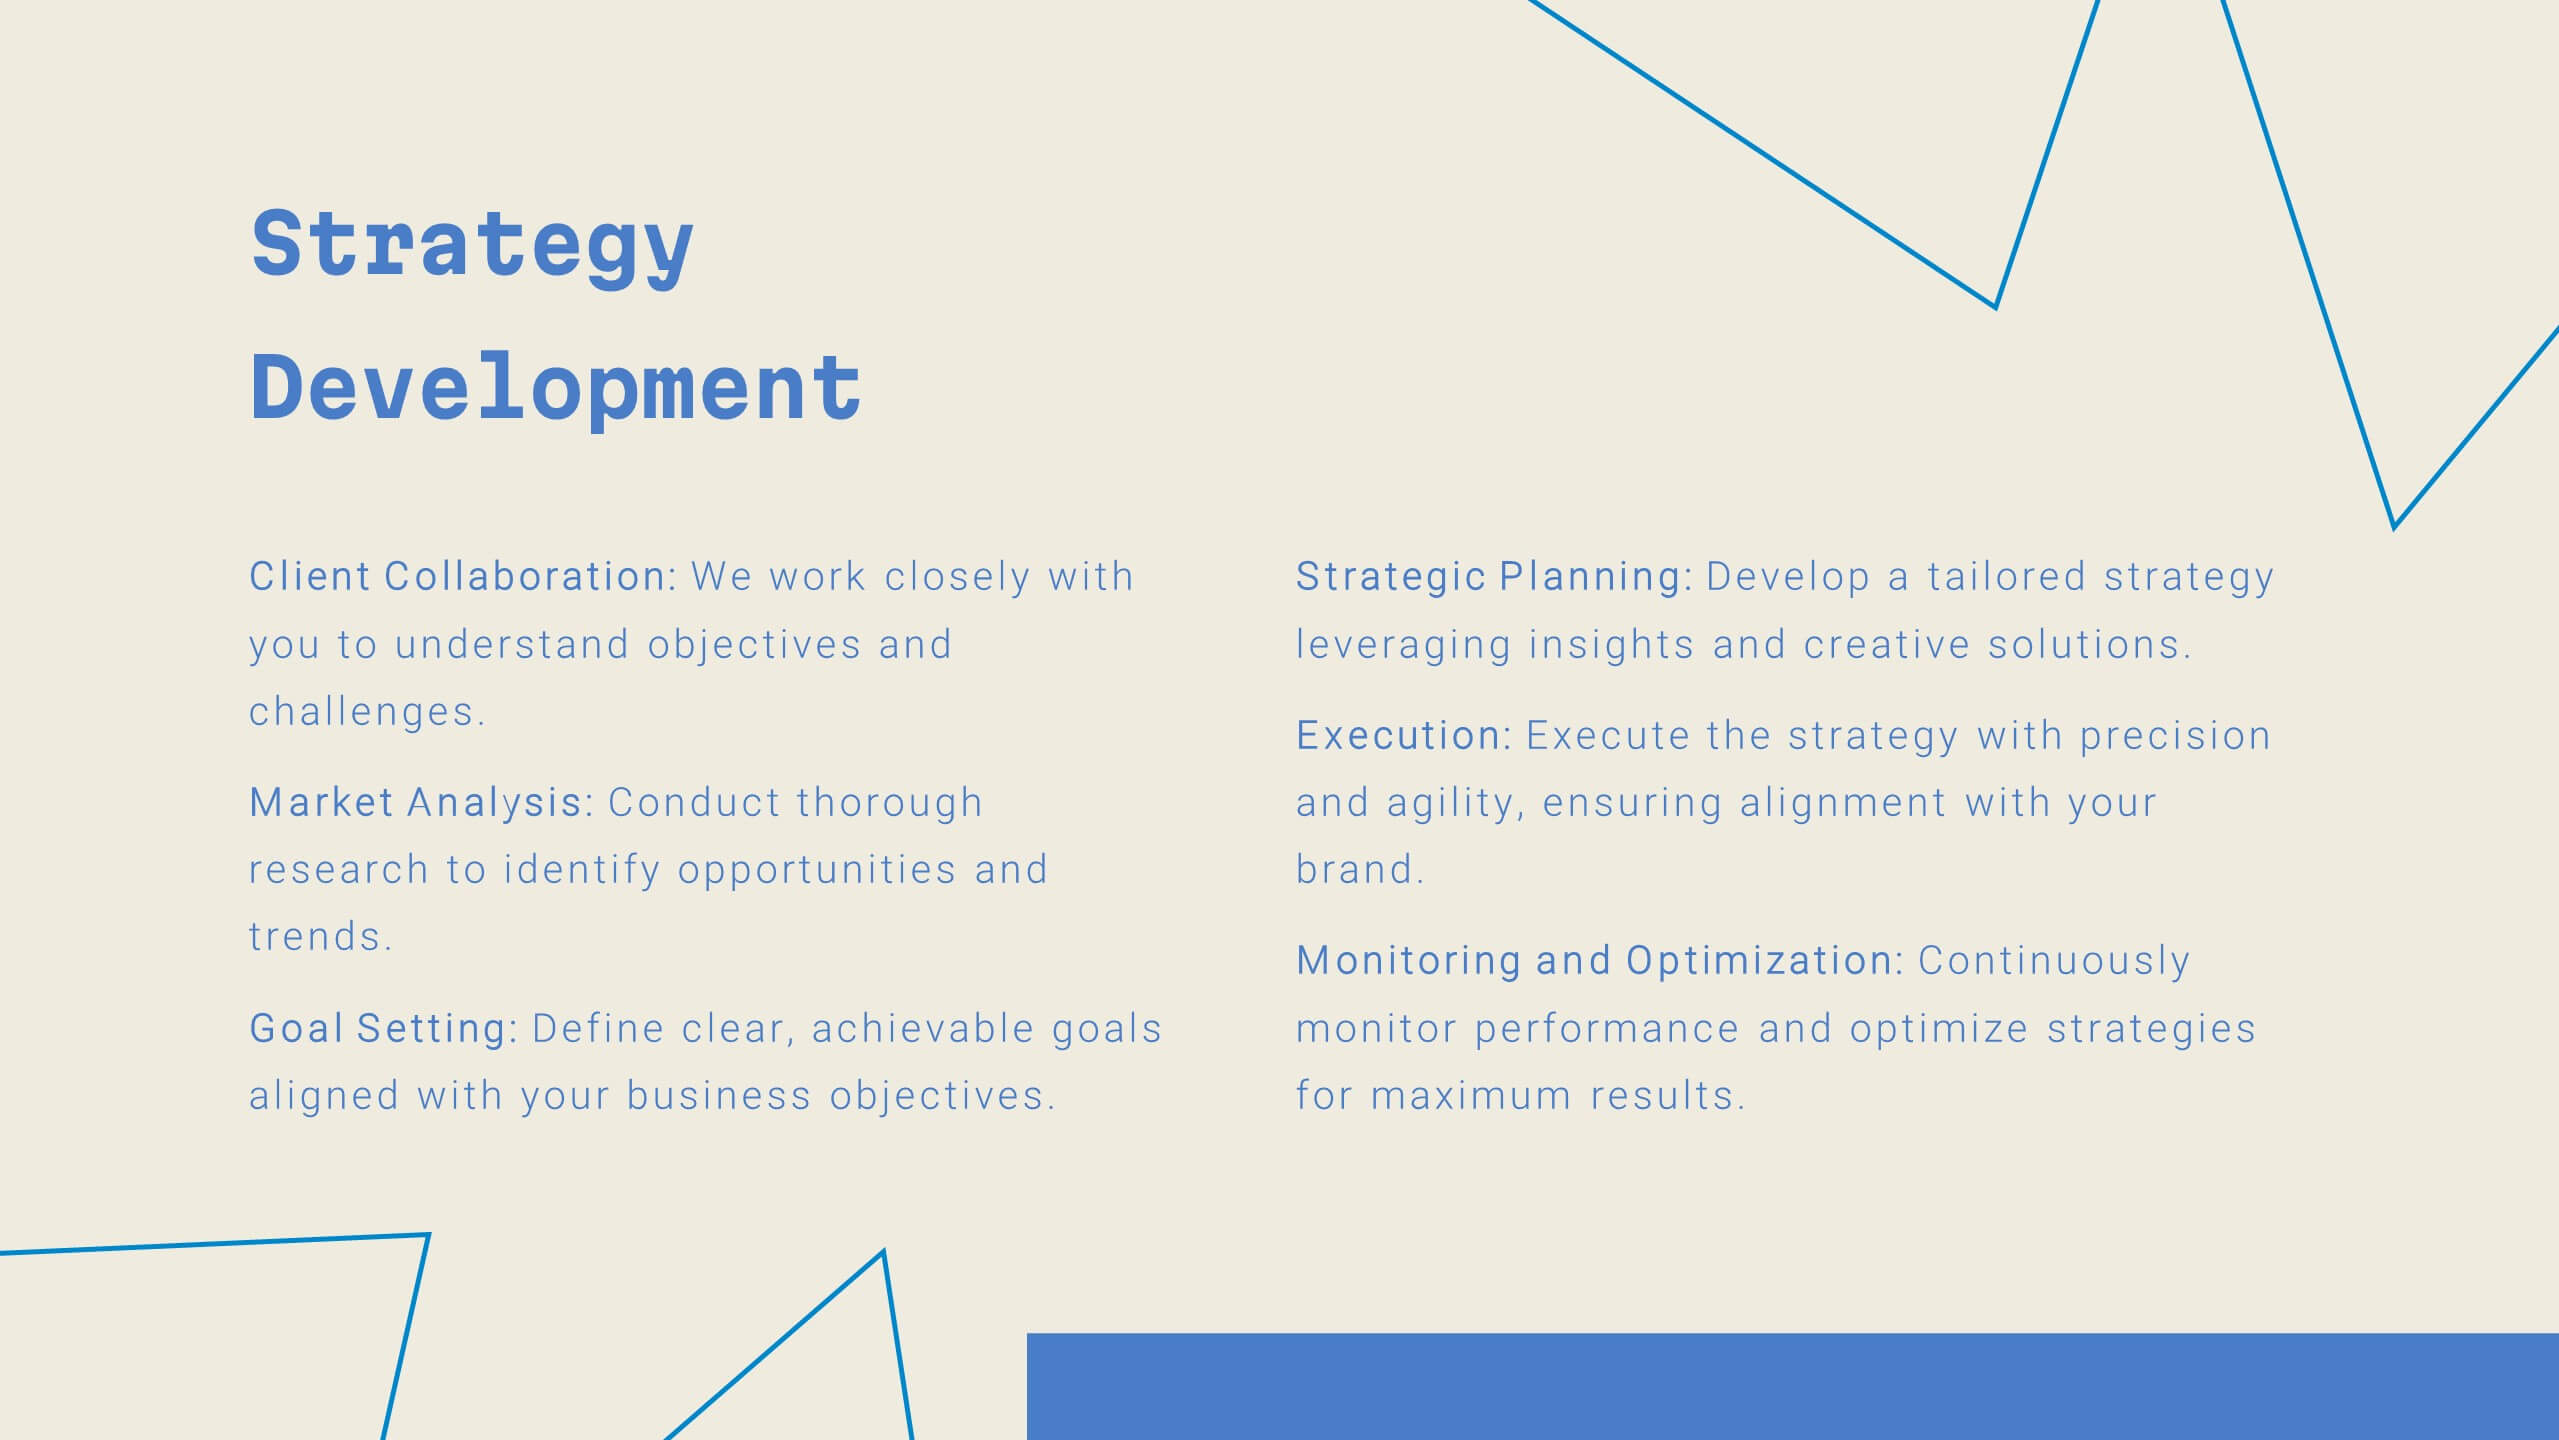
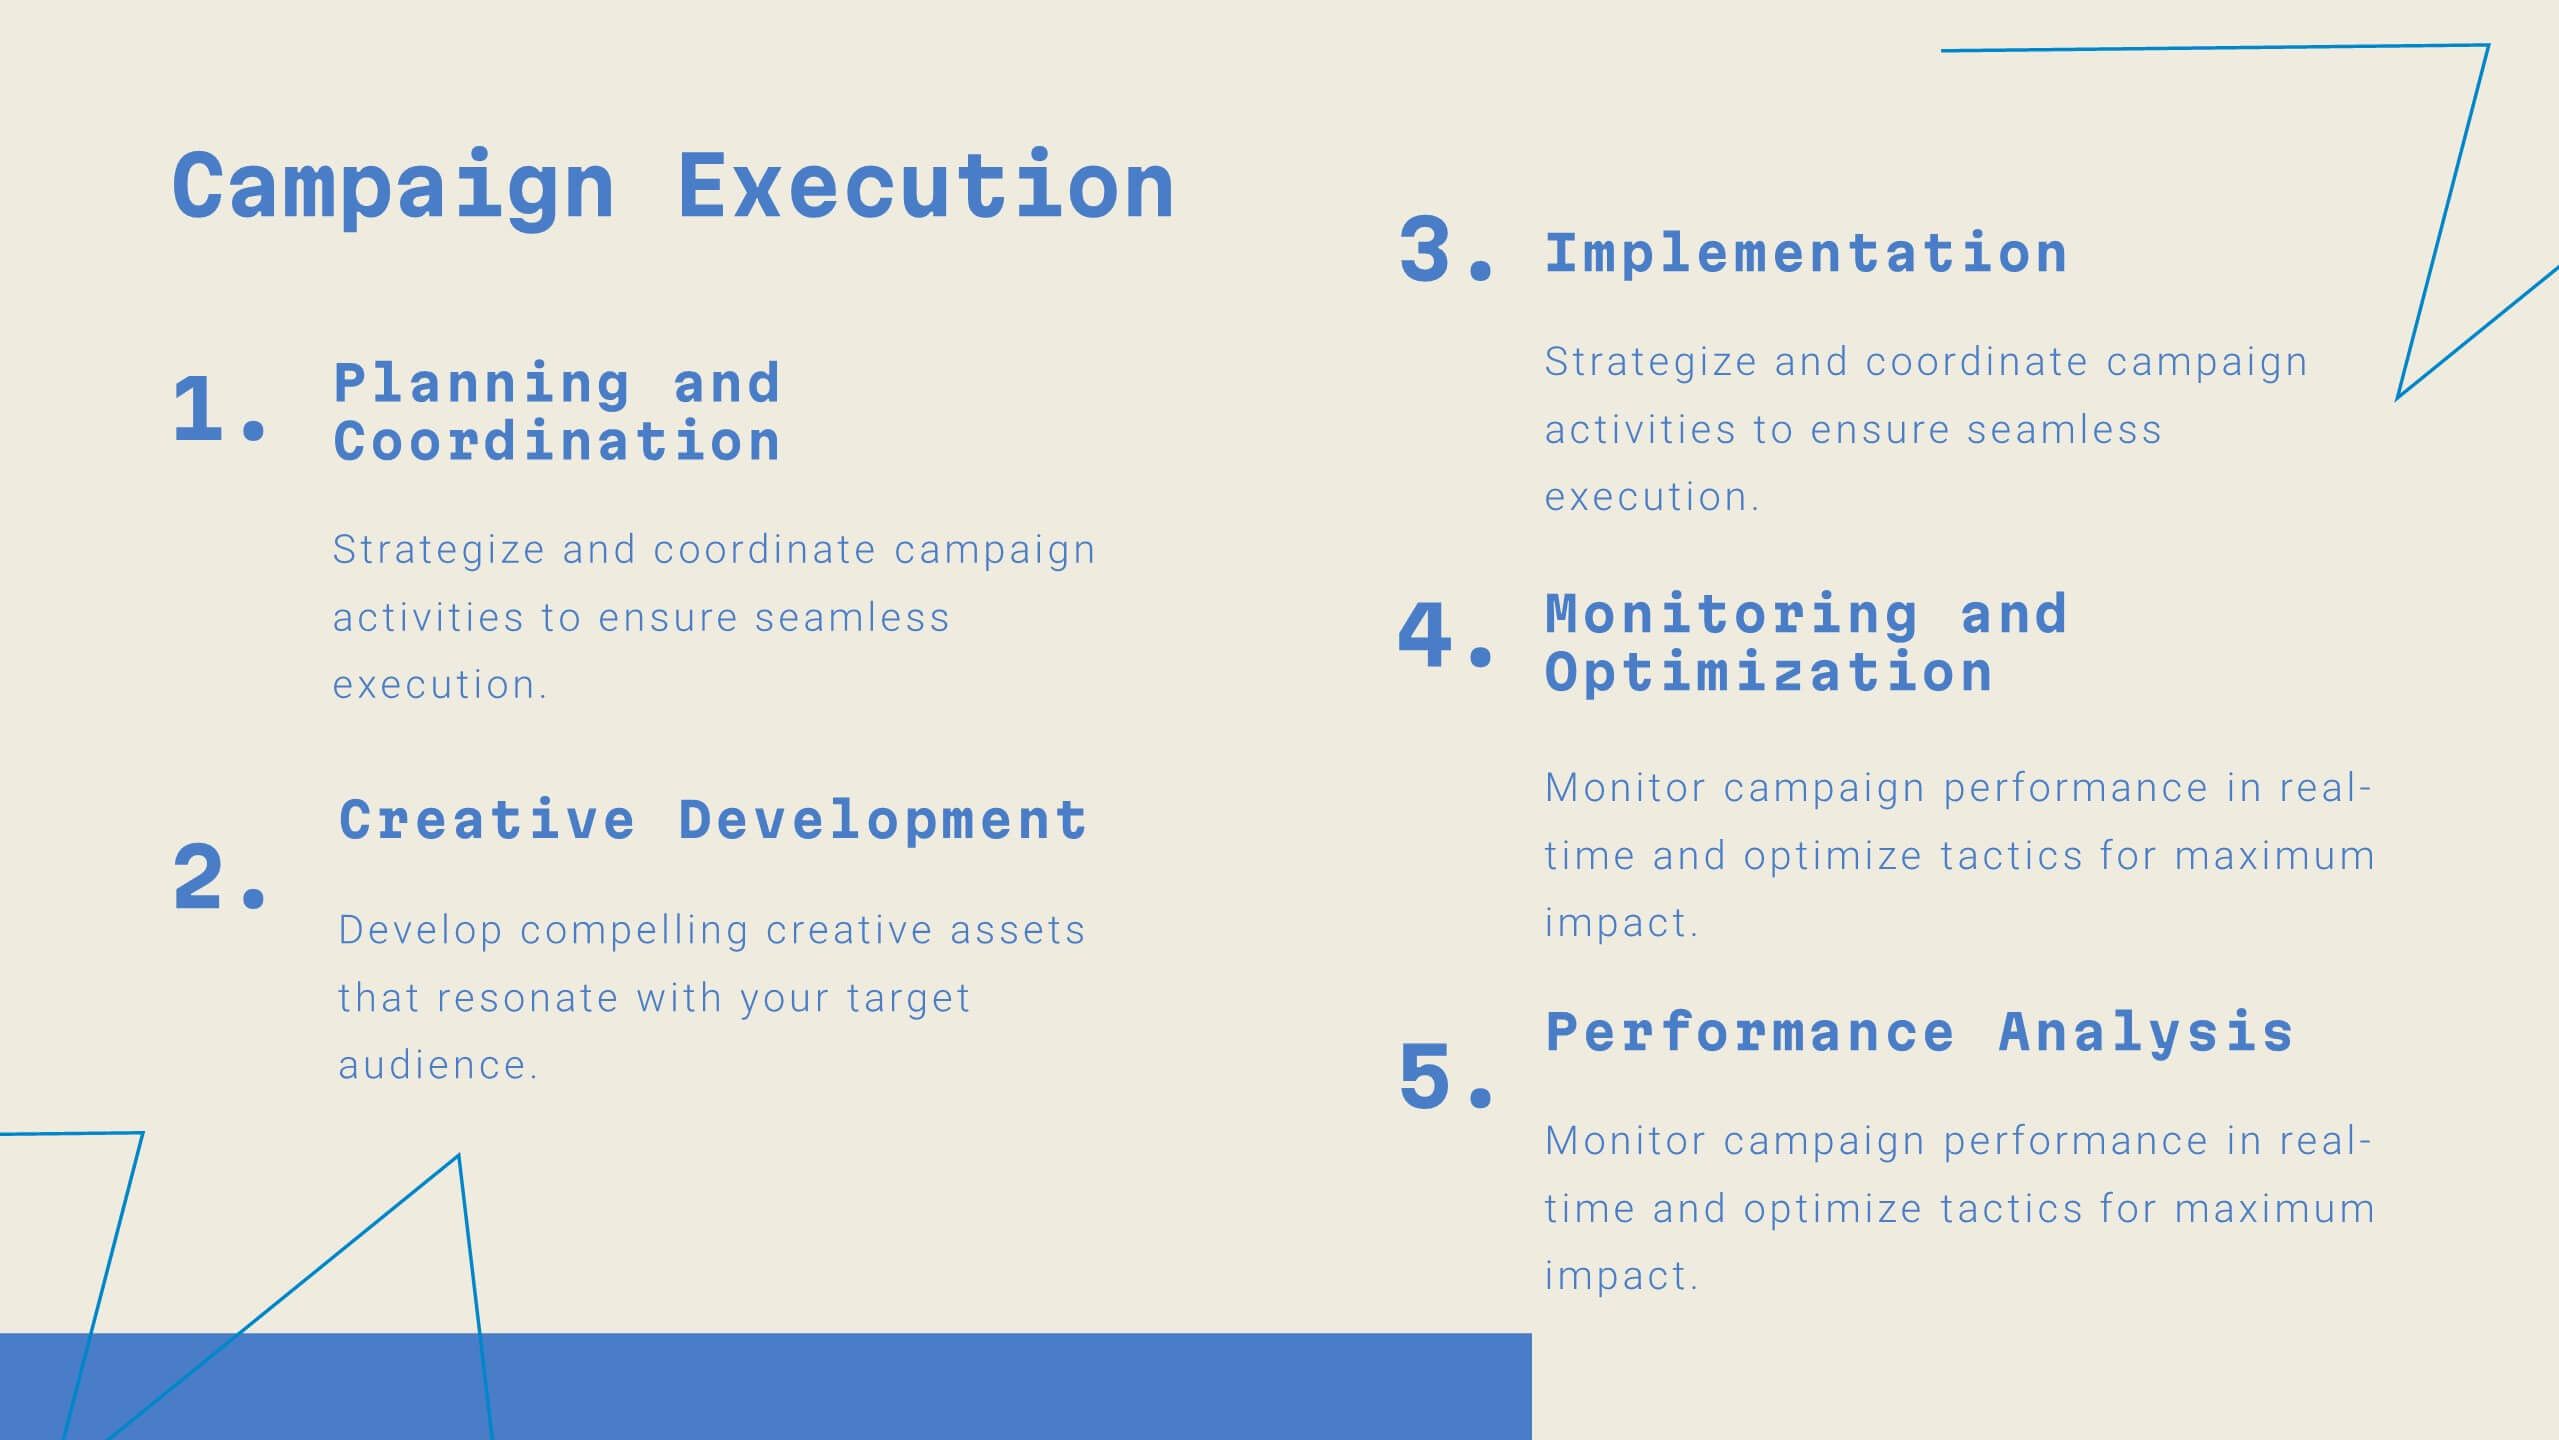
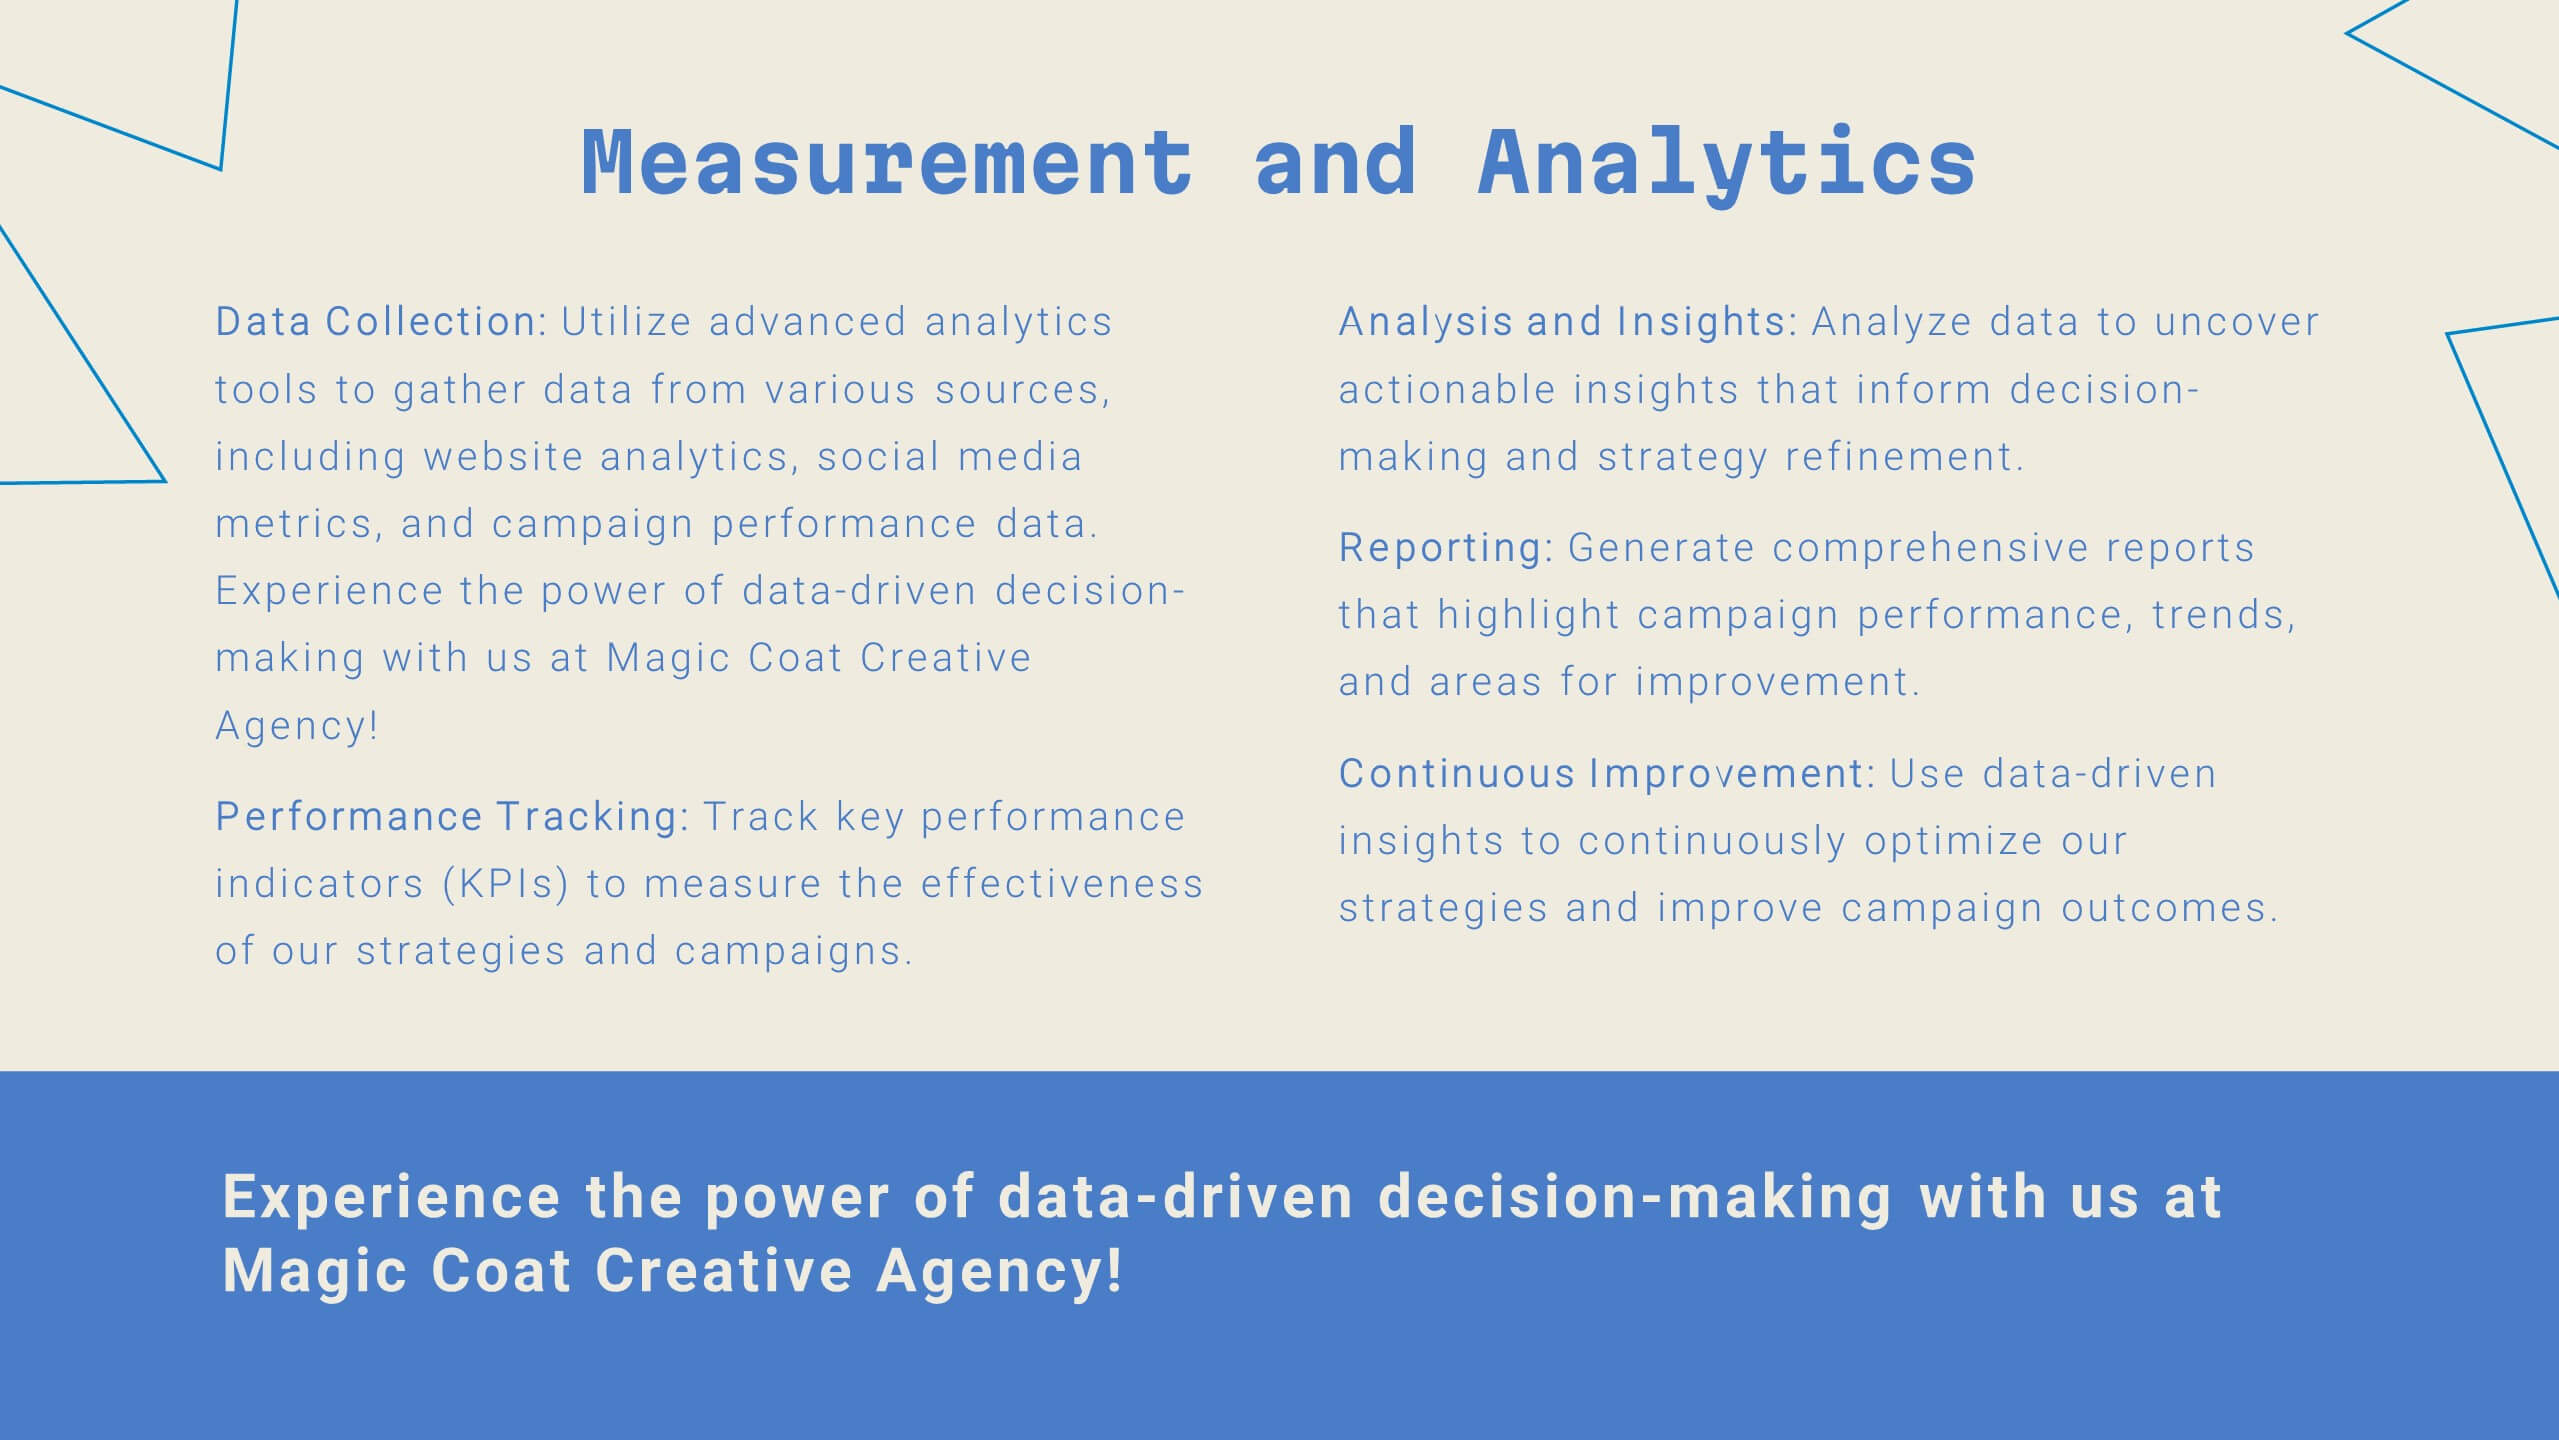
Unity Digital Agency Strategy Plan Presentation
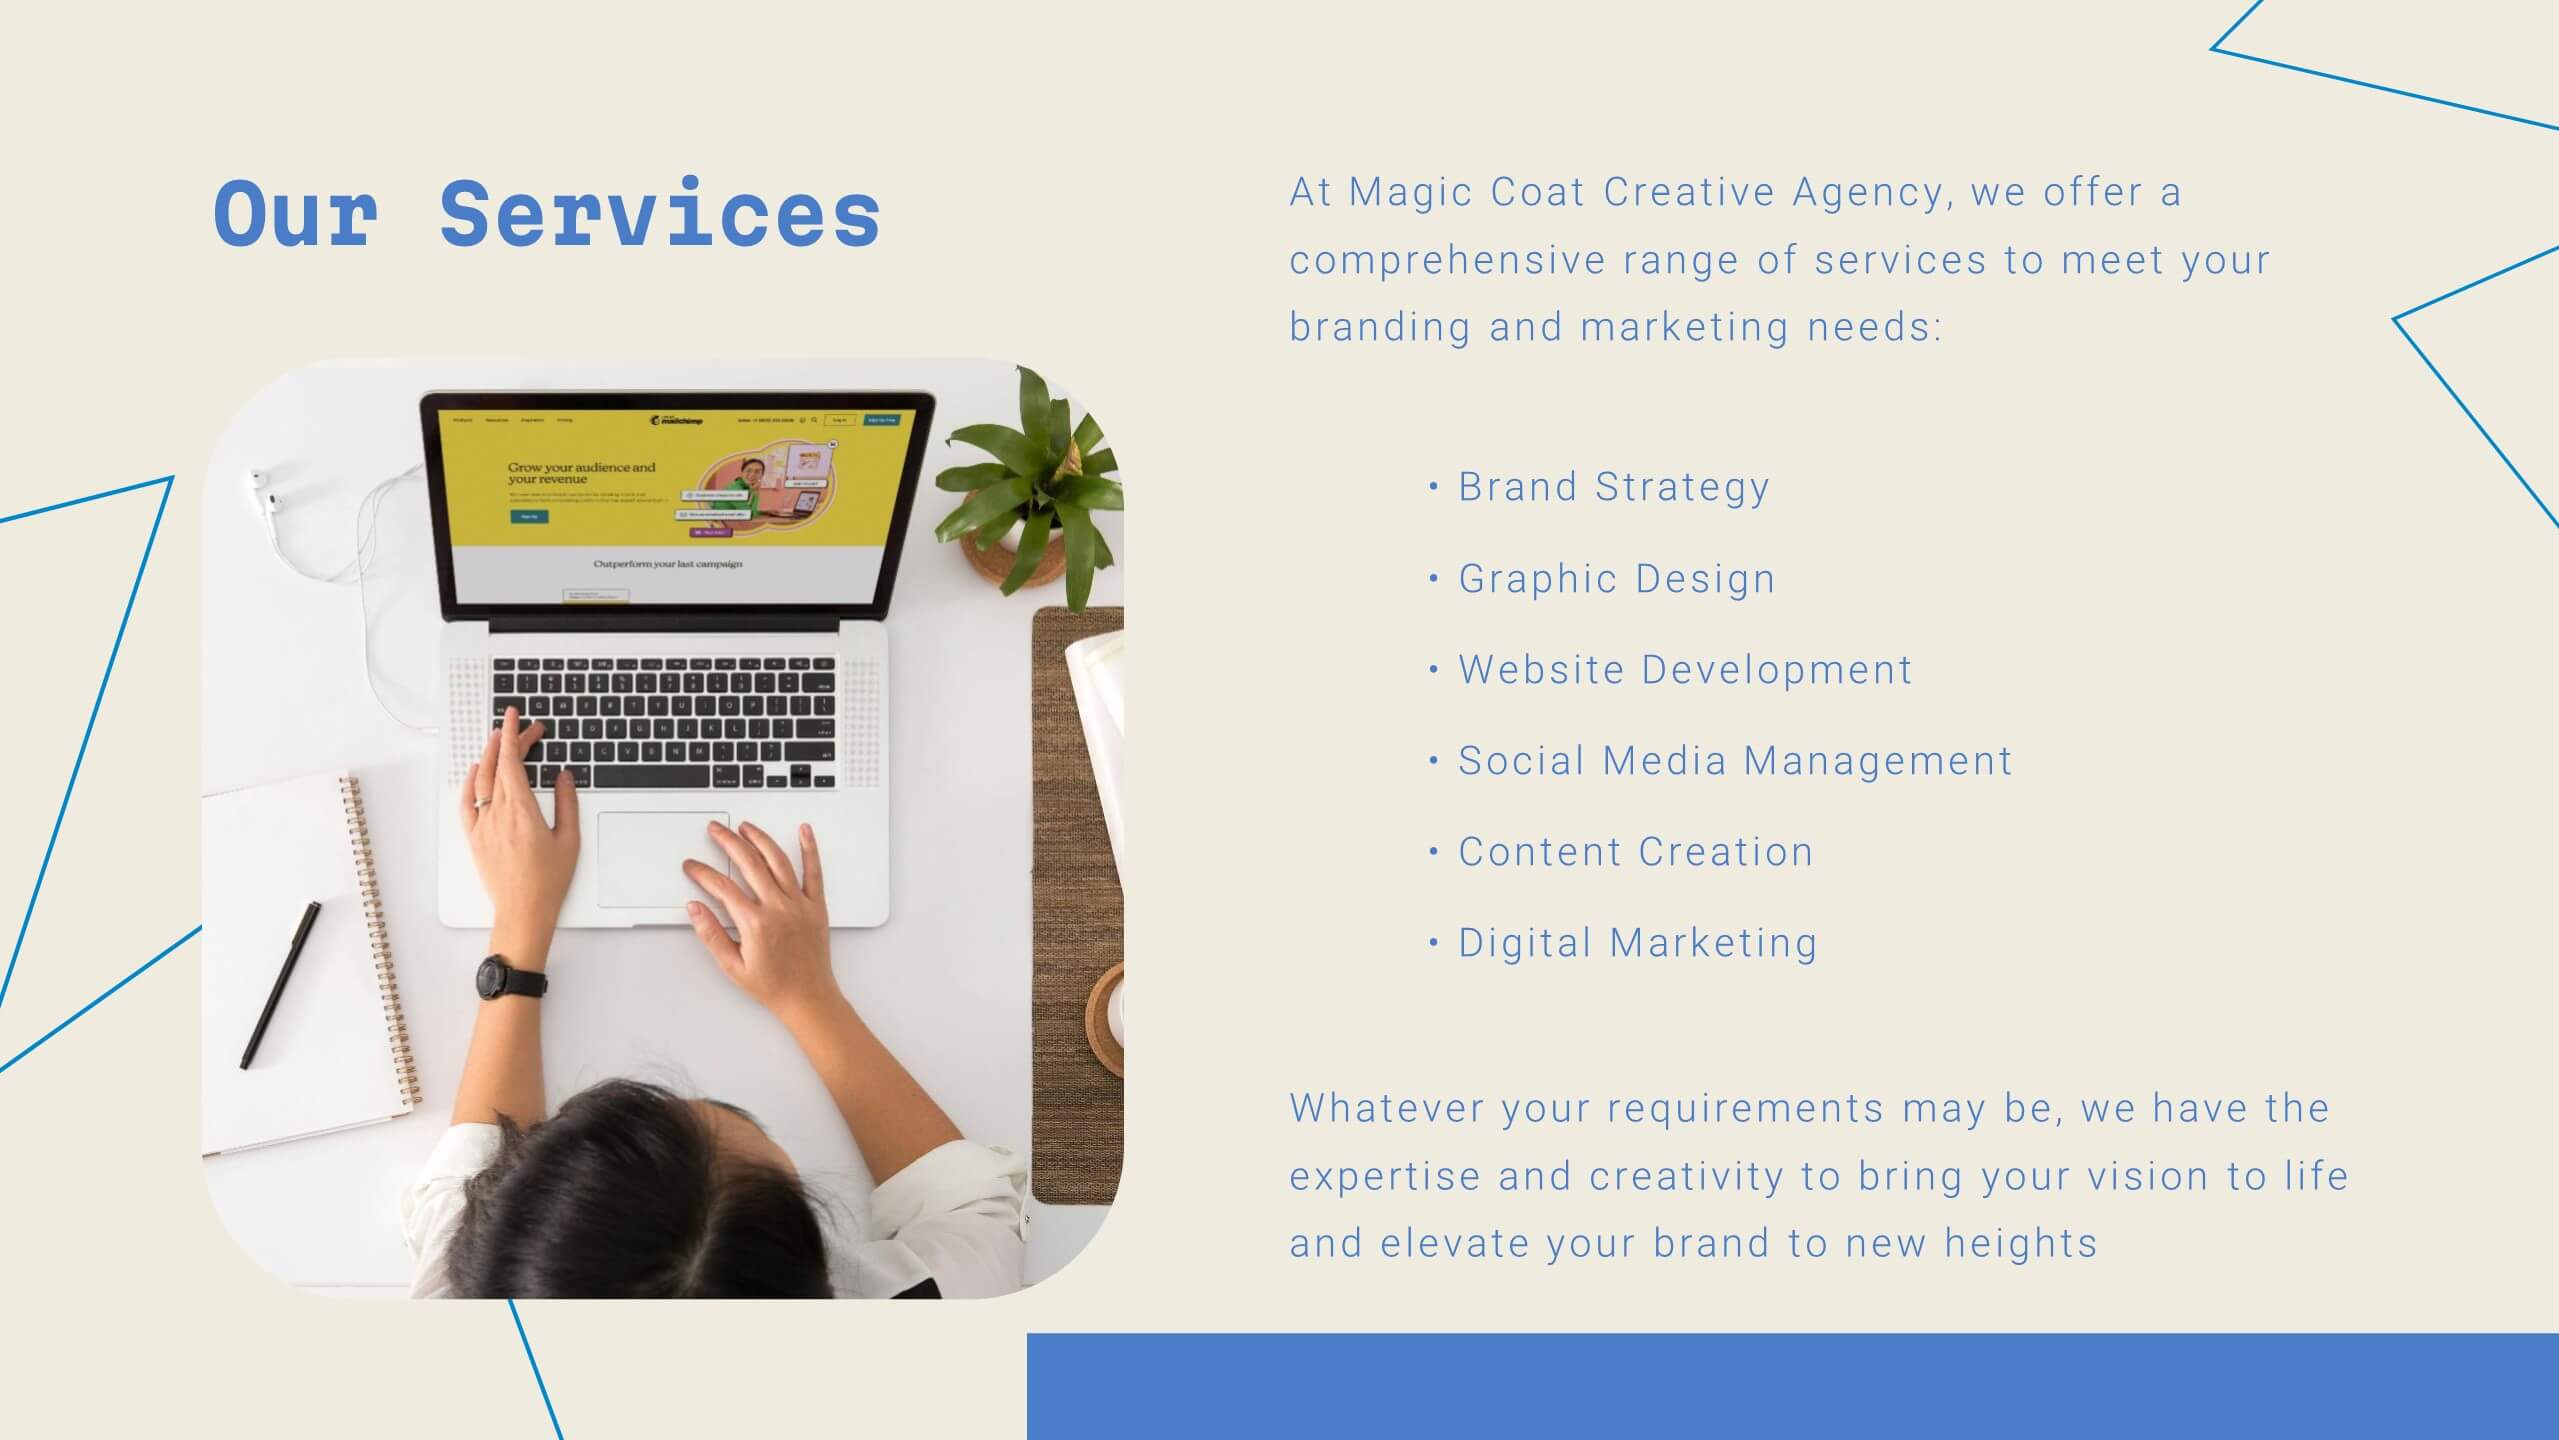
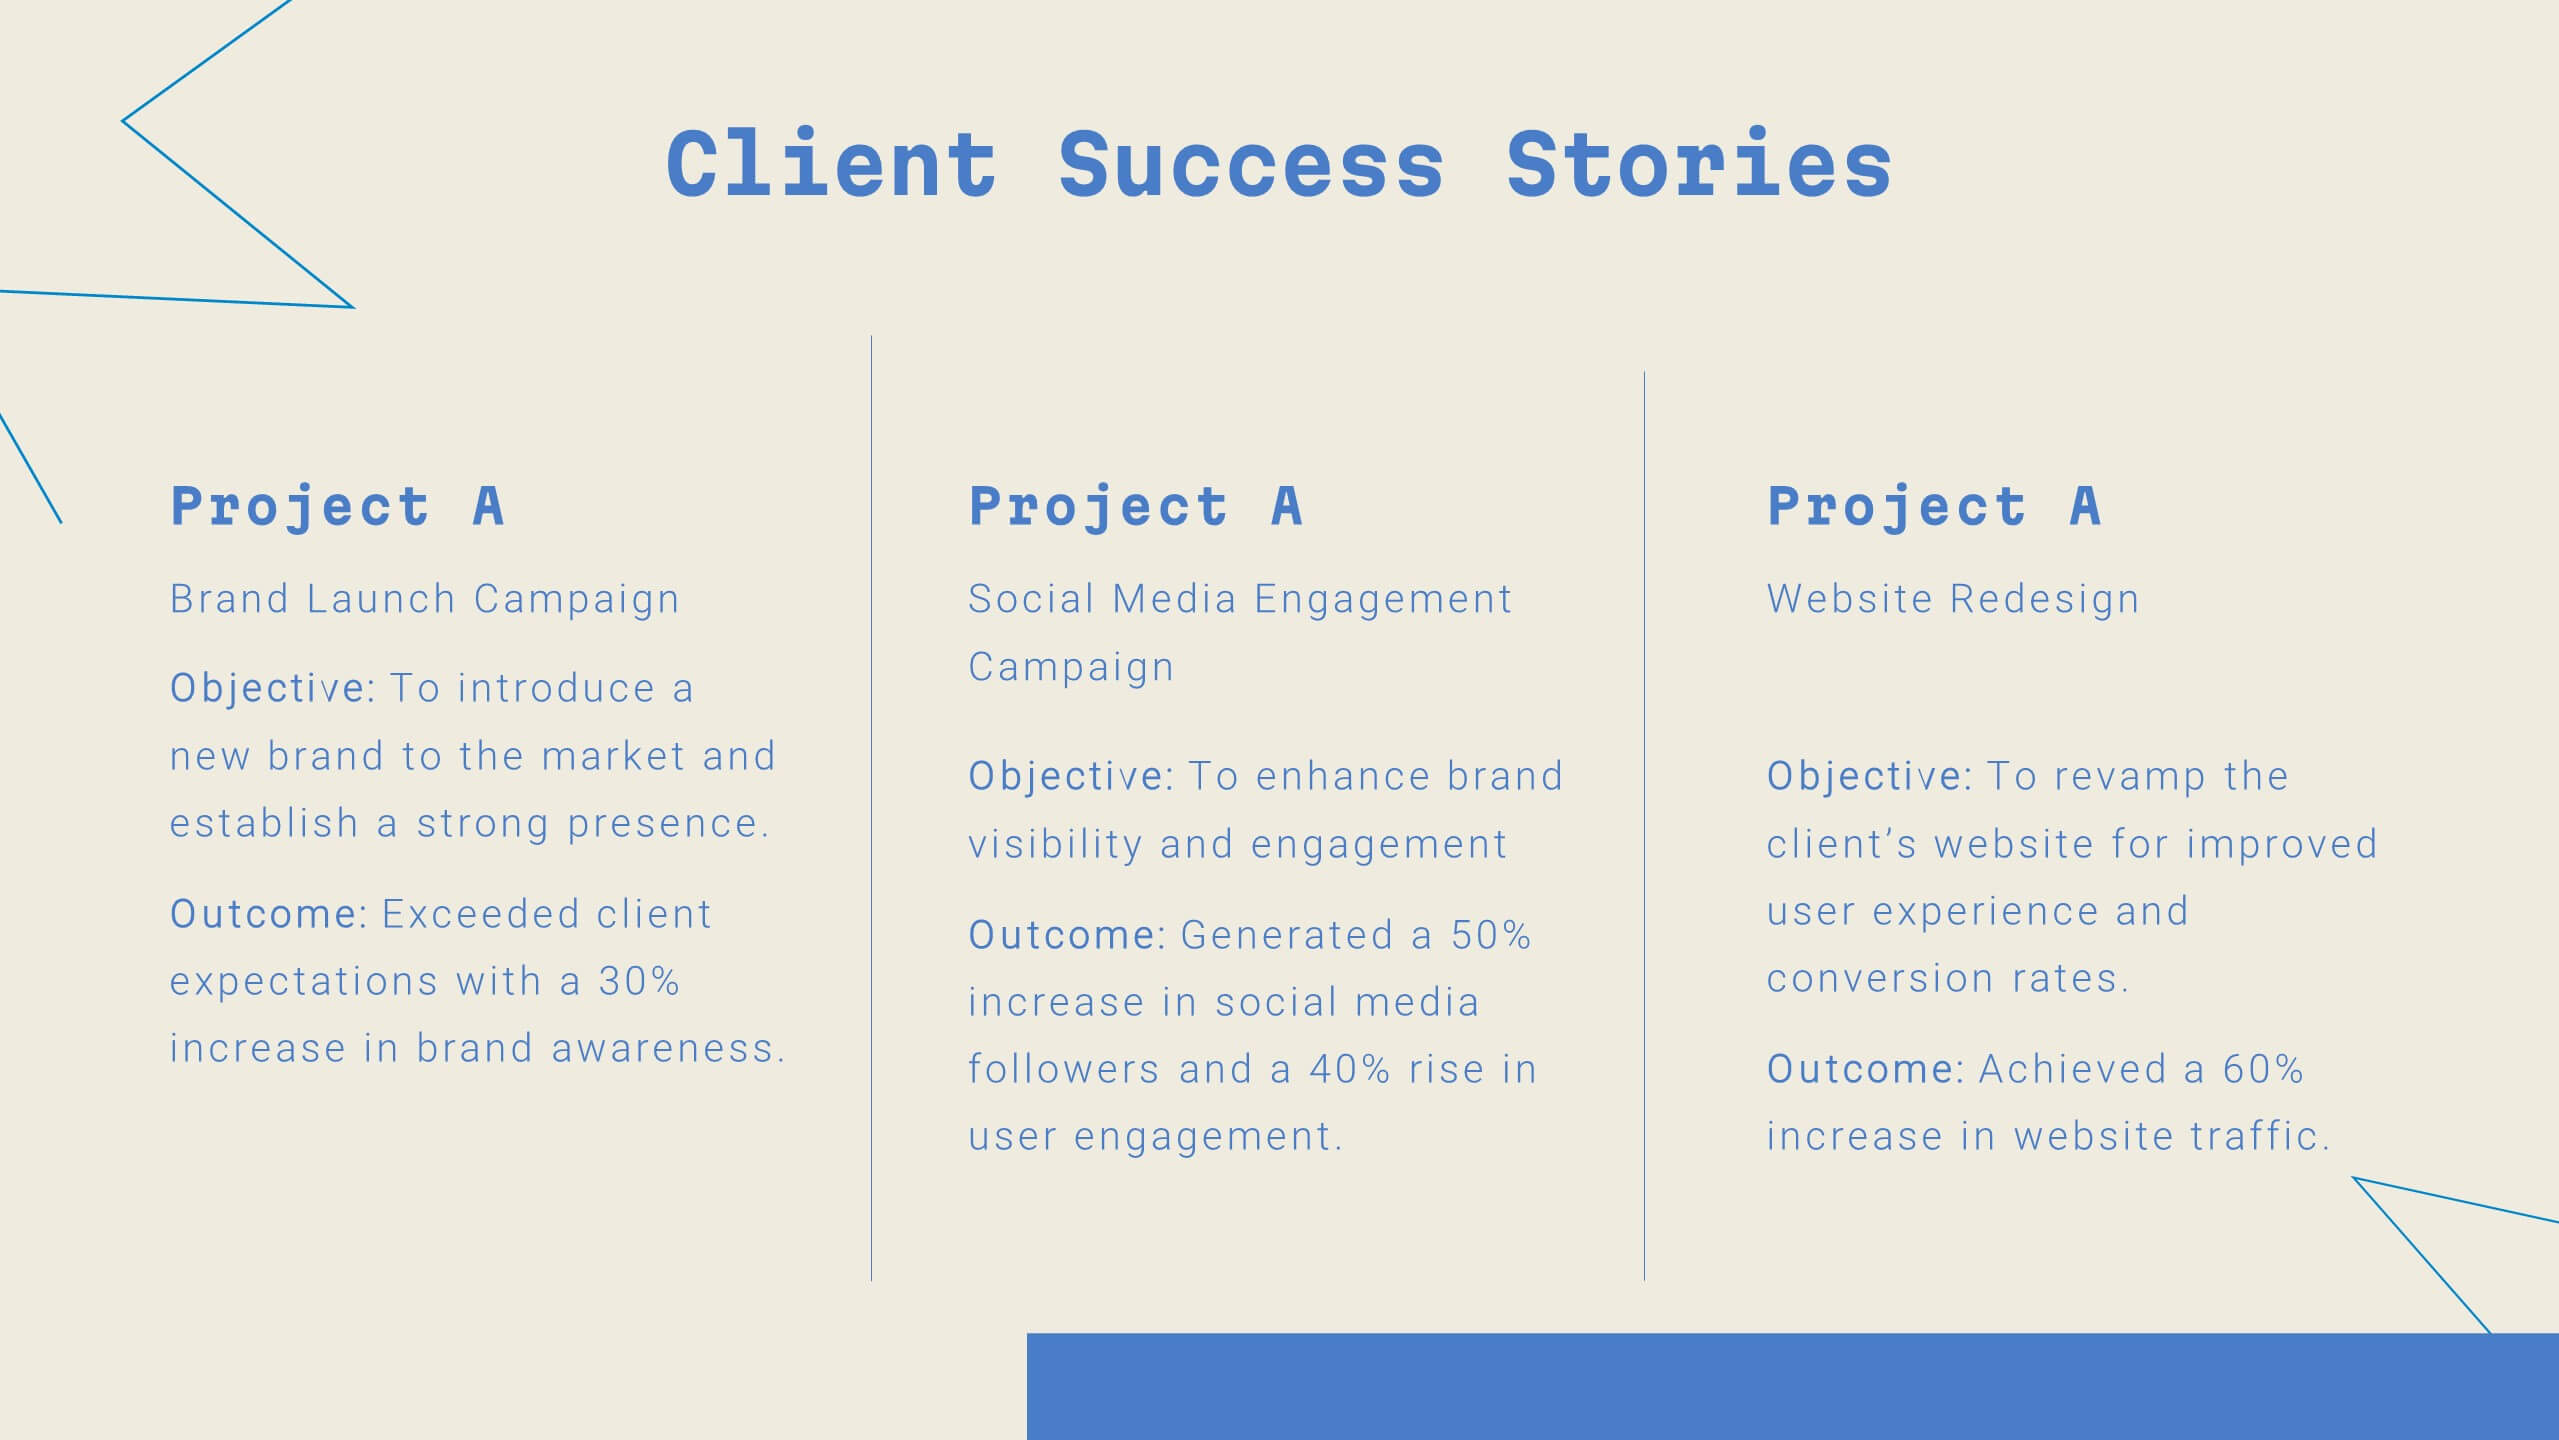
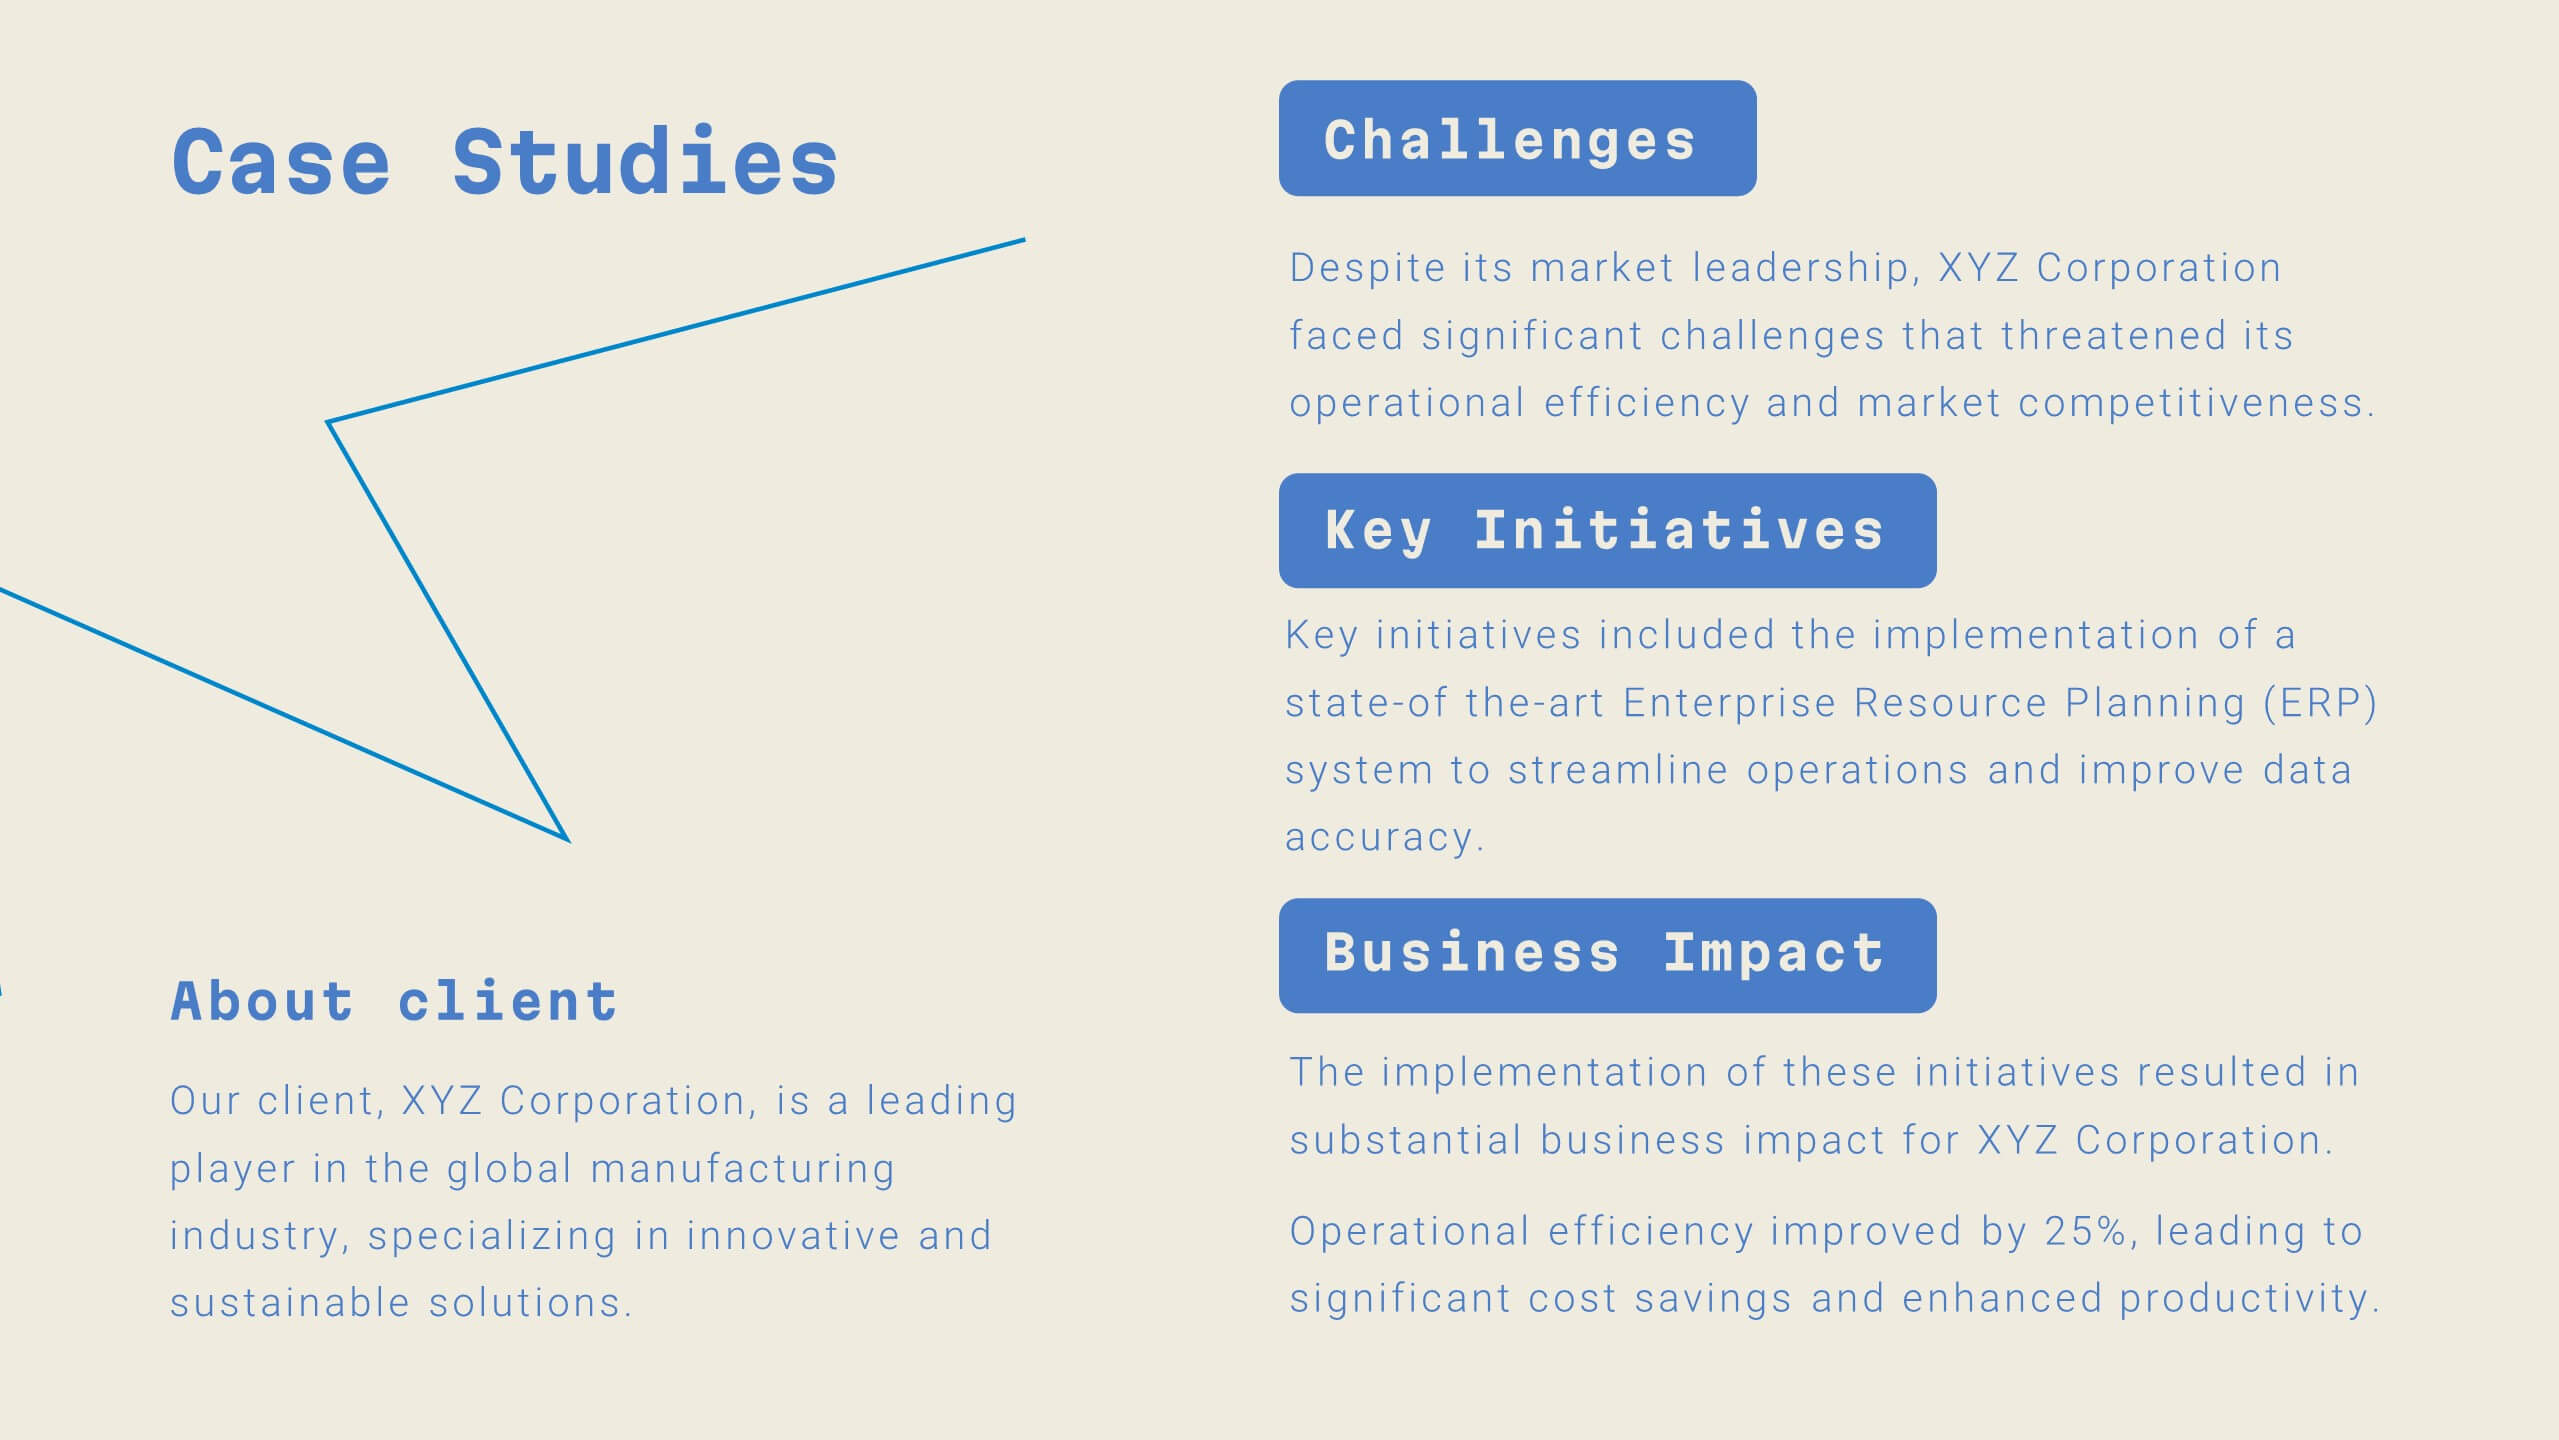
Step into the future of digital marketing with this sleek template! From case studies to strategy development, it offers a comprehensive guide for creating impactful presentations. Highlight client success stories, industry trends, and creative processes with ease. Perfect for showcasing your agency's expertise. Compatible with PowerPoint, Keynote, and Google Slides.


5 slides
Value Chain Business Model Presentation
Spark fresh insight into how your organization creates value with this clean, arrow-based layout that makes every step feel intuitive and action-ready. This presentation breaks down key activities, support processes, and improvement opportunities in a clear visual flow perfect for strategy discussions. Fully compatible with PowerPoint, Keynote, and Google Slides.


4 slides
Meetings Agenda Slide Presentation
Make every meeting feel purposeful with a clean layout that highlights topics, timing, and key discussion points effortlessly. This presentation helps teams stay aligned, organized, and ready to follow the flow of the session. Perfect for planning or reporting. Fully compatible with PowerPoint, Keynote, and Google Slides.


22 slides
Lucidia Market Research Presentation
Deliver insightful market research findings with this modern and structured template. It covers key areas such as data analysis, consumer insights, research methodologies, and future directions. Ideal for presenting to stakeholders or clients. Fully customizable for PowerPoint, Keynote, and Google Slides.


8 slides
Air Travel Trends and Safety Presentation
Explore global air travel dynamics with the 'Air Travel Trends and Safety' presentation template. Designed to deliver critical insights into aviation safety standards and travel patterns, this template facilitates impactful presentations for industry stakeholders. Tailored for use in platforms like PowerPoint, Keynote, and Google Slides, it serves as an essential tool for discussing regulatory impacts, operational safety, and market trends, ensuring your data is not only presented but persuasively communicated.


5 slides
Global Market Trends World Map Presentation
Visualize your market insights with this sleek and professional Global Market Trends World Map slide. Designed to highlight key regional data with pinpoint accuracy, it’s ideal for presenting statistics, regional performance, or global expansion strategies. The sidebar gradient layout offers space for five categories, each linked to map locations. Fully customizable and compatible with PowerPoint, Keynote, and Google Slides.


4 slides
Top Priorities and Checklist Format Presentation
Stay focused and aligned with the Top Priorities and Checklist Format Presentation. This clear, checklist-based design is ideal for highlighting action items, goals, or key project deliverables. Visually guide your team with structured sections and a checklist illustration that reinforces accountability. Fully editable in PowerPoint, Keynote, and Google Slides.


6 slides
Big Data Solutions Infographics
Discover the power of Big Data Solutions with our customizable infographic template. This template is fully compatible with popular presentation software like PowerPoint, Keynote, and Google Slides, allowing you to easily customize it to illustrate and communicate various aspects of big data solutions. The Big Data Solutions infographic template offers a visually engaging platform to explain the principles, technologies, and benefits of harnessing big data for insights and decision-making. Whether you're a data professional, business leader, or simply interested in the world of big data, this template provides a user-friendly canvas to create informative presentations and educational materials. Deepen your understanding of Big Data Solutions with this SEO-optimized infographic template, thoughtfully designed for clarity and ease of use. Customize it to showcase data sources, analytics tools, data storage options, and the real-world applications of big data in various industries, ensuring that your audience gains valuable insights into this transformative field. Start crafting your personalized infographic today to explore the world of Big Data Solutions.


5 slides
Food Waste in School Infographics
Food Waste in schools is a significant issue that can have economic, environmental, and social impacts. These vertical infographics aim to raise awareness about the magnitude of the problem and provide actionable steps to reduce food waste in schools. These can be used as valuable tools to highlight the issue of food waste in school environments. The visually appealing illustrations, informative content, and color schemes make it effective for raising awareness and promoting sustainable practices in school environments. Compatible with Powerpoint, Keynote, and Google Slides.


2 slides
Creative Business Presentation
Showcase your ideas with energy and style using this bold, contemporary presentation layout. Featuring dynamic visuals and clean typography, this template is ideal for business proposals, portfolios, and startup pitches. Easily customizable in PowerPoint, Keynote, and Google Slides to suit your brand's identity.


7 slides
Finance in Business Infographic Presentation
Finance is an essential component of any economy, and it plays a crucial role in enabling businesses, individuals, and governments to manage their resources effectively. Use this template to help others understand the basics of finance in a simple manner. Finance is very broad, this template contains everything you need to keep track of your spending and earning. This has been designed to help you deliver informative Infographics that convey the main points of your topic. It is compatible with PowerPoint, Keynote and Google Slides, so you can easily change the text, add images, and change colors.


4 slides
Blockchain and Cryptocurrency Market Analysis Presentation
Present complex blockchain structures and crypto market layers with clarity using the Blockchain and Cryptocurrency Market Analysis presentation template. Featuring a stacked cylinder diagram with four interactive data points, this layout is ideal for breaking down transaction flows, network layers, or decentralized finance (DeFi) ecosystems. Each title block offers space for concise key insights. Best suited for blockchain consultants, fintech startups, and crypto analysts. Fully compatible with PowerPoint, Keynote, and Google Slides.


4 slides
Company Vision and Long-Term Goals Presentation
Present your company’s future with clarity and impact using this Company Vision and Long-Term Goals slide. Featuring a bar chart-style graphic with ascending growth stages, this template allows you to showcase strategic milestones, business values, or development phases. Each bar is paired with icons and editable text to highlight specific goals, making it ideal for leadership meetings, strategic planning, or investor pitches. Clean, modern, and customizable in PowerPoint, Keynote, and Google Slides.


21 slides
Nucleus Project Timeline Presentation
Plan with precision using this clean and modern Project Timeline Presentation Template. Highlight key phases, milestones, and deliverables with visually organized sections such as Project Overview, Objectives, Budget Breakdown, Resource Allocation, and Risk Management. Perfect for presenting timelines, evaluation criteria, and next steps to stakeholders. Fully customizable and compatible with PowerPoint, Keynote, and Google Slides.