


Features
- 6 Unique slides
- Fully editable and easy to edit in Microsoft Powerpoint, Keynote and Google Slides
- 16:9 widescreen layout
- Clean and professional designs
- Export to JPG, PDF or send by email


Do you have any questions?
Recommend


7 slides
RACI Matrix Project Infographic
A RACI Matrix, sometimes referred to as a Responsibility Assignment Matrix, is a project management tool used to clarify and communicate the roles and responsibilities of team members in completing tasks and activities within a project. This is a visually captivating and informative template designed to demystify the complexities of project accountability. Navigate through the world of roles and responsibilities in a project setting with this dynamic and easily digestible visual aid. With this infographic your audience will journey toward effective project management and accountability with the RACI Matrix.


5 slides
Cross-Functional Team Collaboration Presentation
Visualize multi-department synergy with the Cross-Functional Team Collaboration Presentation. Ideal for mapping collaborative structures, workflows, or project roles across divisions. This layout emphasizes alignment and cooperation between teams. Easily customizable in PowerPoint, Keynote, and Google Slides—perfect for strategy sessions, management briefings, or team onboarding presentations.


5 slides
Business Model Canvas Overview Presentation
Streamline your business strategy with the Business Model Canvas Overview Presentation. Designed for entrepreneurs, startups, and strategists, this template visualizes key partners, activities, value propositions, customer segments, revenue streams, and more. Fully editable for PowerPoint, Keynote, and Google Slides, ensuring a structured and professional business plan presentation.


3 slides
Ishikawa Diagram Template Presentation
Bring clarity to complex challenges with a clean, structured visual that helps teams trace issues back to their true causes. This presentation outlines key factors, organizes insights, and supports decision-making with an intuitive, step-by-step layout. Ideal for problem-solving sessions and strategy workshops. Fully compatible with PowerPoint, Keynote, and Google Slides.


7 slides
Female Anatomy Infographic
Anatomy is the branch of biology that focuses on the structure and organization of living things. Step into a world of discovery with our infographic template, this is an enlightening visual guide that celebrates the intricate beauty and functionality of the female body. This infographic is designed to educate and empower, offering a clear and artistic representation of the anatomy that defines women. This template will take your audience through an educational journey through the various systems that make up a woman's body. This is fully customizable and compatible with Powerpoint, Keynote, and Google Slides.


5 slides
Porter's Five Forces Market Analysis
Visualize competitive dynamics with this clear, easy-to-follow Porter’s Five Forces slide. Each force—Buyer Power, Supplier Power, Competitive Rivalry, Threat of Substitution, and Threat of New Entry—is color-coded and icon-labeled for quick reference. Perfect for strategy meetings, SWOT comparisons, or investment pitches. Editable in PowerPoint, Keynote, and Google Slides.


8 slides
Four-Step Business Strategy Presentation
Break down your plan into clear, actionable steps with the Four-Step Business Strategy Presentation. This structured template highlights key phases, ensuring an easy-to-follow visual representation of your strategy. Perfect for business planning, marketing, and project management. Fully customizable and compatible with PowerPoint, Keynote, and Google Slides.


7 slides
Pyramid Infographic Presentation Template
A Pyramid Infographic is a type of representation that uses a pyramid shape to organize and present information in a hierarchical manner. The top of the pyramid represents the most important or main idea and the levels below it represent sub-ideas or details that support the main idea. With this template you can show the relationship between different levels of information or to illustrate the main points of a topic in a simple and easy way, perfect for business, education, and marketing. This template will help you organize your information and make it more understandable.


22 slides
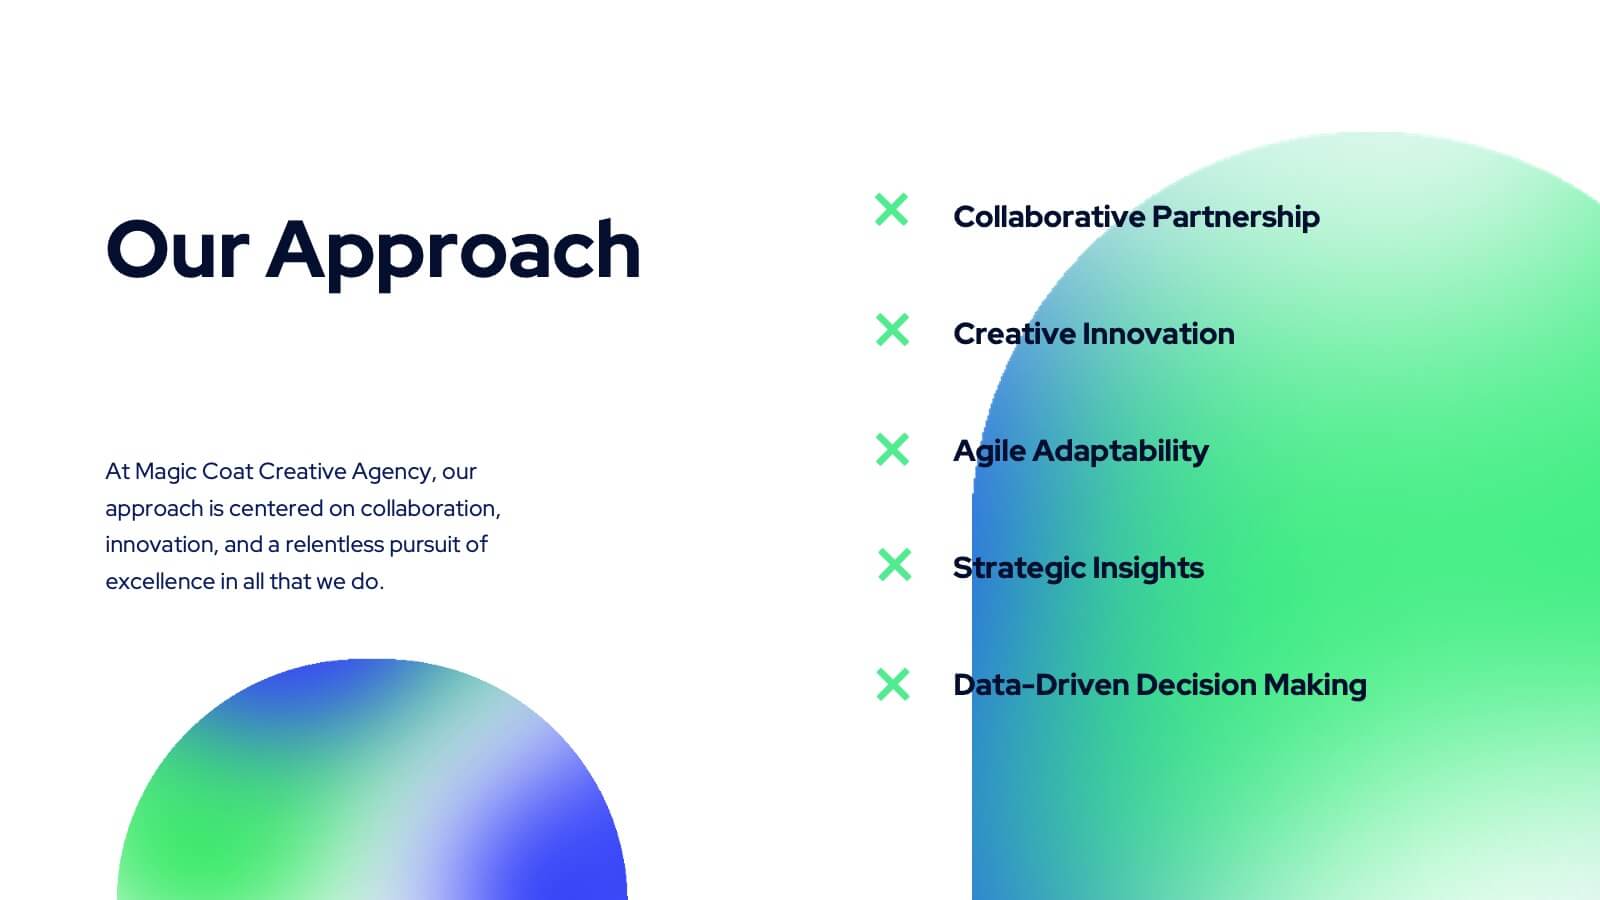
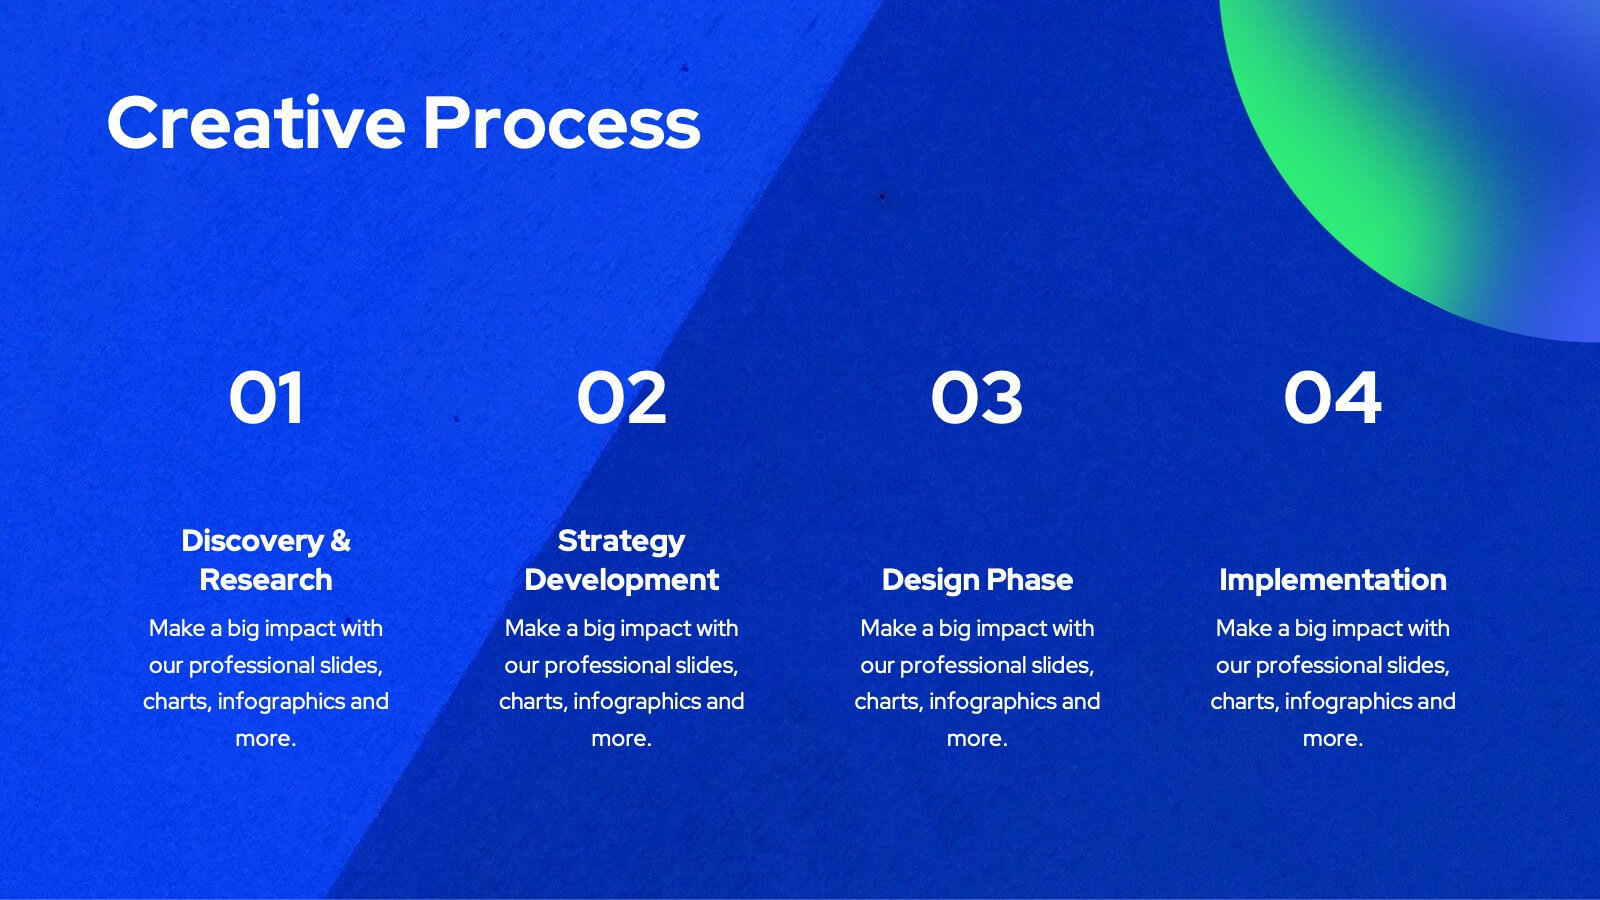
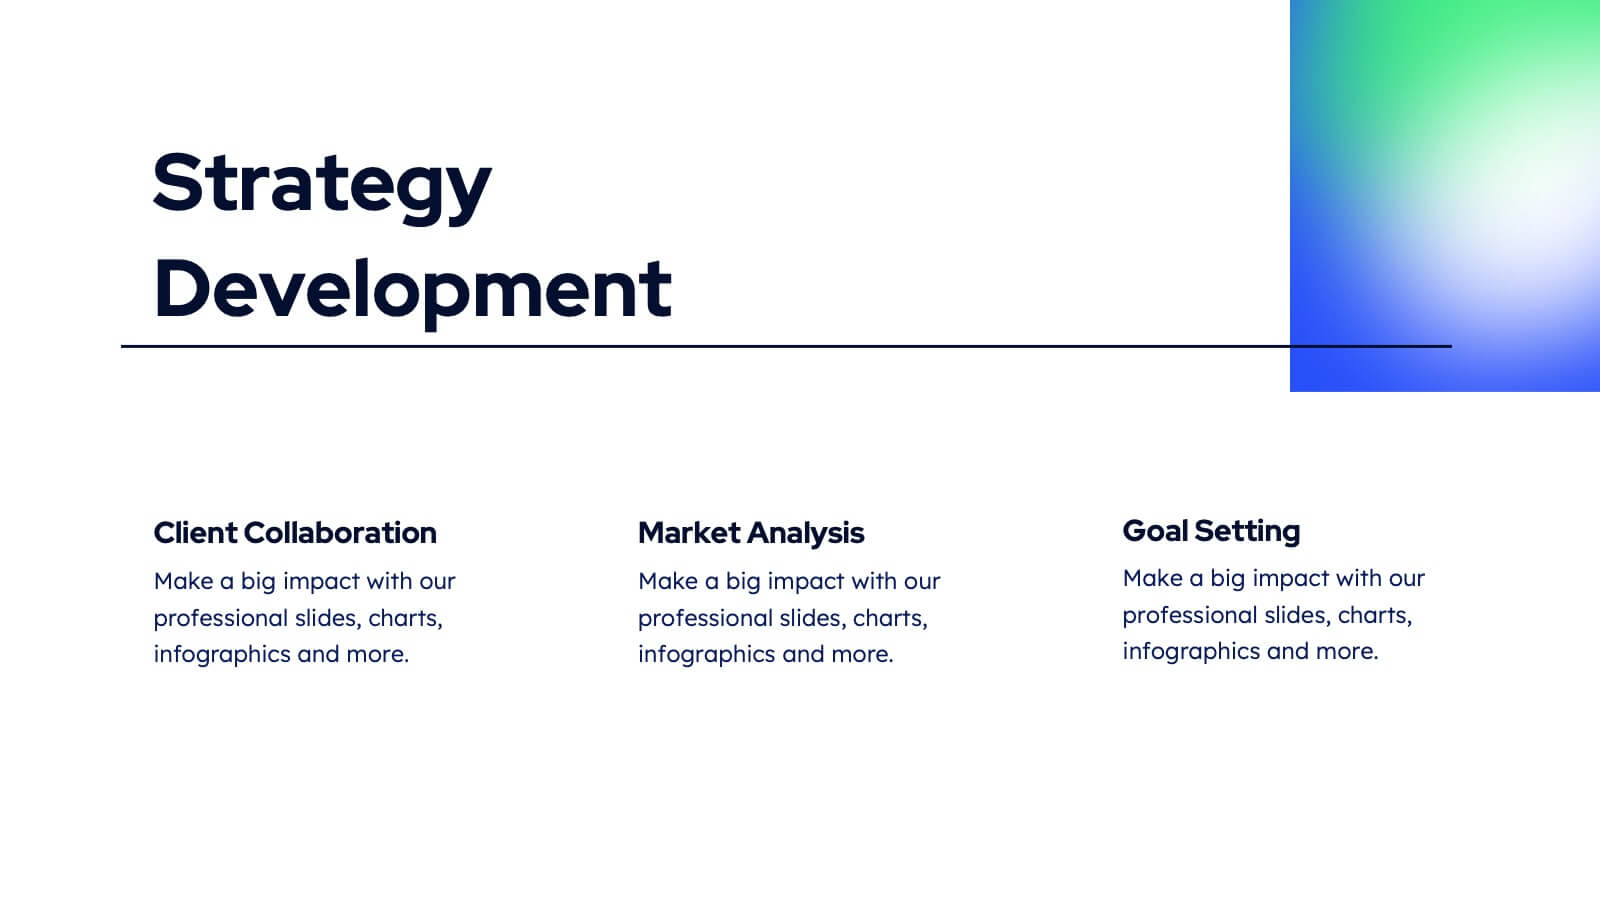
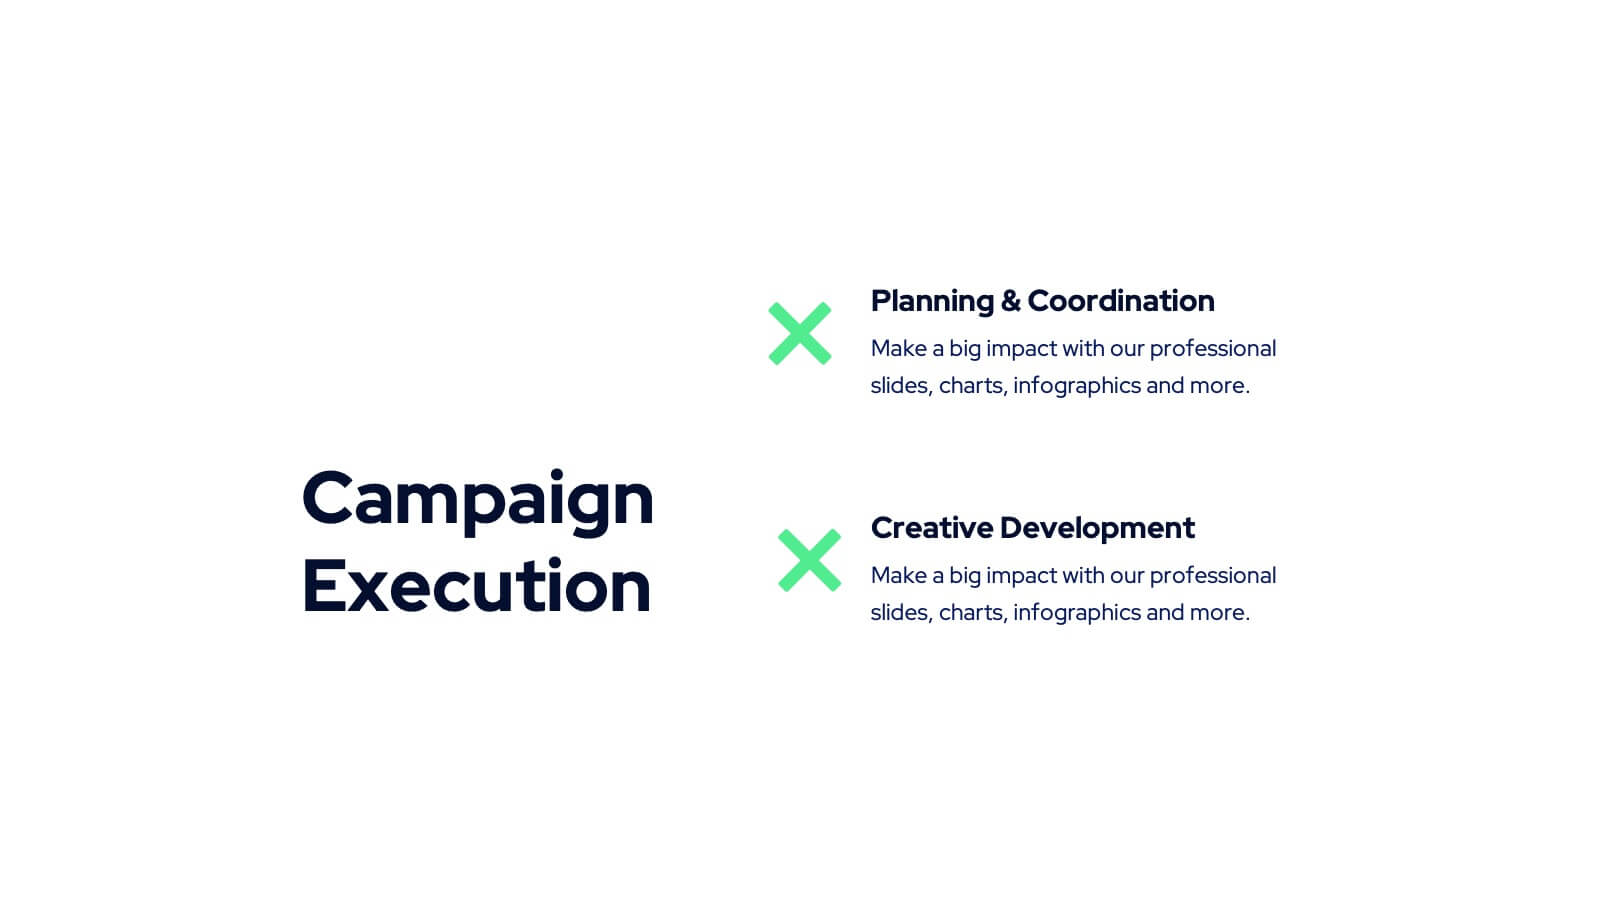
Tanzanite Full-Service Agency Project Plan Presentation
Showcase your agency's strengths with this bold and modern portfolio presentation template! From client success stories and case studies to market analysis and strategy development, this template highlights your expertise and approach. Perfect for agencies looking to present their services, creative processes, and partnerships. Compatible with PowerPoint, Keynote, and Google Slides, making it easy to impress any audience.


5 slides
RAPID Decision-Making Model Presentation
The RAPID Decision-Making Model template simplifies complex decision processes, laying out steps from recommending to deciding in an easily digestible format. It's ideal for team leaders and managers who want to streamline decision-making. The template is designed for seamless use across PowerPoint, Keynote, and Google Slides, ensuring broad compatibility and user-friendly presentations.


26 slides
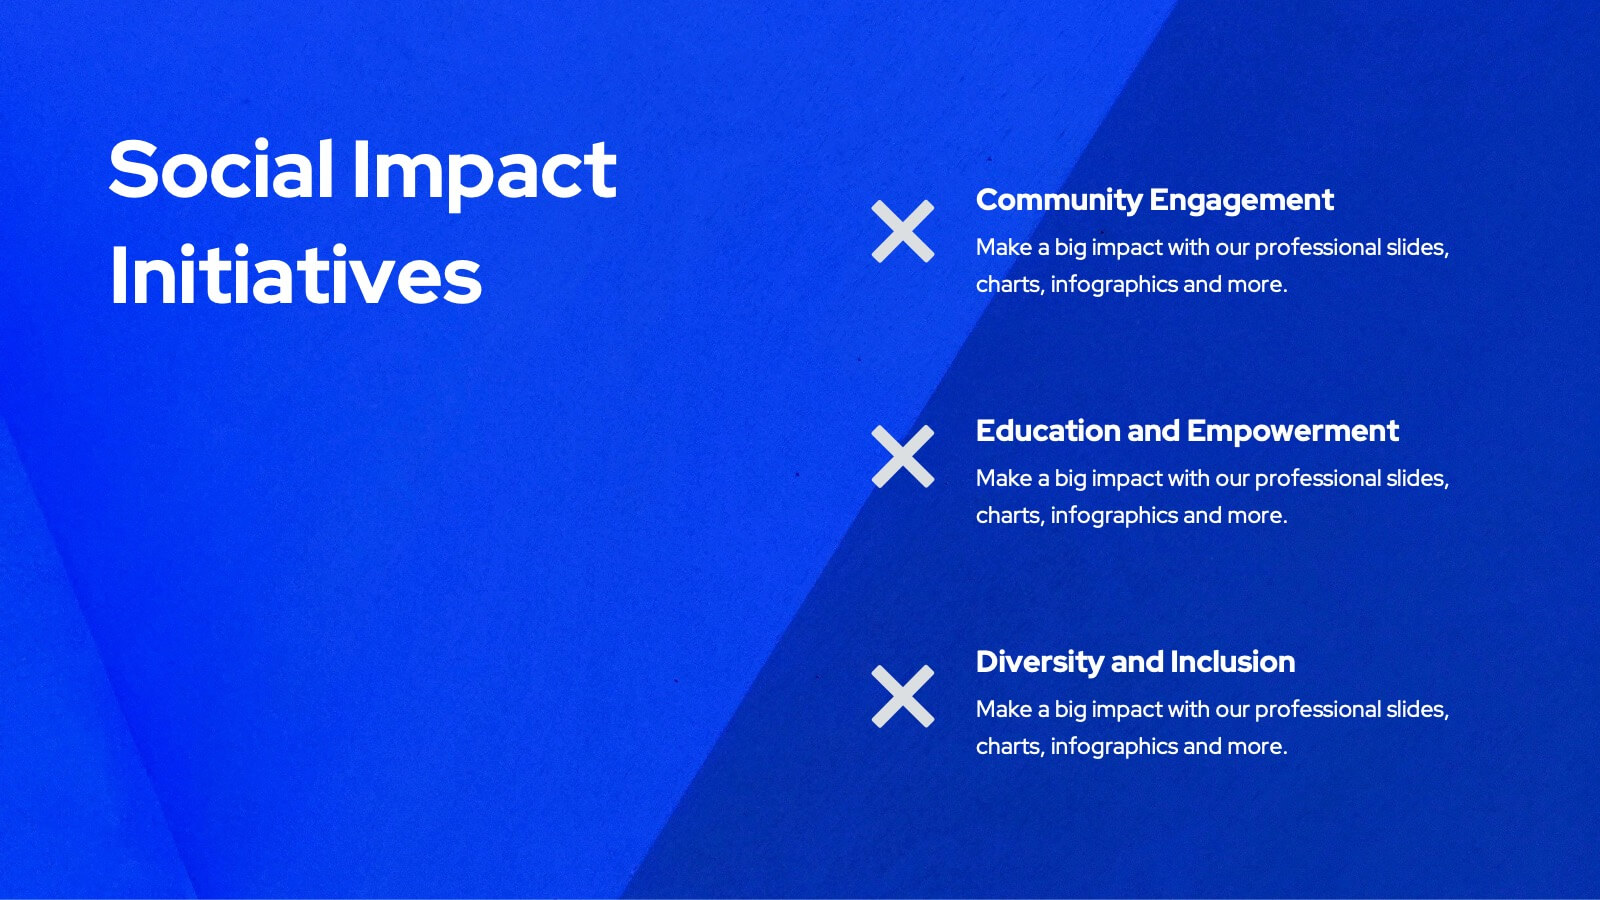
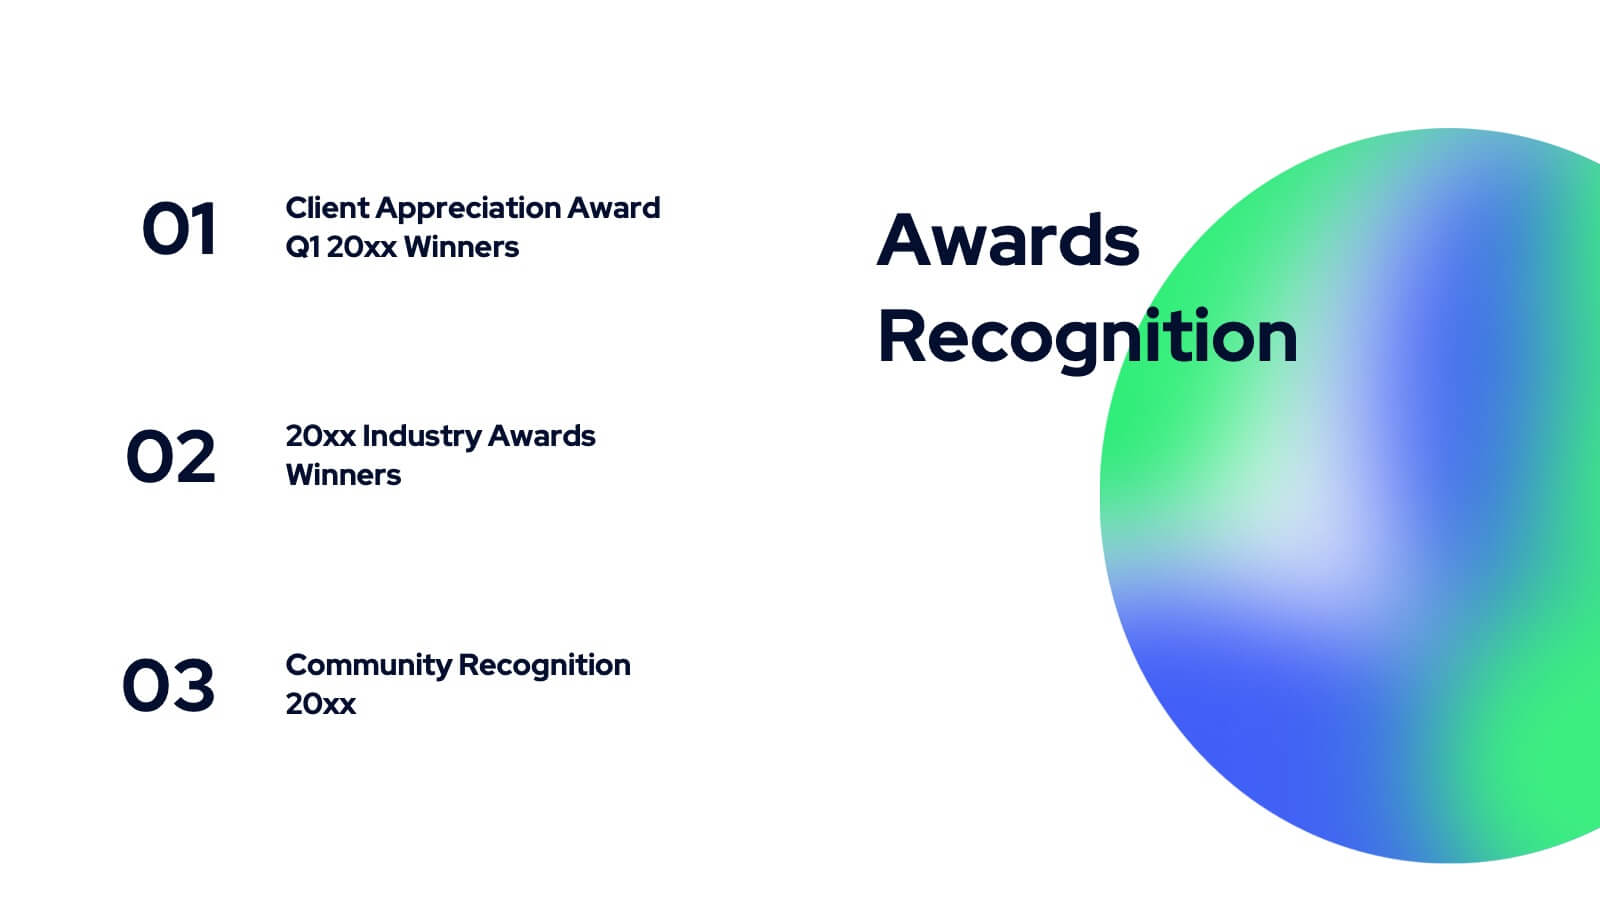
AIl for Social Good Presentation
Harness the power of technology for positive change with this inspiring presentation on AI for social good. Covering topics like ethical AI, humanitarian applications, sustainability, and global impact, this template helps showcase how artificial intelligence can drive meaningful progress. Fully customizable and compatible with PowerPoint, Keynote, and Google Slides for a seamless experience.


5 slides
Big Data Analytics Slide Presentation
Bring your insights to life with a clean, modern slide that transforms complex information into a simple visual journey. This layout helps you explain key data points, trends, and analytical steps with clarity and ease, making your message instantly understandable. Compatible with PowerPoint, Keynote, and Google Slides.


7 slides
Empathy Map Tools Infographic
Navigate the intricate landscapes of human emotions with our empathy map infographic. Bathed in the reflective tones of blue, the clarity of white, and the insightful hints of yellow, our template offers a deep dive into understanding and capturing user experiences. Equipped with purpose-driven infographics, intuitive icons, and relevant image placeholders, it visualizes the nuances of empathy in a tangible manner. Meticulously tailored for Powerpoint, Keynote, or Google Slides. An invaluable tool for UX designers, psychologists, researchers, or any professional keen on enhancing user experiences. Delve deeper; let every slide amplify understanding.


5 slides
Risk Mitigation Strategies
Visualize your risk response plan with this layered diagram that highlights five strategic levels of mitigation. Each tier features bold directional arrows guiding the viewer from risk source to solution, perfect for decision-makers, auditors, or risk managers. Fully editable and easy to adapt to any industry. Compatible with PowerPoint, Keynote, and Google Slides.


7 slides
Customer Journey Analytics Infographic
Our Customer Journey Analytics infographic is a strategic asset for Powerpoint, Keynote, and Google Slides, crafted to assist marketers, UX designers, and customer experience strategists. This infographic is designed to depict the stages a customer goes through, from initial contact to final purchase, providing valuable insights into consumer behavior. The Customer Journey Analytics infographic captures the essence of the customer's experience with vibrant visuals that map out each touchpoint. It's an efficient way to communicate complex analytics data, ensuring your audience can visualize and understand customer interactions and preferences. This tool is perfect for presenting detailed analyses, highlighting areas for improvement, and showcasing how different stages of the journey are interconnected. By incorporating this infographic into your presentations, you can effectively narrate the story of your customer's path, backed by data-driven insights. It's an excellent way to illustrate the impact of various customer journey touchpoints on overall satisfaction and loyalty. Utilize this infographic to foster a customer-centric approach in your business strategies and to guide enhancements in the customer experience.


5 slides
Employee Training Needs Skills Gap Presentation
Optimize Workforce Training with a Skills Gap Analysis! The Employee Training Needs Skills Gap template helps HR teams, trainers, and managers visualize skill gaps, assess employee competencies, and align training programs with business goals. Featuring an interactive dot matrix layout, this template enables clear comparisons across skill areas, ensuring targeted and efficient upskilling strategies. Fully customizable in PowerPoint, Keynote, and Google Slides, it streamlines workforce development planning for maximum impact and growth.


5 slides
Insurance Policy Structure Presentation
Add a touch of creativity to your financial reports with this clean and modern presentation design. Perfect for explaining coverage breakdowns, risk management strategies, or policy frameworks, it simplifies complex ideas through visuals. Fully editable and compatible with PowerPoint, Keynote, and Google Slides for a seamless presentation experience.