


Features
- 5 Unique slides
- Fully editable and easy to edit in Microsoft Powerpoint, Keynote and Google Slides
- 16:9 widescreen layout
- Clean and professional designs
- Export to JPG, PDF or send by email


Do you have any questions?
Recommend


5 slides
Harvey Ball Rating System Overview Presentation
Visualize performance ratings or feature comparisons with the Harvey Ball Rating System Overview Presentation. This template uses vertical bar visuals combined with Harvey ball icons to communicate progress, satisfaction, or status across four key areas. Clean, intuitive, and ideal for executive summaries or status dashboards. Fully editable and compatible with PowerPoint, Keynote, and Google Slides.


5 slides
Organizational Structure Framework
Visualize your company hierarchy with this tiered pyramid diagram. This presentation framework is designed to outline roles and responsibilities across four structured levels, using labels A to D for clear communication. Each section includes iconography and editable text blocks, perfect for leadership, operations, or team management slides. Fully compatible with PowerPoint, Keynote, and Google Slides.


4 slides
3-Circle Venn Diagram Presentation
Visualize overlap and connection with clarity using the 3-Circle Venn Diagram Presentation. This minimalist slide is ideal for showing relationships between three ideas, strategies, or data sets. Each circle is color-coded for distinction, and intersections highlight shared elements. Perfect for business models, marketing segments, or product comparisons. Fully editable in PowerPoint, Keynote, and Google Slides.


5 slides
Law and Criminal Justice Infographics
Law and Criminal Justice are two interconnected fields that encompass the study, enforcement, and administration of laws and regulations within a society. These vertical infographic templates provide an overview of key concepts, statistics, and information related to the field of law and criminal justice. It is designed to educate and inform the audience about various aspects of the legal system and the criminal justice process. These infographics will allow you to provide a comprehensive overview of the law and criminal justice system. Easily customizable and compatible with Powerpoint, Keynote, and Google Slides.


3 slides
Comprehensive Business Roadmap Strategy Presentation
Plan ahead with confidence using the Comprehensive Business Roadmap Strategy Presentation. This timeline-based slide is perfect for mapping out multi-quarter goals, initiatives, or project phases. Use the horizontal arrows to show overlapping tasks and strategic priorities by quarter. Ideal for project managers, team leads, and business strategists. Fully editable in PowerPoint, Keynote, Google Slides, and Canva.


5 slides
Key Business Benefits and Value
Present your organization’s core strengths using this 4-part value diagram. Ideal for outlining benefits, service pillars, or strategic goals, the slide features directional arrows with matching icons for clarity and structure. Easy to customize in PowerPoint, Keynote, and Google Slides—adjust text, icons, and colors to align with your business branding.


26 slides
Wave Brand Identity Presentation
Take your brand's identity to the next level with the Wave Brand Identity Presentation template! Designed to capture the essence of your brand in a visually striking and comprehensive format, this template is perfect for showcasing your brand's vision, values, and personality. It includes sections for brand vision and mission, core values, target audience, and brand positioning, ensuring that every aspect of your brand identity is clearly communicated. The sleek design elements and modern layout make it easy to present your brand's unique selling proposition (USP) and key differentiators, helping you to build a strong, cohesive brand story. Ideal for brand strategists, marketing teams, and creative professionals, this template is fully customizable and works seamlessly with PowerPoint, Keynote, and Google Slides. Bring your brand's story to life and leave a lasting impression with the Wave Brand Identity template!


7 slides
Creative Tables Of Content Infographic
A creative table of contents is a visually appealing and innovative way of presenting the structure and contents of a document, report, book, or any written work. Our infographic template is an aesthetically pleasing and insightful map to your content landscape. This infographic is not just a guide; it's a visually engaging journey through your ideas and topics, promising a delightful and organized user experience. Fully customizable and compatible with Powerpoint, Keynote, and Google Slides. This creative table of contents uses design elements, colors, typography, and graphics to make it engaging and eye-catching.


22 slides
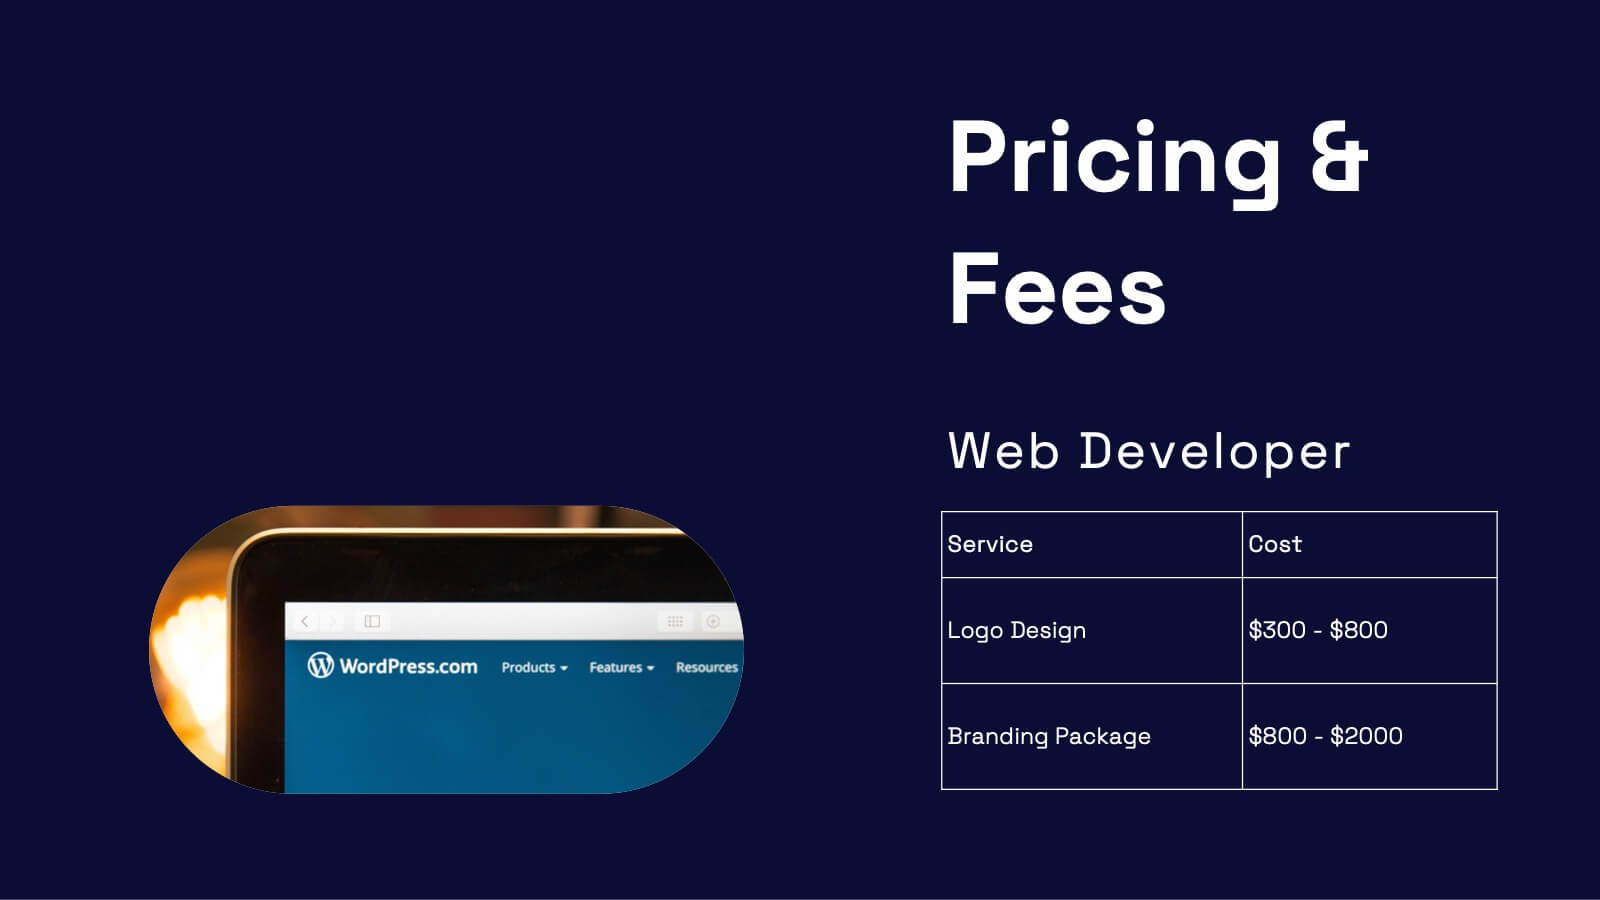
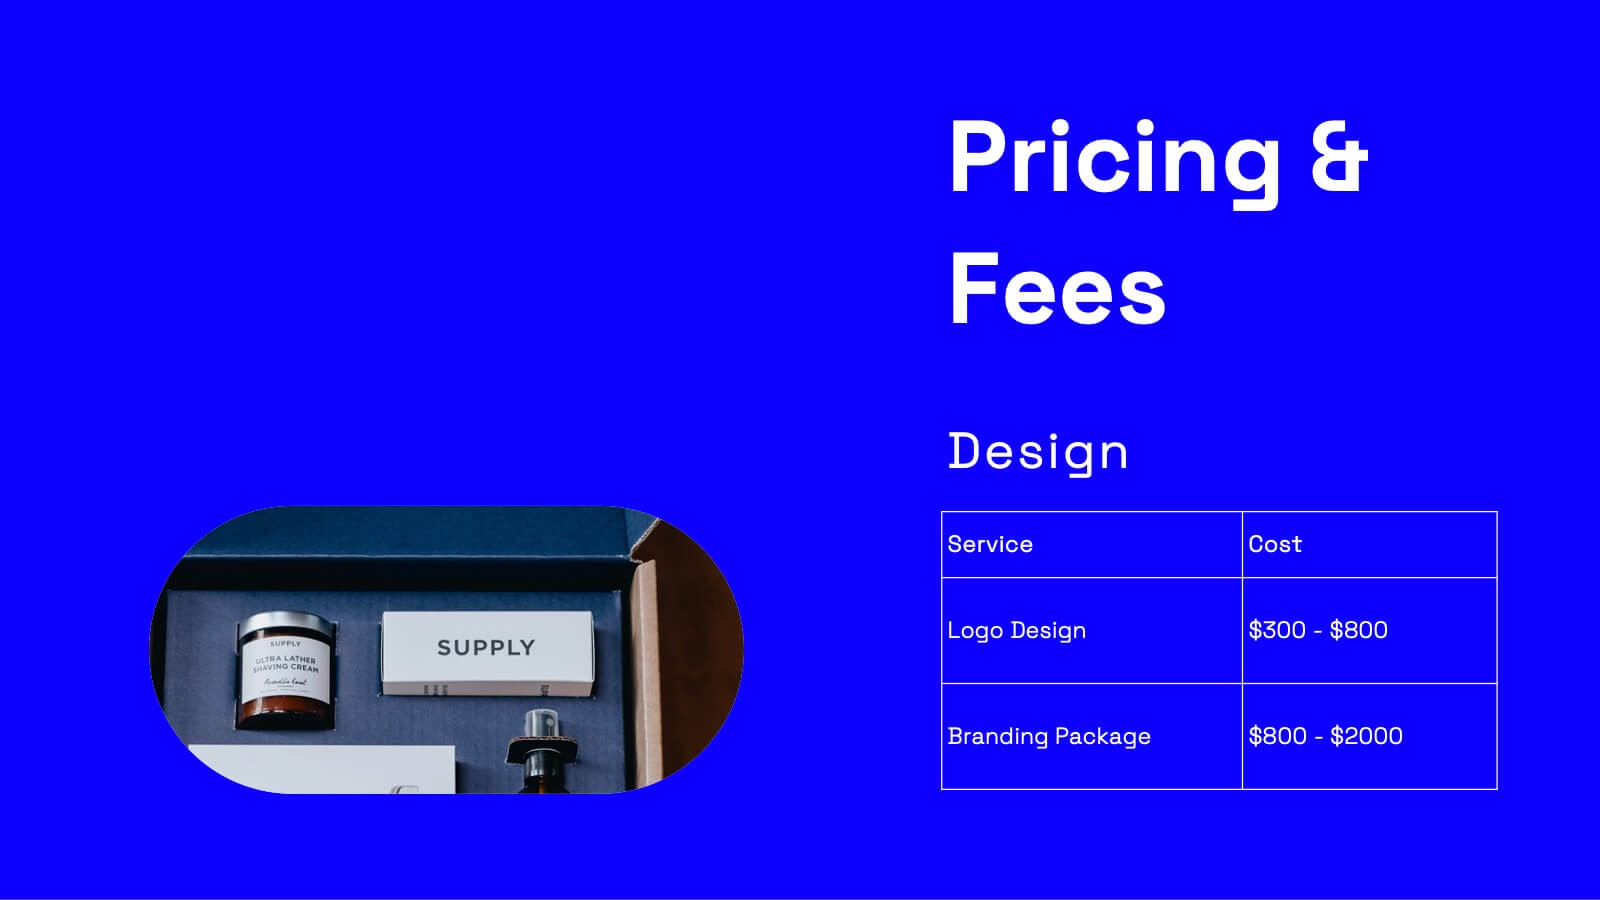
Wanderer Professional Portfolio Showcase Presentation
Showcase your creative work with this sleek, modern portfolio template. Perfect for highlighting your projects, philosophy, and client testimonials, it features a professional design with a dynamic layout. Display your awards, services offered, and pricing clearly to impress potential clients. Compatible with PowerPoint, Keynote, and Google Slides, it ensures seamless presentations on any platform.


5 slides
Business SWOT Evaluation Framework Presentation
Deliver clear strategic analysis with the Business SWOT Evaluation Framework Presentation. This layout features a modern quadrant design that segments Strengths, Weaknesses, Opportunities, and Threats around a central focus, making your insights easy to digest. Fully editable in PowerPoint, Canva, and Google Slides—perfect for business planning and executive reporting.


5 slides
Vaccine Myths Infographic
Vaccine Myths are false or misleading claims about vaccines that can contribute to vaccine hesitancy and misinformation. These infographic templates are designed to debunk common misconceptions and myths surrounding vaccines. These visually appealing and informative templates are ideal for healthcare professionals, educators, and organizations aiming to promote accurate information about vaccines and combat vaccine hesitancy. These infographics aim to educate and empower individuals to make informed decisions about vaccination and contribute to public health efforts. Compatible with Powerpoint, Keynote, and Google Slides.


5 slides
Political Campaign Marketing Infographics
A political campaign is a strategic effort undertaken by individuals, political parties, or interest groups to influence public opinion and win the support of voters during elections or on specific policy issues. These vertical infographics are designed to assist political candidates, campaign managers, and political organizations in effectively conveying their messages and strategies to the public. This template is ideal for political campaigns seeking to engage voters, raise awareness about their platform, and showcase their marketing efforts. The template utilizes eye-catching infographics to present campaign statistics, polling data, and performance metrics.


12 slides
Business Event Planning Schedule Presentation
Optimize your event planning with the Business Event Planning Schedule template, which streamlines your organization efforts by providing a clear timeline from January to June. It's perfect for entering key business insights or data at various stages. Designed for adaptability, this template ensures your planning remains concise and relevant. Compatible with PowerPoint, Keynote, and Google Slides, it integrates effortlessly into your workflow.


6 slides
Geographic Asia Overview Template Presentation
Discover insights across Asia with a clean, professional layout that brings your regional data to life. Perfect for showcasing demographics, market distribution, or geographic highlights, this visual map design ensures clarity and impact in every slide. Fully compatible with PowerPoint, Keynote, and Google Slides for effortless editing and presentation.


6 slides
Aviation Safety and Efficiency Presentation
Take your audience to new heights with this modern aviation-themed infographic layout. Perfect for illustrating flight performance, safety systems, and operational improvements, it combines clarity with sleek visual flow to enhance understanding. Fully customizable and compatible with PowerPoint, Keynote, and Google Slides for effortless professional presentations.


7 slides
Project Summary Infographic
This collection of project summary slides is designed to streamline the presentation of project outcomes and statuses effectively. The slides feature a variety of layouts tailored to emphasize critical data and conclusions, making them an ideal choice for project managers and teams who need to report on progress and results. Each slide is crafted with a clear focus on visual hierarchy, which helps in directing the viewer's attention to the most important information. Use of bullet points, charts, and infographics enhances the viewer's understanding by breaking down complex data into easy-to-digest visuals. Color coding is effectively utilized to differentiate between themes or topics, which aids in quick comprehension. These slides are versatile enough to be used in various scenarios, such as end-of-project presentations, stakeholder updates, or team meetings. They provide a professional and polished way to showcase project achievements, timelines, and future steps. Overall, these summary slides are a valuable tool for anyone looking to present project information clearly and concisely, ensuring that key points are communicated effectively and are memorable.


10 slides
Stakeholder Analysis Matrix Presentation
Spark interest from the very first slide with a clean, engaging layout designed to simplify complex relationships. This presentation helps you outline stakeholder influence, priorities, and engagement levels in a clear, structured way that supports better project decisions. Fully compatible with PowerPoint, Keynote, and Google Slides.