


Features
- 6 Unique slides
- Fully editable and easy to edit in Microsoft Powerpoint, Keynote and Google Slides
- 16:9 widescreen layout
- Clean and professional designs
- Export to JPG, PDF or send by email


Do you have any questions?
Recommend


2 slides
Startup Company Illustrations
Ignite your startup spirit with our startup company illustrations pack! These are an exhilarating collection of visuals designed to infuse your presentations with the electrifying energy of new beginnings and innovation. Fully compatible with Powerpoint, Keynote, and Google Slides. Get ready to turbocharge your designs with the infectious excitement of startup culture. Infuse your designs with the boundless possibilities of the startup universe—download our startup company illustrations pack today!


6 slides
Problem Statement Infographic
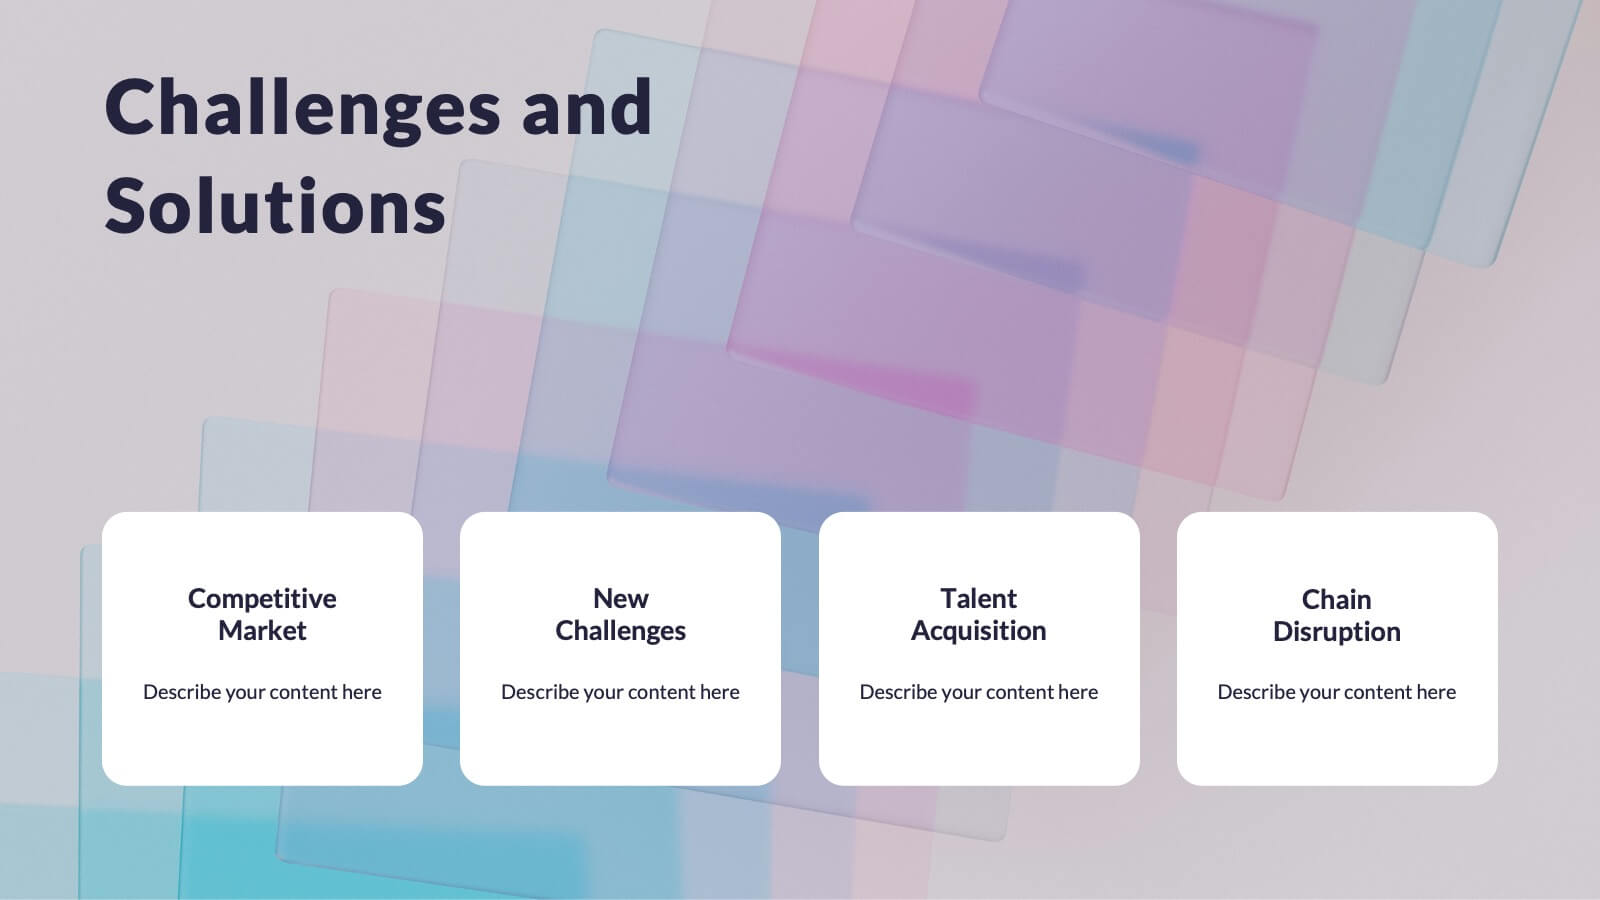
Unleash the potential of your strategic presentations with our Infographic Templates, specifically designed to clarify and emphasize core challenges within any project or discussion. This collection features a versatile array of templates, from minimalistic single-point layouts to more detailed multi-section designs. Each template is crafted to help you articulate critical issues effectively, ensuring your audience grasps the essence of the discussion quickly. Customization is a breeze with options to adjust colors, fonts, and text, allowing you to align each slide with your corporate identity seamlessly. Ideal for use in PowerPoint, Google Slides, and Keynote, these templates are perfect for consultants, project managers, and business strategists looking to present problem statements in a clear, impactful manner. Equip yourself with these tools to drive understanding and foster problem-solving discussions in any professional setting.
22 slides
Beacon Product Development Plan Presentation
Develop your product strategy with this dynamic template! Perfect for highlighting company overview, product features, and market analysis. Showcase your target market, unique selling proposition, and competitive analysis with ease. Ideal for product demonstrations and sales strategy discussions. Compatible with PowerPoint, Keynote, and Google Slides. Impress your audience and elevate your product development presentations!


5 slides
Financial Investment Portfolio Presentation
Visualize portfolio distribution like never before. This presentation features glass dome-protected coin stacks to represent diverse asset categories, risk levels, or growth stages. Ideal for financial advisors, investors, or business analysts presenting asset management plans. Fully editable in PowerPoint, Keynote, and Google Slides.


6 slides
Execution Phase and Follow-up Steps Presentation
Make your process crystal clear with the Execution Phase and Follow-up Steps Presentation. Featuring a dynamic six-step linked chain design, this template is ideal for showcasing sequential workflows, project lifecycles, or task dependencies. Each step is color-coded with icons to enhance clarity and engagement. Fully customizable in PowerPoint, Keynote, and Google Slides.


22 slides
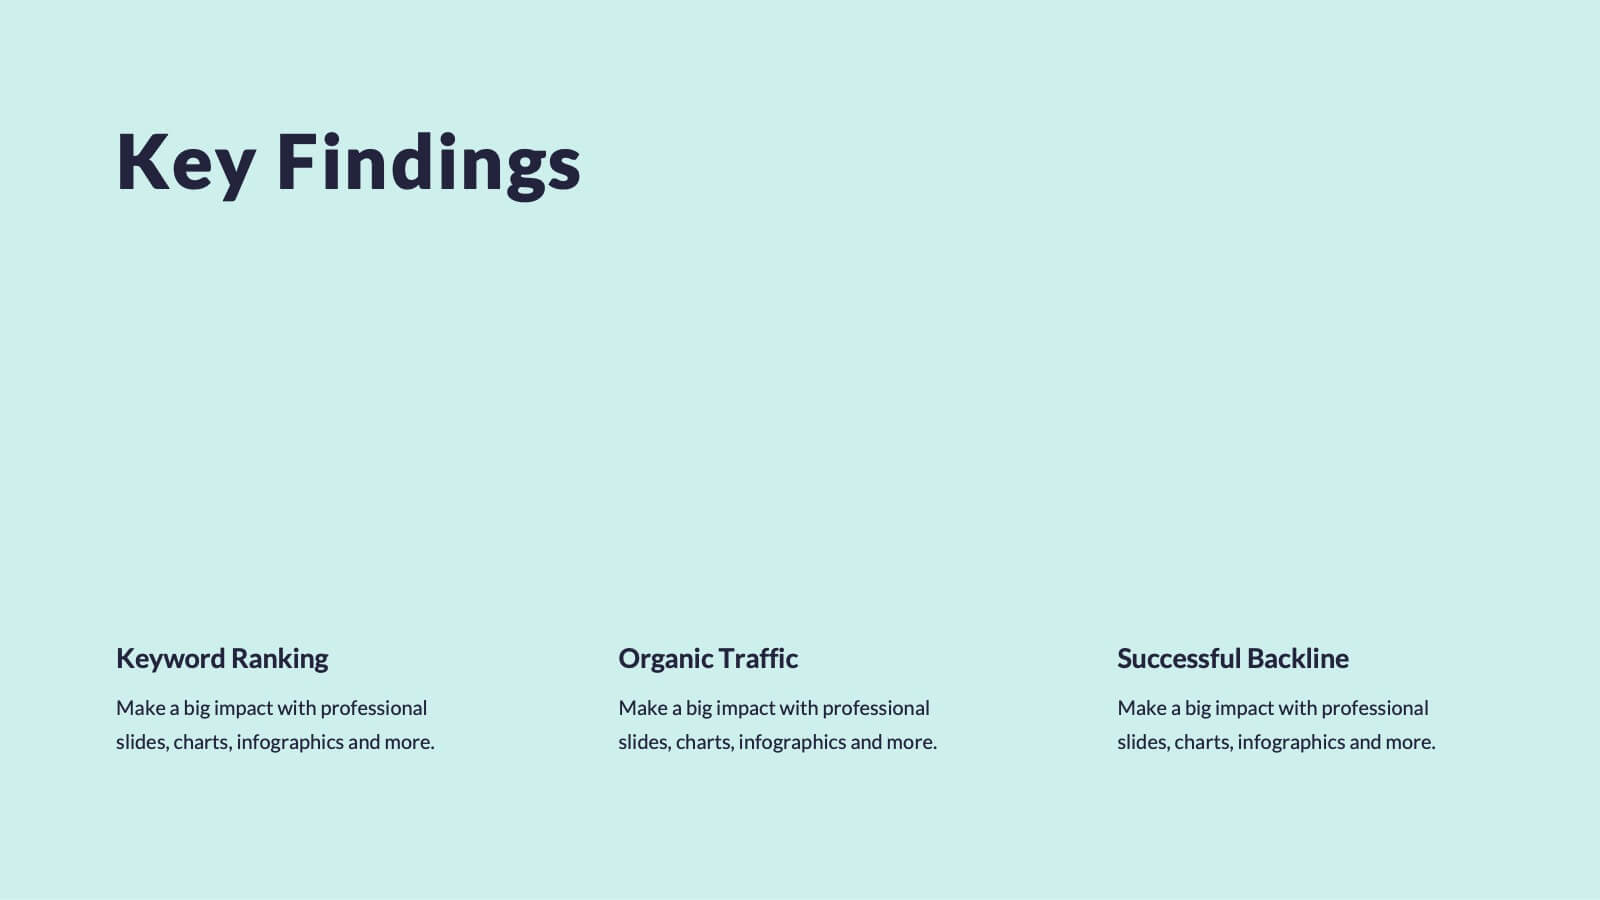
Quantum Research Findings Report Presentation
Discover insights like never before with this vibrant presentation template! Perfect for showcasing research findings, it includes slides for key findings, performance metrics, and market trends. Clearly present data and engage your audience with visually appealing graphics. Compatible with PowerPoint, Keynote, and Google Slides, making it easy to use on any platform.


15 slides
Business Roadmap Infographic
A business roadmap is a strategic plan that outlines the goals, milestones, and key initiatives a company intends to achieve over a specific period. This infographic template is designed to showcase the strategic journey and future goals of a business or organization. This infographic presents a clear and concise overview of the business's roadmap, highlighting key milestones, objectives, and action plans for achieving success. The infographic features a horizontal timeline that represents the business's journey from its inception to the envisioned future milestones. Each milestone is accompanied by a brief description or icon to provide context.


4 slides
Effective Team Management Presentation
Present your management insights with clarity using this puzzle-style Effective Team Management template. Ideal for breaking down leadership functions, collaboration elements, or role responsibilities across four segments. The modular puzzle format adds a creative visual touch while staying professional. Fully editable in PowerPoint, Keynote, and Google Slides.


4 slides
Artistic Watercolor Background Presentation
Add a creative flair to your slides with this Artistic Watercolor Background template. Featuring soft gradients and fluid brushstroke visuals, it's perfect for showcasing concepts in a stylish, modern way. Fully editable in PowerPoint, Keynote, and Google Slides—ideal for design-driven pitches, personal projects, or creative business storytelling.


26 slides
Financial Literacy Simple Presentation
Our "Financial Literacy" template is a must-have for anyone teaching money management, savings, and investment strategies. Compatible with PowerPoint, Keynote, and Google Slides, it makes financial education accessible and engaging. Introduce the basics with "Financial Literacy: Creating a Smarter Tomorrow" and outline your agenda with the "Table of Contents." The "Meet Our Team" slide can spotlight your financial experts, and the "Three Option Slide" breaks down key concepts like budgeting, saving, and investing. The "This is your big image slide" can visualize financial goals, while "Earn, Save, Invest, Protect." reinforces sound financial habits. Use "This is your Chart Slide" to present data on spending patterns and "Brain Infographic" to explore the psychology of spending. The template's clean design and customizable features make it easy to tailor your financial literacy presentation to any audience, ensuring that your message on smart money management is clear and impactful.


7 slides
Leadership Qualities Infographic
Strengthen your leadership presentations with our Leadership Qualities infographic, fully compatible with Powerpoint, Keynote, and Google Slides. This infographic is meticulously designed for trainers, coaches, and management professionals keen on illustrating the core attributes that define effective leadership. Our Leadership Qualities infographic provides a vivid portrayal of essential leadership traits, from communication and decision-making to empathy and resilience. It's an excellent resource for workshops, seminars, and courses focused on leadership development. The visual elements are crafted to highlight the contrasts between various leadership styles and the impacts of different leadership behaviors on team dynamics. By using this infographic, you'll be able to foster a deeper understanding of what makes a great leader in the eyes of their team and organization. It's a powerful visual aid that can help initiate discussions on personal development and team-building strategies. Incorporate it into your educational materials to underscore the value of strong leadership in achieving organizational success.


7 slides
Agile Methodology Strategy Infographic
Master the dynamics of Agile with our agile methodology infographic. Set against a crisp white foundation, the design cascades with the professionalism of blue, the urgency of red, the innovation of orange, and the growth of green. Equipped with methodical infographics, pertinent icons, and versatile image placeholders, this template provides a comprehensive depiction of the Agile process, from sprint planning to retrospectives. Tailored impeccably for Powerpoint, Keynote, or Google Slides. A must-have for project managers, scrum masters, product owners, or any Agile enthusiasts aiming to educate, implement, or iterate the Agile way.


4 slides
School Administration and Curriculum Planning Presentation
Streamline academic operations with the School Administration and Curriculum Planning Diagram. This structured template helps educators, administrators, and school leaders effectively visualize curriculum structures, plan schedules, and organize school management tasks. Designed for clarity and efficiency, it ensures a seamless planning experience for any educational institution. Fully customizable and compatible with PowerPoint, Keynote, and Google Slides.


8 slides
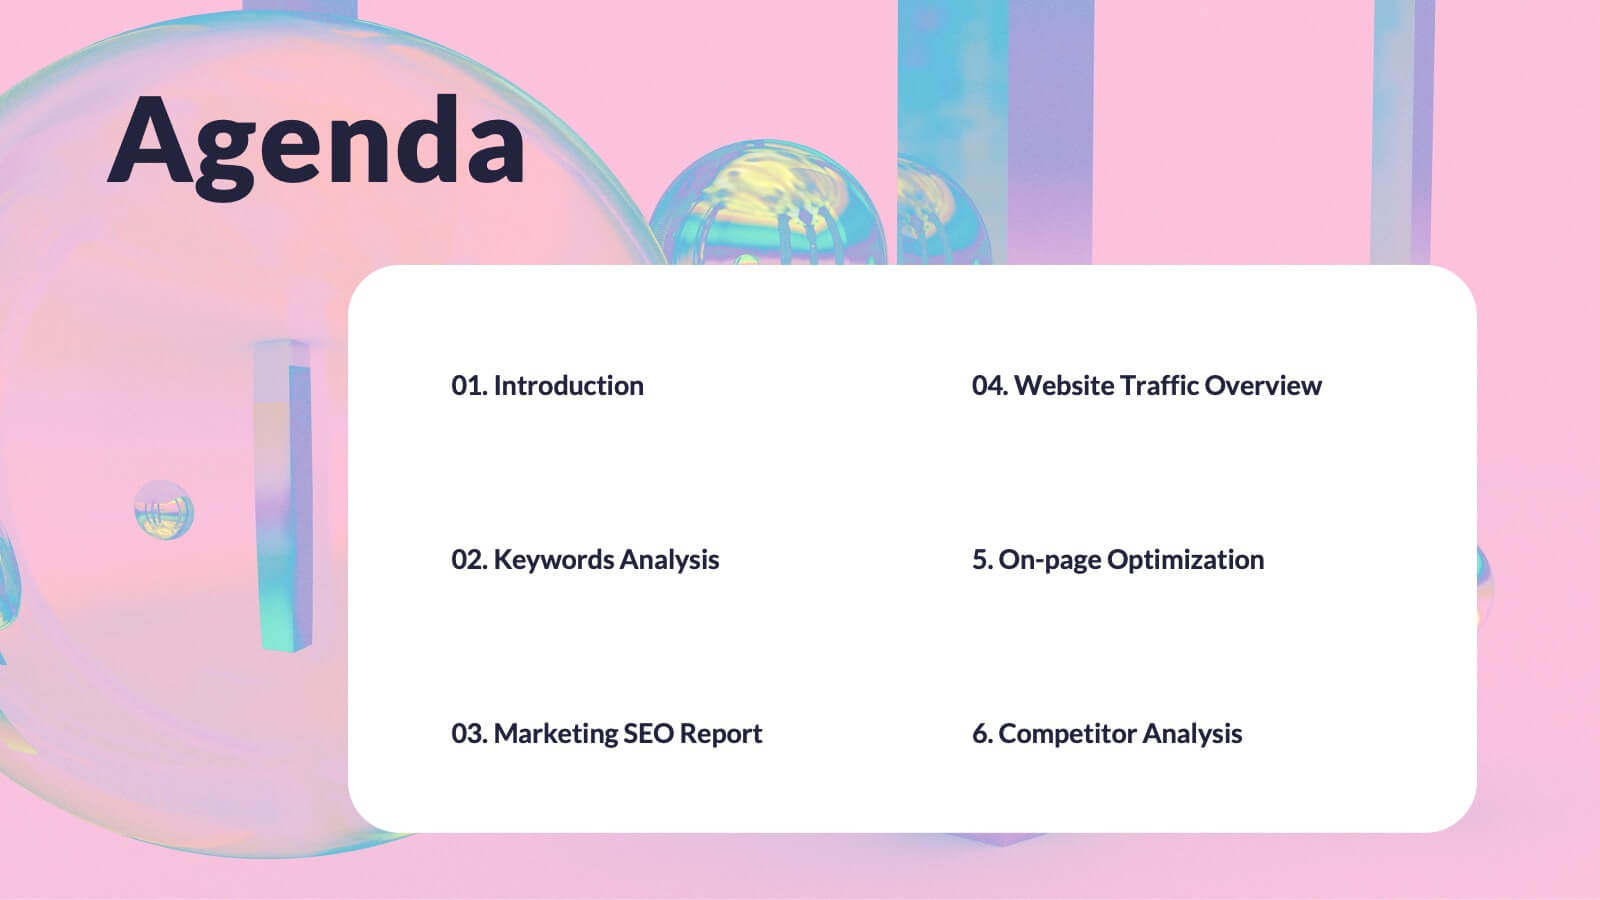
Meeting Agenda Presentation
Streamline your meeting agendas with our "Meeting Agenda Presentation" template. This design features a central node linked to four key points, each representing a separate agenda item, ensuring a clear and organized discussion flow. Color-coded segments aid in visually distinguishing between topics, making it easy for participants to follow and engage. Ideal for team meetings, project updates, and strategic discussions, this template enhances communication and efficiency. Its intuitive layout keeps your sessions on track and productive. Compatible with PowerPoint, Keynote, and Google Slides, it's an essential tool for any professional aiming to optimize their meeting presentations.


20 slides
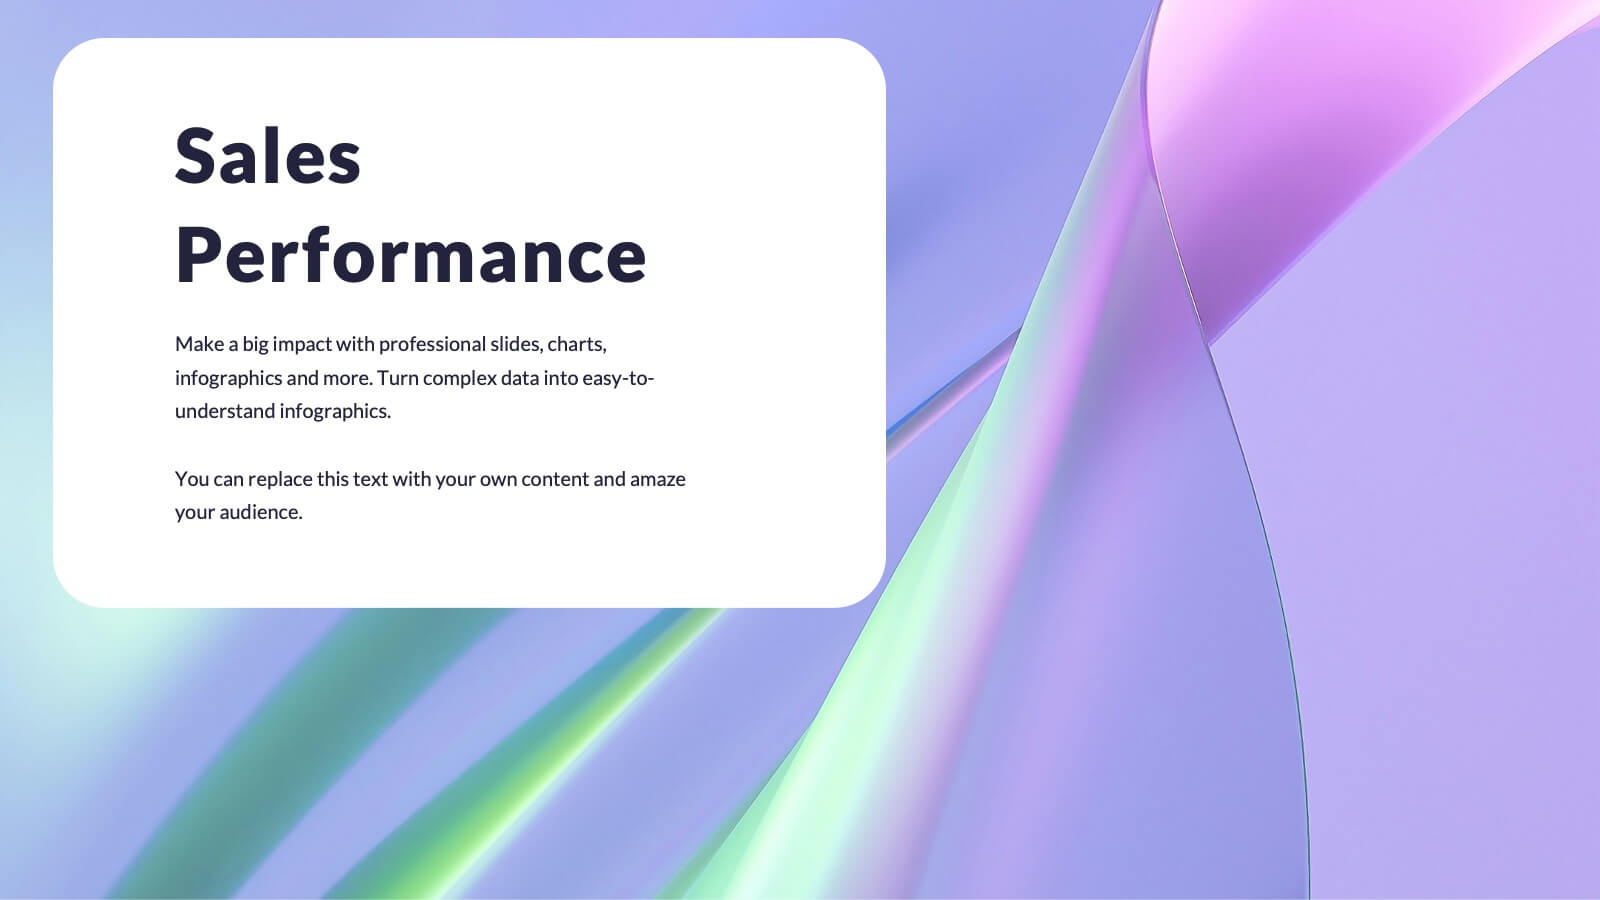
Obscuran Sales Performance Report Presentation
Take your sales analysis to the next level with this sleek and professional presentation template. Designed to highlight key areas such as sales objectives, process, performance metrics, competitive analysis, pricing strategy, and future opportunities. This modern layout ensures clarity and impact, making it perfect for sales teams, managers, and stakeholders. Fully customizable and compatible with PowerPoint, Keynote, and Google Slides.


26 slides
Thadd Presentation Template
Thadd presents your business in a professional light. The bold fonts and colors make for a clean, professional aesthetic that won't distract from your message. It features a strong horizontal identity that instantly communicates your brand. Charts, timelines and easy to edit text give this template an edge over the competition. It comes with easy to edit text and images, making changing content a breeze. It makes for a great business tool for companies who want to get their message across without wasting time on graphics and design. Invest in your future and download this template today.


20 slides
Elysium Product Launch Presentation
Launch your new skincare product with this stylish presentation template. Highlight key features, target market, pain points, and unique selling propositions. Perfect for marketing strategies and production processes. Fully compatible with PowerPoint, Keynote, and Google Slides.